the economic benefits of more fully utilizing advanced practice
TRANSCRIPT
THE PERRYMAN GROUP
510 N. Valley Mills Dr., Suite 300
Waco, TX 76710
ph. 254.751.9595, fax 254.751.7855
www.perrymangroup.com
The Economic Benefits of More Fully Utilizing Advanced Practice Registered Nurses in the Provision of Health Care in Texas: An Analysis of Local and Statewide Effects on
Business Activity
May 2012

perrymangroup.com i © 2012 by The Perryman Group
Table of Contents
INTRODUCTION ...................................................................................... 2
Highlights of Study Findings .................................................................................... 4
The Perryman Group’s Perspective .......................................................................... 5
ADVANCED PRACTICE REGISTERED NURSES AND THE
PROVISION OF HEALTH CARE ........................................................... 7
ECONOMIC BENEFITS OF MORE FULLY UTILIZING
ADVANCED PRACTICE REGISTERED NURSES ............................ 11
Current Economic Benefits .....................................................................................15
Benefits as of 2020 ....................................................................................................21
Benefits in 2030 and 2040 .........................................................................................26
Summary of Economic Benefits of Utilizing Advanced Practice Registered
Nurses More Efficiently: 2011-2040 .........................................................................28
CONCLUSION .......................................................................................... 31
APPENDICES ............................................................................................ 33
APPENDIX A: Methods Used ................................................................................34
Texas Econometric Model ....................................................................................................... 38
APPENDIX B: Detailed Sectoral Results ..............................................................44
Economic Benefits as of 2011 ................................................................................................... 45 Economic Benefits as of 2020 ................................................................................................... 57 Economic Benefits as of 2030 ................................................................................................... 69
Economic Benefits as of 2040 ................................................................................................... 81
APPENDIX C: Detailed Forecast Results .............................................................93

perrymangroup.com 2 © 2012 by The Perryman Group
INTRODUCTION
perrymangroup.com 3 © 2012 by The Perryman Group
INTRODUCTION
The rising cost of health care is a concern for individuals,
families, businesses, government entities, and society as a whole.
According to data maintained by the Centers for Medicare &
Medicaid Services, in 2009, total health expenditures reached $2.5
trillion or some $8,086 per person. Health expenditures have also
risen substantially as a percent of US gross domestic product, from
about 12.5% in 1990 to 13.8% in 2000 to 17.6% in 2009.
These expenses are borne by patients and their families through out-
of-pocket expenses, which have risen substantially over time.
Health insurance companies are also affected, with expenditures
notably higher in recent years. In addition, outlays by Medicare and
Medicaid are up dramatically, placing a strain on tight federal and
state budgets. As the population ages and access becomes more
broadly available, the problem of the high cost of medical care
and treatment will become increasingly difficult.
Patient outcomes are, of course, of paramount importance.
However, finding ways to increase efficiency without
compromising the quality of care is crucial. Moreover, many
actions which reduce costs, such as reducing the need for hospital
stays, also improve the health and well-being of patients. One
proven strategy for both improving patient care and reducing
costs is greater utilization of Advanced Practice Registered
Nurses (APRNs) including nurse practitioners, certified
registered nurse anesthetists, certified nurse midwives, and
clinical nurse specialists.
perrymangroup.com 4 © 2012 by The Perryman Group
The Perryman Group performed an assessment of the potential
economic benefits associated with more fully utilizing Advanced
Practice Registered Nurses in the provision of health care in Texas.
This report presents the findings from TPG’s analysis.
Highlights of Study Findings
A number of empirical studies support the conclusion that
greater utilization of Advanced Practice Registered Nurses can
both improve patient outcomes and reduce overall health care
costs. In addition, many areas are facing shortages of primary care
physicians; APRNs can help alleviate these problems.
When Advanced Practice Registered Nurses are utilized within the
systems of health care provision more efficiently, the economic
benefits to the state are substantial. The Perryman Group estimates
that the total current impact of enhanced efficiency includes
$16.1 billion in total expenditures and $8.0 billion in output
(gross product) each year as well as 97,205 permanent jobs in
Texas.
This economic activity also leads to additional tax receipts; The
Perryman Group estimates these effects include $483.9 million to
the State and $233.2 million to local government entities each
year.
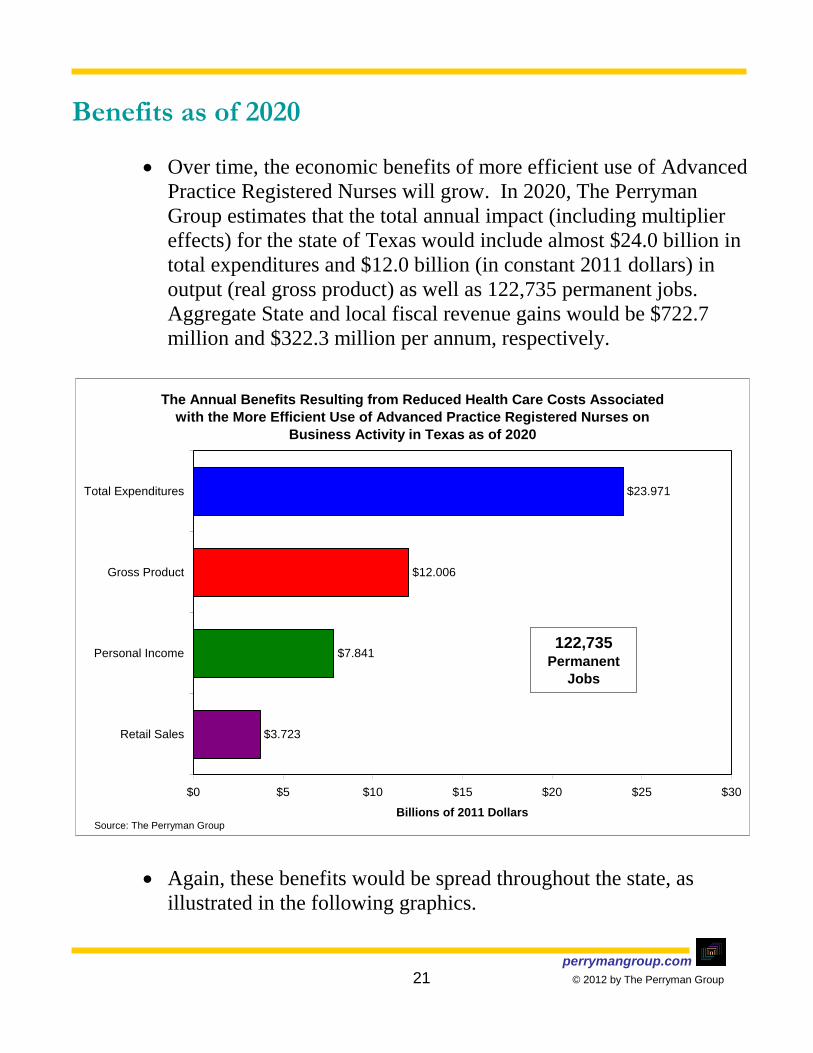
Over time, the economic benefits of more efficient use of Advanced
Practice Registered Nurses will grow. In 2020, The Perryman
Group estimates that the total annual impact (including multiplier
effects) for the state of Texas would include almost $24.0 billion in
total expenditures and $12.0 billion (in constant 2011 dollars) in
output (real gross product) as well as 122,735 permanent jobs.
perrymangroup.com 5 © 2012 by The Perryman Group
Aggregate State and local fiscal revenue gains would be $722.7
million and $322.3 million per annum, respectively.
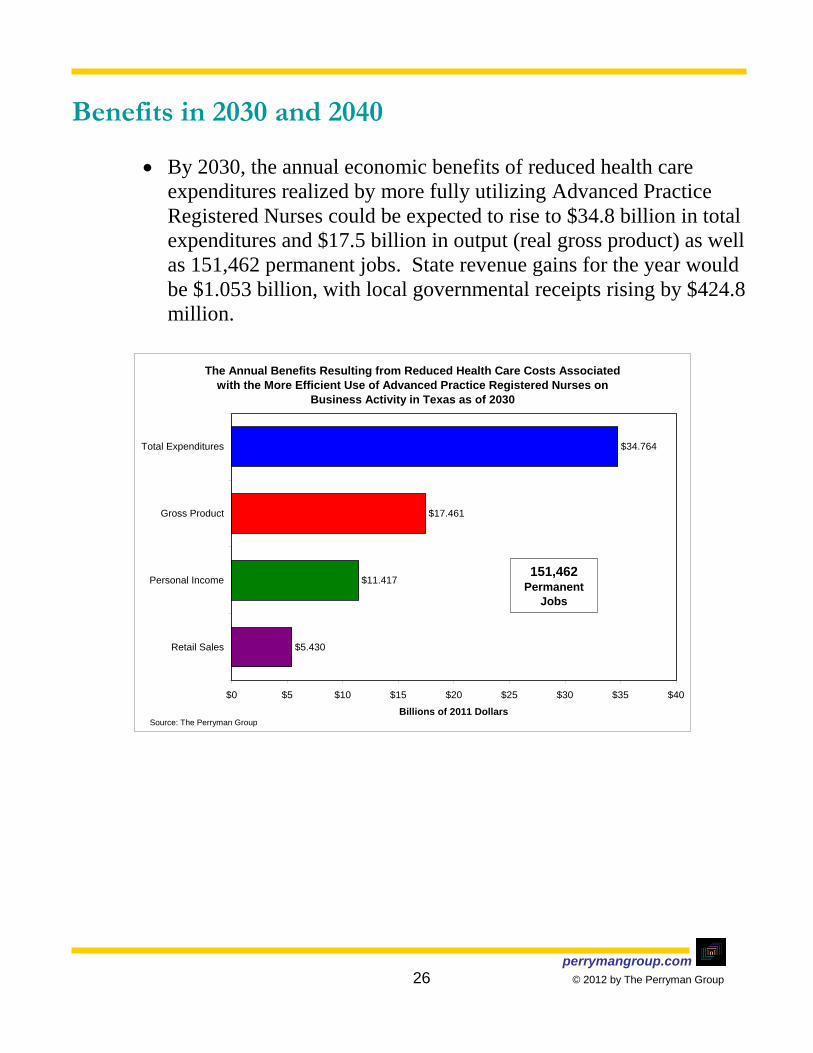
By 2030, the annual economic benefits of reduced health care
expenditures realized by more fully utilizing Advanced Practice
Registered Nurses could be expected to rise to $34.8 billion in total
expenditures and $17.5 billion in output (real gross product) as well
as 151,462 permanent jobs. State revenue gains for the year would
be $1.053 billion, with local governmental receipts rising by $424.8
million.
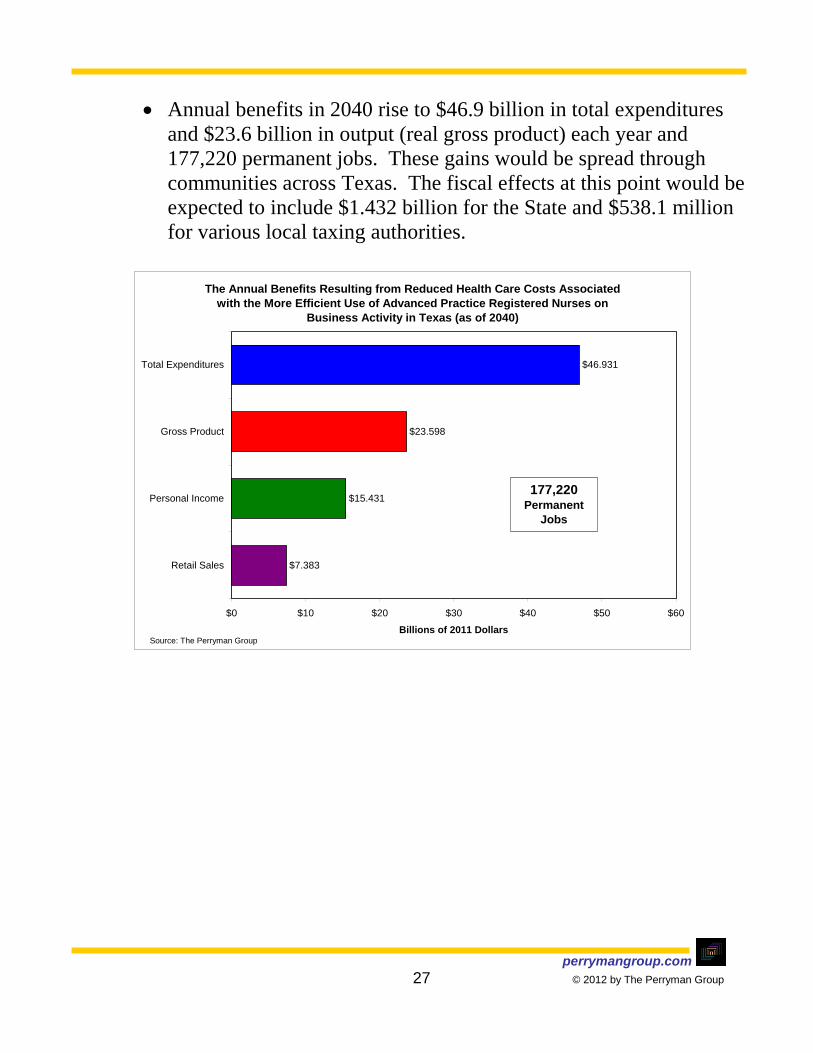
Annual benefits in 2040 rise to $46.9 billion in total expenditures
and $23.6 billion in output (real gross product) each year and
177,220 permanent jobs. These gains would be spread through
communities across Texas. The fiscal effects at this point would be
expected to include $1.432 billion for the State and $538.1 million
for various local taxing authorities.
Utilizing Advanced Practice Registered Nurses more efficiently in the system of health care provision can enhance patient care while reducing costs. These efficiencies generate substantial economic benefits
which permeate the entire state and facilitate a broader and more
effective health care delivery model.
The Perryman Group’s Perspective
TPG is an economic research and analysis firm based in Waco,
Texas. The firm has more than 30 years of experience in assessing
the economic impact of corporate expansions, regulatory changes,
real estate developments, public policy initiatives, and myriad other
factors affecting business activity. TPG has conducted hundreds of
impact analyses for the US and Texas economies as well as all
perrymangroup.com 6 © 2012 by The Perryman Group
Texas metro areas and regions. Impact studies have been performed
for hundreds of clients including many of the largest corporations in
the world, governmental entities at all levels, educational
institutions, major health care systems, utilities, and economic
development organizations.
TPG has extensively analyzed the health care sector, and the
proprietary models developed and maintained by the firm have been
used in the analysis of scores of major medical facilities.
Representative examples include the Methodist Hospital, Parkland,
University Health System, Menninger Clinic, Scott & White, M. D.
Anderson Cancer Center (including an assessment of its
contribution to improved outcomes and the resulting benefits), and
the University of Kansas Cancer Center (including an investigation
of the benefits of achieving the status of a Comprehensive Cancer
Center).
Other studies have focused more broadly on health care provision
and the impact of initiatives and policy changes. For instance, The
Perryman Group provides ongoing assessments of the impact of the
Cancer Prevention and Research Institute of Texas (CPRIT); these
analyses include the economic benefits of screening and research
funded by CPRIT; results have been used by the Texas legislature.
The firm has also completed extensive evaluations of the effects of
reductions in Medicaid and Children’s Health Insurance Program
(CHIP) funding on the overall economy. Other significant reports
quantified the net benefits of wellness and obesity initiatives. The
latter of these was recently published in the Journal of Medical
Economics.

perrymangroup.com 7 © 2012 by The Perryman Group
ADVANCED PRACTICE REGISTERED NURSES AND THE PROVISION OF
HEALTH CARE

perrymangroup.com 8 © 2012 by The Perryman Group
ADVANCED PRACTICE REGISTERED NURSES AND THE PROVISION OF
HEALTH CARE
A number of empirical studies support the conclusion that
greater utilization of Advanced Practice Registered Nurses can
both improve patient outcomes and reduce overall health care
costs. In addition, many areas are facing shortages of primary care
physicians; APRNs can help alleviate these problems.
Rising Health Care Costs
As noted, health care costs have been rising at a rapid rate. Outlays
have grown as a percent of total US economic output (gross
domestic product), reaching 17.6% in 2009 according to the Centers
for Medicare & Medicaid Services (CMS). The rate of cost increase
has far surpassed the overall inflation rate and shows little sign of
abating.
A December 2008 study by the McKinsey Global Institute of
McKinsey & Company noted that the United States spends more on
health care than other industrialized nations even when adjusting for
relative wealth. The study went on to note that this pattern occurs
despite the fact that the prevalence of many diseases is lower in the
United States than in other areas.1
1 “Accounting for the cost of US health care: A new look at why Americans spend more”; McKinsey Global Institute;
McKinsey&Company; December 2008.

perrymangroup.com 9 © 2012 by The Perryman Group
These rising costs are presenting affordability challenges and
prompting a need for reform in the delivery mechanism.
Potential Benefits of Expanding the Role of Advanced Practice Registered Nurses
For decades, Advanced Practice Registered Nurses have been
recognized as cost-effective providers of high-quality health
care. Whether working within a physician’s office, independently
in an on-site clinic such as for a large employer, or in a setting such
as a skilled care facility, APRNs can be a vital component of the
overall system of health care provision.
The cost to train Advanced Practice Registered Nurses is far less
than that involved for a physician. For many routine patient needs,
however, APRN training is often more than sufficient. At times,
access to an APRN can help patients deal with health issues before
they escalate, reducing the need for expensive treatments such as
hospital stays.
A recent article in Nursing Economic$ presented the results of a
review of 37 studies of patient outcomes and perceptions with care
by Advanced Practice Registered Nurses compared to situations
with physician care only. For all parameters examined in the
underlying studies (ranging from patient satisfaction to specific
measures of health and the need for treatment), the results were
found to be equivalent.2
2 “Advanced Practice Nurse Outcomes 1990-2008: A Systematic Review”; Nursing Economic$; September-October
2011.

perrymangroup.com 10 © 2012 by The Perryman Group
Despite the need to control health care costs and the demonstrated
effectiveness of Advanced Practice Registered Nurses, various
regulations limit their ability to practice to the full extent of their
training. While care by a physician is certainly necessary and
appropriate in many cases, there are many instances when efficiency
can be gained (without sacrificing patient outcomes) through
treatment by an APRN. This approach can also help extend the
delivery system to areas (such as rural communities) where health
resources are scarce or unavailable.
Regulatory changes which enhance the role of Advanced Practice
Registered Nurses within the state’s system of health care are in the
interest of all Texans. The economic benefits of more fully utilizing
APRNs are described in the following section.

perrymangroup.com 11 © 2012 by The Perryman Group
ECONOMIC BENEFITS OF MORE FULLY UTILIZING ADVANCED
PRACTICE REGISTERED NURSES
perrymangroup.com 12 © 2012 by The Perryman Group
ECONOMIC BENEFITS OF MORE FULLY UTILIZING ADVANCED
PRACTICE REGISTERED NURSES
Reducing the cost of medical care frees up scarce societal resources
to be spent in more productive ways. By more fully utilizing
Advanced Practice Registered Nurses in the provision of health
care, efficiencies can be realized which, in turn, lead to
substantial economic benefits.
Measuring Economic Impacts
As resources saved through more efficient health care provision are
spent for other purposes, like any economic activity, they generate
multiplier or ripple effects through the economy. The Perryman
Group developed a model some 30 years ago (with continual
updates and refinements since that time) to describe these
interactions. This dynamic input-output assessment model, known
as the US Multi-Regional Impact Assessment System (USMRIAS),
uses a variety of data (from surveys, industry information, and other
sources) to describe the various goods and services (known as
resources or inputs) required to produce another good/service. The
submodel used in the current analysis reflects the specific industrial
composition and characteristics of the Texas economy.
In this case, for example, patients and employers spend money they
would have previously used for health care in a number of ways,
resulting in incremental sales to a number of businesses. These
companies, in turn, purchase the items necessary to produce and

perrymangroup.com 13 © 2012 by The Perryman Group
provide the goods and services from other companies. In this way,
the effect of spending health care savings ripples out through a
variety of firms across a spectrum of industries.
In order to estimate the likely savings, The Perryman Group utilized
academic studies which quantified savings from the use of
Advanced Practice Registered Nurses on a conservative basis.3
These amounts were then subjected to an acuity adjustment to
account for the types of treatment which require the use of a
physician. They were further reduced to reflect the probable lack of
efficiency in implementing a broad utilization program. This
process suggested that a net savings of about 6.2% was attainable.
This amount was then allocated between employers and individuals
based on typical co-payment patterns. It was also apportioned
among delivery sites (such as hospitals, ambulatory care facilities,
and nursing homes) based on typical patterns for the relevant
treatment categories. The employer savings were allocated across
more than 500 industrial categories based on aggregate direct and
indirect health care spending as determined from the relevant
coefficients of the USMRIAS. The individual savings, after
adjustment for out-of-state- spending leakages and savings rates
within the affected demographic segments, was assumed to be spent
in accordance with the standard consumer patterns as determined by
the ACCRA Cost of Living Survey and the Consumer Expenditure
Survey of the US Department of Labor.
The results were also measured on a geographically disaggregated
basis to illustrate the effects across various segments of the state.
The direct values were estimated based on spending and output 3 See, for example, “An Alternative Approach to Reducing the Costs of Patient Care? A Controlled Trial of the Multi-
Disciplinary Doctor-Nurse Practitioner (MDNP) Model”; Ettner, Susan L. et al; Medical Decision Making, Jan-Feb 2006 and “Nurse Practitioner Cost-Effectiveness”; American Academy of Nurse Practitioners. Also “Demonstration of the Cost-Effectiveness of a Nurse Practitioner/Physician Team in Long-Term Care Facilities; HMO Practice; 1994 and “The Effect of a Multidisciplinary Hospitalist, Physician, and Advanced Practice Nurse Collaboration on Hospital Costs”; Cowan, M.J., et al; The Journal of Nursing Administration, 2006.

perrymangroup.com 14 © 2012 by The Perryman Group
levels in the relevant health care sectors. The USMRIAS is
structured to fully account for spillover effects across counties and
other geographic subdivisions.
Results were also provided for the current period (2011), as well as
projected findings for 2020, 2030, and 2040. This aspect of the
analysis serves to illustrate the increasing benefit of a more efficient
delivery model over time. The levels of direct activity in these
periods were derived from the current baseline forecast from the
Texas Econometric Model, which was developed by The Perryman
Group more than 30 years ago and has been consistently updated on
an ongoing basis. Results were fully adjusted for expected gains in
productivity over time.
Impacts are expressed in terms of several different indicators of
overall business activity.
o Total expenditures (or total spending) measures the dollars
changing hands in the state as a result of the economic
stimulus.
o Gross product (or output) is production of goods and services
that will come about in Texas as a result of the activity. This
measure is parallel to the gross domestic product numbers
commonly reported by various media outlets and is a subset of
total expenditures.
o Personal income is dollars that end up in the hands of people
in the area; the vast majority of this aggregate derives from the
earnings of employees, but payments such as interest and rents
are also included.
o Job gains are expressed as permanent jobs (in the case of an
ongoing impact such as this one) or person-years of
employment (for transitory effects such as construction).
All results are expressed on an annual basis in constant 2011 dollars
to adjust for the effects of overall inflation. Additional information
perrymangroup.com 15 © 2012 by The Perryman Group
regarding the methods used in this report may be found in Appendix
A.
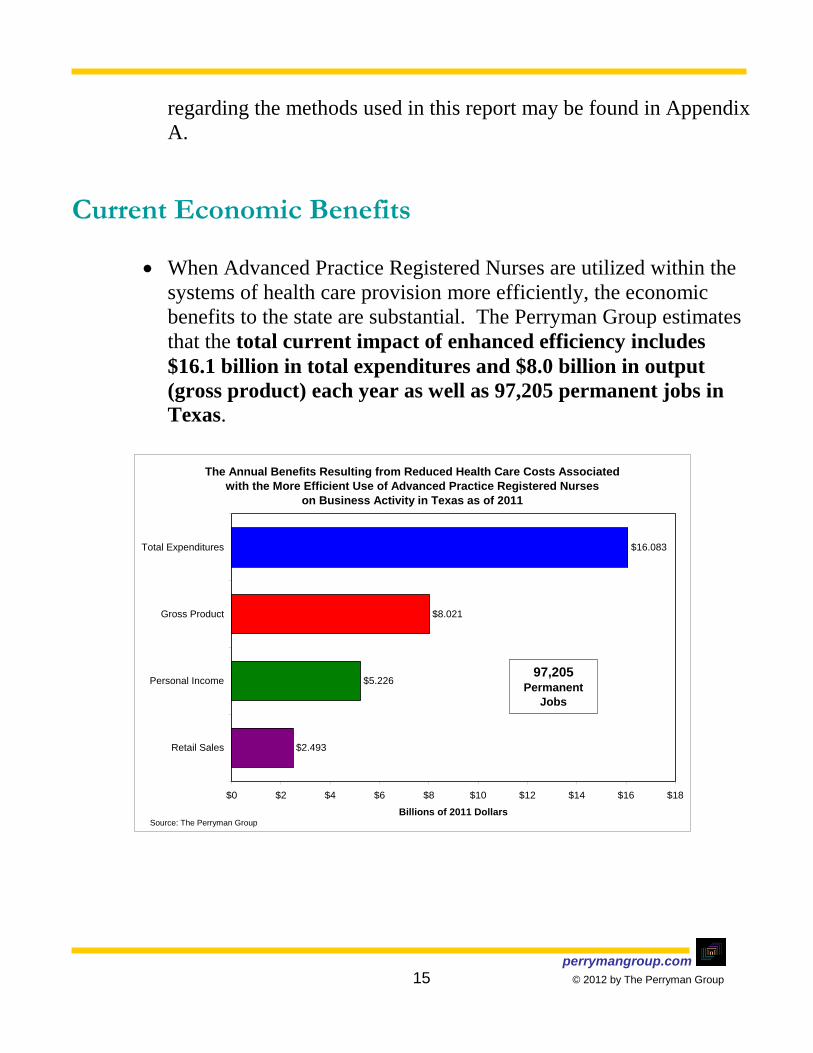
Current Economic Benefits
When Advanced Practice Registered Nurses are utilized within the
systems of health care provision more efficiently, the economic
benefits to the state are substantial. The Perryman Group estimates
that the total current impact of enhanced efficiency includes
$16.1 billion in total expenditures and $8.0 billion in output
(gross product) each year as well as 97,205 permanent jobs in
Texas.
The Annual Benefits Resulting from Reduced Health Care Costs Associated
with the More Efficient Use of Advanced Practice Registered Nurses
on Business Activity in Texas as of 2011
$2.493
$5.226
$8.021
$16.083
$0 $2 $4 $6 $8 $10 $12 $14 $16 $18
Retail Sales
Personal Income
Gross Product
Total Expenditures
Billions of 2011 Dollars
97,205Permanent
Jobs
Source: The Perryman Group

perrymangroup.com 16 © 2012 by The Perryman Group
This economic activity also leads to additional tax receipts; The
Perryman Group estimates these effects include $483.9 million to
the State and $233.2 million to local government entities each
year.
These benefits are would be felt in communities across the state as
illustrated in the following charts.
Results by county (as well as detailed sectoral effects) are included
in Appendix B of this report.

perrymangroup.com 17 © 2012 by The Perryman Group
Under a scenario utilizing Advanced Practice Registered Nurses
more efficiently the current economic benefits would include job
gains in both cities and more rural areas.
Benefits of Reduced Health Care Costs Associated with More Efficient Use of Advanced Practice Registered Nurses:
2011 Job Gains by Metropolitan Statistical Area
Source: The Perryman Group
perrymangroup.com 18 © 2012 by The Perryman Group
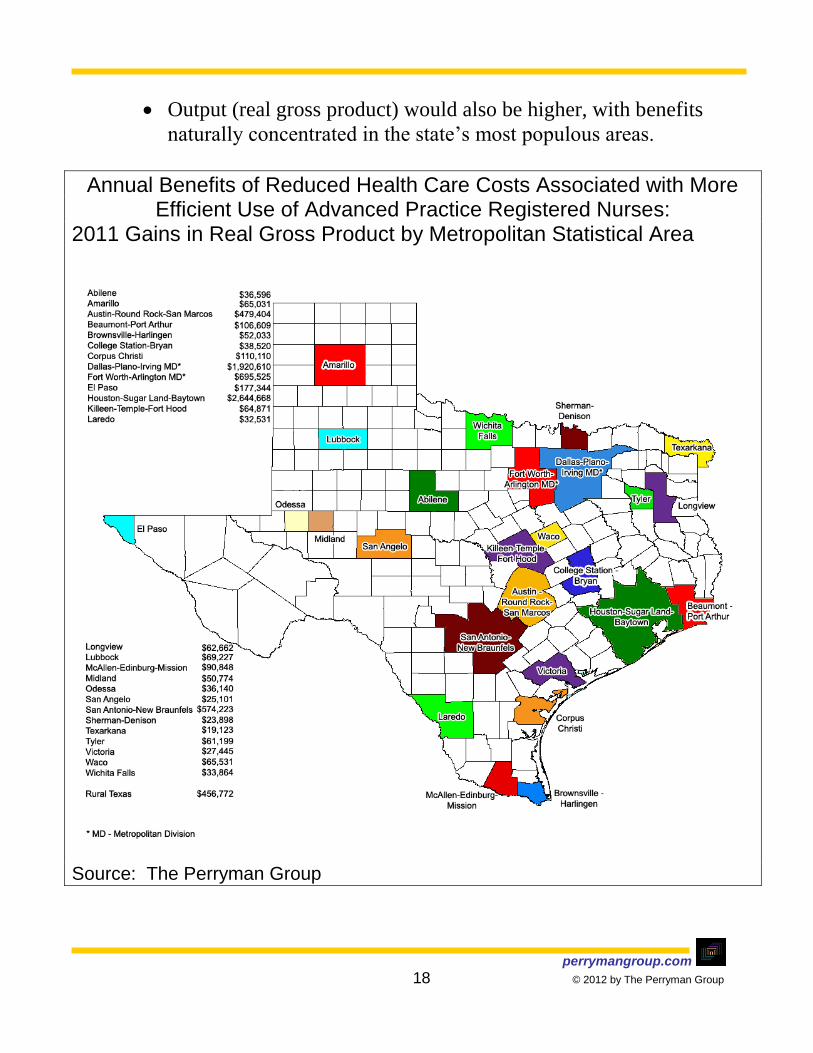
Output (real gross product) would also be higher, with benefits
naturally concentrated in the state’s most populous areas.
Annual Benefits of Reduced Health Care Costs Associated with More Efficient Use of Advanced Practice Registered Nurses:
2011 Gains in Real Gross Product by Metropolitan Statistical Area
Source: The Perryman Group
perrymangroup.com 19 © 2012 by The Perryman Group
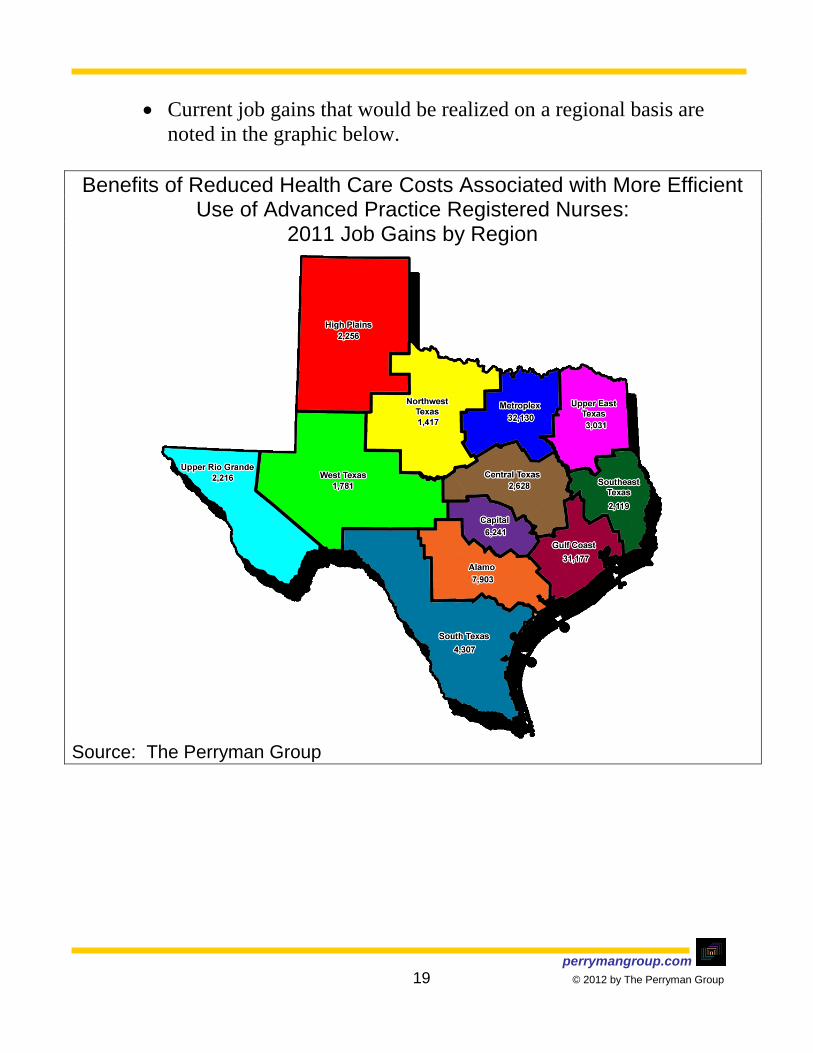
Current job gains that would be realized on a regional basis are
noted in the graphic below.
Benefits of Reduced Health Care Costs Associated with More Efficient Use of Advanced Practice Registered Nurses:
2011 Job Gains by Region
Source: The Perryman Group
perrymangroup.com 20 © 2012 by The Perryman Group
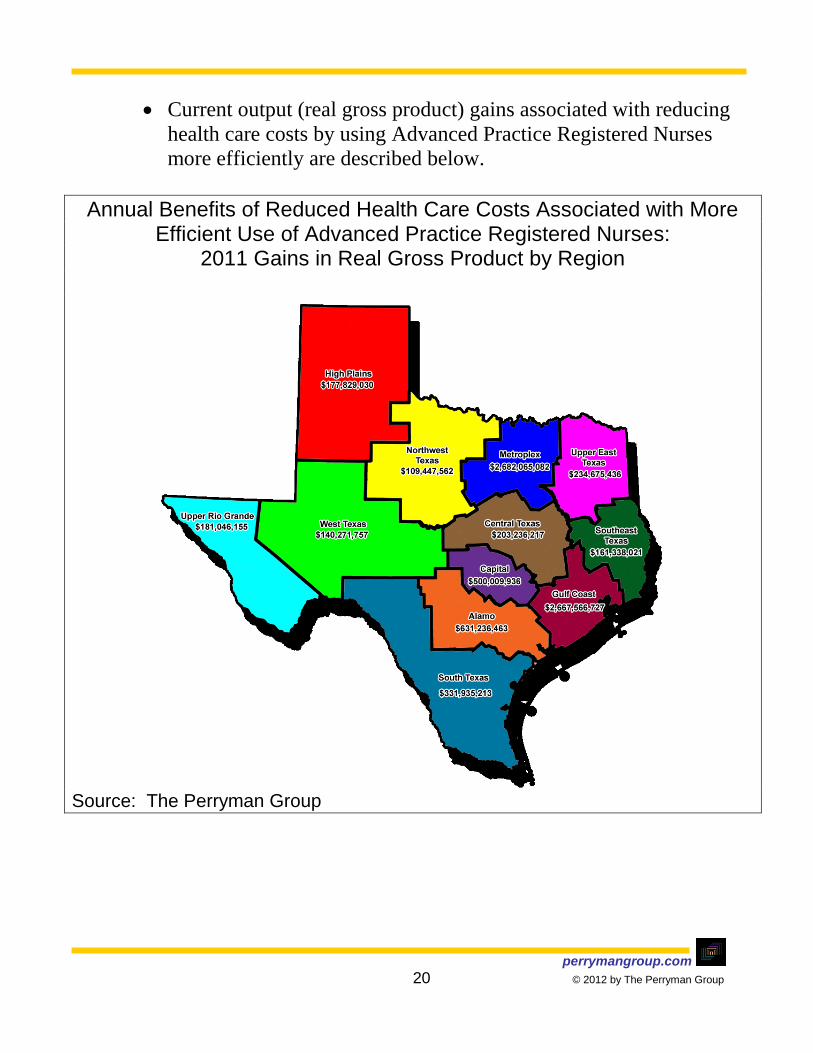
Current output (real gross product) gains associated with reducing
health care costs by using Advanced Practice Registered Nurses
more efficiently are described below.
Annual Benefits of Reduced Health Care Costs Associated with More Efficient Use of Advanced Practice Registered Nurses:
2011 Gains in Real Gross Product by Region
Source: The Perryman Group
perrymangroup.com 21 © 2012 by The Perryman Group
Benefits as of 2020
Over time, the economic benefits of more efficient use of Advanced
Practice Registered Nurses will grow. In 2020, The Perryman
Group estimates that the total annual impact (including multiplier
effects) for the state of Texas would include almost $24.0 billion in
total expenditures and $12.0 billion (in constant 2011 dollars) in
output (real gross product) as well as 122,735 permanent jobs.
Aggregate State and local fiscal revenue gains would be $722.7
million and $322.3 million per annum, respectively.
Again, these benefits would be spread throughout the state, as
illustrated in the following graphics.
The Annual Benefits Resulting from Reduced Health Care Costs Associated
with the More Efficient Use of Advanced Practice Registered Nurses on
Business Activity in Texas as of 2020
$3.723
$7.841
$12.006
$23.971
$0 $5 $10 $15 $20 $25 $30
Retail Sales
Personal Income
Gross Product
Total Expenditures
Billions of 2011 Dollars
122,735Permanent
Jobs
Source: The Perryman Group

perrymangroup.com 22 © 2012 by The Perryman Group
Benefits of Reduced Health Care Costs Associated with More Efficient Use of Advanced Practice Registered Nurses:
2020 Job Gains by Metropolitan Statistical Area
Source: The Perryman Group

perrymangroup.com 23 © 2012 by The Perryman Group
Annual Benefits of Reduced Health Care Costs Associated with More Efficient Use of Advanced Practice Registered Nurses:
2020 Gains in Real Gross Product by Metropolitan Statistical Area
Source: The Perryman Group

perrymangroup.com 24 © 2012 by The Perryman Group
Benefits of Reduced Health Care Costs Associated with More Efficient Use of Advanced Practice Registered Nurses:
2020 Job Gains by Region
Source: The Perryman Group

perrymangroup.com 25 © 2012 by The Perryman Group
Annual Benefits of Reduced Health Care Costs Associated with More Efficient Use of Advanced Practice Registered Nurses:
2020 Gains in Real Gross Product by Region
Source: The Perryman Group
perrymangroup.com 26 © 2012 by The Perryman Group
Benefits in 2030 and 2040
By 2030, the annual economic benefits of reduced health care
expenditures realized by more fully utilizing Advanced Practice
Registered Nurses could be expected to rise to $34.8 billion in total
expenditures and $17.5 billion in output (real gross product) as well
as 151,462 permanent jobs. State revenue gains for the year would
be $1.053 billion, with local governmental receipts rising by $424.8
million.
The Annual Benefits Resulting from Reduced Health Care Costs Associated
with the More Efficient Use of Advanced Practice Registered Nurses on
Business Activity in Texas as of 2030
$5.430
$11.417
$17.461
$34.764
$0 $5 $10 $15 $20 $25 $30 $35 $40
Retail Sales
Personal Income
Gross Product
Total Expenditures
Billions of 2011 Dollars
151,462Permanent
Jobs
Source: The Perryman Group
perrymangroup.com 27 © 2012 by The Perryman Group
Annual benefits in 2040 rise to $46.9 billion in total expenditures
and $23.6 billion in output (real gross product) each year and
177,220 permanent jobs. These gains would be spread through
communities across Texas. The fiscal effects at this point would be
expected to include $1.432 billion for the State and $538.1 million
for various local taxing authorities.
The Annual Benefits Resulting from Reduced Health Care Costs Associated
with the More Efficient Use of Advanced Practice Registered Nurses on
Business Activity in Texas (as of 2040)
$7.383
$15.431
$23.598
$46.931
$0 $10 $20 $30 $40 $50 $60
Retail Sales
Personal Income
Gross Product
Total Expenditures
Billions of 2011 Dollars
177,220Permanent
Jobs
Source: The Perryman Group

perrymangroup.com 28 © 2012 by The Perryman Group
Summary of Economic Benefits of Utilizing Advanced Practice Registered Nurses More Efficiently: 2011-2040
The reduction in health care costs (and, hence, economic benefits)
stemming from increased utilization of Advanced Practice
Registered Nurses in the provision of health care in Texas rise over
time due to expected increases in medical costs and the greater need
for care associated with a growing and aging population.
In terms of total expenditures, overall economic benefits (adjusted
for general inflation) rise from almost $16.1 billion currently to
more than $46.9 billion by 2040.
perrymangroup.com 29 © 2012 by The Perryman Group
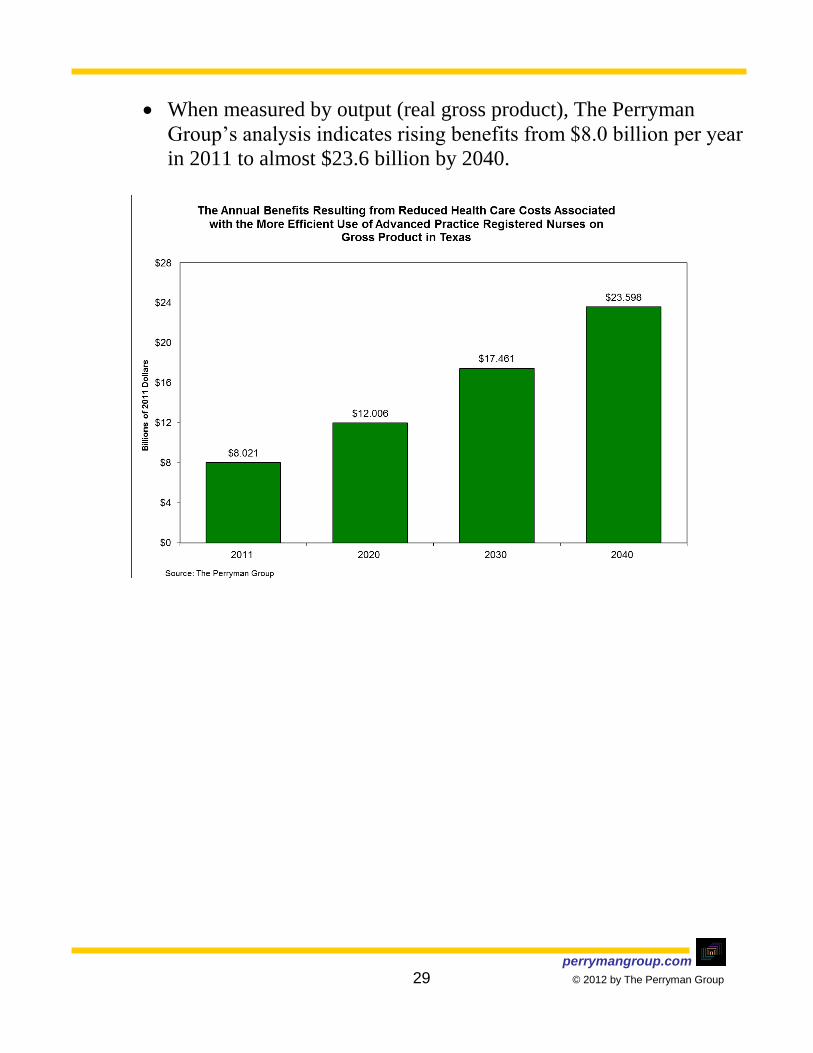
When measured by output (real gross product), The Perryman
Group’s analysis indicates rising benefits from $8.0 billion per year
in 2011 to almost $23.6 billion by 2040.
perrymangroup.com 30 © 2012 by The Perryman Group
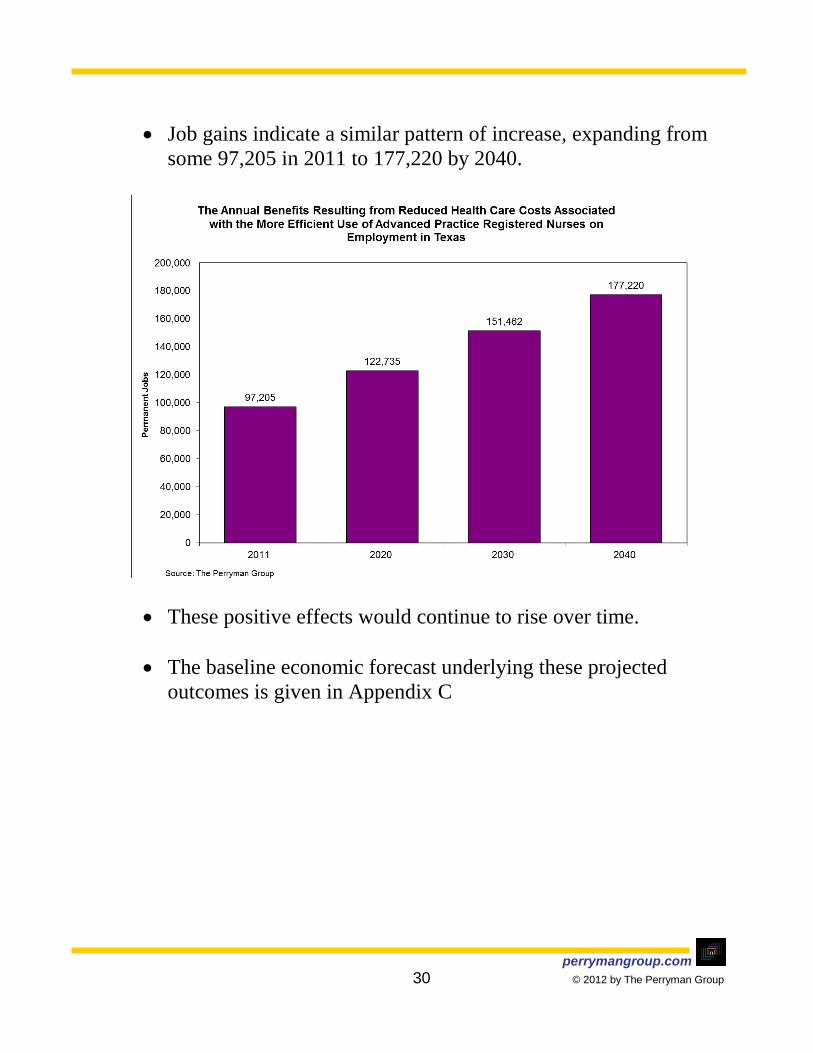
Job gains indicate a similar pattern of increase, expanding from
some 97,205 in 2011 to 177,220 by 2040.
These positive effects would continue to rise over time.
The baseline economic forecast underlying these projected
outcomes is given in Appendix C

perrymangroup.com 31 © 2012 by The Perryman Group
CONCLUSION

perrymangroup.com 32 © 2012 by The Perryman Group
CONCLUSION
Finding ways to deal with rising health care costs is crucial to long-term prosperity. To the extent that regulatory frameworks prevent the most efficient provision of care in an appropriate and beneficial manner, they should be modified. Patient well-being is (at all times) of paramount importance, but empirical evidence demonstrates that Advanced
Practice Registered Nurses can be more fully utilized without
compromising patient outcomes.
The Perryman Group estimated the reduction in health care costs that could be realized by greater use of Advanced Practice Registered Nurses and the associated increase in spending for more productive purposes. These economic benefits would be significant given current levels of health care spending and would rise over time.
Utilizing Advanced Practice Registered Nurses more efficiently in the system of health care provision can enhance patient care while reducing costs. These efficiencies generate substantial economic benefits
which permeate the entire state and facilitate a broader and more
effective health care delivery model.
perrymangroup.com 33 © 2012 by The Perryman Group
APPENDICES
perrymangroup.com 34 © 2012 by The Perryman Group
APPENDIX A: Methods Used

perrymangroup.com 35 © 2012 by The Perryman Group
US Multi-Regional Impact Assessment System
• The basic modeling technique employed in this study is known as input-output analysis. This methodology essentially uses extensive survey data, industry information, and a variety of corroborative source materials to create a matrix describing the various goods and services (known as resources or inputs) required to produce one unit (a dollar’s worth) of output for a given sector. Once the base information is compiled, it can be mathematically simulated to generate evaluations of the magnitude of successive rounds of activity involved in the overall production process.
• There are two essential steps in conducting an input-output analysis once the system is operational. The first major endeavor is to accurately define the levels of direct activity to be evaluated. In this case, the process of obtaining estimates of potential efficiency gains from enhanced utilization of Advanced Practice Registered Nurses and determining the requisite sectoral and geographic allocations was described within the report.
• Once the direct input values were determined, the present study was conducted within the context of the US Multi-Regional Impact Assessment System (USMRIAS) which was developed and is maintained by The Perryman Group. This model has been used in hundreds of diverse applications across the country and has an excellent reputation for accuracy and credibility. In addition, the model has been in operation and continually updated for over two decades. The system used in the current simulations reflects the unique industrial structures of Texas and its counties, metropolitan areas, and regions.
• The USMRIAS is somewhat similar in format to the Input-Output Model of the United States and the Regional Input-Output Modeling System, both of which are maintained by the US Department of Commerce. The model developed by TPG, however, incorporates several important enhancements and refinements. Specifically, the expanded system includes (1) comprehensive 500-sector coverage for any county, multi-county, or urban region; (2) calculation of both total expenditures and value-added by industry and region; (3) direct estimation of expenditures for multiple basic input choices (expenditures, output, income, or employment); (4) extensive parameter localization; (5) price adjustments for real and nominal assessments by sectors and areas; (6) measurement of the induced impacts associated with payrolls and consumer spending; (7) embedded modules to estimate multi-sectoral direct spending effects; (8) estimation of retail spending activity by consumers; and (9) comprehensive linkage and integration capabilities with a wide variety of econometric, real estate, occupational, and fiscal impact models. The models used for the present investigation have been thoroughly tested for reasonableness and historical reliability.
• As noted earlier, the impact assessment (input-output) process essentially estimates the amounts of all types of goods and services required to produce one unit (a dollar’s worth) of a specific type of output. For purposes of illustrating the nature of the system, it is useful to think of inputs and outputs in dollar (rather than

perrymangroup.com 36 © 2012 by The Perryman Group
physical) terms. As an example, the construction of a new building will require specific dollar amounts of lumber, glass, concrete, hand tools, architectural services, interior design services, paint, plumbing, and numerous other elements. Each of these suppliers must, in turn, purchase additional dollar amounts of inputs. This process continues through multiple rounds of production, thus generating subsequent increments to business activity. The initial process of building the facility is known as the direct effect. The ensuing transactions in the output chain constitute the indirect effect.
• Another pattern that arises in response to any direct economic activity comes from the payroll dollars received by employees at each stage of the production cycle. As workers are compensated, they use some of their income for taxes, savings, and purchases from external markets. A substantial portion, however, is spent locally on food, clothing, health care services, utilities, housing, recreation, and other items. Typical purchasing patterns in the relevant areas are obtained from the ACCRA Cost of Living Index, a privately compiled inter-regional measure which has been widely used for several decades, and the Consumer Expenditure Survey of the US Department of Labor. These initial outlays by area residents generate further secondary activity as local providers acquire inputs to meet this consumer demand. These consumer spending impacts are known as the induced effect. The USMRIAS is designed to provide realistic, yet conservative, estimates of these phenomena.
• Sources for information used in this process include the Bureau of the Census, the Bureau of Labor Statistics, the Regional Economic Information System of the US Department of Commerce, and other public and private sources. The pricing data are compiled from the US Department of Labor and the US Department of Commerce. The verification and testing procedures make use of extensive public and private sources. Note that all monetary values, unless otherwise noted, are given in constant (2011) dollars to eliminate the effects of inflation.
• The USMRIAS generates estimates of the effect on several measures of business activity. The most comprehensive measure of economic activity used in this study is Total Expenditures. This measure incorporates every dollar that changes hands in any transaction. For example, suppose a farmer sells wheat to a miller for $0.50; the miller then sells flour to a baker for $0.75; the baker, in turn, sells bread to a customer for $1.25. The Total Expenditures recorded in this instance would be $2.50, that is, $0.50 + $0.75 + $1.25. This measure is quite broad, but is useful in that (1) it reflects the overall interplay of all industries in the economy, and (2) some key fiscal variables such as sales taxes are linked to aggregate spending.
• A second measure of business activity frequently employed in this analysis is that of Gross Product. This indicator represents the regional equivalent of Gross Domestic Product, the most commonly reported statistic regarding national economic performance. In other words, the Gross Product of, say, Amarillo is the amount of US output that is produced in that area. It is defined as the value of all final goods produced in a given region for a specific period of time. Stated

perrymangroup.com 37 © 2012 by The Perryman Group
differently, it captures the amount of value-added (gross area product) over intermediate goods and services at each stage of the production process, that is, it eliminates the double counting in the Total Expenditures concept. Using the example above, the Gross Product is $1.25 (the value of the bread) rather than $2.50. Alternatively, it may be viewed as the sum of the value-added by the farmer, $0.50; the miller, $0.25 ($0.75 - $0.50); and the baker, $0.50 ($1.25 - $0.75). The total value-added is, therefore, $1.25, which is equivalent to the final value of the bread. In many industries, the primary component of value-added is the wage and salary payments to employees.
• The third gauge of economic activity used in this evaluation is Personal Income. As the name implies, Personal Income is simply the income received by individuals, whether in the form of wages, salaries, interest, dividends, proprietors’ profits, or other sources. It may thus be viewed as the segment of overall impacts which flows directly to the citizenry.
• The fourth measure, Retail Sales, represents the component of Total Expenditures which occurs in retail outlets (general merchandise stores, automobile dealers and service stations, building materials stores, food stores, drugstores, restaurants, and so forth). Retail Sales is a commonly used measure of consumer activity.
• The final aggregates used are Permanent Jobs and Person-Years of Employment. The Person-Years of Employment measure reveals the full-time equivalent jobs generated by an activity. A person-year is simply the equivalent of a person working for a year. As an example, it could be a carpenter employed for five months, a mason for three months, and a painter for four months. In the case of a construction project, these are typically spread over the course of the construction and development phase. It should be noted that, unlike the dollar values described above, Permanent Jobs is a “stock” rather than a “flow.” In other words, if an area produces $1 million in output in 2009 and $1 million in 2010, it is appropriate to say that $2 million was achieved in the 2009-2010 period. If the same area has 100 people working in 2009 and 100 in 2010, it only has 100 Permanent Jobs. When a flow of jobs is measured, such as in a construction project or a cumulative assessment over multiple years, it is appropriate to measure employment in Person-Years (a person working for a year). This concept is distinct from Permanent Jobs, which anticipates that the relevant positions will be maintained on a continuing basis.

perrymangroup.com 38 © 2012 by The Perryman Group
Texas Econometric Model
perrymangroup.com 39 © 2012 by The Perryman Group
Texas Econometric Model
Overview • The Texas Econometric Model was developed by Dr. M. Ray Perryman, President
and CEO of The Perryman Group (TPG) approximately 30 years ago has been consistently maintained and updated since that time. It is formulated in an internally consistent manner and is designed to permit the integration of relevant global, national, state, and local factors into the projection process. It is the result of more than three decades of continuing research in econometrics, economic theory, statistical methods, and key policy issues and behavioral patterns, as well as intensive, ongoing study of all aspects of the global, US, Texas, and Texas metropolitan area economies. It is extensively used by scores of federal and State governmental entities on an ongoing basis, as well as hundreds of major corporations.
• This section describes the forecasting process in a comprehensive manner, focusing on both the modeling and the supplemental analysis. The overall methodology, while certainly not ensuring perfect foresight, permits an enormous body of relevant information to impact the economic outlook in a systematic manner.
Model Logic and Structure
• The Texas Econometric Model revolves around a core system which projects output (real and nominal), income (real and nominal), and employment by industry in a simultaneous manner. For purposes of illustration, it is useful to initially consider the employment functions. Essentially, employment within the system is a derived demand relationship obtained from a neo-Classical production function. The expressions are augmented to include dynamic temporal adjustments to changes in relative factor input costs, output and (implicitly) productivity, and technological progress over time. Thus, the typical equation includes output, the relative real cost of labor and capital, dynamic lag structures, and a technological adjustment parameter. The functional form is logarithmic, thus preserving the theoretical consistency with the neo-Classical formulation.
• The income segment of the model is divided into wage and non-wage components. The wage equations, like their employment counterparts, are individually estimated at the 3-digit North American Industry Classification System (NAICS) level of aggregation. Hence, income by place of work is measured for approximately 90 production categories. The wage equations measure real compensation, with the form of the variable structure differing between “basic” and “non-basic.”
• The basic industries, comprised primarily of the various components of Mining, Agriculture, and Manufacturing, are export-oriented, i.e., they bring external dollars into the area and form the core of the economy. The production of these sectors typically flows into national and international markets; hence, the labor markets are influenced by conditions in areas beyond the borders of the particular region.
perrymangroup.com 40 © 2012 by The Perryman Group
Thus, real (inflation-adjusted) wages in the basic industry are expressed as a function of the corresponding national rates, as well as measures of local labor market conditions (the reciprocal of the unemployment rate), dynamic adjustment parameters, and ongoing trends.
• The “non-basic” sectors are somewhat different in nature, as the strength of their labor markets is linked to the health of the local export sectors. Consequently, wages in these industries are related to those in the basic segment of the economy. The relationship also includes the local labor market measures contained in the basic wage equations.
• Note that compensation rates in the export or “basic” sectors provide a key element of the interaction of the regional economies with national and international market phenomena, while the “non-basic” or local industries are strongly impacted by area production levels. Given the wage and employment equations, multiplicative identities in each industry provide expressions for total compensation; these totals may then be aggregated to determine aggregate wage and salary income. Simple linkage equations are then estimated for the calculation of personal income by place of work.
• The non-labor aspects of personal income are modeled at the regional level using straightforward empirical expressions relating to national performance, dynamic responses, and evolving temporal patterns. In some instances (such as dividends, rents, and others) national variables (for example, interest rates) directly enter the forecasting system. These factors have numerous other implicit linkages into the system resulting from their simultaneous interaction with other phenomena in national and international markets which are explicitly included in various expressions.
• The output or gross area product expressions are also developed at the 3-digit NAICS level. Regional output for basic industries is linked to national performance in the relevant industries, local and national production in key related sectors, relative area and national labor costs in the industry, dynamic adjustment parameters, and ongoing changes in industrial interrelationships (driven by technological changes in production processes).
• Output in the non-basic sectors is modeled as a function of basic production levels, output in related local support industries (if applicable), dynamic temporal adjustments, and ongoing patterns. The inter-industry linkages are obtained from the input-output (impact assessment) system which is part of the overall integrated modeling structure maintained by The Perryman Group. Note that the dominant component of the econometric system involves the simultaneous estimation and projection of output (real and nominal), income (real and nominal), and employment at a disaggregated industrial level. This process, of necessity, also produces projections of regional price deflators by industry. These values are affected by both national pricing patterns and local cost variations and permit changes in prices to impact other aspects of economic behavior. Income is converted from real to nominal terms using Texas Consumer Price Index, which fluctuates in response to national pricing patterns and unique local phenomena.

perrymangroup.com 41 © 2012 by The Perryman Group
• Several other components of the model are critical to the forecasting process. The demographic module includes (1) a linkage equation between wage and salary (establishment) employment and household employment, (2) a labor force participation rate function, and (3) a complete population system with endogenous migration. Given household employment, labor force participation (which is a function of economic conditions and evolving patterns of worker preferences), and the working age population, the unemployment rate and level become identities.
• The population system uses Census information, fertility rates, and life tables to determine the “natural” changes in population by age group. Migration, the most difficult segment of population dynamics to track, is estimated in relation to relative regional and extra-regional economic conditions over time. Because evolving economic conditions determine migration in the system, population changes are allowed to interact simultaneously with overall economic conditions. Through this process, migration is treated as endogenous to the system, thus allowing population to vary in accordance with relative business performance (particularly employment).
• Real retail sales is related to income, interest rates, dynamic adjustments, and patterns in consumer behavior on a store group basis. It is expressed on an inflation-adjusted basis. Inflation at the state level relates to national patterns, indicators of relative economic conditions, and ongoing trends.
• A final significant segment of the forecasting system relates to real estate absorption and activity. The short-term demand for various types of property is determined by underlying economic and demographic factors, with short-term adjustments to reflect the current status of the pertinent building cycle. In some instances, this portion of the forecast requires integration with the Multi-Regional Industry-Occupation System which is maintained by The Perryman Group.
• The overall Texas Econometric Model contains numerous additional specifications, and individual expressions are modified to reflect alternative lag structures, empirical properties of the estimates, simulation requirements, and similar phenomena. Moreover, it is updated on an ongoing basis as new data releases become available. Nonetheless, the above synopsis offers a basic understanding of the overall structure and underlying logic of the system.
Model Simulation and Multi-Regional Structure
• The initial phase of the simulation process is the execution of a standard non-linear algorithm for the state system and that of each of the individual sub-areas. The external assumptions are derived from scenarios developed through national and international models and extensive analysis by The Perryman Group. The US model, which follows the basic structure outlined above, was used to some extent in the current analysis to define the demand for domestically produced goods on a per capita basis.
• Once the initial simulations are completed, they are merged into a single system with additive constraints and interregional flows. Using information on minimum regional requirements, import needs, export potential, and locations, it becomes
perrymangroup.com 42 © 2012 by The Perryman Group
possible to balance the various forecasts into a mathematically consistent set of results. This process is, in effect, a disciplining exercise with regard to the individual regional (including metropolitan and rural) systems. By compelling equilibrium across all regions and sectors, the algorithm ensures that the patterns in state activity are reasonable in light of smaller area dynamics and, conversely, that the regional outlooks are within plausible performance levels for the state as a whole.
• The iterative simulation process has the additional property of imposing a global convergence criterion across the entire multi-regional system, with balance being achieved simultaneously on both a sectoral and a geographic basis. This approach is particularly critical on non-linear dynamic systems, as independent simulations of individual systems often yield unstable, non-convergent outcomes.
• It should be noted that the underlying data for the modeling and simulation process are frequently updated and revised by the various public and private entities compiling them. Whenever those modifications to the database occur, they bring corresponding changes to the structural parameter estimates of the various systems and the solutions to the simulation and forecasting system. The multi-regional version of the Texas Econometric Model is re-estimated and simulated with each such data release, thus providing a constantly evolving and current assessment of state and local business activity.
The Final Forecast
• The process described above is followed to produce an initial set of projections. Through the comprehensive multi-regional modeling and simulation process, a systematic analysis is generated which accounts for both historical patterns in economic performance and inter-relationships and best available information on the future course of pertinent external factors. While the best available techniques and data are employed in this effort, they are not capable of directly capturing “street sense,” i.e., the contemporaneous and often non-quantifiable information that can materially affect economic outcomes. In order to provide a comprehensive approach to the prediction of business conditions, it is necessary to compile and assimilate extensive material regarding current events and factors both across the state of Texas and elsewhere.
• This critical aspect of the forecasting methodology includes activities such as (1) daily review of hundreds of financial and business publications and electronic information sites; (2) review of all major newspapers in the state on a daily basis; (3) dozens of hours of direct telephone interviews with key business and political leaders in all parts of the state; (4) face-to-face discussions with representatives of major industry groups; and (5) frequent site visits to the various regions of the state. The insights arising from this “fact finding” are analyzed and evaluated for their effects on the likely course of the future activity.
• Another vital information resource stems from the firm’s ongoing interaction with key players in the international, domestic, and state economic scenes. Such activities include visiting with corporate groups on a regular basis and being

perrymangroup.com 43 © 2012 by The Perryman Group
regularly involved in the policy process at all levels. The firm is also an active participant in many major corporate relocations, economic development initiatives, and regulatory proceedings.
• Once organized, this information is carefully assessed and, when appropriate, independently verified. The impact on specific communities and sectors that is distinct from what is captured by the econometric system is then factored into the forecast analysis. For example, the opening or closing of a major facility, particularly in a relatively small area, can cause a sudden change in business performance that will not be accounted for by either a modeling system based on historical relationships or expected (primarily national and international) factors.
• The final step in the forecasting process is the integration of this material into the results in a logical and mathematically consistent manner. In some instances, this task is accomplished through “constant adjustment factors” which augment relevant equations. In other cases, anticipated changes in industrial structure or regulatory parameters are initially simulated within the context of the Multi-Regional Impact Assessment System to estimate their ultimate effects by sector. Those findings are then factored into the simulation as constant adjustments on a distributed temporal basis. Once this scenario is formulated, the extended system is again balanced across regions and sectors through an iterative simulation algorithm analogous to that described in the preceding section.

perrymangroup.com 44 © 2012 by The Perryman Group
APPENDIX B: Detailed Sectoral Results

perrymangroup.com 45 © 2012 by The Perryman Group
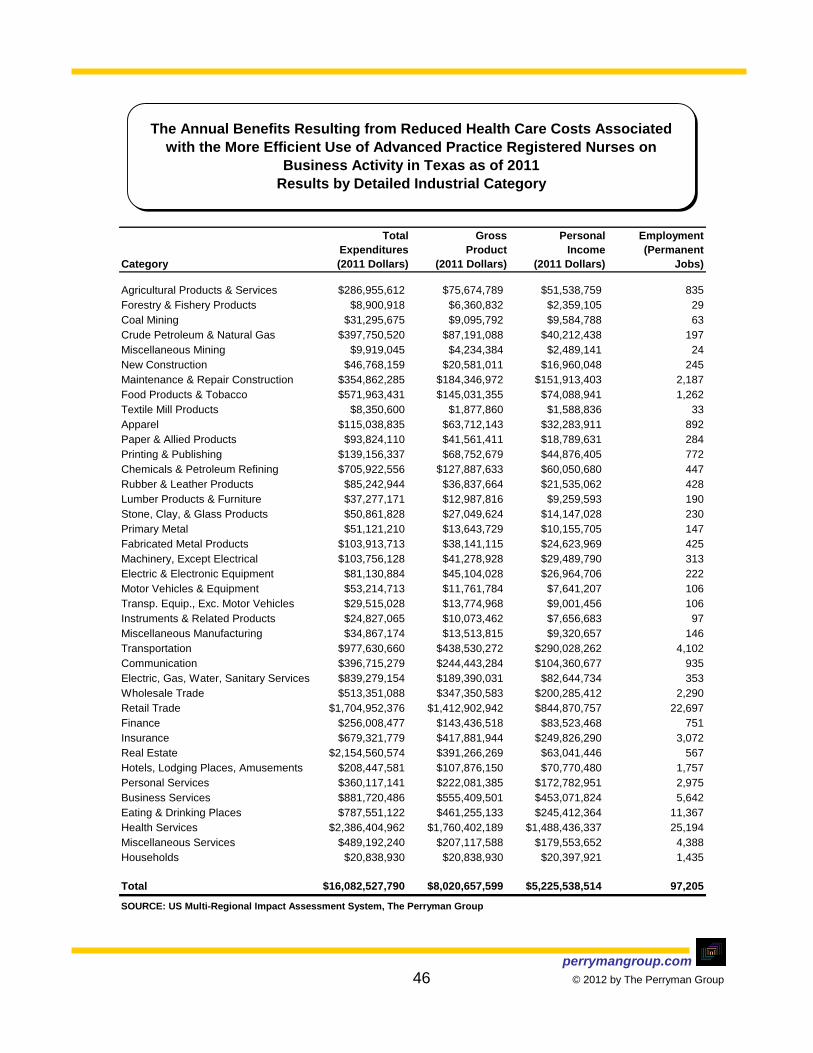
Economic Benefits as of 2011
perrymangroup.com 46 © 2012 by The Perryman Group
Total Gross Personal Employment
Expenditures Product Income (Permanent
Category (2011 Dollars) (2011 Dollars) (2011 Dollars) Jobs)
Agricultural Products & Services $286,955,612 $75,674,789 $51,538,759 835
Forestry & Fishery Products $8,900,918 $6,360,832 $2,359,105 29
Coal Mining $31,295,675 $9,095,792 $9,584,788 63
Crude Petroleum & Natural Gas $397,750,520 $87,191,088 $40,212,438 197
Miscellaneous Mining $9,919,045 $4,234,384 $2,489,141 24
New Construction $46,768,159 $20,581,011 $16,960,048 245
Maintenance & Repair Construction $354,862,285 $184,346,972 $151,913,403 2,187
Food Products & Tobacco $571,963,431 $145,031,355 $74,088,941 1,262
Textile Mill Products $8,350,600 $1,877,860 $1,588,836 33
Apparel $115,038,835 $63,712,143 $32,283,911 892
Paper & Allied Products $93,824,110 $41,561,411 $18,789,631 284
Printing & Publishing $139,156,337 $68,752,679 $44,876,405 772
Chemicals & Petroleum Refining $705,922,556 $127,887,633 $60,050,680 447
Rubber & Leather Products $85,242,944 $36,837,664 $21,535,062 428
Lumber Products & Furniture $37,277,171 $12,987,816 $9,259,593 190
Stone, Clay, & Glass Products $50,861,828 $27,049,624 $14,147,028 230
Primary Metal $51,121,210 $13,643,729 $10,155,705 147
Fabricated Metal Products $103,913,713 $38,141,115 $24,623,969 425
Machinery, Except Electrical $103,756,128 $41,278,928 $29,489,790 313
Electric & Electronic Equipment $81,130,884 $45,104,028 $26,964,706 222
Motor Vehicles & Equipment $53,214,713 $11,761,784 $7,641,207 106
Transp. Equip., Exc. Motor Vehicles $29,515,028 $13,774,968 $9,001,456 106
Instruments & Related Products $24,827,065 $10,073,462 $7,656,683 97
Miscellaneous Manufacturing $34,867,174 $13,513,815 $9,320,657 146
Transportation $977,630,660 $438,530,272 $290,028,262 4,102
Communication $396,715,279 $244,443,284 $104,360,677 935
Electric, Gas, Water, Sanitary Services $839,279,154 $189,390,031 $82,644,734 353
Wholesale Trade $513,351,088 $347,350,583 $200,285,412 2,290
Retail Trade $1,704,952,376 $1,412,902,942 $844,870,757 22,697
Finance $256,008,477 $143,436,518 $83,523,468 751
Insurance $679,321,779 $417,881,944 $249,826,290 3,072
Real Estate $2,154,560,574 $391,266,269 $63,041,446 567
Hotels, Lodging Places, Amusements $208,447,581 $107,876,150 $70,770,480 1,757
Personal Services $360,117,141 $222,081,385 $172,782,951 2,975
Business Services $881,720,486 $555,409,501 $453,071,824 5,642
Eating & Drinking Places $787,551,122 $461,255,133 $245,412,364 11,367
Health Services $2,386,404,962 $1,760,402,189 $1,488,436,337 25,194
Miscellaneous Services $489,192,240 $207,117,588 $179,553,652 4,388
Households $20,838,930 $20,838,930 $20,397,921 1,435
Total $16,082,527,790 $8,020,657,599 $5,225,538,514 97,205
SOURCE: US Multi-Regional Impact Assessment System, The Perryman Group
The Annual Benefits Resulting from Reduced Health Care Costs Associated
with the More Efficient Use of Advanced Practice Registered Nurses on
Business Activity in Texas as of 2011
Results by Detailed Industrial Category

perrymangroup.com 47 © 2012 by The Perryman Group
Total Gross Personal Retail Employment
Expenditures Product Income Sales (Permanent
Economic Region (2011 Dollars) (2011 Dollars) (2011 Dollars) (2011 Dollars) Jobs)
High Plains $341,842,923 $177,829,030 $116,553,922 $63,863,530 2,256
Northwest Texas $206,325,408 $109,447,562 $72,272,502 $41,042,321 1,417
Metroplex $5,347,287,274 $2,682,065,082 $1,731,735,996 $822,279,027 32,130
Upper East Texas $448,223,452 $234,675,436 $155,907,808 $85,055,740 3,031
Southeast Texas $303,810,528 $161,338,021 $108,701,594 $60,946,983 2,119
Gulf Coast $5,620,865,376 $2,667,566,727 $1,735,254,948 $735,569,447 31,177
Capital $936,779,882 $500,009,936 $328,027,999 $169,771,850 6,241
Central Texas $388,404,387 $203,236,217 $134,156,555 $73,093,380 2,628
Alamo $1,219,058,720 $631,236,463 $414,274,160 $210,180,655 7,903
South Texas $638,117,282 $331,935,213 $220,094,310 $120,228,887 4,307
West Texas $272,140,361 $140,271,757 $91,771,661 $52,830,361 1,781
Upper Rio Grande $359,672,196 $181,046,155 $116,787,060 $57,641,317 2,216
TOTAL STATE IMPACT $16,082,527,790 $8,020,657,599 $5,225,538,514 $2,492,503,498 97,205
SOURCE: US Multi-Regional Impact Assessment System, The Perryman Group
The Annual Benefits Resulting from Reduced Health Care Costs Associated
with the More Efficient Use of Advanced Practice Registered Nurses on
Business Activity in Texas as of 2011
Comptroller's Economic Region Results

perrymangroup.com 48 © 2012 by The Perryman Group
Total Gross Personal Retail Employment
Expenditures Product Income Sales (Permanent
COG (2011 Dollars) (2011 Dollars) (2011 Dollars) (2011 Dollars) Jobs)
Panhandle $178,741,761 $91,615,627 $59,870,803 $33,465,820 1,160
South Plains $163,101,162 $86,213,403 $56,683,119 $30,397,710 1,096
North Texas $88,018,399 $47,656,286 $31,699,296 $18,385,462 625
North Central Texas $5,277,115,805 $2,644,765,839 $1,706,923,288 $808,086,958 31,640
North East Texas $94,727,449 $50,130,822 $33,591,995 $19,409,484 662
East Texas $353,496,003 $184,544,614 $122,315,813 $65,646,257 2,369
West Central Texas $118,307,009 $61,791,276 $40,573,205 $22,656,858 793
Upper Rio Grande $359,672,196 $181,046,155 $116,787,060 $57,641,317 2,216
Permian Basin $209,592,279 $108,534,480 $71,245,797 $41,127,967 1,376
Concho Valley $62,548,083 $31,737,277 $20,525,864 $11,702,394 405
Heart of Texas $157,095,089 $79,692,419 $51,972,202 $27,384,507 1,011
Capital $936,779,882 $500,009,936 $328,027,999 $169,771,850 6,241
Brazos Valley $102,422,017 $53,610,128 $35,366,108 $19,852,511 696
Deep East Texas $102,288,101 $54,729,360 $36,696,098 $20,978,452 725
South East Texas $201,522,427 $106,608,661 $72,005,496 $39,968,531 1,394
Gulf Coast $5,620,865,376 $2,667,566,727 $1,735,254,948 $735,569,447 31,177
Golden Crescent $73,273,036 $37,697,707 $25,091,760 $14,087,796 487
Alamo $1,145,785,684 $593,538,756 $389,182,401 $196,092,859 7,416
South Texas $69,519,986 $37,597,562 $25,116,000 $15,106,139 502
Coastal Bend $264,254,055 $131,513,520 $86,807,515 $47,132,440 1,672
Lower Rio Grande Valley $270,926,617 $144,548,930 $95,934,255 $50,980,733 1,888
Texoma $70,171,469 $37,299,243 $24,812,708 $14,192,070 490
Central Texas $128,887,282 $69,933,670 $46,818,245 $25,856,362 921
Middle Rio Grande $33,416,624 $18,275,201 $12,236,540 $7,009,576 245
Border Region $733,679,082 $381,548,966 $250,127,428 $130,773,058 4,852
TOTAL STATE IMPACT $16,082,527,790 $8,020,657,599 $5,225,538,514 $2,492,503,498 97,205
SOURCE: US Multi-Regional Impact Assessment System, The Perryman Group
The Annual Benefits Resulting from Reduced Health Care Costs Associated
with the More Efficient Use of Advanced Practice Registered Nurses on
Business Activity in Texas as of 2011
Council of Governments (COG) Region Results

perrymangroup.com 49 © 2012 by The Perryman Group
Total Gross Personal Retail Employment
Expenditures Product Income Sales (Permanent
MSA (2011 Dollars) (2011 Dollars) (2011 Dollars) (2011 Dollars) Jobs)
Abilene $71,430,450 $36,596,373 $23,941,410 $12,338,525 458
Amarillo $123,685,441 $65,031,361 $42,741,341 $22,472,873 821
Austin-Round Rock-San Marcos $896,187,977 $479,404,092 $314,596,547 $162,277,118 5,979
Beaumont-Port Arthur $201,522,427 $106,608,661 $72,005,496 $39,968,531 1,394
Brownville-Harlingen $100,014,090 $52,033,401 $34,216,486 $18,174,312 674
College Station-Bryan $74,154,396 $38,519,681 $25,384,053 $13,845,327 498
Corpus Christi $224,617,640 $110,109,700 $72,504,774 $38,583,720 1,386
Dallas-Plano-Irving MD* $3,857,986,227 $1,920,610,271 $1,232,650,543 $569,759,475 22,628
Fort Worth-Arlington MD* $1,363,248,260 $695,524,733 $455,240,586 $227,777,762 8,637
El Paso $352,741,966 $177,343,710 $114,366,053 $56,084,130 2,167
Houston-Baytown-Sugar Land $5,577,216,214 $2,644,668,217 $1,719,984,850 $726,199,756 30,870
Killeen-Temple-Fort Hood $119,320,254 $64,870,560 $43,428,692 $23,771,153 854
Laredo $60,442,829 $32,530,572 $21,672,809 $12,833,173 431
Longview $117,411,701 $62,661,946 $41,992,398 $22,629,768 813
Lubbock $130,305,142 $69,227,251 $45,614,908 $23,126,053 873
McAllen-Edinburg-Pharr $167,931,575 $90,848,283 $60,618,254 $32,109,779 1,192
Midland $98,395,611 $50,773,976 $32,959,524 $18,623,028 627
Odessa $68,567,026 $36,139,708 $24,258,134 $13,554,429 471
San Angelo $49,812,864 $25,101,255 $16,209,814 $8,804,165 318
San Antonio-New Braunfels $1,108,379,682 $574,222,750 $376,466,145 $188,837,019 7,165
Sherman-Denison $43,844,938 $23,897,708 $15,984,194 $8,925,400 316
Texarkana $35,065,855 $19,122,902 $12,848,525 $7,001,115 250
Tyler $119,849,396 $61,199,329 $39,775,209 $21,146,251 770
Victoria $54,055,142 $27,444,642 $18,252,291 $10,162,647 352
Waco $129,809,496 $65,530,785 $42,564,943 $21,852,818 824
Wichita Falls $61,458,546 $33,863,911 $22,625,358 $12,808,563 444
Rural Area $875,072,645 $456,771,820 $302,635,177 $178,836,610 5,992
TOTAL STATE IMPACT $16,082,527,790 $8,020,657,599 $5,225,538,514 $2,492,503,498 97,205
*Metropolitan Division
SOURCE: US Multi-Regional Impact Assessment System, The Perryman Group
The Annual Benefits Resulting from Reduced Health Care Costs Associatedwith the More Efficient Use of Advanced Practice Registered Nurses on Business Activity
in Texas as of 2011Metropolitan Statistical Area (MSA) and Rural Texas Results

perrymangroup.com 50 © 2012 by The Perryman Group
Total Gross Personal Retail Employment
Expenditures Product Income Sales (Permanent
County (2011 Dollars) (2011 Dollars) (2011 Dollars) (2011 Dollars) Jobs)
Anderson $15,822,687 $8,830,815 $5,946,969 $3,218,519 116
Andrews $5,343,917 $2,691,377 $1,715,688 $1,091,018 33
Angelina $37,877,803 $20,113,985 $13,406,342 $7,490,289 264
Aransas $6,916,757 $3,298,140 $2,099,932 $1,350,186 42
Archer $2,471,572 $1,242,582 $795,516 $544,009 16
Armstrong $423,363 $220,454 $150,452 $60,022 3
Atascosa $11,882,192 $6,023,891 $4,001,112 $2,164,451 77
Austin $15,199,345 $7,249,717 $4,617,812 $2,488,110 85
Bailey $2,032,325 $1,049,360 $655,930 $454,266 13
Bandera $4,264,815 $2,131,420 $1,373,844 $867,163 27
Bastrop $15,246,251 $7,614,029 $4,927,371 $2,965,183 98
Baylor $1,071,919 $580,276 $388,132 $217,887 8
Bee $6,096,571 $3,321,012 $2,240,871 $1,324,493 45
Bell $98,980,851 $54,166,684 $36,335,878 $19,636,211 711
Bexar $983,195,305 $510,825,877 $335,084,819 $164,352,907 6,339
Blanco $3,708,255 $1,831,738 $1,180,685 $681,122 23
Borden $215,455 $100,155 $60,296 $38,924 1
Bosque $4,139,287 $2,165,401 $1,452,104 $692,738 28
Bowie $35,065,855 $19,122,902 $12,848,525 $7,001,115 250
Brazoria $105,683,423 $52,883,941 $34,863,847 $21,582,848 692
Brazos $65,654,779 $34,053,893 $22,424,852 $11,886,010 438
Brewster $3,523,144 $1,974,531 $1,321,756 $731,721 26
Briscoe $293,918 $138,254 $85,634 $65,870 2
Brooks $1,321,703 $753,307 $518,621 $325,262 11
Brown $11,875,047 $6,711,675 $4,514,897 $2,689,542 92
Burleson $3,769,338 $1,996,048 $1,317,202 $882,297 26
Burnet $17,506,609 $8,793,066 $5,703,225 $3,229,490 111
Caldwell $7,354,828 $3,782,679 $2,548,576 $1,404,454 50
Calhoun $7,750,424 $3,356,627 $2,157,295 $1,366,907 43
Callahan $2,826,108 $1,392,880 $908,733 $544,238 18
Cameron $100,014,090 $52,033,401 $34,216,486 $18,174,312 674
Camp $3,690,298 $1,944,690 $1,316,062 $662,334 25
Carson $2,632,156 $1,031,348 $613,228 $263,435 11
Cass $7,417,855 $3,918,945 $2,628,295 $1,656,577 53
Castro $1,607,708 $762,692 $479,002 $347,879 10
Chambers $13,517,560 $5,609,837 $3,499,978 $2,044,654 67
Cherokee $12,504,088 $6,771,808 $4,601,662 $2,498,482 90
Childress $1,552,905 $814,710 $544,637 $332,728 11
Clay $2,983,610 $1,526,654 $1,026,091 $547,537 20
Cochran $530,074 $260,194 $167,433 $94,478 3
The Annual Benefits Resulting from Reduced Health Care Costs Associatedwith the More Efficient Use of Advanced Practice Registered Nurses on Business
Activity in Texas as of 2011County Results

perrymangroup.com 51 © 2012 by The Perryman Group
Total Gross Personal Retail Employment
Expenditures Product Income Sales (Permanent
County (2011 Dollars) (2011 Dollars) (2011 Dollars) (2011 Dollars) Jobs)
Coke $610,994 $301,955 $193,826 $132,880 4
Coleman $1,975,703 $1,046,378 $696,394 $397,257 14
Collin $540,690,597 $282,151,769 $184,966,635 $99,798,278 3,526
Collingsworth $681,230 $370,703 $244,694 $161,518 5
Colorado $7,254,943 $3,782,113 $2,530,766 $1,476,843 51
Comal $48,201,092 $24,628,029 $16,090,992 $8,911,022 320
Comanche $3,738,054 $1,990,932 $1,332,439 $706,317 26
Concho $688,078 $374,632 $260,131 $128,755 5
Cooke $19,443,480 $9,739,156 $6,385,015 $3,970,891 126
Coryell $14,810,628 $7,794,370 $5,157,998 $3,004,776 104
Cottle $704,870 $404,846 $271,442 $149,214 5
Crane $1,162,901 $643,051 $443,979 $213,574 8
Crockett $891,005 $461,758 $292,891 $253,031 6
Crosby $1,508,880 $840,009 $573,595 $232,507 11
Culberson $531,829 $308,546 $204,381 $165,581 4
Dallam $2,830,045 $1,449,619 $910,418 $520,077 18
Dallas $2,916,001,348 $1,434,909,986 $914,861,785 $398,995,481 16,546
Dawson $3,278,133 $1,611,410 $992,463 $716,295 20
Deaf Smith $4,329,702 $2,082,508 $1,323,361 $698,723 25
Delta $952,211 $499,812 $344,205 $126,858 6
Denton $272,500,791 $137,461,185 $89,360,000 $45,459,593 1,694
DeWitt $5,737,701 $3,040,165 $2,035,496 $1,107,163 40
Dickens $541,946 $282,174 $183,436 $122,317 4
Dimmit $1,895,265 $1,019,290 $695,498 $441,046 14
Donley $751,323 $430,873 $295,214 $188,395 6
Duval $2,252,143 $1,160,898 $786,837 $390,034 15
Eastland $6,517,000 $3,336,316 $2,201,373 $1,414,588 45
Ector $68,567,026 $36,139,708 $24,258,134 $13,554,429 471
Edwards $330,186 $162,682 $98,305 $72,358 2
El Paso $352,741,966 $177,343,710 $114,366,053 $56,084,130 2,167
Ellis $43,890,928 $21,628,140 $13,912,646 $8,580,484 277
Erath $10,760,852 $5,965,475 $4,045,932 $2,380,327 81
Falls $2,526,557 $1,376,603 $927,945 $476,919 18
Fannin $6,883,051 $3,662,379 $2,443,499 $1,295,779 47
Fayette $9,401,104 $4,893,055 $3,219,642 $1,674,042 62
Fisher $844,787 $465,962 $311,076 $179,996 6
Floyd $1,559,004 $733,434 $467,516 $228,652 9
Foard $202,676 $116,072 $80,971 $39,056 2
Fort Bend $257,213,579 $123,339,277 $79,075,517 $44,287,150 1,503
Franklin $2,910,084 $1,506,479 $1,007,164 $582,521 20
(continued)The Annual Benefits Resulting from Reduced Health Care Costs Associated
with the More Efficient Use of Advanced Practice Registered Nurses on Business Activity in Texas as of 2011
County Results

perrymangroup.com 52 © 2012 by The Perryman Group
Total Gross Personal Retail Employment
Expenditures Product Income Sales (Permanent
County (2011 Dollars) (2011 Dollars) (2011 Dollars) (2011 Dollars) Jobs)
Freestone $5,905,546 $3,014,141 $1,960,636 $1,342,386 40
Frio $4,112,064 $2,064,782 $1,354,255 $762,115 26
Gaines $3,941,342 $1,813,526 $1,120,827 $753,706 22
Galveston $137,271,906 $69,329,429 $45,686,863 $24,515,639 880
Garza $1,637,968 $782,228 $495,691 $368,513 10
Gillespie $10,364,788 $5,314,742 $3,523,483 $1,961,795 69
Glasscock $239,318 $104,570 $62,945 $27,633 1
Goliad $1,062,143 $581,945 $396,327 $276,300 8
Gonzales $4,581,063 $2,429,504 $1,638,430 $909,876 32
Gray $11,273,092 $5,736,447 $3,846,849 $2,304,928 76
Grayson $43,844,938 $23,897,708 $15,984,194 $8,925,400 316
Gregg $92,256,464 $50,030,522 $33,628,707 $17,887,022 651
Grimes $5,652,523 $2,955,110 $1,974,654 $1,211,054 39
Guadalupe $30,559,859 $15,493,984 $10,036,907 $6,701,329 206
Hale $9,762,192 $5,425,329 $3,627,197 $2,344,653 74
Hall $1,004,678 $518,151 $332,735 $194,071 6
Hamilton $2,087,254 $1,103,508 $741,208 $448,460 15
Hansford $1,188,502 $495,168 $293,968 $183,421 6
Hardeman $596,953 $329,504 $216,764 $159,491 5
Hardin $14,091,357 $7,265,394 $4,753,158 $2,995,056 95
Harris $4,792,464,587 $2,259,142,681 $1,468,337,040 $588,294,421 26,051
Harrison $29,499,508 $14,616,726 $9,781,804 $4,800,593 183
Hartley $859,464 $410,345 $264,681 $153,311 5
Haskell $1,574,812 $842,971 $576,269 $301,795 11
Hays $46,238,302 $24,394,116 $16,040,873 $8,991,681 315
Hemphill $1,515,041 $707,352 $449,880 $261,549 9
Henderson $20,297,286 $10,333,186 $6,779,692 $3,717,511 133
Hidalgo $167,931,575 $90,848,283 $60,618,254 $32,109,779 1,192
Hill $8,875,603 $4,449,157 $2,912,330 $1,725,308 59
Hockley $6,643,436 $3,473,225 $2,327,733 $1,437,667 47
Hood $15,953,008 $8,106,855 $5,372,389 $3,054,119 105
Hopkins $10,055,120 $5,304,495 $3,489,952 $2,310,629 71
Houston $6,378,243 $3,283,742 $2,201,736 $980,304 40
Howard $12,144,263 $6,271,358 $4,177,960 $2,385,932 82
Hudspeth $529,194 $268,406 $159,677 $176,332 4
Hunt $28,076,618 $14,874,162 $9,854,501 $6,104,221 198
Hutchinson $8,627,894 $4,151,641 $2,658,260 $2,251,139 56
Irion $794,544 $327,893 $192,850 $143,722 4
Jack $3,101,424 $1,514,849 $974,504 $698,735 20
Jackson $3,202,638 $1,642,046 $1,052,974 $743,189 21
(continued)The Annual Benefits Resulting from Reduced Health Care Costs Associated
with the More Efficient Use of Advanced Practice Registered Nurses on Business Activity in Texas as of 2011
County Results

perrymangroup.com 53 © 2012 by The Perryman Group
Total Gross Personal Retail Employment
Expenditures Product Income Sales (Permanent
County (2011 Dollars) (2011 Dollars) (2011 Dollars) (2011 Dollars) Jobs)
Jasper $10,013,154 $5,413,235 $3,648,373 $2,142,832 73
Jeff Davis $640,536 $334,333 $222,393 $127,909 4
Jefferson $161,382,504 $85,582,780 $57,985,033 $31,329,341 1,115
Jim Hogg $991,177 $512,022 $320,880 $267,720 7
Jim Wells $16,147,344 $9,054,179 $6,069,720 $3,547,550 120
Johnson $47,676,290 $25,020,099 $16,746,056 $9,187,883 329
Jones $3,925,950 $2,054,893 $1,371,545 $711,685 27
Karnes $3,167,839 $1,550,055 $1,015,770 $589,632 20
Kaufman $28,932,454 $14,974,123 $9,955,825 $5,634,581 198
Kendall $14,645,005 $7,247,262 $4,710,816 $2,839,442 93
Kenedy $134,643 $65,345 $41,537 $44,629 1
Kent $168,261 $77,795 $47,767 $31,879 1
Kerr $19,761,311 $10,386,427 $6,822,747 $3,942,298 136
Kimble $1,483,698 $691,290 $429,489 $295,283 9
King $65,006 $30,829 $19,191 $8,860 0
Kinney $638,336 $308,451 $192,328 $125,982 4
Kleberg $9,322,542 $4,868,775 $3,244,116 $1,842,955 64
Knox $717,518 $387,546 $260,602 $125,787 5
La Salle $1,303,839 $716,854 $483,990 $308,163 10
Lamar $19,089,614 $9,923,421 $6,655,424 $3,784,980 131
Lamb $2,524,365 $1,228,096 $796,986 $478,351 15
Lampasas $5,528,776 $2,909,506 $1,934,816 $1,130,166 39
Lavaca $5,696,492 $3,141,350 $2,112,568 $1,164,921 42
Lee $5,198,851 $2,631,219 $1,714,055 $995,682 33
Leon $4,521,904 $2,388,825 $1,503,998 $1,190,790 31
Liberty $22,450,493 $11,887,493 $8,013,374 $4,327,093 154
Limestone $5,838,600 $3,156,333 $2,154,243 $1,294,339 43
Lipscomb $860,644 $383,729 $234,559 $129,557 4
Live Oak $2,884,228 $1,445,442 $946,876 $654,294 19
Llano $4,777,087 $2,456,766 $1,613,845 $914,397 32
Loving $5,540 $1,922 $1,238 $756 0
Lubbock $128,796,263 $68,387,242 $45,041,313 $22,893,546 862
Lynn $975,045 $473,935 $297,913 $124,059 5
Madison $3,348,696 $1,773,568 $1,176,938 $737,342 24
Marion $2,125,151 $1,113,517 $746,579 $442,186 15
Martin $1,667,765 $843,848 $563,570 $286,006 10
Mason $1,176,936 $596,533 $390,084 $223,702 8
Matagorda $14,203,898 $6,870,031 $4,479,597 $3,213,869 91
Maverick $8,392,756 $4,450,434 $2,954,318 $1,740,783 60
McCulloch $2,474,345 $1,331,928 $898,024 $515,039 18
(continued)The Annual Benefits Resulting from Reduced Health Care Costs Associated
with the More Efficient Use of Advanced Practice Registered Nurses on Business Activity in Texas as of 2011
County Results

perrymangroup.com 54 © 2012 by The Perryman Group
Total Gross Personal Retail Employment
Expenditures Product Income Sales (Permanent
County (2011 Dollars) (2011 Dollars) (2011 Dollars) (2011 Dollars) Jobs)
McLennan $129,809,496 $65,530,785 $42,564,943 $21,852,818 824
McMullen $125,545 $55,743 $33,744 $18,642 1
Medina $8,475,950 $4,207,789 $2,727,583 $1,609,753 55
Menard $386,247 $201,231 $126,677 $97,193 3
Midland $98,395,611 $50,773,976 $32,959,524 $18,623,028 627
Milam $5,494,138 $2,832,628 $1,893,550 $1,175,242 38
Mills $869,849 $520,537 $356,838 $208,182 7
Mitchell $1,896,893 $1,032,409 $691,754 $400,799 14
Montague $6,804,278 $3,448,987 $2,271,517 $1,304,066 45
Montgomery $215,175,552 $106,750,823 $70,591,427 $34,983,804 1,329
Moore $8,372,770 $3,700,129 $2,325,000 $1,492,986 45
Morris $3,663,918 $1,723,035 $1,152,737 $529,368 21
Motley $336,755 $165,258 $104,643 $64,505 2
Nacogdoches $17,115,477 $9,333,246 $6,334,094 $3,691,137 128
Navarro $15,172,891 $7,801,285 $5,205,549 $2,673,243 101
Newton $994,961 $608,941 $420,572 $288,356 8
Nolan $5,176,443 $2,746,577 $1,789,610 $1,059,324 35
Nueces $199,504,193 $97,634,892 $64,241,273 $33,397,687 1,221
Ochiltree $3,989,667 $1,869,544 $1,185,595 $767,401 23
Oldham $191,155 $104,365 $68,029 $63,524 2
Orange $26,048,566 $13,760,488 $9,267,305 $5,644,134 184
Palo Pinto $10,155,151 $4,915,495 $3,145,323 $1,953,651 63
Panola $8,961,608 $4,610,987 $3,093,946 $1,738,040 60
Parker $33,870,293 $16,310,022 $10,364,217 $6,392,956 206
Parmer $1,803,078 $779,798 $504,192 $170,828 9
Pecos $4,733,669 $2,413,603 $1,570,569 $1,073,425 32
Polk $10,651,010 $5,716,677 $3,770,909 $2,350,804 75
Potter $87,630,775 $46,405,967 $30,669,789 $15,756,068 586
Presidio $1,705,527 $816,628 $512,800 $355,643 10
Rains $1,699,866 $787,159 $479,080 $387,958 10
Randall $32,999,147 $17,373,591 $11,307,872 $6,393,349 221
Reagan $1,049,275 $536,626 $328,470 $283,736 7
Real $756,020 $373,899 $243,855 $141,525 5
Red River $2,288,561 $1,187,936 $787,955 $419,130 15
Reeves $2,384,525 $1,216,054 $786,626 $595,468 17
Refugio $1,351,697 $679,119 $420,419 $400,861 9
Roberts $42,452 $19,289 $11,590 $12,177 0
Robertson $4,730,279 $2,469,739 $1,641,999 $1,077,019 33
Rockwall $26,941,280 $14,111,095 $9,394,946 $5,059,979 182
Runnels $2,640,098 $1,247,366 $797,804 $473,327 16
(continued)The Annual Benefits Resulting from Reduced Health Care Costs Associated
with the More Efficient Use of Advanced Practice Registered Nurses on Business Activity in Texas as of 2011
County Results

perrymangroup.com 55 © 2012 by The Perryman Group
Total Gross Personal Retail Employment
Expenditures Product Income Sales (Permanent
County (2011 Dollars) (2011 Dollars) (2011 Dollars) (2011 Dollars) Jobs)
Rusk $17,292,448 $8,624,113 $5,755,753 $3,130,517 111
Sabine $2,134,319 $1,136,867 $783,998 $463,386 16
San Augustine $1,729,132 $878,165 $585,044 $307,451 11
San Jacinto $3,593,431 $1,819,304 $1,192,659 $743,334 24
San Patricio $18,196,690 $9,176,668 $6,163,569 $3,835,847 124
San Saba $1,115,787 $606,437 $397,957 $253,325 8
Schleicher $640,805 $341,578 $237,343 $84,762 4
Scurry $5,270,422 $2,870,750 $1,813,786 $1,393,549 38
Shackelford $925,624 $474,142 $309,083 $201,273 6
Shelby $6,268,859 $3,440,167 $2,358,427 $1,354,566 47
Sherman $470,921 $199,451 $121,443 $72,695 2
Smith $119,849,396 $61,199,329 $39,775,209 $21,146,251 770
Somervell $4,791,627 $2,341,536 $1,607,172 $615,238 30
Starr $5,697,408 $3,266,678 $2,259,599 $1,418,550 46
Stephens $2,722,634 $1,522,748 $1,001,543 $753,199 21
Sterling $341,668 $197,517 $130,573 $109,395 3
Stonewall $274,003 $156,209 $105,169 $73,099 2
Sutton $2,992,167 $1,600,974 $1,028,541 $774,453 21
Swisher $1,177,324 $545,848 $340,428 $204,387 7
Tarrant $1,261,981,511 $643,998,396 $421,503,781 $207,861,033 7,970
Taylor $64,678,392 $33,148,601 $21,661,132 $11,082,601 414
Terrell $143,660 $81,117 $53,573 $35,293 1
Terry $3,009,911 $1,525,059 $938,235 $779,236 20
Throckmorton $559,260 $285,127 $182,227 $116,602 4
Titus $13,284,231 $6,943,798 $4,677,738 $2,998,307 94
Tom Green $49,018,320 $24,773,362 $16,016,964 $8,660,443 314
Travis $723,658,149 $387,923,356 $254,259,385 $127,374,874 4,795
Trinity $2,046,297 $1,127,858 $754,738 $443,944 15
Tyler $3,485,415 $1,857,175 $1,239,205 $722,049 24
Upshur $7,862,789 $4,007,312 $2,607,937 $1,612,229 51
Upton $1,038,470 $526,905 $341,003 $195,572 7
Uvalde $7,063,877 $3,750,644 $2,500,346 $1,374,036 50
Val Verde $11,656,919 $6,670,876 $4,491,291 $2,462,633 89
Van Zandt $10,860,415 $6,174,979 $4,174,804 $2,417,946 84
Victoria $45,242,575 $23,506,070 $15,698,669 $8,519,441 301
Walker $12,359,611 $6,767,581 $4,525,243 $2,575,601 90
Waller $14,646,338 $6,655,714 $4,106,332 $2,932,703 85
Ward $4,004,423 $2,094,832 $1,353,152 $976,981 28
Washington $14,744,497 $7,972,945 $5,326,465 $2,867,999 103
Webb $60,442,829 $32,530,572 $21,672,809 $12,833,173 431
(continued)The Annual Benefits Resulting from Reduced Health Care Costs Associated
with the More Efficient Use of Advanced Practice Registered Nurses on Business Activity in Texas as of 2011
County Results

perrymangroup.com 56 © 2012 by The Perryman Group
Total Gross Personal Retail Employment
Expenditures Product Income Sales (Permanent
County (2011 Dollars) (2011 Dollars) (2011 Dollars) (2011 Dollars) Jobs)
Wharton $13,424,142 $7,298,089 $4,927,151 $2,846,712 98
Wheeler $1,632,808 $913,651 $609,293 $415,784 13
Wichita $56,003,365 $31,094,674 $20,803,751 $11,717,016 409
Wilbarger $5,495,829 $2,873,278 $1,918,233 $1,084,259 38
Willacy $2,980,952 $1,667,246 $1,099,515 $696,642 22
Williamson $103,690,447 $55,689,911 $36,820,342 $21,540,926 722
Wilson $7,155,463 $3,664,498 $2,440,073 $1,390,953 49
Winkler $2,326,263 $1,207,069 $784,251 $559,927 16
Wise $19,720,166 $10,196,216 $6,626,532 $4,335,890 133
Wood $10,773,999 $5,499,472 $3,627,608 $1,986,667 71
Yoakum $3,177,992 $1,557,031 $986,307 $766,099 20
Young $8,581,904 $4,524,563 $2,952,377 $1,924,193 59
Zapata $2,388,573 $1,288,290 $862,713 $586,695 18
Zavala $1,379,426 $822,069 $576,608 $343,051 12
TOTAL STATE IMPACT $16,082,527,790 $8,020,657,599 $5,225,538,514 $2,492,503,498 97,205
SOURCE: US Multi-Regional Impact Assessment System, The Perryman Group
(continued)The Annual Benefits Resulting from Reduced Health Care Costs Associated
with the More Efficient Use of Advanced Practice Registered Nurses on Business Activity in Texas as of 2011
County Results

perrymangroup.com 57 © 2012 by The Perryman Group
Economic Benefits as of 2020

perrymangroup.com 58 © 2012 by The Perryman Group
Total Gross Personal Employment
Expenditures Product Income (Permanent
Category (2011 Dollars) (2011 Dollars) (2011 Dollars) Jobs)
Agricultural Products & Services $423,544,425 $111,695,304 $76,070,715 1,035
Forestry & Fishery Products $12,096,171 $9,147,198 $3,392,522 35
Coal Mining $45,971,328 $13,366,026 $14,084,601 77
Crude Petroleum & Natural Gas $572,640,955 $125,530,653 $57,894,604 238
Miscellaneous Mining $14,220,063 $6,043,941 $3,552,895 29
New Construction $60,995,228 $26,841,833 $22,119,336 269
Maintenance & Repair Construction $521,795,674 $271,284,399 $223,555,128 2,709
Food Products & Tobacco $853,164,124 $216,443,438 $110,569,713 1,585
Textile Mill Products $12,361,281 $2,774,249 $2,347,299 40
Apparel $172,107,698 $95,317,280 $48,298,715 1,120
Paper & Allied Products $138,958,276 $61,514,214 $27,810,131 353
Printing & Publishing $209,140,893 $103,283,897 $67,415,738 975
Chemicals & Petroleum Refining $1,045,080,897 $192,018,792 $90,164,022 566
Rubber & Leather Products $127,759,274 $55,214,410 $32,278,017 541
Lumber Products & Furniture $55,262,023 $19,237,001 $13,714,983 236
Stone, Clay, & Glass Products $74,576,640 $39,762,947 $20,796,192 285
Primary Metal $75,036,086 $20,043,330 $14,919,328 181
Fabricated Metal Products $151,739,935 $55,645,014 $35,924,517 521
Machinery, Except Electrical $157,412,477 $62,597,216 $44,719,698 402
Electric & Electronic Equipment $123,656,265 $68,813,665 $41,139,163 288
Motor Vehicles & Equipment $81,979,220 $18,151,166 $11,792,218 138
Transp. Equip., Exc. Motor Vehicles $44,840,979 $20,954,088 $13,692,735 136
Instruments & Related Products $36,843,433 $14,918,323 $11,339,249 122
Miscellaneous Manufacturing $51,308,202 $19,894,872 $13,721,629 181
Transportation $1,404,749,558 $637,567,867 $421,664,632 5,019
Communication $596,556,881 $367,619,345 $156,948,535 1,183
Electric, Gas, Water, Sanitary Services $1,246,947,466 $281,386,674 $122,789,665 440
Wholesale Trade $763,917,113 $516,893,530 $298,045,439 2,868
Retail Trade $2,545,493,657 $2,109,473,071 $1,261,397,429 28,516
Finance $370,276,168 $207,456,204 $120,802,315 915
Insurance $1,015,512,958 $624,675,306 $373,455,414 3,864
Real Estate $3,192,480,821 $573,786,022 $92,449,287 700
Hotels, Lodging Places, Amusements $311,202,681 $161,084,796 $105,677,229 2,208
Personal Services $536,751,176 $331,023,010 $257,541,208 3,729
Business Services $1,340,875,617 $845,563,174 $689,762,947 7,228
Eating & Drinking Places $1,177,817,355 $689,834,552 $367,028,839 14,304
Health Services $3,642,474,589 $2,687,231,370 $2,272,078,908 32,357
Miscellaneous Services $731,941,432 $310,294,887 $268,999,863 5,531
Households $31,267,828 $31,267,828 $30,606,236 1,814
Total $23,970,756,845 $12,005,650,892 $7,840,561,094 122,735
SOURCE: US Multi-Regional Impact Assessment System, The Perryman Group
The Annual Benefits Resulting from Reduced Health Care Costs Associatedwith the More Efficient Use of Advanced Practice Registered Nurses on Business
Activity in Texas as of 2020Results by Detailed Industrial Category

perrymangroup.com 59 © 2012 by The Perryman Group
Total Gross Personal Retail Employment
Expenditures Product Income Sales (Permanent
Economic Region (2011 Dollars) (2011 Dollars) (2011 Dollars) (2011 Dollars) Jobs)
High Plains $509,308,894 $266,013,656 $174,723,609 $95,370,807 2,845
Northwest Texas $307,369,533 $163,735,418 $108,359,978 $61,263,299 1,788
Metroplex $7,974,260,833 $4,015,369,395 $2,598,814,840 $1,228,625,755 40,572
Upper East Texas $667,783,165 $351,153,269 $233,812,646 $126,987,344 3,825
Southeast Texas $452,919,396 $241,621,224 $163,127,170 $90,999,247 2,675
Gulf Coast $8,370,466,013 $3,992,017,859 $2,603,407,689 $1,099,083,848 39,374
Capital $1,399,988,126 $749,566,026 $492,923,754 $253,632,523 7,887
Central Texas $578,855,776 $303,991,423 $201,138,393 $109,076,306 3,314
Alamo $1,817,954,218 $944,941,376 $621,532,955 $313,834,927 9,976
South Texas $950,572,295 $496,606,815 $330,032,939 $179,456,924 5,434
West Texas $405,006,045 $209,743,714 $137,531,195 $78,906,720 2,247
Upper Rio Grande $536,272,552 $270,890,718 $175,155,925 $86,073,311 2,796
TOTAL STATE IMPACT $23,970,756,845 $12,005,650,892 $7,840,561,094 $3,723,311,011 122,735
SOURCE: US Multi-Regional Impact Assessment System, The Perryman Group
The Annual Benefits Resulting from Reduced Health Care Costs Associatedwith the More Efficient Use of Advanced Practice Registered Nurses on Business
Activity in Texas as of 2020Comptroller's Economic Region Results

perrymangroup.com 60 © 2012 by The Perryman Group
Total Gross Personal Retail Employment
Expenditures Product Income Sales (Permanent
COG (2011 Dollars) (2011 Dollars) (2011 Dollars) (2011 Dollars) Jobs)
Panhandle $266,103,016 $136,989,668 $89,709,775 $49,982,147 1,463
South Plains $243,205,879 $129,023,988 $85,013,834 $45,388,660 1,383
North Texas $131,142,400 $71,313,838 $47,541,435 $27,446,176 789
North Central Texas $7,869,660,807 $3,959,556,219 $2,561,611,487 $1,207,440,779 39,954
North East Texas $141,118,987 $74,991,971 $50,353,080 $28,974,948 835
East Texas $526,664,178 $276,161,297 $183,459,567 $98,012,395 2,990
West Central Texas $176,227,133 $92,421,579 $60,818,543 $33,817,123 1,000
Upper Rio Grande $536,272,552 $270,890,718 $175,155,925 $86,073,311 2,796
Permian Basin $311,859,271 $162,292,742 $106,766,285 $61,437,678 1,736
Concho Valley $93,146,774 $47,450,971 $30,764,910 $17,469,041 511
Heart of Texas $234,229,806 $119,247,352 $77,956,837 $40,893,321 1,275
Capital $1,399,988,126 $749,566,026 $492,923,754 $253,632,523 7,887
Brazos Valley $152,706,100 $80,221,578 $53,047,152 $29,633,129 878
Deep East Texas $152,368,014 $81,861,480 $55,006,953 $31,295,302 914
South East Texas $300,551,382 $159,759,744 $108,120,217 $59,703,945 1,761
Gulf Coast $8,370,466,013 $3,992,017,859 $2,603,407,689 $1,099,083,848 39,374
Golden Crescent $109,091,330 $56,395,938 $37,614,668 $21,033,701 614
Alamo $1,708,862,888 $888,545,438 $583,918,287 $292,801,226 9,362
South Texas $103,473,839 $56,227,264 $37,656,582 $22,545,757 634
Coastal Bend $393,654,975 $196,857,593 $130,246,278 $70,374,465 2,111
Lower Rio Grande Valley $403,694,057 $216,199,588 $143,793,489 $76,082,238 2,381
Texoma $104,600,026 $55,813,176 $37,203,353 $21,184,976 618
Central Texas $191,919,869 $104,522,493 $70,134,405 $38,549,856 1,161
Middle Rio Grande $49,749,425 $27,322,370 $18,336,591 $10,454,464 308
Border Region $1,093,402,447 $570,760,576 $375,022,364 $195,208,328 6,122
TOTAL STATE IMPACT $23,970,756,845 $12,005,650,892 $7,840,561,094 $3,723,311,011 122,735
SOURCE: US Multi-Regional Impact Assessment System, The Perryman Group
The Annual Benefits Resulting from Reduced Health Care Costs Associatedwith the More Efficient Use of Advanced Practice Registered Nurses on Business
Activity in Texas as of 2020Council of Governments (COG) Region Results

perrymangroup.com 61 © 2012 by The Perryman Group
Total Gross Personal Retail Employment
Expenditures Product Income Sales (Permanent
MSA (2011 Dollars) (2011 Dollars) (2011 Dollars) (2011 Dollars) Jobs)
Abilene $106,459,758 $54,762,693 $35,907,662 $18,417,172 578
Amarillo $184,341,292 $97,322,170 $64,109,127 $33,562,383 1,036
Austin-Round Rock-San Marcos $1,339,637,459 $718,804,867 $472,827,159 $242,452,912 7,557
Beaumont-Port Arthur $300,551,382 $159,759,744 $108,120,217 $59,703,945 1,761
Brownville-Harlingen $149,046,671 $77,827,783 $51,299,290 $27,121,595 850
College Station-Bryan $110,602,288 $57,659,381 $38,093,096 $20,665,802 628
Corpus Christi $334,653,891 $164,840,806 $108,800,978 $57,616,611 1,750
Dallas-Plano-Irving MD* $5,754,225,752 $2,875,630,016 $1,850,093,077 $851,480,125 28,579
Fort Worth-Arlington MD* $2,032,146,227 $1,041,088,040 $682,971,473 $340,219,874 10,903
El Paso $525,955,993 $265,357,481 $171,529,896 $83,749,174 2,735
Houston-Baytown-Sugar Land $8,305,449,241 $3,957,758,323 $2,580,512,936 $1,085,094,969 38,988
Killeen-Temple-Fort Hood $177,704,334 $96,966,577 $65,066,261 $35,439,701 1,076
Laredo $89,983,374 $48,659,080 $32,502,913 $19,157,594 545
Longview $174,973,526 $93,810,733 $62,997,652 $33,805,746 1,027
Lubbock $194,433,277 $103,656,317 $68,453,352 $34,531,104 1,102
McAllen-Edinburg-Pharr $250,213,697 $135,881,024 $90,847,651 $47,922,462 1,504
Midland $146,338,233 $75,880,589 $49,365,455 $27,825,063 791
Odessa $102,201,358 $54,144,269 $36,423,207 $20,248,947 594
San Angelo $74,227,638 $37,547,604 $24,310,489 $13,142,182 401
San Antonio-New Braunfels $1,653,096,233 $859,640,753 $564,838,016 $281,977,200 9,045
Sherman-Denison $65,444,002 $35,791,165 $23,986,723 $13,324,644 399
Texarkana $52,240,282 $28,608,470 $19,261,429 $10,450,200 316
Tyler $178,721,325 $91,633,640 $59,710,133 $31,582,374 972
Victoria $80,472,740 $41,066,471 $27,368,252 $15,177,228 444
Waco $193,630,380 $98,086,368 $63,866,728 $32,643,335 1,040
Wichita Falls $91,630,703 $50,701,847 $33,952,000 $19,121,929 561
Rural Area $1,302,375,790 $682,764,681 $453,345,921 $266,876,743 7,553
TOTAL STATE IMPACT $23,970,756,845 $12,005,650,892 $7,840,561,094 $3,723,311,011 122,735
*Metropolitan Division
SOURCE: US Multi-Regional Impact Assessment System, The Perryman Group
The Annual Benefits Resulting from Reduced Health Care Costs Associatedwith the More Efficient Use of Advanced Practice Registered Nurses on Business Activity
in Texas as of 2020Metropolitan Statistical Area (MSA) and Rural Texas Results
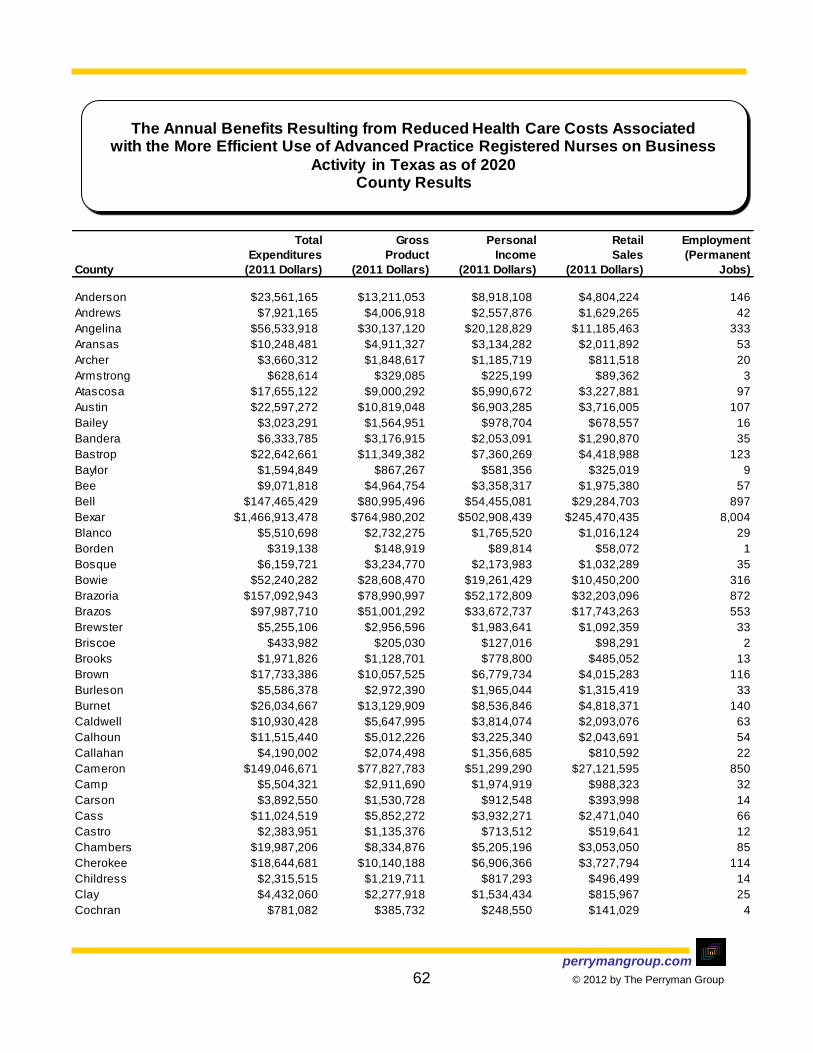
perrymangroup.com 62 © 2012 by The Perryman Group
Total Gross Personal Retail Employment
Expenditures Product Income Sales (Permanent
County (2011 Dollars) (2011 Dollars) (2011 Dollars) (2011 Dollars) Jobs)
Anderson $23,561,165 $13,211,053 $8,918,108 $4,804,224 146
Andrews $7,921,165 $4,006,918 $2,557,876 $1,629,265 42
Angelina $56,533,918 $30,137,120 $20,128,829 $11,185,463 333
Aransas $10,248,481 $4,911,327 $3,134,282 $2,011,892 53
Archer $3,660,312 $1,848,617 $1,185,719 $811,518 20
Armstrong $628,614 $329,085 $225,199 $89,362 3
Atascosa $17,655,122 $9,000,292 $5,990,672 $3,227,881 97
Austin $22,597,272 $10,819,048 $6,903,285 $3,716,005 107
Bailey $3,023,291 $1,564,951 $978,704 $678,557 16
Bandera $6,333,785 $3,176,915 $2,053,091 $1,290,870 35
Bastrop $22,642,661 $11,349,382 $7,360,269 $4,418,988 123
Baylor $1,594,849 $867,267 $581,356 $325,019 9
Bee $9,071,818 $4,964,754 $3,358,317 $1,975,380 57
Bell $147,465,429 $80,995,496 $54,455,081 $29,284,703 897
Bexar $1,466,913,478 $764,980,202 $502,908,439 $245,470,435 8,004
Blanco $5,510,698 $2,732,275 $1,765,520 $1,016,124 29
Borden $319,138 $148,919 $89,814 $58,072 1
Bosque $6,159,721 $3,234,770 $2,173,983 $1,032,289 35
Bowie $52,240,282 $28,608,470 $19,261,429 $10,450,200 316
Brazoria $157,092,943 $78,990,997 $52,172,809 $32,203,096 872
Brazos $97,987,710 $51,001,292 $33,672,737 $17,743,263 553
Brewster $5,255,106 $2,956,596 $1,983,641 $1,092,359 33
Briscoe $433,982 $205,030 $127,016 $98,291 2
Brooks $1,971,826 $1,128,701 $778,800 $485,052 13
Brown $17,733,386 $10,057,525 $6,779,734 $4,015,283 116
Burleson $5,586,378 $2,972,390 $1,965,044 $1,315,419 33
Burnet $26,034,667 $13,129,909 $8,536,846 $4,818,371 140
Caldwell $10,930,428 $5,647,995 $3,814,074 $2,093,076 63
Calhoun $11,515,440 $5,012,226 $3,225,340 $2,043,691 54
Callahan $4,190,002 $2,074,498 $1,356,685 $810,592 22
Cameron $149,046,671 $77,827,783 $51,299,290 $27,121,595 850
Camp $5,504,321 $2,911,690 $1,974,919 $988,323 32
Carson $3,892,550 $1,530,728 $912,548 $393,998 14
Cass $11,024,519 $5,852,272 $3,932,271 $2,471,040 66
Castro $2,383,951 $1,135,376 $713,512 $519,641 12
Chambers $19,987,206 $8,334,876 $5,205,196 $3,053,050 85
Cherokee $18,644,681 $10,140,188 $6,906,366 $3,727,794 114
Childress $2,315,515 $1,219,711 $817,293 $496,499 14
Clay $4,432,060 $2,277,918 $1,534,434 $815,967 25
Cochran $781,082 $385,732 $248,550 $141,029 4
The Annual Benefits Resulting from Reduced Health Care Costs Associatedwith the More Efficient Use of Advanced Practice Registered Nurses on Business
Activity in Texas as of 2020County Results
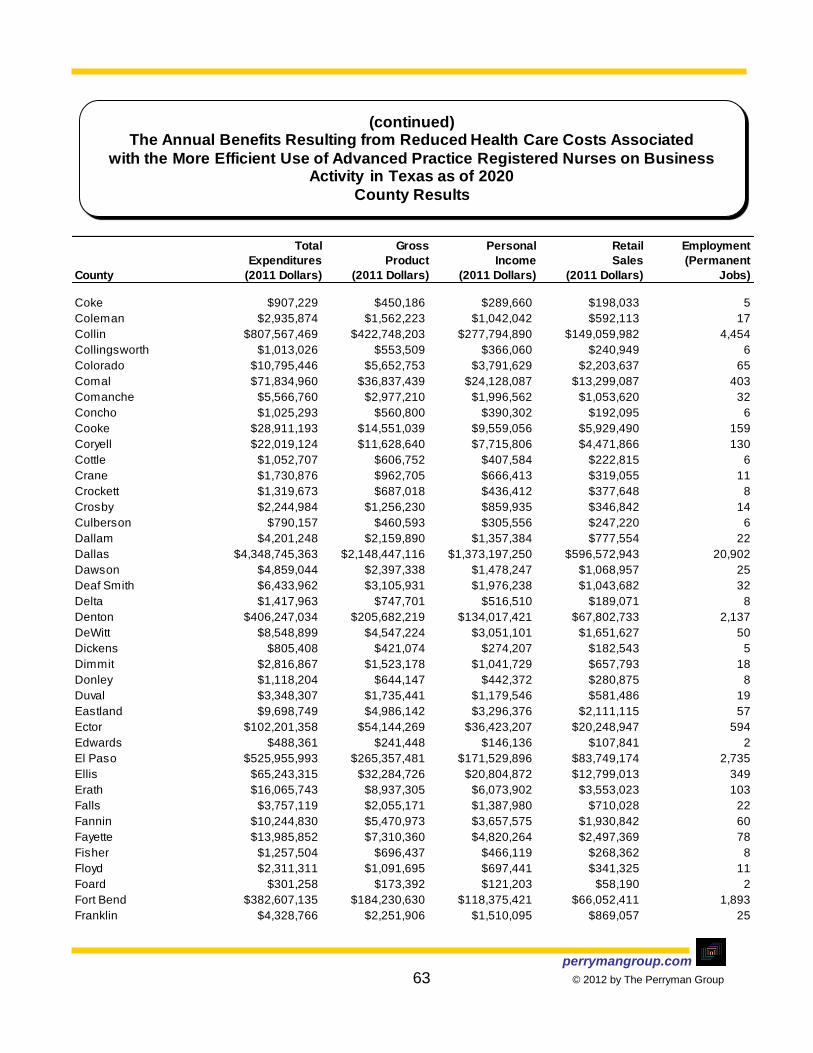
perrymangroup.com 63 © 2012 by The Perryman Group
Total Gross Personal Retail Employment
Expenditures Product Income Sales (Permanent
County (2011 Dollars) (2011 Dollars) (2011 Dollars) (2011 Dollars) Jobs)
Coke $907,229 $450,186 $289,660 $198,033 5
Coleman $2,935,874 $1,562,223 $1,042,042 $592,113 17
Collin $807,567,469 $422,748,203 $277,794,890 $149,059,982 4,454
Collingsworth $1,013,026 $553,509 $366,060 $240,949 6
Colorado $10,795,446 $5,652,753 $3,791,629 $2,203,637 65
Comal $71,834,960 $36,837,439 $24,128,087 $13,299,087 403
Comanche $5,566,760 $2,977,210 $1,996,562 $1,053,620 32
Concho $1,025,293 $560,800 $390,302 $192,095 6
Cooke $28,911,193 $14,551,039 $9,559,056 $5,929,490 159
Coryell $22,019,124 $11,628,640 $7,715,806 $4,471,866 130
Cottle $1,052,707 $606,752 $407,584 $222,815 6
Crane $1,730,876 $962,705 $666,413 $319,055 11
Crockett $1,319,673 $687,018 $436,412 $377,648 8
Crosby $2,244,984 $1,256,230 $859,935 $346,842 14
Culberson $790,157 $460,593 $305,556 $247,220 6
Dallam $4,201,248 $2,159,890 $1,357,384 $777,554 22
Dallas $4,348,745,363 $2,148,447,116 $1,373,197,250 $596,572,943 20,902
Dawson $4,859,044 $2,397,338 $1,478,247 $1,068,957 25
Deaf Smith $6,433,962 $3,105,931 $1,976,238 $1,043,682 32
Delta $1,417,963 $747,701 $516,510 $189,071 8
Denton $406,247,034 $205,682,219 $134,017,421 $67,802,733 2,137
DeWitt $8,548,899 $4,547,224 $3,051,101 $1,651,627 50
Dickens $805,408 $421,074 $274,207 $182,543 5
Dimmit $2,816,867 $1,523,178 $1,041,729 $657,793 18
Donley $1,118,204 $644,147 $442,372 $280,875 8
Duval $3,348,307 $1,735,441 $1,179,546 $581,486 19
Eastland $9,698,749 $4,986,142 $3,296,376 $2,111,115 57
Ector $102,201,358 $54,144,269 $36,423,207 $20,248,947 594
Edwards $488,361 $241,448 $146,136 $107,841 2
El Paso $525,955,993 $265,357,481 $171,529,896 $83,749,174 2,735
Ellis $65,243,315 $32,284,726 $20,804,872 $12,799,013 349
Erath $16,065,743 $8,937,305 $6,073,902 $3,553,023 103
Falls $3,757,119 $2,055,171 $1,387,980 $710,028 22
Fannin $10,244,830 $5,470,973 $3,657,575 $1,930,842 60
Fayette $13,985,852 $7,310,360 $4,820,264 $2,497,369 78
Fisher $1,257,504 $696,437 $466,119 $268,362 8
Floyd $2,311,311 $1,091,695 $697,441 $341,325 11
Foard $301,258 $173,392 $121,203 $58,190 2
Fort Bend $382,607,135 $184,230,630 $118,375,421 $66,052,411 1,893
Franklin $4,328,766 $2,251,906 $1,510,095 $869,057 25
(continued)The Annual Benefits Resulting from Reduced Health Care Costs Associated
with the More Efficient Use of Advanced Practice Registered Nurses on Business Activity in Texas as of 2020
County Results

perrymangroup.com 64 © 2012 by The Perryman Group
Total Gross Personal Retail Employment
Expenditures Product Income Sales (Permanent
County (2011 Dollars) (2011 Dollars) (2011 Dollars) (2011 Dollars) Jobs)
Freestone $8,771,201 $4,498,349 $2,932,902 $2,004,072 50
Frio $6,113,815 $3,085,412 $2,029,245 $1,137,229 33
Gaines $5,837,251 $2,695,827 $1,668,245 $1,125,426 27
Galveston $204,355,291 $103,687,929 $68,488,528 $36,585,118 1,110
Garza $2,430,414 $1,165,680 $740,491 $550,102 13
Gillespie $15,449,993 $7,950,262 $5,284,504 $2,926,324 88
Glasscock $352,464 $154,784 $93,202 $41,237 1
Goliad $1,576,546 $868,108 $592,336 $411,608 10
Gonzales $6,835,758 $3,638,458 $2,458,888 $1,357,979 40
Gray $16,808,023 $8,598,892 $5,780,082 $3,442,516 96
Grayson $65,444,002 $35,791,165 $23,986,723 $13,324,644 399
Gregg $137,581,273 $74,949,084 $50,482,708 $26,730,733 822
Grimes $8,412,469 $4,414,426 $2,955,725 $1,807,112 49
Guadalupe $45,387,830 $23,093,429 $14,986,791 $9,989,126 258
Hale $14,592,214 $8,134,950 $5,449,175 $3,501,494 94
Hall $1,494,654 $773,729 $497,720 $289,702 8
Hamilton $3,108,838 $1,650,061 $1,110,691 $668,648 19
Hansford $1,755,926 $734,698 $436,591 $273,951 7
Hardeman $885,427 $490,875 $323,546 $237,559 6
Hardin $20,913,795 $10,834,678 $7,103,564 $4,464,536 119
Harris $7,137,989,875 $3,381,646,787 $2,203,587,441 $879,369,718 32,913
Harrison $43,887,975 $21,861,145 $14,659,116 $7,166,576 231
Hartley $1,274,895 $611,070 $394,882 $228,965 7
Haskell $2,344,044 $1,260,655 $863,871 $450,263 14
Hays $69,007,834 $36,527,841 $24,082,022 $13,415,927 398
Hemphill $2,245,554 $1,053,714 $671,749 $390,637 11
Henderson $30,217,365 $15,441,966 $10,158,046 $5,541,493 167
Hidalgo $250,213,697 $135,881,024 $90,847,651 $47,922,462 1,504
Hill $13,211,108 $6,646,815 $4,362,587 $2,572,626 74
Hockley $9,865,598 $5,185,585 $3,482,584 $2,146,185 59
Hood $23,761,971 $12,120,777 $8,054,127 $4,552,213 133
Hopkins $14,945,043 $7,915,802 $5,215,061 $3,448,882 89
Houston $9,496,060 $4,912,952 $3,301,457 $1,461,981 51
Howard $18,069,550 $9,381,553 $6,264,461 $3,561,899 103
Hudspeth $783,815 $398,898 $237,356 $263,174 5
Hunt $41,818,537 $22,248,729 $14,770,898 $9,113,136 250
Hutchinson $12,793,445 $6,187,664 $3,966,289 $3,362,870 70
Irion $1,173,925 $486,081 $286,232 $214,477 5
Jack $4,599,040 $2,256,768 $1,454,701 $1,043,343 25
Jackson $4,748,628 $2,446,088 $1,570,879 $1,109,237 27
(continued)The Annual Benefits Resulting from Reduced Health Care Costs Associated
with the More Efficient Use of Advanced Practice Registered Nurses on Business Activity in Texas as of 2020
County Results

perrymangroup.com 65 © 2012 by The Perryman Group
Total Gross Personal Retail Employment
Expenditures Product Income Sales (Permanent
County (2011 Dollars) (2011 Dollars) (2011 Dollars) (2011 Dollars) Jobs)
Jasper $14,910,108 $8,094,526 $5,468,459 $3,197,443 92
Jeff Davis $952,987 $499,578 $333,261 $190,723 6
Jefferson $240,891,338 $128,351,186 $87,134,752 $46,817,308 1,410
Jim Hogg $1,466,710 $761,264 $477,698 $399,084 9
Jim Wells $24,068,364 $13,559,761 $9,111,791 $5,298,031 152
Johnson $70,993,344 $37,414,693 $25,092,210 $13,707,371 415
Jones $5,836,077 $3,068,792 $2,053,116 $1,060,777 33
Karnes $4,713,700 $2,317,978 $1,522,970 $879,219 25
Kaufman $43,117,009 $22,396,671 $14,925,747 $8,402,804 250
Kendall $21,780,098 $10,824,227 $7,052,307 $4,233,884 117
Kenedy $198,967 $96,973 $61,686 $66,763 1
Kent $248,863 $115,491 $71,053 $47,522 1
Kerr $29,489,147 $15,551,033 $10,243,552 $5,881,255 171
Kimble $2,202,683 $1,030,244 $641,467 $440,670 11
King $96,158 $45,820 $28,551 $13,228 0
Kinney $945,726 $458,953 $286,906 $187,752 5
Kleberg $13,875,697 $7,282,302 $4,863,543 $2,749,406 81
Knox $1,066,673 $579,163 $390,311 $187,551 6
La Salle $1,940,313 $1,072,494 $726,049 $460,005 13
Lamar $28,455,598 $14,851,220 $9,981,851 $5,651,798 166
Lamb $3,746,737 $1,831,256 $1,190,631 $713,973 19
Lampasas $8,219,780 $4,342,441 $2,895,374 $1,683,131 49
Lavaca $8,485,305 $4,697,697 $3,165,549 $1,737,630 53
Lee $7,717,506 $3,922,762 $2,559,516 $1,485,483 42
Leon $6,696,759 $3,553,615 $2,239,269 $1,778,715 39
Liberty $33,385,028 $17,764,239 $12,003,507 $6,453,039 195
Limestone $8,700,277 $4,725,878 $3,232,657 $1,930,971 54
Lipscomb $1,270,521 $568,810 $348,131 $193,411 6
Live Oak $4,279,225 $2,156,490 $1,415,410 $976,459 24
Llano $7,101,943 $3,665,853 $2,414,448 $1,362,265 40
Loving $8,115 $2,833 $1,829 $1,126 0
Lubbock $192,188,292 $102,400,087 $67,593,417 $34,184,262 1,089
Lynn $1,444,859 $705,064 $443,748 $185,133 7
Madison $4,988,488 $2,653,916 $1,766,166 $1,100,581 30
Marion $3,157,439 $1,662,117 $1,116,996 $659,071 19
Martin $2,480,027 $1,262,483 $844,931 $426,878 13
Mason $1,748,027 $890,141 $583,686 $333,704 10
Matagorda $21,136,771 $10,271,256 $6,708,471 $4,801,562 115
Maverick $12,484,870 $6,649,934 $4,425,760 $2,595,717 75
McCulloch $3,687,164 $1,993,563 $1,347,140 $768,643 22
(continued)The Annual Benefits Resulting from Reduced Health Care Costs Associated
with the More Efficient Use of Advanced Practice Registered Nurses on Business Activity in Texas as of 2020
County Results

perrymangroup.com 66 © 2012 by The Perryman Group
Total Gross Personal Retail Employment
Expenditures Product Income Sales (Permanent
County (2011 Dollars) (2011 Dollars) (2011 Dollars) (2011 Dollars) Jobs)
McLennan $193,630,380 $98,086,368 $63,866,728 $32,643,335 1,040
McMullen $184,708 $82,399 $49,868 $27,804 1
Medina $12,576,638 $6,268,575 $4,073,740 $2,396,646 69
Menard $571,335 $298,876 $188,401 $144,830 3
Midland $146,338,233 $75,880,589 $49,365,455 $27,825,063 791
Milam $8,153,371 $4,223,164 $2,828,229 $1,753,588 47
Mills $1,294,712 $777,909 $534,222 $310,259 9
Mitchell $2,821,962 $1,543,286 $1,036,423 $597,945 17
Montague $10,108,276 $5,148,211 $3,400,027 $1,944,983 57
Montgomery $320,370,157 $159,663,002 $105,869,609 $52,179,059 1,677
Moore $12,414,328 $5,513,497 $3,468,379 $2,231,091 57
Morris $5,436,829 $2,571,825 $1,724,063 $790,411 27
Motley $499,961 $246,292 $156,361 $96,228 3
Nacogdoches $25,540,946 $13,975,702 $9,504,995 $5,508,276 162
Navarro $22,601,573 $11,667,208 $7,801,999 $3,988,722 127
Newton $1,474,209 $906,548 $627,282 $428,697 11
Nolan $7,701,664 $4,104,581 $2,679,915 $1,581,368 44
Nueces $297,326,979 $146,202,585 $96,425,971 $49,883,737 1,542
Ochiltree $5,911,350 $2,781,874 $1,766,120 $1,146,585 29
Oldham $284,195 $155,584 $101,477 $94,801 2
Orange $38,746,249 $20,573,880 $13,881,901 $8,422,100 232
Palo Pinto $15,110,086 $7,342,232 $4,710,973 $2,915,683 79
Panola $13,316,540 $6,886,196 $4,629,591 $2,594,507 76
Parker $50,262,372 $24,292,537 $15,469,747 $9,530,241 259
Parmer $2,673,343 $1,161,238 $751,758 $255,299 11
Pecos $7,047,313 $3,607,571 $2,352,616 $1,603,099 41
Polk $15,812,911 $8,528,208 $5,637,805 $3,502,166 94
Potter $130,684,760 $69,507,654 $46,042,097 $23,552,075 740
Presidio $2,534,494 $1,217,572 $766,214 $530,661 13
Rains $2,517,628 $1,168,644 $712,395 $577,897 12
Randall $49,135,368 $25,954,704 $16,929,284 $9,526,948 278
Reagan $1,552,761 $797,705 $488,653 $423,933 9
Real $1,122,918 $558,307 $365,045 $210,934 6
Red River $3,405,899 $1,774,481 $1,180,061 $624,265 19
Reeves $3,539,027 $1,813,253 $1,174,772 $888,567 21
Refugio $2,002,171 $1,009,967 $626,339 $597,474 12
Roberts $62,252 $28,379 $17,064 $17,997 0
Robertson $7,028,200 $3,685,700 $2,455,315 $1,607,120 42
Rockwall $40,069,063 $21,074,650 $14,065,488 $7,540,443 229
Runnels $3,919,168 $1,860,508 $1,192,524 $705,975 20
(continued)The Annual Benefits Resulting from Reduced Health Care Costs Associated
with the More Efficient Use of Advanced Practice Registered Nurses on Business Activity in Texas as of 2020
County Results

perrymangroup.com 67 © 2012 by The Perryman Group
Total Gross Personal Retail Employment
Expenditures Product Income Sales (Permanent
County (2011 Dollars) (2011 Dollars) (2011 Dollars) (2011 Dollars) Jobs)
Rusk $25,727,311 $12,890,259 $8,620,654 $4,673,464 140
Sabine $3,169,836 $1,698,203 $1,173,256 $690,793 20
San Augustine $2,567,815 $1,310,541 $875,545 $458,214 14
San Jacinto $5,322,158 $2,705,658 $1,778,102 $1,104,960 30
San Patricio $27,078,432 $13,726,894 $9,240,725 $5,720,982 156
San Saba $1,658,616 $904,782 $595,003 $377,660 10
Schleicher $954,001 $511,640 $356,526 $126,511 6
Scurry $7,814,146 $4,274,978 $2,704,717 $2,080,898 48
Shackelford $1,373,123 $707,150 $462,099 $300,533 8
Shelby $9,329,838 $5,142,403 $3,532,013 $2,021,346 59
Sherman $697,367 $295,958 $180,256 $108,580 3
Smith $178,721,325 $91,633,640 $59,710,133 $31,582,374 972
Somervell $7,167,419 $3,518,343 $2,422,445 $920,209 38
Starr $8,473,887 $4,882,219 $3,384,051 $2,113,440 58
Stephens $4,050,829 $2,276,069 $1,500,158 $1,124,418 26
Sterling $507,020 $294,624 $195,087 $163,371 4
Stonewall $405,940 $232,651 $156,936 $108,921 3
Sutton $4,443,949 $2,388,571 $1,537,086 $1,157,422 27
Swisher $1,745,812 $812,292 $507,153 $305,056 8
Tarrant $1,881,614,482 $964,176,721 $632,510,509 $310,510,677 10,063
Taylor $96,433,679 $49,619,402 $32,497,862 $16,545,802 523
Terrell $212,575 $120,636 $79,778 $52,557 1
Terry $4,467,035 $2,272,099 $1,400,057 $1,163,110 25
Throckmorton $828,690 $424,817 $272,041 $174,064 5
Titus $19,864,089 $10,418,295 $7,031,740 $4,480,225 119
Tom Green $73,053,713 $37,061,523 $24,024,257 $12,927,705 397
Travis $1,082,410,901 $582,001,558 $382,412,271 $190,375,161 6,065
Trinity $3,035,428 $1,680,391 $1,126,989 $660,831 19
Tyler $5,174,788 $2,769,229 $1,852,219 $1,075,134 31
Upshur $11,664,941 $5,971,390 $3,894,290 $2,401,549 64
Upton $1,540,603 $785,747 $509,670 $291,974 8
Uvalde $10,517,300 $5,606,347 $3,745,879 $2,049,272 62
Val Verde $17,373,348 $9,979,576 $6,733,354 $3,673,393 112
Van Zandt $16,145,557 $9,221,172 $6,246,769 $3,602,713 105
Victoria $67,380,754 $35,186,137 $23,550,577 $12,721,929 380
Walker $18,415,633 $10,121,411 $6,783,450 $3,839,979 113
Waller $21,742,175 $9,915,157 $6,129,037 $4,378,513 107
Ward $5,954,787 $3,128,863 $2,025,188 $1,459,217 35
Washington $22,006,097 $11,940,240 $7,992,897 $4,280,920 130
Webb $89,983,374 $48,659,080 $32,502,913 $19,157,594 545
(continued)The Annual Benefits Resulting from Reduced Health Care Costs Associated
with the More Efficient Use of Advanced Practice Registered Nurses on Business Activity in Texas as of 2020
County Results
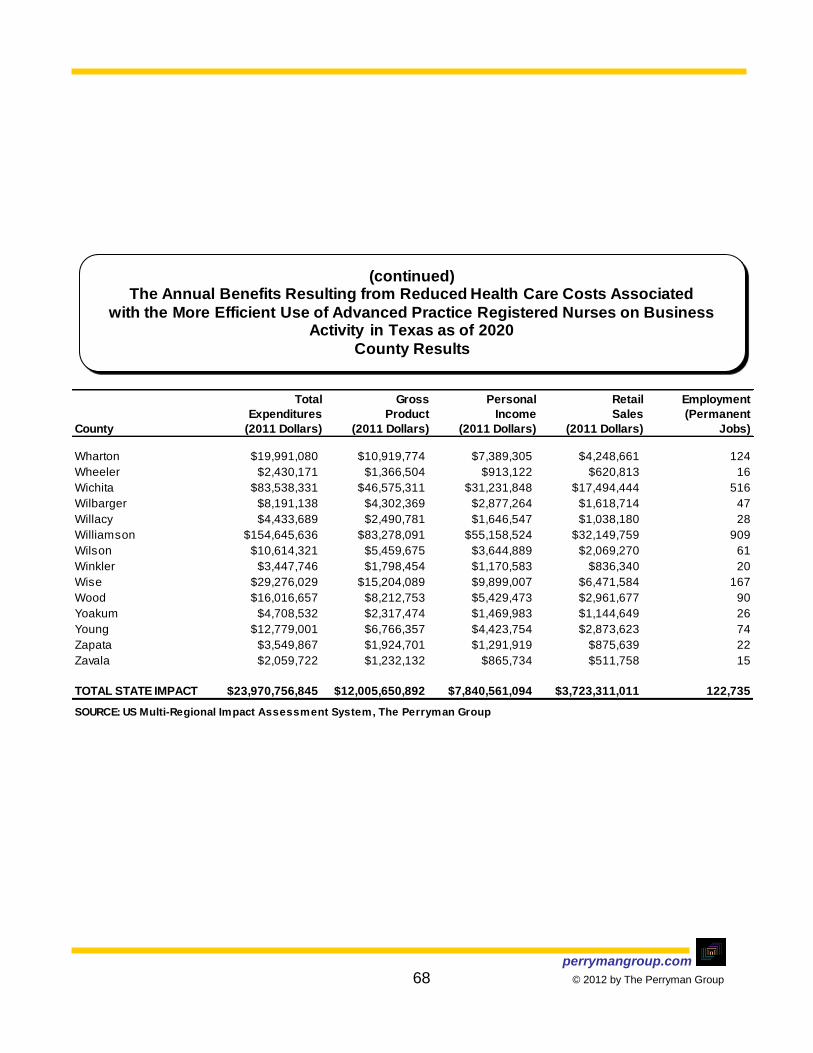
perrymangroup.com 68 © 2012 by The Perryman Group
Total Gross Personal Retail Employment
Expenditures Product Income Sales (Permanent
County (2011 Dollars) (2011 Dollars) (2011 Dollars) (2011 Dollars) Jobs)
Wharton $19,991,080 $10,919,774 $7,389,305 $4,248,661 124
Wheeler $2,430,171 $1,366,504 $913,122 $620,813 16
Wichita $83,538,331 $46,575,311 $31,231,848 $17,494,444 516
Wilbarger $8,191,138 $4,302,369 $2,877,264 $1,618,714 47
Willacy $4,433,689 $2,490,781 $1,646,547 $1,038,180 28
Williamson $154,645,636 $83,278,091 $55,158,524 $32,149,759 909
Wilson $10,614,321 $5,459,675 $3,644,889 $2,069,270 61
Winkler $3,447,746 $1,798,454 $1,170,583 $836,340 20
Wise $29,276,029 $15,204,089 $9,899,007 $6,471,584 167
Wood $16,016,657 $8,212,753 $5,429,473 $2,961,677 90
Yoakum $4,708,532 $2,317,474 $1,469,983 $1,144,649 26
Young $12,779,001 $6,766,357 $4,423,754 $2,873,623 74
Zapata $3,549,867 $1,924,701 $1,291,919 $875,639 22
Zavala $2,059,722 $1,232,132 $865,734 $511,758 15
TOTAL STATE IMPACT $23,970,756,845 $12,005,650,892 $7,840,561,094 $3,723,311,011 122,735
SOURCE: US Multi-Regional Impact Assessment System, The Perryman Group
(continued)The Annual Benefits Resulting from Reduced Health Care Costs Associated
with the More Efficient Use of Advanced Practice Registered Nurses on Business Activity in Texas as of 2020
County Results

perrymangroup.com 69 © 2012 by The Perryman Group
Economic Benefits as of 2030
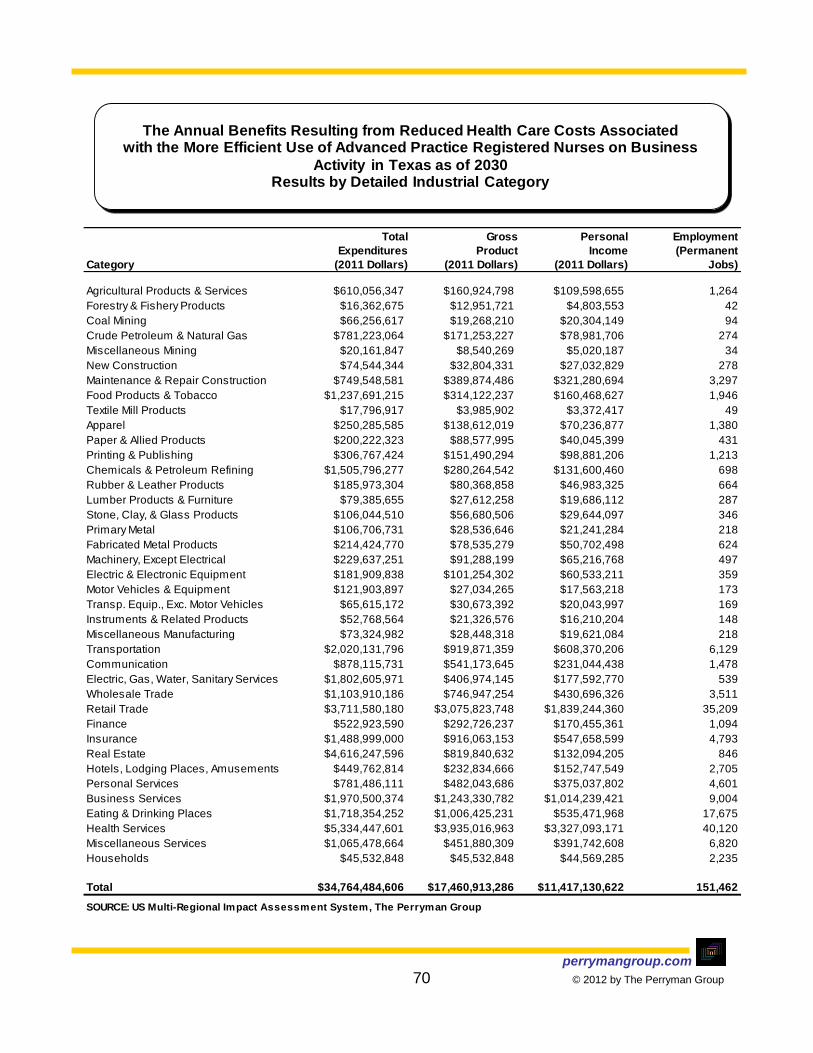
perrymangroup.com 70 © 2012 by The Perryman Group
Total Gross Personal Employment
Expenditures Product Income (Permanent
Category (2011 Dollars) (2011 Dollars) (2011 Dollars) Jobs)
Agricultural Products & Services $610,056,347 $160,924,798 $109,598,655 1,264
Forestry & Fishery Products $16,362,675 $12,951,721 $4,803,553 42
Coal Mining $66,256,617 $19,268,210 $20,304,149 94
Crude Petroleum & Natural Gas $781,223,064 $171,253,227 $78,981,706 274
Miscellaneous Mining $20,161,847 $8,540,269 $5,020,187 34
New Construction $74,544,344 $32,804,331 $27,032,829 278
Maintenance & Repair Construction $749,548,581 $389,874,486 $321,280,694 3,297
Food Products & Tobacco $1,237,691,215 $314,122,237 $160,468,627 1,946
Textile Mill Products $17,796,917 $3,985,902 $3,372,417 49
Apparel $250,285,585 $138,612,019 $70,236,877 1,380
Paper & Allied Products $200,222,323 $88,577,995 $40,045,399 431
Printing & Publishing $306,767,424 $151,490,294 $98,881,206 1,213
Chemicals & Petroleum Refining $1,505,796,277 $280,264,542 $131,600,460 698
Rubber & Leather Products $185,973,304 $80,368,858 $46,983,325 664
Lumber Products & Furniture $79,385,655 $27,612,258 $19,686,112 287
Stone, Clay, & Glass Products $106,044,510 $56,680,506 $29,644,097 346
Primary Metal $106,706,731 $28,536,646 $21,241,284 218
Fabricated Metal Products $214,424,770 $78,535,279 $50,702,498 624
Machinery, Except Electrical $229,637,251 $91,288,199 $65,216,768 497
Electric & Electronic Equipment $181,909,838 $101,254,302 $60,533,211 359
Motor Vehicles & Equipment $121,903,897 $27,034,265 $17,563,218 173
Transp. Equip., Exc. Motor Vehicles $65,615,172 $30,673,392 $20,043,997 169
Instruments & Related Products $52,768,564 $21,326,576 $16,210,204 148
Miscellaneous Manufacturing $73,324,982 $28,448,318 $19,621,084 218
Transportation $2,020,131,796 $919,871,359 $608,370,206 6,129
Communication $878,115,731 $541,173,645 $231,044,438 1,478
Electric, Gas, Water, Sanitary Services $1,802,605,971 $406,974,145 $177,592,770 539
Wholesale Trade $1,103,910,186 $746,947,254 $430,696,326 3,511
Retail Trade $3,711,580,180 $3,075,823,748 $1,839,244,360 35,209
Finance $522,923,590 $292,726,237 $170,455,361 1,094
Insurance $1,488,999,000 $916,063,153 $547,658,599 4,793
Real Estate $4,616,247,596 $819,840,632 $132,094,205 846
Hotels, Lodging Places, Amusements $449,762,814 $232,834,666 $152,747,549 2,705
Personal Services $781,486,111 $482,043,686 $375,037,802 4,601
Business Services $1,970,500,374 $1,243,330,782 $1,014,239,421 9,004
Eating & Drinking Places $1,718,354,252 $1,006,425,231 $535,471,968 17,675
Health Services $5,334,447,601 $3,935,016,963 $3,327,093,171 40,120
Miscellaneous Services $1,065,478,664 $451,880,309 $391,742,608 6,820
Households $45,532,848 $45,532,848 $44,569,285 2,235
Total $34,764,484,606 $17,460,913,286 $11,417,130,622 151,462
SOURCE: US Multi-Regional Impact Assessment System, The Perryman Group
The Annual Benefits Resulting from Reduced Health Care Costs Associatedwith the More Efficient Use of Advanced Practice Registered Nurses on Business
Activity in Texas as of 2030Results by Detailed Industrial Category

perrymangroup.com 71 © 2012 by The Perryman Group
Total Gross Personal Retail Employment
Expenditures Product Income Sales (Permanent
Economic Region (2011 Dollars) (2011 Dollars) (2011 Dollars) (2011 Dollars) Jobs)
High Plains $739,416,775 $387,229,838 $254,587,172 $139,166,498 3,514
Northwest Texas $446,522,478 $238,582,266 $158,054,812 $89,489,932 2,211
Metroplex $11,564,559,550 $5,837,848,178 $3,783,021,455 $1,790,835,937 50,046
Upper East Texas $969,589,290 $511,359,572 $340,836,972 $185,401,591 4,726
Southeast Texas $658,198,880 $352,095,752 $237,895,199 $132,843,467 3,305
Gulf Coast $12,117,580,129 $5,799,065,702 $3,787,111,580 $1,601,894,905 48,551
Capital $2,035,236,203 $1,091,451,106 $718,521,028 $369,857,159 9,738
Central Texas $842,337,499 $443,256,256 $293,607,758 $159,429,288 4,100
Alamo $2,642,785,897 $1,376,716,414 $906,393,455 $458,111,443 12,325
South Texas $1,381,569,908 $723,725,144 $481,473,237 $262,170,382 6,719
West Texas $586,939,343 $305,021,126 $200,231,965 $115,107,383 2,773
Upper Rio Grande $779,748,654 $394,561,931 $255,395,989 $125,626,447 3,454
TOTAL STATE IMPACT $34,764,484,606 $17,460,913,286 $11,417,130,622 $5,429,934,432 151,462
SOURCE: US Multi-Regional Impact Assessment System, The Perryman Group
The Annual Benefits Resulting from Reduced Health Care Costs Associatedwith the More Efficient Use of Advanced Practice Registered Nurses on Business
Activity in Texas as of 2030Comptroller's Economic Region Results

perrymangroup.com 72 © 2012 by The Perryman Group
Total Gross Personal Retail Employment
Expenditures Product Income Sales (Permanent
COG (2011 Dollars) (2011 Dollars) (2011 Dollars) (2011 Dollars) Jobs)
Panhandle $385,835,768 $199,261,601 $130,620,522 $72,914,882 1,805
South Plains $353,581,007 $187,968,237 $123,966,650 $66,251,616 1,708
North Texas $190,430,187 $103,888,631 $69,329,447 $40,084,873 975
North Central Texas $11,412,450,605 $5,756,486,167 $3,728,742,630 $1,759,891,718 49,282
North East Texas $205,141,997 $109,271,203 $73,428,662 $42,313,938 1,032
East Texas $764,447,293 $402,088,369 $267,408,310 $143,087,652 3,694
West Central Texas $256,092,291 $134,693,635 $88,725,365 $49,405,059 1,236
Upper Rio Grande $779,748,654 $394,561,931 $255,395,989 $125,626,447 3,454
Permian Basin $451,653,498 $235,916,993 $155,372,601 $89,592,783 2,142
Concho Valley $135,285,845 $69,104,132 $44,859,364 $25,514,600 631
Heart of Texas $340,336,766 $173,596,617 $113,616,367 $59,679,483 1,575
Capital $2,035,236,203 $1,091,451,106 $718,521,028 $369,857,159 9,738
Brazos Valley $222,005,870 $116,903,215 $77,390,566 $43,287,164 1,085
Deep East Texas $221,885,831 $119,486,030 $80,358,402 $45,772,827 1,132
South East Texas $436,313,049 $232,609,722 $157,536,797 $87,070,640 2,174
Gulf Coast $12,117,580,129 $5,799,065,702 $3,787,111,580 $1,601,894,905 48,551
Golden Crescent $158,230,201 $82,102,166 $54,812,487 $30,707,516 759
Alamo $2,484,555,696 $1,294,614,248 $851,580,968 $427,403,927 11,567
South Texas $150,264,129 $81,911,730 $54,930,223 $32,944,339 784
Coastal Bend $571,295,207 $286,649,881 $189,872,569 $102,733,445 2,608
Lower Rio Grande Valley $587,522,938 $315,264,950 $209,866,908 $111,192,645 2,945
Texoma $152,108,945 $81,362,011 $54,278,825 $30,944,220 764
Central Texas $279,994,863 $152,756,424 $102,600,825 $56,462,641 1,439
Middle Rio Grande $72,487,634 $39,898,583 $26,803,537 $15,299,952 382
Border Region $1,590,333,223 $831,813,750 $547,113,503 $285,140,574 7,567
TOTAL STATE IMPACT $34,764,484,606 $17,460,913,286 $11,417,130,622 $5,429,934,432 151,462
SOURCE: US Multi-Regional Impact Assessment System, The Perryman Group
The Annual Benefits Resulting from Reduced Health Care Costs Associatedwith the More Efficient Use of Advanced Practice Registered Nurses on Business
Activity in Texas as of 2030Council of Governments (COG) Region Results

perrymangroup.com 73 © 2012 by The Perryman Group
Total Gross Personal Retail Employment
Expenditures Product Income Sales (Permanent
MSA (2011 Dollars) (2011 Dollars) (2011 Dollars) (2011 Dollars) Jobs)
Abilene $154,732,134 $79,818,402 $52,392,248 $26,904,390 715
Amarillo $267,524,872 $141,643,169 $93,403,229 $48,968,795 1,279
Austin-Round Rock-San Marcos $1,947,432,209 $1,046,586,546 $689,177,912 $353,501,187 9,330
Beaumont-Port Arthur $436,313,049 $232,609,722 $157,536,797 $87,070,640 2,174
Brownville-Harlingen $217,035,116 $113,517,382 $74,902,839 $39,641,777 1,051
College Station-Bryan $160,835,953 $84,039,238 $55,589,844 $30,191,399 777
Corpus Christi $485,597,525 $239,979,610 $158,576,752 $84,088,058 2,162
Dallas-Plano-Irving MD* $8,341,654,957 $4,179,032,200 $2,692,136,627 $1,240,608,909 35,240
Fort Worth-Arlington MD* $2,949,561,227 $1,514,966,985 $994,917,140 $496,267,260 13,458
El Paso $764,735,310 $386,493,974 $250,103,824 $122,230,530 3,378
Houston-Baytown-Sugar Land $12,023,194,968 $5,749,168,431 $3,753,733,217 $1,581,470,960 48,073
Killeen-Temple-Fort Hood $259,319,762 $141,737,883 $95,204,032 $51,912,050 1,334
Laredo $130,613,083 $70,850,250 $47,390,581 $27,979,599 673
Longview $253,610,681 $136,408,535 $91,693,003 $49,294,188 1,267
Lubbock $282,821,465 $151,056,232 $99,848,689 $50,405,722 1,362
McAllen-Edinburg-Pharr $364,014,303 $198,101,513 $132,551,276 $70,028,785 1,859
Midland $211,870,044 $110,254,697 $71,810,371 $40,559,755 976
Odessa $148,056,186 $78,742,882 $53,026,493 $29,525,278 734
San Angelo $107,843,788 $54,693,124 $35,456,385 $19,196,546 496
San Antonio-New Braunfels $2,403,339,151 $1,252,426,066 $823,695,603 $411,570,298 11,174
Sherman-Denison $95,236,187 $52,183,898 $34,997,699 $19,458,472 493
Texarkana $75,989,971 $41,709,829 $28,104,534 $15,266,403 391
Tyler $259,303,620 $133,352,113 $87,008,025 $46,076,312 1,200
Victoria $116,614,395 $59,749,528 $39,858,708 $22,146,250 548
Waco $281,227,636 $142,708,899 $93,026,828 $47,606,154 1,283
Wichita Falls $133,063,533 $73,862,946 $49,513,165 $27,923,725 693
Rural Area $1,892,943,481 $995,219,232 $661,474,799 $390,040,991 9,341
TOTAL STATE IMPACT $34,764,484,606 $17,460,913,286 $11,417,130,622 $5,429,934,432 151,462
*Metropolitan Division
SOURCE: US Multi-Regional Impact Assessment System, The Perryman Group
The Annual Benefits Resulting from Reduced Health Care Costs Associatedwith the More Efficient Use of Advanced Practice Registered Nurses on Business Activity
in Texas as of 2030Metropolitan Statistical Area (MSA) and Rural Texas Results
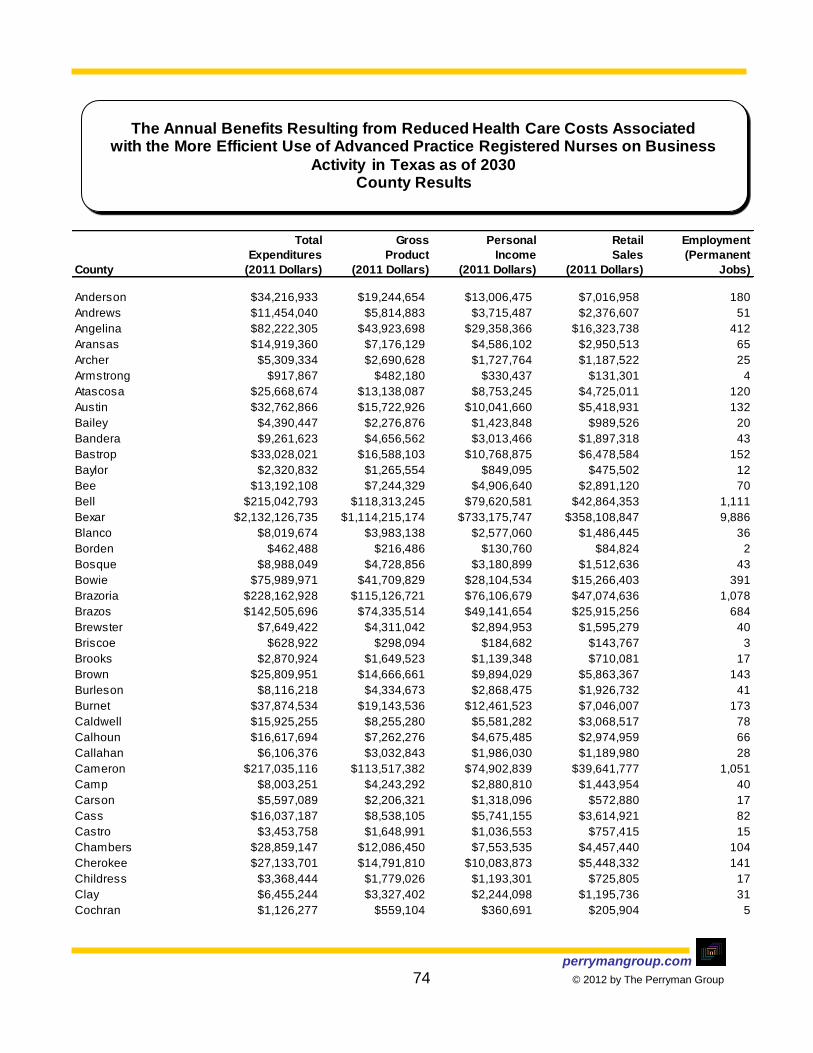
perrymangroup.com 74 © 2012 by The Perryman Group
Total Gross Personal Retail Employment
Expenditures Product Income Sales (Permanent
County (2011 Dollars) (2011 Dollars) (2011 Dollars) (2011 Dollars) Jobs)
Anderson $34,216,933 $19,244,654 $13,006,475 $7,016,958 180
Andrews $11,454,040 $5,814,883 $3,715,487 $2,376,607 51
Angelina $82,222,305 $43,923,698 $29,358,366 $16,323,738 412
Aransas $14,919,360 $7,176,129 $4,586,102 $2,950,513 65
Archer $5,309,334 $2,690,628 $1,727,764 $1,187,522 25
Armstrong $917,867 $482,180 $330,437 $131,301 4
Atascosa $25,668,674 $13,138,087 $8,753,245 $4,725,011 120
Austin $32,762,866 $15,722,926 $10,041,660 $5,418,931 132
Bailey $4,390,447 $2,276,876 $1,423,848 $989,526 20
Bandera $9,261,623 $4,656,562 $3,013,466 $1,897,318 43
Bastrop $33,028,021 $16,588,103 $10,768,875 $6,478,584 152
Baylor $2,320,832 $1,265,554 $849,095 $475,502 12
Bee $13,192,108 $7,244,329 $4,906,640 $2,891,120 70
Bell $215,042,793 $118,313,245 $79,620,581 $42,864,353 1,111
Bexar $2,132,126,735 $1,114,215,174 $733,175,747 $358,108,847 9,886
Blanco $8,019,674 $3,983,138 $2,577,060 $1,486,445 36
Borden $462,488 $216,486 $130,760 $84,824 2
Bosque $8,988,049 $4,728,856 $3,180,899 $1,512,636 43
Bowie $75,989,971 $41,709,829 $28,104,534 $15,266,403 391
Brazoria $228,162,928 $115,126,721 $76,106,679 $47,074,636 1,078
Brazos $142,505,696 $74,335,514 $49,141,654 $25,915,256 684
Brewster $7,649,422 $4,311,042 $2,894,953 $1,595,279 40
Briscoe $628,922 $298,094 $184,682 $143,767 3
Brooks $2,870,924 $1,649,523 $1,139,348 $710,081 17
Brown $25,809,951 $14,666,661 $9,894,029 $5,863,367 143
Burleson $8,116,218 $4,334,673 $2,868,475 $1,926,732 41
Burnet $37,874,534 $19,143,536 $12,461,523 $7,046,007 173
Caldwell $15,925,255 $8,255,280 $5,581,282 $3,068,517 78
Calhoun $16,617,694 $7,262,276 $4,675,485 $2,974,959 66
Callahan $6,106,376 $3,032,843 $1,986,030 $1,189,980 28
Cameron $217,035,116 $113,517,382 $74,902,839 $39,641,777 1,051
Camp $8,003,251 $4,243,292 $2,880,810 $1,443,954 40
Carson $5,597,089 $2,206,321 $1,318,096 $572,880 17
Cass $16,037,187 $8,538,105 $5,741,155 $3,614,921 82
Castro $3,453,758 $1,648,991 $1,036,553 $757,415 15
Chambers $28,859,147 $12,086,450 $7,553,535 $4,457,440 104
Cherokee $27,133,701 $14,791,810 $10,083,873 $5,448,332 141
Childress $3,368,444 $1,779,026 $1,193,301 $725,805 17
Clay $6,455,244 $3,327,402 $2,244,098 $1,195,736 31
Cochran $1,126,277 $559,104 $360,691 $205,904 5
The Annual Benefits Resulting from Reduced Health Care Costs Associatedwith the More Efficient Use of Advanced Practice Registered Nurses on Business
Activity in Texas as of 2030County Results

perrymangroup.com 75 © 2012 by The Perryman Group
Total Gross Personal Retail Employment
Expenditures Product Income Sales (Permanent
County (2011 Dollars) (2011 Dollars) (2011 Dollars) (2011 Dollars) Jobs)
Coke $1,320,717 $657,702 $423,800 $290,254 6
Coleman $4,276,547 $2,283,069 $1,524,395 $867,808 21
Collin $1,173,735,567 $615,623,709 $405,006,113 $217,430,198 5,500
Collingsworth $1,474,059 $807,546 $534,578 $352,355 8
Colorado $15,695,737 $8,238,190 $5,532,318 $3,221,612 80
Comal $104,537,152 $53,701,649 $35,214,076 $19,434,626 499
Comanche $8,108,365 $4,345,738 $2,916,325 $1,540,883 40
Concho $1,493,832 $818,933 $570,527 $281,000 8
Cooke $41,910,119 $21,172,017 $13,924,576 $8,654,494 196
Coryell $32,256,275 $17,063,948 $11,336,942 $6,576,316 162
Cottle $1,530,102 $884,331 $594,509 $325,093 8
Crane $2,503,214 $1,398,327 $969,412 $465,172 13
Crockett $1,911,819 $999,025 $635,204 $551,821 10
Crosby $3,262,541 $1,831,961 $1,255,568 $507,261 17
Culberson $1,146,922 $670,692 $445,204 $360,941 7
Dallam $6,081,193 $3,132,181 $1,968,722 $1,131,851 27
Dallas $6,296,476,227 $3,118,764,116 $1,996,052,360 $868,289,575 25,747
Dawson $7,049,129 $3,488,882 $2,152,905 $1,562,177 31
Deaf Smith $9,333,772 $4,515,029 $2,874,098 $1,522,330 39
Delta $2,068,655 $1,092,735 $756,145 $276,952 10
Denton $592,268,617 $300,483,281 $195,979,368 $99,223,806 2,648
DeWitt $12,447,724 $6,637,706 $4,457,938 $2,416,034 62
Dickens $1,171,099 $613,784 $400,002 $266,703 6
Dimmit $4,093,738 $2,222,071 $1,521,410 $962,709 22
Donley $1,630,789 $941,575 $647,305 $411,417 10
Duval $4,870,264 $2,533,630 $1,724,581 $851,633 24
Eastland $14,077,415 $7,262,385 $4,805,700 $3,085,279 70
Ector $148,056,186 $78,742,882 $53,026,493 $29,525,278 734
Edwards $710,586 $352,112 $213,350 $157,977 3
El Paso $764,735,310 $386,493,974 $250,103,824 $122,230,530 3,378
Ellis $94,946,757 $47,102,600 $30,375,474 $18,723,994 431
Erath $23,390,860 $13,035,544 $8,865,748 $5,190,404 127
Falls $5,497,458 $3,013,357 $2,036,257 $1,042,919 28
Fannin $14,962,639 $8,006,096 $5,356,550 $2,831,254 74
Fayette $20,335,067 $10,660,928 $7,036,261 $3,652,901 97
Fisher $1,834,609 $1,018,080 $682,183 $393,000 10
Floyd $3,353,720 $1,586,778 $1,014,992 $498,287 14
Foard $439,551 $253,643 $177,433 $85,315 2
Fort Bend $556,375,363 $268,825,622 $172,938,911 $96,663,831 2,344
Franklin $6,286,221 $3,280,611 $2,203,704 $1,270,595 31
(continued)The Annual Benefits Resulting from Reduced Health Care Costs Associated
with the More Efficient Use of Advanced Practice Registered Nurses on Business Activity in Texas as of 2030
County Results
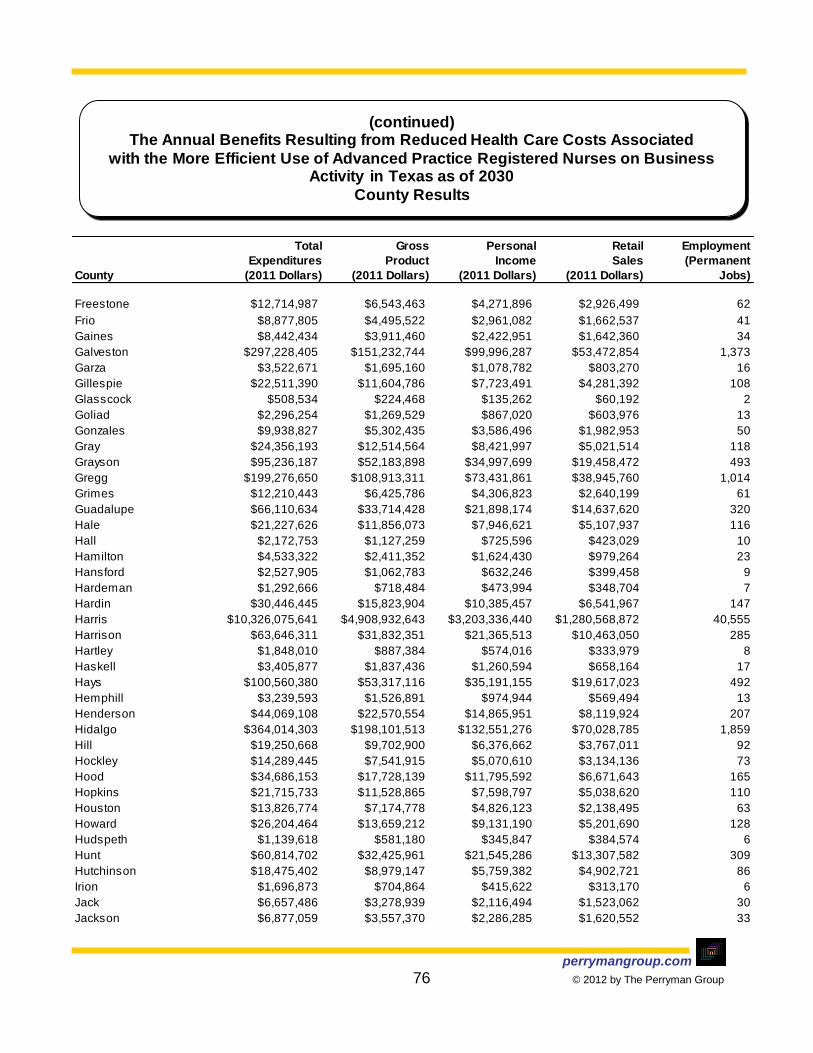
perrymangroup.com 76 © 2012 by The Perryman Group
Total Gross Personal Retail Employment
Expenditures Product Income Sales (Permanent
County (2011 Dollars) (2011 Dollars) (2011 Dollars) (2011 Dollars) Jobs)
Freestone $12,714,987 $6,543,463 $4,271,896 $2,926,499 62
Frio $8,877,805 $4,495,522 $2,961,082 $1,662,537 41
Gaines $8,442,434 $3,911,460 $2,422,951 $1,642,360 34
Galveston $297,228,405 $151,232,744 $99,996,287 $53,472,854 1,373
Garza $3,522,671 $1,695,160 $1,078,782 $803,270 16
Gillespie $22,511,390 $11,604,786 $7,723,491 $4,281,392 108
Glasscock $508,534 $224,468 $135,262 $60,192 2
Goliad $2,296,254 $1,269,529 $867,020 $603,976 13
Gonzales $9,938,827 $5,302,435 $3,586,496 $1,982,953 50
Gray $24,356,193 $12,514,564 $8,421,997 $5,021,514 118
Grayson $95,236,187 $52,183,898 $34,997,699 $19,458,472 493
Gregg $199,276,650 $108,913,311 $73,431,861 $38,945,760 1,014
Grimes $12,210,443 $6,425,786 $4,306,823 $2,640,199 61
Guadalupe $66,110,634 $33,714,428 $21,898,174 $14,637,620 320
Hale $21,227,626 $11,856,073 $7,946,621 $5,107,937 116
Hall $2,172,753 $1,127,259 $725,596 $423,029 10
Hamilton $4,533,322 $2,411,352 $1,624,430 $979,264 23
Hansford $2,527,905 $1,062,783 $632,246 $399,458 9
Hardeman $1,292,666 $718,484 $473,994 $348,704 7
Hardin $30,446,445 $15,823,904 $10,385,457 $6,541,967 147
Harris $10,326,075,641 $4,908,932,643 $3,203,336,440 $1,280,568,872 40,555
Harrison $63,646,311 $31,832,351 $21,365,513 $10,463,050 285
Hartley $1,848,010 $887,384 $574,016 $333,979 8
Haskell $3,405,877 $1,837,436 $1,260,594 $658,164 17
Hays $100,560,380 $53,317,116 $35,191,155 $19,617,023 492
Hemphill $3,239,593 $1,526,891 $974,944 $569,494 13
Henderson $44,069,108 $22,570,554 $14,865,951 $8,119,924 207
Hidalgo $364,014,303 $198,101,513 $132,551,276 $70,028,785 1,859
Hill $19,250,668 $9,702,900 $6,376,662 $3,767,011 92
Hockley $14,289,445 $7,541,915 $5,070,610 $3,134,136 73
Hood $34,686,153 $17,728,139 $11,795,592 $6,671,643 165
Hopkins $21,715,733 $11,528,865 $7,598,797 $5,038,620 110
Houston $13,826,774 $7,174,778 $4,826,123 $2,138,495 63
Howard $26,204,464 $13,659,212 $9,131,190 $5,201,690 128
Hudspeth $1,139,618 $581,180 $345,847 $384,574 6
Hunt $60,814,702 $32,425,961 $21,545,286 $13,307,582 309
Hutchinson $18,475,402 $8,979,147 $5,759,382 $4,902,721 86
Irion $1,696,873 $704,864 $415,622 $313,170 6
Jack $6,657,486 $3,278,939 $2,116,494 $1,523,062 30
Jackson $6,877,059 $3,557,370 $2,286,285 $1,620,552 33
(continued)The Annual Benefits Resulting from Reduced Health Care Costs Associated
with the More Efficient Use of Advanced Practice Registered Nurses on Business Activity in Texas as of 2030
County Results
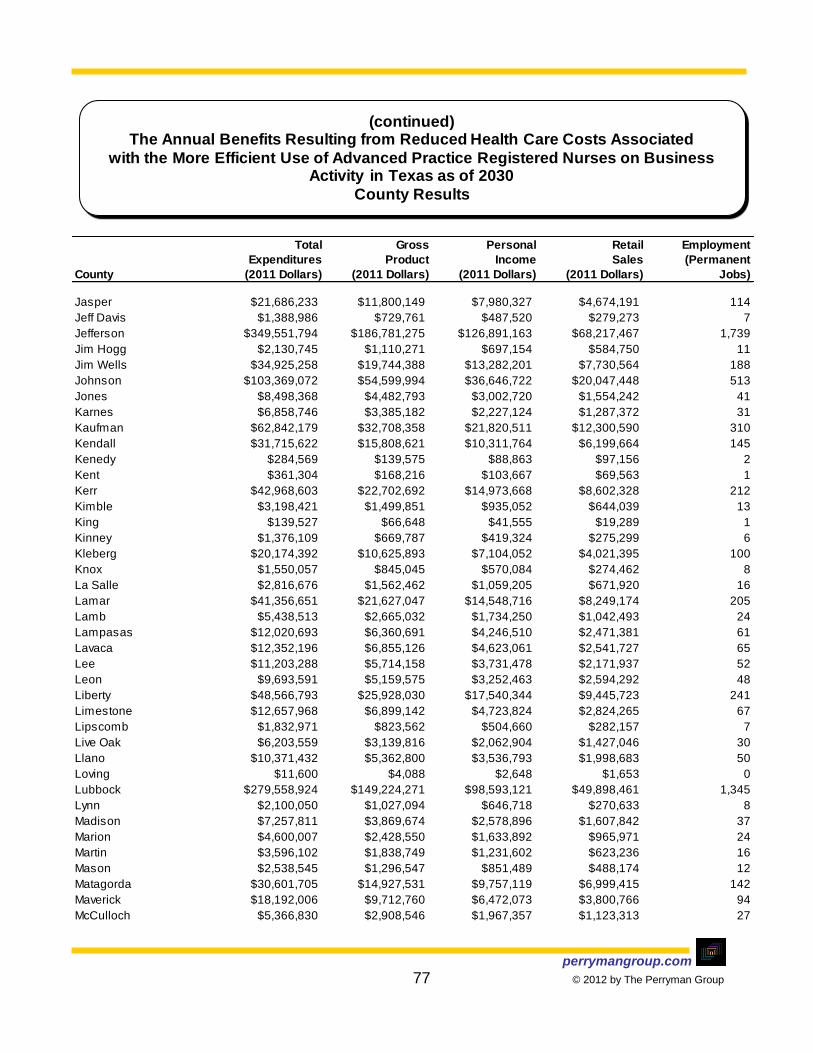
perrymangroup.com 77 © 2012 by The Perryman Group
Total Gross Personal Retail Employment
Expenditures Product Income Sales (Permanent
County (2011 Dollars) (2011 Dollars) (2011 Dollars) (2011 Dollars) Jobs)
Jasper $21,686,233 $11,800,149 $7,980,327 $4,674,191 114
Jeff Davis $1,388,986 $729,761 $487,520 $279,273 7
Jefferson $349,551,794 $186,781,275 $126,891,163 $68,217,467 1,739
Jim Hogg $2,130,745 $1,110,271 $697,154 $584,750 11
Jim Wells $34,925,258 $19,744,388 $13,282,201 $7,730,564 188
Johnson $103,369,072 $54,599,994 $36,646,722 $20,047,448 513
Jones $8,498,368 $4,482,793 $3,002,720 $1,554,242 41
Karnes $6,858,746 $3,385,182 $2,227,124 $1,287,372 31
Kaufman $62,842,179 $32,708,358 $21,820,511 $12,300,590 310
Kendall $31,715,622 $15,808,621 $10,311,764 $6,199,664 145
Kenedy $284,569 $139,575 $88,863 $97,156 2
Kent $361,304 $168,216 $103,667 $69,563 1
Kerr $42,968,603 $22,702,692 $14,973,668 $8,602,328 212
Kimble $3,198,421 $1,499,851 $935,052 $644,039 13
King $139,527 $66,648 $41,555 $19,289 1
Kinney $1,376,109 $669,787 $419,324 $275,299 6
Kleberg $20,174,392 $10,625,893 $7,104,052 $4,021,395 100
Knox $1,550,057 $845,045 $570,084 $274,462 8
La Salle $2,816,676 $1,562,462 $1,059,205 $671,920 16
Lamar $41,356,651 $21,627,047 $14,548,716 $8,249,174 205
Lamb $5,438,513 $2,665,032 $1,734,250 $1,042,493 24
Lampasas $12,020,693 $6,360,691 $4,246,510 $2,471,381 61
Lavaca $12,352,196 $6,855,126 $4,623,061 $2,541,727 65
Lee $11,203,288 $5,714,158 $3,731,478 $2,171,937 52
Leon $9,693,591 $5,159,575 $3,252,463 $2,594,292 48
Liberty $48,566,793 $25,928,030 $17,540,344 $9,445,723 241
Limestone $12,657,968 $6,899,142 $4,723,824 $2,824,265 67
Lipscomb $1,832,971 $823,562 $504,660 $282,157 7
Live Oak $6,203,559 $3,139,816 $2,062,904 $1,427,046 30
Llano $10,371,432 $5,362,800 $3,536,793 $1,998,683 50
Loving $11,600 $4,088 $2,648 $1,653 0
Lubbock $279,558,924 $149,224,271 $98,593,121 $49,898,461 1,345
Lynn $2,100,050 $1,027,094 $646,718 $270,633 8
Madison $7,257,811 $3,869,674 $2,578,896 $1,607,842 37
Marion $4,600,007 $2,428,550 $1,633,892 $965,971 24
Martin $3,596,102 $1,838,749 $1,231,602 $623,236 16
Mason $2,538,545 $1,296,547 $851,489 $488,174 12
Matagorda $30,601,705 $14,927,531 $9,757,119 $6,999,415 142
Maverick $18,192,006 $9,712,760 $6,472,073 $3,800,766 94
McCulloch $5,366,830 $2,908,546 $1,967,357 $1,123,313 27
(continued)The Annual Benefits Resulting from Reduced Health Care Costs Associated
with the More Efficient Use of Advanced Practice Registered Nurses on Business Activity in Texas as of 2030
County Results

perrymangroup.com 78 © 2012 by The Perryman Group
Total Gross Personal Retail Employment
Expenditures Product Income Sales (Permanent
County (2011 Dollars) (2011 Dollars) (2011 Dollars) (2011 Dollars) Jobs)
McLennan $281,227,636 $142,708,899 $93,026,828 $47,606,154 1,283
McMullen $267,064 $119,730 $72,462 $40,695 1
Medina $18,380,640 $9,180,347 $5,973,796 $3,521,442 85
Menard $830,971 $436,151 $275,175 $212,386 4
Midland $211,870,044 $110,254,697 $71,810,371 $40,559,755 976
Milam $11,831,842 $6,147,113 $4,120,243 $2,563,384 59
Mills $1,891,513 $1,138,492 $782,201 $454,697 11
Mitchell $4,102,034 $2,250,963 $1,513,247 $874,508 21
Montague $14,692,226 $7,505,603 $4,964,626 $2,846,405 71
Montgomery $465,837,407 $232,928,101 $154,685,621 $76,346,309 2,077
Moore $17,928,350 $7,995,172 $5,032,804 $3,250,723 70
Morris $7,873,896 $3,738,575 $2,508,664 $1,153,219 33
Motley $725,800 $358,454 $227,927 $140,691 3
Nacogdoches $37,197,350 $20,389,541 $13,879,234 $8,051,140 200
Navarro $32,892,604 $17,015,675 $11,389,150 $5,830,936 157
Newton $2,162,362 $1,332,958 $923,073 $631,427 13
Nolan $11,180,562 $5,978,285 $3,907,059 $2,309,456 55
Nueces $431,304,226 $212,767,203 $140,487,931 $72,765,906 1,904
Ochiltree $8,524,722 $4,028,244 $2,559,471 $1,670,775 35
Oldham $412,916 $226,625 $147,828 $138,482 2
Orange $56,314,810 $30,004,543 $20,260,178 $12,311,206 287
Palo Pinto $21,947,900 $10,691,228 $6,870,625 $4,260,855 98
Panola $19,298,631 $10,016,818 $6,740,919 $3,787,867 93
Parker $73,192,850 $35,453,472 $22,604,502 $13,962,615 321
Parmer $3,864,002 $1,682,991 $1,090,182 $371,858 14
Pecos $10,209,974 $5,244,259 $3,424,022 $2,339,113 50
Polk $23,062,890 $12,480,370 $8,258,667 $5,138,469 116
Potter $189,265,649 $100,974,294 $66,957,940 $34,295,208 912
Presidio $3,688,398 $1,775,282 $1,118,641 $775,851 16
Rains $3,669,156 $1,706,239 $1,041,268 $847,992 15
Randall $71,744,267 $37,980,375 $24,796,757 $13,969,405 345
Reagan $2,241,064 $1,156,105 $708,692 $617,691 11
Real $1,635,909 $816,308 $534,382 $309,177 7
Red River $4,974,147 $2,597,143 $1,729,172 $915,896 24
Reeves $5,135,910 $2,641,571 $1,712,863 $1,298,928 26
Refugio $2,909,545 $1,473,387 $914,766 $875,697 14
Roberts $91,942 $42,103 $25,333 $26,879 0
Robertson $10,214,039 $5,369,050 $3,579,716 $2,349,411 52
Rockwall $58,502,254 $30,831,440 $20,601,370 $11,056,211 284
Runnels $5,691,157 $2,711,400 $1,739,949 $1,032,711 25
(continued)The Annual Benefits Resulting from Reduced Health Care Costs Associated
with the More Efficient Use of Advanced Practice Registered Nurses on Business Activity in Texas as of 2030
County Results

perrymangroup.com 79 © 2012 by The Perryman Group
Total Gross Personal Retail Employment
Expenditures Product Income Sales (Permanent
County (2011 Dollars) (2011 Dollars) (2011 Dollars) (2011 Dollars) Jobs)
Rusk $37,314,086 $18,758,376 $12,557,686 $6,823,800 173
Sabine $4,615,978 $2,481,555 $1,715,558 $1,011,584 24
San Augustine $3,738,771 $1,913,739 $1,280,381 $671,312 18
San Jacinto $7,805,702 $3,976,625 $2,616,704 $1,629,275 37
San Patricio $39,373,938 $20,036,278 $13,502,719 $8,371,638 193
San Saba $2,418,425 $1,321,583 $869,919 $553,246 13
Schleicher $1,384,564 $745,520 $520,296 $184,875 7
Scurry $11,311,516 $6,209,790 $3,932,018 $3,037,067 59
Shackelford $1,985,504 $1,027,142 $672,243 $438,605 10
Shelby $13,566,955 $7,494,271 $5,151,019 $2,952,906 73
Sherman $1,008,112 $428,474 $261,055 $158,280 4
Smith $259,303,620 $133,352,113 $87,008,025 $46,076,312 1,200
Somervell $10,385,559 $5,109,131 $3,523,893 $1,338,663 47
Starr $12,370,794 $7,148,659 $4,959,081 $3,100,495 73
Stephens $5,875,721 $3,314,039 $2,186,553 $1,641,999 32
Sterling $734,161 $428,390 $283,927 $238,389 4
Stonewall $590,403 $339,714 $229,386 $159,702 3
Sutton $6,421,133 $3,464,240 $2,231,460 $1,686,113 33
Swisher $2,534,714 $1,181,991 $738,278 $445,633 10
Tarrant $2,730,545,595 $1,402,792,305 $921,248,962 $452,801,809 12,418
Taylor $140,127,390 $72,302,767 $47,403,498 $24,160,168 646
Terrell $309,867 $176,555 $116,844 $77,191 2
Terry $6,474,661 $3,305,097 $2,038,582 $1,698,989 31
Throckmorton $1,199,135 $617,272 $395,685 $254,096 6
Titus $28,839,535 $15,158,292 $10,237,775 $6,528,159 147
Tom Green $106,146,916 $53,988,261 $35,040,763 $18,883,376 490
Travis $1,572,884,065 $847,058,241 $557,187,513 $277,359,675 7,484
Trinity $4,436,184 $2,461,675 $1,652,648 $971,253 24
Tyler $7,564,328 $4,056,670 $2,716,300 $1,579,038 38
Upshur $17,019,945 $8,736,848 $5,703,456 $3,524,628 80
Upton $2,229,879 $1,141,624 $741,484 $426,192 10
Uvalde $15,322,231 $8,184,600 $5,474,084 $2,999,257 77
Val Verde $25,335,803 $14,577,571 $9,843,813 $5,374,429 138
Van Zandt $23,564,804 $13,495,461 $9,148,959 $5,284,274 131
Victoria $97,700,447 $51,217,723 $34,316,202 $18,567,315 469
Walker $26,878,916 $14,801,564 $9,929,301 $5,624,492 141
Waller $31,520,715 $14,408,569 $8,917,035 $6,393,088 132
Ward $8,626,756 $4,548,548 $2,947,354 $2,128,672 43
Washington $32,008,073 $17,408,943 $11,662,540 $6,253,432 161
Webb $130,613,083 $70,850,250 $47,390,581 $27,979,599 673
(continued)The Annual Benefits Resulting from Reduced Health Care Costs Associated
with the More Efficient Use of Advanced Practice Registered Nurses on Business Activity in Texas as of 2030
County Results

perrymangroup.com 80 © 2012 by The Perryman Group
Total Gross Personal Retail Employment
Expenditures Product Income Sales (Permanent
County (2011 Dollars) (2011 Dollars) (2011 Dollars) (2011 Dollars) Jobs)
Wharton $29,014,505 $15,906,610 $10,776,329 $6,207,699 153
Wheeler $3,522,375 $1,988,801 $1,330,259 $906,166 20
Wichita $121,298,955 $67,844,917 $45,541,303 $25,540,467 638
Wilbarger $11,910,704 $6,275,482 $4,198,759 $2,363,757 59
Willacy $6,473,520 $3,646,055 $2,412,793 $1,522,083 35
Williamson $225,034,488 $121,367,806 $80,449,088 $46,977,388 1,124
Wilson $15,538,072 $8,011,197 $5,355,335 $3,045,770 76
Winkler $4,982,878 $2,610,304 $1,700,952 $1,219,741 25
Wise $42,453,711 $22,121,213 $14,416,954 $9,455,388 206
Wood $23,331,089 $11,997,991 $7,939,621 $4,338,831 111
Yoakum $6,799,708 $3,359,991 $2,133,383 $1,668,033 32
Young $18,523,086 $9,843,650 $6,441,372 $4,193,310 92
Zapata $5,149,506 $2,802,551 $1,883,408 $1,279,494 28
Zavala $3,004,574 $1,800,912 $1,265,896 $748,418 19
TOTAL STATE IMPACT $34,764,484,606 $17,460,913,286 $11,417,130,622 $5,429,934,432 151,462
SOURCE: US Multi-Regional Impact Assessment System, The Perryman Group
(continued)The Annual Benefits Resulting from Reduced Health Care Costs Associated
with the More Efficient Use of Advanced Practice Registered Nurses on Business Activity in Texas as of 2030
County Results

perrymangroup.com 81 © 2012 by The Perryman Group
Economic Benefits as of 2040

perrymangroup.com 82 © 2012 by The Perryman Group
Total Gross Personal Employment
Expenditures Product Income (Permanent
Category (2011 Dollars) (2011 Dollars) (2011 Dollars) Jobs)
Agricultural Products & Services $821,047,379 $216,589,598 $147,509,487 1,474
Forestry & Fishery Products $21,070,058 $17,238,657 $6,393,420 49
Coal Mining $89,048,399 $25,898,684 $27,291,023 110
Crude Petroleum & Natural Gas $992,689,810 $217,601,629 $100,357,578 303
Miscellaneous Mining $26,795,830 $11,304,244 $6,645,126 39
New Construction $88,066,686 $38,755,029 $31,936,585 285
Maintenance & Repair Construction $1,006,509,913 $523,728,693 $431,585,154 3,823
Food Products & Tobacco $1,673,136,938 $424,624,301 $216,918,322 2,271
Textile Mill Products $23,897,190 $5,345,645 $4,522,858 58
Apparel $338,159,532 $187,274,324 $94,894,666 1,616
Paper & Allied Products $269,207,977 $119,050,069 $53,821,609 499
Printing & Publishing $418,922,084 $206,936,756 $135,072,097 1,434
Chemicals & Petroleum Refining $2,034,624,043 $383,729,484 $180,183,273 826
Rubber & Leather Products $252,550,459 $109,101,727 $63,780,293 782
Lumber Products & Furniture $107,062,556 $37,215,492 $26,532,724 332
Stone, Clay, & Glass Products $141,574,286 $75,783,087 $39,634,954 400
Primary Metal $143,780,259 $38,446,583 $28,617,799 256
Fabricated Metal Products $284,733,075 $104,214,903 $67,281,239 716
Machinery, Except Electrical $317,835,953 $126,282,938 $90,217,105 595
Electric & Electronic Equipment $252,045,425 $140,453,569 $83,967,890 432
Motor Vehicles & Equipment $169,692,990 $37,729,487 $24,511,608 212
Transp. Equip., Exc. Motor Vehicles $90,372,509 $42,310,901 $27,648,795 202
Instruments & Related Products $70,268,371 $28,371,472 $21,564,865 171
Miscellaneous Manufacturing $97,952,846 $38,022,631 $26,224,729 251
Transportation $2,730,314,767 $1,245,684,605 $823,851,309 7,176
Communication $1,202,710,424 $741,292,835 $316,481,579 1,753
Electric, Gas, Water, Sanitary Services $2,429,018,727 $548,653,980 $239,417,953 629
Wholesale Trade $1,486,541,606 $1,005,851,947 $579,983,119 4,088
Retail Trade $5,048,146,340 $4,183,446,083 $2,501,566,894 41,415
Finance $690,872,541 $386,201,298 $224,886,131 1,246
Insurance $2,039,076,318 $1,254,781,239 $750,157,660 5,678
Real Estate $6,224,109,087 $1,091,897,876 $175,928,330 975
Hotels, Lodging Places, Amusements $601,451,474 $311,440,622 $204,315,787 3,127
Personal Services $1,061,347,814 $654,846,685 $509,481,307 5,404
Business Services $2,674,670,730 $1,687,768,128 $1,376,786,253 10,570
Eating & Drinking Places $2,335,237,184 $1,367,727,778 $727,704,258 20,775
Health Services $7,172,962,771 $5,289,709,619 $4,472,498,448 46,647
Miscellaneous Services $1,442,204,860 $611,501,667 $530,120,878 7,985
Households $61,541,684 $61,541,684 $60,239,493 2,617
Total $46,931,250,896 $23,598,355,948 $15,430,532,595 177,220
SOURCE: US Multi-Regional Impact Assessment System, The Perryman Group
The Annual Benefits Resulting from Reduced Health Care Costs Associatedwith the More Efficient Use of Advanced Practice Registered Nurses on Business
Activity in Texas as of 2040Results by Detailed Industrial Category
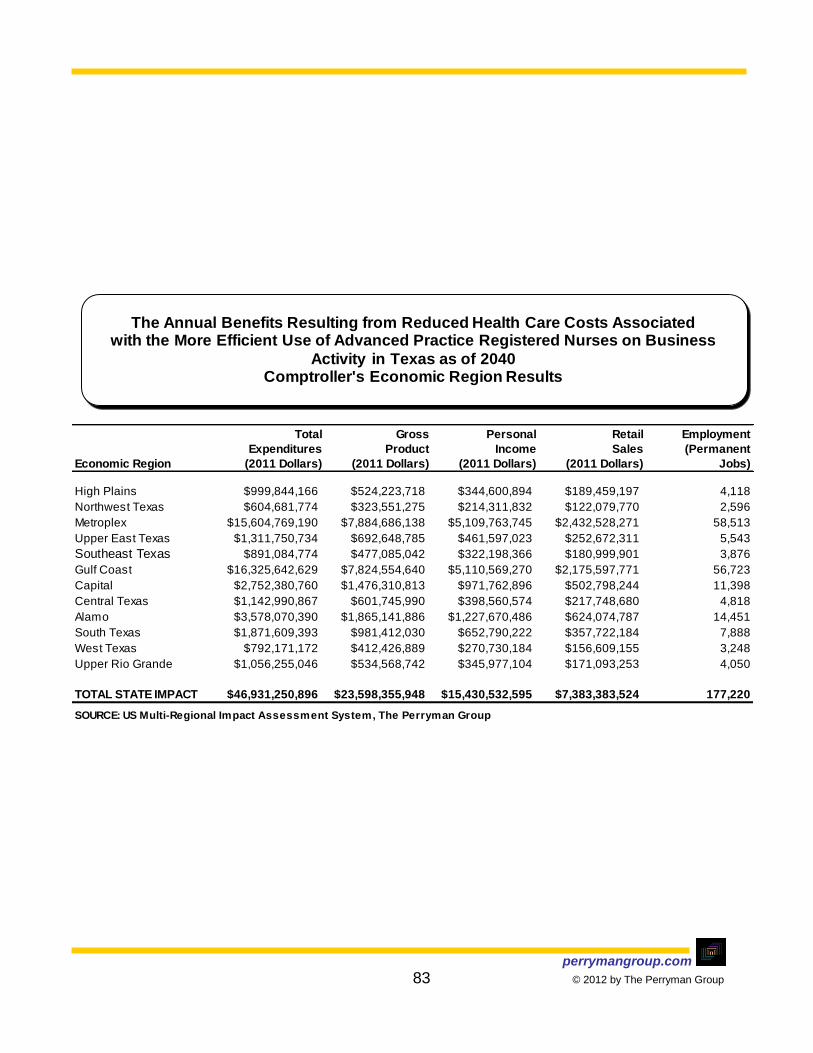
perrymangroup.com 83 © 2012 by The Perryman Group
Total Gross Personal Retail Employment
Expenditures Product Income Sales (Permanent
Economic Region (2011 Dollars) (2011 Dollars) (2011 Dollars) (2011 Dollars) Jobs)
High Plains $999,844,166 $524,223,718 $344,600,894 $189,459,197 4,118
Northwest Texas $604,681,774 $323,551,275 $214,311,832 $122,079,770 2,596
Metroplex $15,604,769,190 $7,884,686,138 $5,109,763,745 $2,432,528,271 58,513
Upper East Texas $1,311,750,734 $692,648,785 $461,597,023 $252,672,311 5,543
Southeast Texas $891,084,774 $477,085,042 $322,198,366 $180,999,901 3,876
Gulf Coast $16,325,642,629 $7,824,554,640 $5,110,569,270 $2,175,597,771 56,723
Capital $2,752,380,760 $1,476,310,813 $971,762,896 $502,798,244 11,398
Central Texas $1,142,990,867 $601,745,990 $398,560,574 $217,748,680 4,818
Alamo $3,578,070,390 $1,865,141,886 $1,227,670,486 $624,074,787 14,451
South Texas $1,871,609,393 $981,412,030 $652,790,222 $357,722,184 7,888
West Texas $792,171,172 $412,426,889 $270,730,184 $156,609,155 3,248
Upper Rio Grande $1,056,255,046 $534,568,742 $345,977,104 $171,093,253 4,050
TOTAL STATE IMPACT $46,931,250,896 $23,598,355,948 $15,430,532,595 $7,383,383,524 177,220
SOURCE: US Multi-Regional Impact Assessment System, The Perryman Group
The Annual Benefits Resulting from Reduced Health Care Costs Associatedwith the More Efficient Use of Advanced Practice Registered Nurses on Business
Activity in Texas as of 2040Comptroller's Economic Region Results
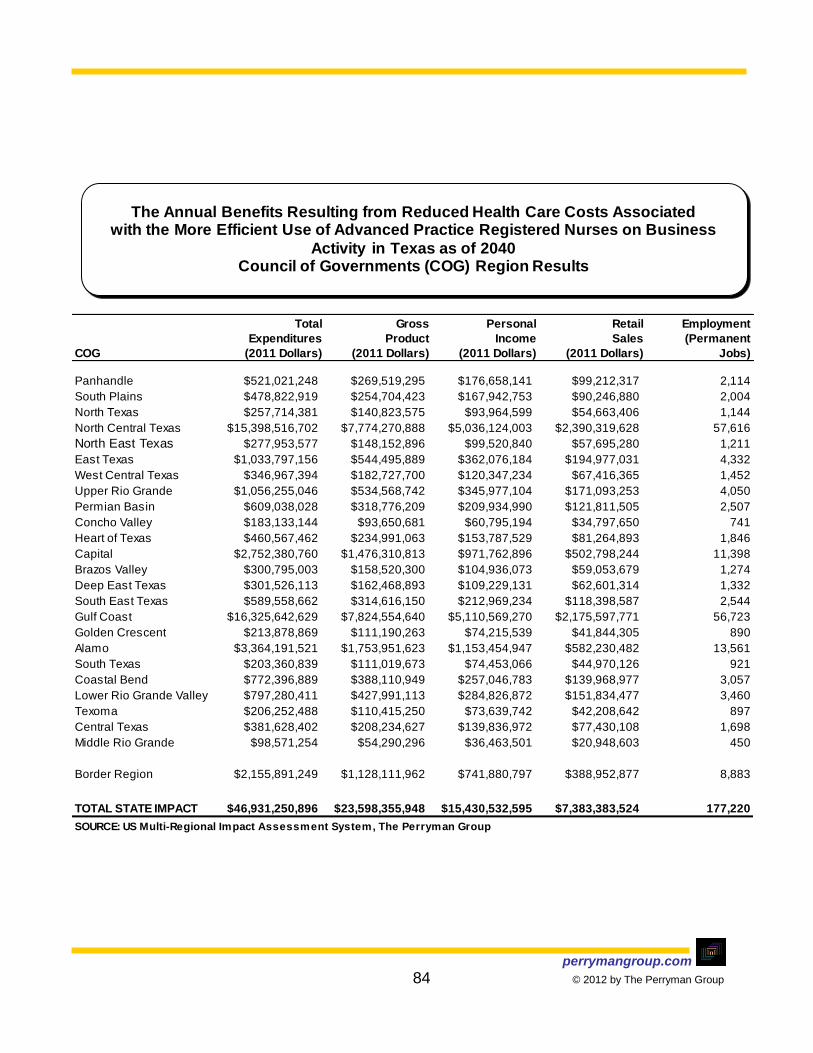
perrymangroup.com 84 © 2012 by The Perryman Group
Total Gross Personal Retail Employment
Expenditures Product Income Sales (Permanent
COG (2011 Dollars) (2011 Dollars) (2011 Dollars) (2011 Dollars) Jobs)
Panhandle $521,021,248 $269,519,295 $176,658,141 $99,212,317 2,114
South Plains $478,822,919 $254,704,423 $167,942,753 $90,246,880 2,004
North Texas $257,714,381 $140,823,575 $93,964,599 $54,663,406 1,144
North Central Texas $15,398,516,702 $7,774,270,888 $5,036,124,003 $2,390,319,628 57,616
North East Texas $277,953,577 $148,152,896 $99,520,840 $57,695,280 1,211
East Texas $1,033,797,156 $544,495,889 $362,076,184 $194,977,031 4,332
West Central Texas $346,967,394 $182,727,700 $120,347,234 $67,416,365 1,452
Upper Rio Grande $1,056,255,046 $534,568,742 $345,977,104 $171,093,253 4,050
Permian Basin $609,038,028 $318,776,209 $209,934,990 $121,811,505 2,507
Concho Valley $183,133,144 $93,650,681 $60,795,194 $34,797,650 741
Heart of Texas $460,567,462 $234,991,063 $153,787,529 $81,264,893 1,846
Capital $2,752,380,760 $1,476,310,813 $971,762,896 $502,798,244 11,398
Brazos Valley $300,795,003 $158,520,300 $104,936,073 $59,053,679 1,274
Deep East Texas $301,526,113 $162,468,893 $109,229,131 $62,601,314 1,332
South East Texas $589,558,662 $314,616,150 $212,969,234 $118,398,587 2,544
Gulf Coast $16,325,642,629 $7,824,554,640 $5,110,569,270 $2,175,597,771 56,723
Golden Crescent $213,878,869 $111,190,263 $74,215,539 $41,844,305 890
Alamo $3,364,191,521 $1,753,951,623 $1,153,454,947 $582,230,482 13,561
South Texas $203,360,839 $111,019,673 $74,453,066 $44,970,126 921
Coastal Bend $772,396,889 $388,110,949 $257,046,783 $139,968,977 3,057
Lower Rio Grande Valley $797,280,411 $427,991,113 $284,826,872 $151,834,477 3,460
Texoma $206,252,488 $110,415,250 $73,639,742 $42,208,642 897
Central Texas $381,628,402 $208,234,627 $139,836,972 $77,430,108 1,698
Middle Rio Grande $98,571,254 $54,290,296 $36,463,501 $20,948,603 450
Border Region $2,155,891,249 $1,128,111,962 $741,880,797 $388,952,877 8,883
TOTAL STATE IMPACT $46,931,250,896 $23,598,355,948 $15,430,532,595 $7,383,383,524 177,220
SOURCE: US Multi-Regional Impact Assessment System, The Perryman Group
The Annual Benefits Resulting from Reduced Health Care Costs Associatedwith the More Efficient Use of Advanced Practice Registered Nurses on Business
Activity in Texas as of 2040Council of Governments (COG) Region Results

perrymangroup.com 85 © 2012 by The Perryman Group
Total Gross Personal Retail Employment
Expenditures Product Income Sales (Permanent
MSA (2011 Dollars) (2011 Dollars) (2011 Dollars) (2011 Dollars) Jobs)
Abilene $209,646,379 $108,274,784 $71,060,459 $36,706,394 840
Amarillo $361,433,751 $191,619,305 $126,342,740 $66,648,172 1,498
Austin-Round Rock-San Marcos $2,633,071,861 $1,415,294,508 $931,856,435 $480,417,688 10,917
Beaumont-Port Arthur $589,558,662 $314,616,150 $212,969,234 $118,398,587 2,544
Brownville-Harlingen $294,747,343 $154,172,532 $101,712,217 $54,142,214 1,235
College Station-Bryan $217,944,361 $113,958,376 $75,381,001 $41,196,410 912
Corpus Christi $656,366,026 $324,801,464 $214,598,085 $114,508,419 2,533
Dallas-Plano-Irving MD* $11,246,891,984 $5,639,889,149 $3,633,696,055 $1,683,774,311 41,171
Fort Worth-Arlington MD* $3,987,055,516 $2,049,524,230 $1,345,820,204 $675,088,481 15,758
El Paso $1,035,882,275 $523,614,871 $338,793,051 $166,458,149 3,961
Houston-Baytown-Sugar Land $16,197,968,029 $7,756,947,733 $5,065,350,695 $2,147,762,938 56,162
Killeen-Temple-Fort Hood $353,544,156 $193,250,646 $129,780,394 $71,202,016 1,574
Laredo $176,614,592 $95,936,402 $64,174,200 $38,155,826 790
Longview $342,138,236 $184,293,378 $123,858,478 $67,011,202 1,482
Lubbock $383,131,358 $204,709,348 $135,280,157 $68,666,384 1,597
McAllen-Edinburg-Pharr $493,697,665 $268,836,585 $179,818,434 $95,600,936 2,183
Midland $285,513,720 $148,887,732 $96,977,552 $55,099,454 1,141
Odessa $199,620,925 $106,367,508 $71,614,490 $40,134,144 858
San Angelo $146,008,330 $74,120,556 $48,050,453 $26,185,090 582
San Antonio-New Braunfels $3,253,865,094 $1,696,611,725 $1,115,555,005 $560,570,576 13,099
Sherman-Denison $129,141,885 $70,787,652 $47,452,477 $26,529,849 579
Texarkana $103,058,220 $56,598,606 $38,121,976 $20,829,351 459
Tyler $350,280,989 $180,370,330 $117,689,636 $62,701,471 1,406
Victoria $157,436,004 $80,834,852 $53,912,850 $30,146,757 642
Waco $380,208,340 $192,962,708 $125,774,613 $64,734,446 1,502
Wichita Falls $180,030,828 $100,093,977 $67,086,587 $38,069,614 814
Rural Area $2,566,394,369 $1,350,980,843 $897,805,119 $532,644,643 10,980
TOTAL STATE IMPACT $46,931,250,896 $23,598,355,948 $15,430,532,595 $7,383,383,524 177,220
*Metropolitan Division
SOURCE: US Multi-Regional Impact Assessment System, The Perryman Group
The Annual Benefits Resulting from Reduced Health Care Costs Associatedwith the More Efficient Use of Advanced Practice Registered Nurses on Business Activity
in Texas as of 2040Metropolitan Statistical Area (MSA) and Rural Texas Results

perrymangroup.com 86 © 2012 by The Perryman Group
Total Gross Personal Retail Employment
Expenditures Product Income Sales (Permanent
County (2011 Dollars) (2011 Dollars) (2011 Dollars) (2011 Dollars) Jobs)
Anderson $46,290,842 $26,074,951 $17,621,884 $9,570,753 212
Andrews $15,450,927 $7,864,656 $5,026,664 $3,233,741 60
Angelina $111,379,745 $59,516,453 $39,761,050 $22,226,896 483
Aransas $20,350,090 $9,807,727 $6,270,028 $4,056,253 77
Archer $7,200,467 $3,656,795 $2,348,922 $1,625,393 30
Armstrong $1,255,162 $660,395 $452,626 $181,171 5
Atascosa $34,867,567 $17,882,354 $11,910,851 $6,472,243 141
Austin $44,294,232 $21,277,619 $13,590,374 $7,369,159 154
Bailey $5,944,149 $3,086,440 $1,929,126 $1,345,453 23
Bandera $12,699,473 $6,391,028 $4,136,699 $2,619,618 51
Bastrop $45,089,756 $22,659,992 $14,711,030 $8,901,093 180
Baylor $3,151,325 $1,720,486 $1,153,968 $650,624 14
Bee $17,901,754 $9,848,404 $6,670,716 $3,958,961 83
Bell $292,778,440 $161,100,366 $108,391,138 $58,706,991 1,309
Bexar $2,884,581,195 $1,508,298,333 $992,229,091 $487,279,917 11,579
Blanco $10,898,037 $5,413,988 $3,503,212 $2,033,388 43
Borden $626,126 $293,765 $177,619 $115,765 2
Bosque $12,261,064 $6,451,811 $4,338,532 $2,076,812 51
Bowie $103,058,220 $56,598,606 $38,121,976 $20,829,351 459
Brazoria $309,548,254 $156,441,689 $103,399,419 $64,315,557 1,267
Brazos $193,053,896 $100,762,605 $66,613,226 $35,344,121 803
Brewster $10,368,549 $5,844,832 $3,923,659 $2,175,192 47
Briscoe $853,834 $405,560 $251,209 $196,585 3
Brooks $3,897,032 $2,244,289 $1,549,864 $972,808 20
Brown $34,978,607 $19,885,426 $13,408,418 $7,993,360 168
Burleson $11,034,320 $5,906,933 $3,909,316 $2,642,439 49
Burnet $51,445,239 $26,017,011 $16,936,202 $9,632,260 204
Caldwell $21,697,381 $11,263,702 $7,615,271 $4,215,655 92
Calhoun $22,334,763 $9,780,892 $6,294,518 $4,030,208 77
Callahan $8,337,466 $4,147,344 $2,716,282 $1,639,192 33
Cameron $294,747,343 $154,172,532 $101,712,217 $54,142,214 1,235
Camp $10,840,023 $5,750,540 $3,902,905 $1,971,021 47
Carson $7,489,360 $2,955,760 $1,768,218 $774,459 20
Cass $21,786,213 $11,613,410 $7,806,004 $4,945,945 96
Castro $4,667,719 $2,231,841 $1,402,643 $1,029,089 18
Chambers $38,946,945 $16,359,256 $10,225,479 $6,073,945 122
Cherokee $36,811,355 $20,077,839 $13,682,772 $7,441,961 166
Childress $4,566,311 $2,414,095 $1,618,869 $991,583 20
Clay $8,794,199 $4,538,916 $3,061,737 $1,641,786 36
Cochran $1,517,855 $756,624 $488,437 $280,670 6
The Annual Benefits Resulting from Reduced Health Care Costs Associatedwith the More Efficient Use of Advanced Practice Registered Nurses on Business
Activity in Texas as of 2040County Results

perrymangroup.com 87 © 2012 by The Perryman Group
Total Gross Personal Retail Employment
Expenditures Product Income Sales (Permanent
County (2011 Dollars) (2011 Dollars) (2011 Dollars) (2011 Dollars) Jobs)
Coke $1,799,385 $898,076 $578,948 $398,623 7
Coleman $5,823,806 $3,114,124 $2,078,856 $1,191,568 25
Collin $1,587,882,443 $833,246,869 $548,173,877 $295,787,350 6,443
Collingsworth $2,002,001 $1,098,381 $727,089 $481,779 9
Colorado $21,280,264 $11,176,820 $7,505,403 $4,402,023 94
Comal $141,840,305 $72,872,302 $47,780,363 $26,533,527 586
Comanche $11,018,620 $5,908,430 $3,962,976 $2,107,178 47
Concho $2,029,025 $1,112,938 $775,215 $384,352 9
Cooke $56,663,309 $28,682,324 $18,867,033 $11,787,363 230
Coryell $44,306,139 $23,441,235 $15,574,838 $9,089,426 193
Cottle $2,069,804 $1,198,179 $805,259 $442,515 9
Crane $3,365,915 $1,884,813 $1,307,001 $632,224 15
Crockett $2,586,568 $1,355,363 $861,999 $753,238 12
Crosby $4,421,882 $2,487,178 $1,704,526 $693,702 20
Culberson $1,551,811 $909,350 $603,444 $491,888 8
Dallam $8,197,273 $4,226,247 $2,655,725 $1,533,335 32
Dallas $8,472,682,361 $4,201,109,643 $2,689,226,160 $1,175,958,311 30,024
Dawson $9,556,789 $4,741,015 $2,926,310 $2,133,038 37
Deaf Smith $12,622,155 $6,110,781 $3,888,689 $2,070,694 46
Delta $2,818,124 $1,488,268 $1,030,188 $379,982 11
Denton $806,408,057 $409,257,537 $266,848,546 $135,843,746 3,120
DeWitt $16,912,717 $9,027,387 $6,061,507 $3,305,058 73
Dickens $1,588,891 $833,819 $543,340 $364,020 7
Dimmit $5,552,007 $3,019,785 $2,067,355 $1,318,229 26
Donley $2,220,556 $1,283,057 $881,898 $564,270 11
Duval $6,614,228 $3,446,584 $2,346,212 $1,167,836 28
Eastland $19,060,603 $9,851,919 $6,518,532 $4,212,780 82
Ector $199,620,925 $106,367,508 $71,614,490 $40,134,144 858
Edwards $968,678 $480,692 $291,426 $216,774 4
El Paso $1,035,882,275 $523,614,871 $338,793,051 $166,458,149 3,961
Ellis $129,211,136 $64,148,981 $41,355,374 $25,618,689 508
Erath $31,725,381 $17,684,466 $12,022,235 $7,081,454 149
Falls $7,533,623 $4,131,720 $2,790,325 $1,438,390 33
Fannin $20,447,294 $10,945,274 $7,320,231 $3,891,431 88
Fayette $27,601,169 $14,490,639 $9,562,117 $4,996,242 114
Fisher $2,499,288 $1,387,656 $929,682 $538,813 11
Floyd $4,542,708 $2,149,954 $1,375,705 $679,082 16
Foard $599,361 $346,189 $242,076 $117,251 3
Fort Bend $756,341,888 $366,118,437 $235,557,924 $132,345,280 2,764
Franklin $8,512,313 $4,448,083 $2,988,931 $1,736,574 36
(continued)The Annual Benefits Resulting from Reduced Health Care Costs Associated
with the More Efficient Use of Advanced Practice Registered Nurses on Business Activity in Texas as of 2040
County Results

perrymangroup.com 88 © 2012 by The Perryman Group
Total Gross Personal Retail Employment
Expenditures Product Income Sales (Permanent
County (2011 Dollars) (2011 Dollars) (2011 Dollars) (2011 Dollars) Jobs)
Freestone $17,185,452 $8,861,224 $5,786,152 $3,989,687 73
Frio $12,024,805 $6,098,442 $4,017,438 $2,271,507 48
Gaines $11,398,499 $5,293,228 $3,280,590 $2,236,381 40
Galveston $403,358,263 $205,412,640 $135,786,015 $73,029,548 1,614
Garza $4,764,593 $2,297,574 $1,463,547 $1,095,144 18
Gillespie $30,600,895 $15,777,640 $10,501,001 $5,858,695 128
Glasscock $686,179 $304,296 $183,496 $82,043 2
Goliad $3,130,038 $1,734,977 $1,184,717 $831,224 15
Gonzales $13,455,344 $7,184,417 $4,857,848 $2,703,977 59
Gray $32,855,383 $16,918,592 $11,383,687 $6,831,464 138
Grayson $129,141,885 $70,787,652 $47,452,477 $26,529,849 579
Gregg $268,417,924 $146,929,714 $99,046,925 $52,856,962 1,185
Grimes $16,533,102 $8,712,628 $5,839,858 $3,603,882 72
Guadalupe $90,154,297 $46,017,298 $29,887,192 $20,091,674 378
Hale $28,727,384 $16,052,519 $10,753,345 $6,950,552 135
Hall $2,945,436 $1,529,552 $984,192 $576,740 12
Hamilton $6,174,722 $3,285,971 $2,212,706 $1,342,691 27
Hansford $3,397,587 $1,434,156 $853,858 $543,121 10
Hardeman $1,767,880 $983,873 $648,986 $480,226 9
Hardin $41,475,616 $21,588,624 $14,167,581 $8,979,098 174
Harris $13,893,605,324 $6,614,382,085 $4,316,880,873 $1,736,221,274 47,311
Harrison $86,095,505 $43,146,786 $28,953,053 $14,260,426 334
Hartley $2,497,670 $1,199,970 $776,390 $454,366 10
Haskell $4,613,574 $2,492,384 $1,709,845 $899,217 20
Hays $136,676,523 $72,466,343 $47,823,681 $26,813,818 579
Hemphill $4,354,057 $2,058,291 $1,314,968 $774,090 15
Henderson $60,055,017 $30,775,131 $20,269,288 $11,144,560 245
Hidalgo $493,697,665 $268,836,585 $179,818,434 $95,600,936 2,183
Hill $26,201,733 $13,206,890 $8,679,558 $5,163,125 109
Hockley $19,297,002 $10,209,615 $6,864,096 $4,273,259 86
Hood $47,318,947 $24,190,441 $16,095,344 $9,160,298 195
Hopkins $29,447,924 $15,649,206 $10,310,035 $6,875,309 129
Houston $18,794,793 $9,762,126 $6,564,633 $2,925,937 74
Howard $35,424,903 $18,501,006 $12,365,943 $7,092,342 150
Hudspeth $1,549,137 $791,247 $470,814 $524,998 7
Hunt $82,440,490 $43,979,115 $29,211,434 $18,141,877 362
Hutchinson $24,900,161 $12,141,644 $7,787,802 $6,663,029 101
Irion $2,294,096 $955,302 $563,916 $427,063 7
Jack $8,991,666 $4,439,348 $2,867,140 $2,074,957 36
Jackson $9,298,181 $4,824,461 $3,100,553 $2,211,435 39
(continued)The Annual Benefits Resulting from Reduced Health Care Costs Associated
with the More Efficient Use of Advanced Practice Registered Nurses on Business Activity in Texas as of 2040
County Results

perrymangroup.com 89 © 2012 by The Perryman Group
Total Gross Personal Retail Employment
Expenditures Product Income Sales (Permanent
County (2011 Dollars) (2011 Dollars) (2011 Dollars) (2011 Dollars) Jobs)
Jasper $29,409,060 $16,012,680 $10,827,262 $6,386,042 134
Jeff Davis $1,890,480 $993,766 $663,970 $382,790 8
Jefferson $471,662,320 $252,254,392 $171,281,371 $92,601,198 2,032
Jim Hogg $2,899,043 $1,514,751 $951,043 $802,497 12
Jim Wells $47,154,205 $26,709,273 $17,964,538 $10,522,873 220
Johnson $140,530,134 $74,256,653 $49,821,048 $27,413,603 604
Jones $11,563,921 $6,109,104 $4,092,034 $2,133,149 49
Karnes $9,323,260 $4,608,940 $3,032,046 $1,764,389 36
Kaufman $85,538,007 $44,531,578 $29,703,027 $16,850,389 365
Kendall $43,184,571 $21,550,616 $14,056,785 $8,497,698 172
Kenedy $378,795 $186,872 $119,054 $131,488 2
Kent $491,093 $229,213 $141,424 $95,325 2
Kerr $58,377,467 $30,854,875 $20,349,458 $11,765,314 250
Kimble $4,338,947 $2,036,878 $1,270,200 $879,463 16
King $188,986 $90,411 $56,386 $26,241 1
Kinney $1,874,677 $913,821 $572,298 $378,321 7
Kleberg $27,364,460 $14,438,541 $9,650,988 $5,499,818 118
Knox $2,102,859 $1,149,073 $775,030 $375,868 9
La Salle $3,808,164 $2,116,397 $1,434,819 $916,523 18
Lamar $55,975,005 $29,279,751 $19,690,176 $11,235,465 240
Lamb $7,367,384 $3,613,855 $2,351,413 $1,421,337 28
Lampasas $16,459,577 $8,709,045 $5,814,418 $3,405,598 72
Lavaca $16,776,624 $9,319,146 $6,282,781 $3,477,078 77
Lee $15,191,800 $7,765,050 $5,070,723 $2,968,623 61
Leon $13,094,276 $6,983,266 $4,401,826 $3,528,377 57
Liberty $65,994,233 $35,283,382 $23,868,569 $12,938,000 284
Limestone $17,177,250 $9,376,710 $6,418,348 $3,862,432 79
Lipscomb $2,469,830 $1,112,824 $682,479 $384,100 8
Live Oak $8,398,114 $4,261,232 $2,799,454 $1,948,565 35
Llano $14,172,654 $7,329,618 $4,834,207 $2,750,044 59
Loving $15,572 $5,536 $3,598 $2,278 0
Lubbock $378,709,476 $202,222,170 $133,575,630 $67,972,682 1,577
Lynn $2,852,950 $1,396,953 $879,398 $369,705 10
Madison $9,837,907 $5,247,743 $3,497,474 $2,193,820 44
Marion $6,265,229 $3,311,794 $2,227,967 $1,326,427 28
Martin $4,860,353 $2,490,755 $1,667,453 $849,606 19
Mason $3,441,326 $1,759,874 $1,156,080 $667,870 14
Matagorda $41,270,686 $20,174,704 $13,183,970 $9,509,902 166
Maverick $24,753,815 $13,224,859 $8,811,750 $5,209,241 110
McCulloch $7,282,691 $3,949,054 $2,670,430 $1,533,779 32
(continued)The Annual Benefits Resulting from Reduced Health Care Costs Associated
with the More Efficient Use of Advanced Practice Registered Nurses on Business Activity in Texas as of 2040
County Results

perrymangroup.com 90 © 2012 by The Perryman Group
Total Gross Personal Retail Employment
Expenditures Product Income Sales (Permanent
County (2011 Dollars) (2011 Dollars) (2011 Dollars) (2011 Dollars) Jobs)
McLennan $380,208,340 $192,962,708 $125,774,613 $64,734,446 1,502
McMullen $361,967 $163,006 $98,654 $55,727 1
Medina $25,181,987 $12,583,069 $8,188,904 $4,858,985 101
Menard $1,132,832 $596,046 $376,152 $291,945 5
Midland $285,513,720 $148,887,732 $96,977,552 $55,099,454 1,141
Milam $16,031,319 $8,341,226 $5,590,365 $3,502,081 69
Mills $2,582,322 $1,554,924 $1,067,613 $624,362 13
Mitchell $5,563,281 $3,058,186 $2,055,553 $1,195,833 25
Montague $19,942,596 $10,200,680 $6,749,302 $3,897,126 83
Montgomery $632,437,430 $316,658,395 $210,341,204 $104,493,090 2,446
Moore $24,137,487 $10,792,655 $6,793,131 $4,412,188 82
Morris $10,641,675 $5,059,995 $3,394,896 $1,569,880 39
Motley $983,681 $486,394 $309,424 $192,303 4
Nacogdoches $50,493,166 $27,683,211 $18,838,146 $10,996,332 235
Navarro $44,653,263 $23,108,167 $15,463,151 $7,966,804 185
Newton $2,980,141 $1,839,322 $1,273,515 $875,656 16
Nolan $15,126,214 $8,103,789 $5,295,515 $3,149,167 64
Nueces $582,548,447 $287,738,446 $189,964,220 $98,991,688 2,228
Ochiltree $11,457,946 $5,431,196 $3,451,845 $2,268,532 41
Oldham $559,986 $307,952 $200,813 $188,958 3
Orange $76,420,726 $40,773,133 $27,520,282 $16,818,290 338
Palo Pinto $29,740,489 $14,500,193 $9,322,032 $5,817,273 115
Panola $26,067,819 $13,559,206 $9,124,258 $5,162,738 109
Parker $99,776,196 $48,367,402 $30,846,829 $19,158,270 379
Parmer $5,200,951 $2,268,411 $1,469,195 $504,444 16
Pecos $13,773,564 $7,089,178 $4,629,064 $3,183,925 59
Polk $31,495,155 $17,073,977 $11,296,347 $7,070,622 138
Potter $254,689,703 $136,082,756 $90,229,367 $46,493,159 1,064
Presidio $5,012,794 $2,414,678 $1,522,166 $1,060,235 19
Rains $5,016,664 $2,335,122 $1,425,985 $1,167,173 18
Randall $97,999,526 $51,920,394 $33,892,529 $19,199,383 409
Reagan $3,016,442 $1,561,468 $957,574 $838,577 12
Real $2,229,514 $1,114,279 $729,329 $424,605 9
Red River $6,796,937 $3,550,588 $2,363,677 $1,260,488 28
Reeves $6,959,059 $3,588,751 $2,326,943 $1,774,518 30
Refugio $3,960,309 $2,011,284 $1,249,218 $1,202,482 17
Roberts $129,471 $59,520 $35,827 $38,249 0
Robertson $13,856,145 $7,288,839 $4,858,459 $3,209,851 61
Rockwall $79,911,367 $42,127,157 $28,147,448 $15,193,968 336
Runnels $7,724,173 $3,686,481 $2,365,724 $1,412,940 29
(continued)The Annual Benefits Resulting from Reduced Health Care Costs Associated
with the More Efficient Use of Advanced Practice Registered Nurses on Business Activity in Texas as of 2040
County Results
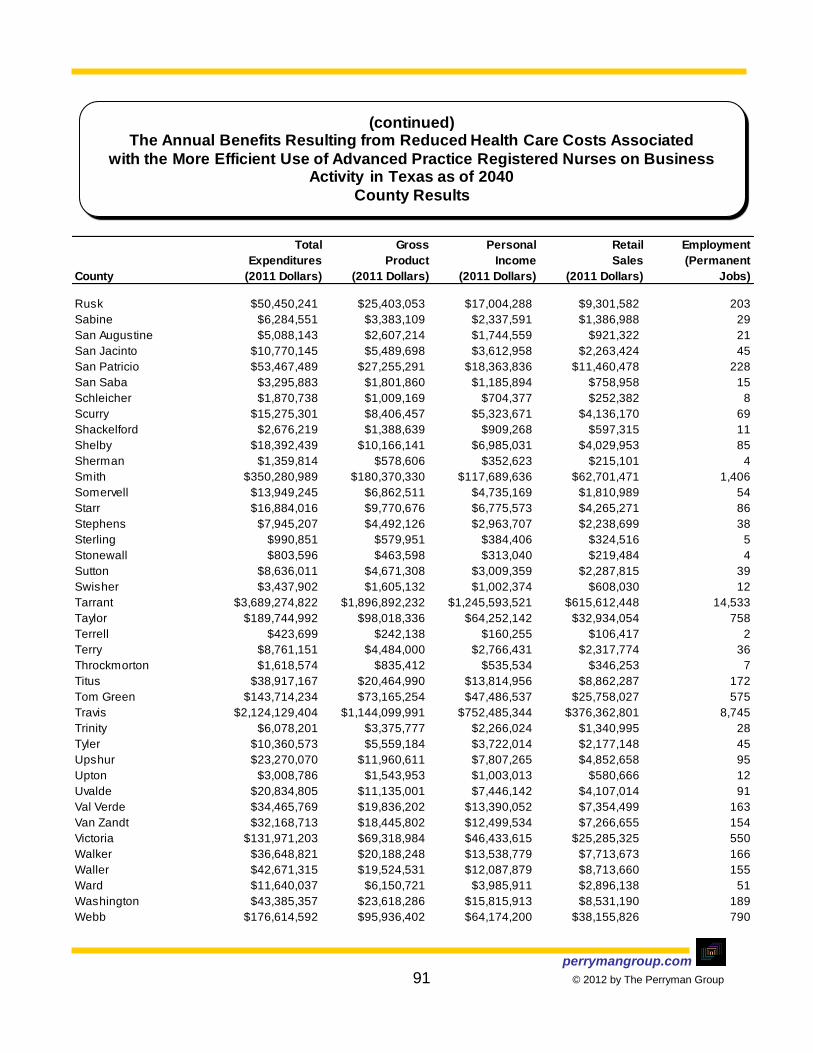
perrymangroup.com 91 © 2012 by The Perryman Group
Total Gross Personal Retail Employment
Expenditures Product Income Sales (Permanent
County (2011 Dollars) (2011 Dollars) (2011 Dollars) (2011 Dollars) Jobs)
Rusk $50,450,241 $25,403,053 $17,004,288 $9,301,582 203
Sabine $6,284,551 $3,383,109 $2,337,591 $1,386,988 29
San Augustine $5,088,143 $2,607,214 $1,744,559 $921,322 21
San Jacinto $10,770,145 $5,489,698 $3,612,958 $2,263,424 45
San Patricio $53,467,489 $27,255,291 $18,363,836 $11,460,478 228
San Saba $3,295,883 $1,801,860 $1,185,894 $758,958 15
Schleicher $1,870,738 $1,009,169 $704,377 $252,382 8
Scurry $15,275,301 $8,406,457 $5,323,671 $4,136,170 69
Shackelford $2,676,219 $1,388,639 $909,268 $597,315 11
Shelby $18,392,439 $10,166,141 $6,985,031 $4,029,953 85
Sherman $1,359,814 $578,606 $352,623 $215,101 4
Smith $350,280,989 $180,370,330 $117,689,636 $62,701,471 1,406
Somervell $13,949,245 $6,862,511 $4,735,169 $1,810,989 54
Starr $16,884,016 $9,770,676 $6,775,573 $4,265,271 86
Stephens $7,945,207 $4,492,126 $2,963,707 $2,238,699 38
Sterling $990,851 $579,951 $384,406 $324,516 5
Stonewall $803,596 $463,598 $313,040 $219,484 4
Sutton $8,636,011 $4,671,308 $3,009,359 $2,287,815 39
Swisher $3,437,902 $1,605,132 $1,002,374 $608,030 12
Tarrant $3,689,274,822 $1,896,892,232 $1,245,593,521 $615,612,448 14,533
Taylor $189,744,992 $98,018,336 $64,252,142 $32,934,054 758
Terrell $423,699 $242,138 $160,255 $106,417 2
Terry $8,761,151 $4,484,000 $2,766,431 $2,317,774 36
Throckmorton $1,618,574 $835,412 $535,534 $346,253 7
Titus $38,917,167 $20,464,990 $13,814,956 $8,862,287 172
Tom Green $143,714,234 $73,165,254 $47,486,537 $25,758,027 575
Travis $2,124,129,404 $1,144,099,991 $752,485,344 $376,362,801 8,745
Trinity $6,078,201 $3,375,777 $2,266,024 $1,340,995 28
Tyler $10,360,573 $5,559,184 $3,722,014 $2,177,148 45
Upshur $23,270,070 $11,960,611 $7,807,265 $4,852,658 95
Upton $3,008,786 $1,543,953 $1,003,013 $580,666 12
Uvalde $20,834,805 $11,135,001 $7,446,142 $4,107,014 91
Val Verde $34,465,769 $19,836,202 $13,390,052 $7,354,499 163
Van Zandt $32,168,713 $18,445,802 $12,499,534 $7,266,655 154
Victoria $131,971,203 $69,318,984 $46,433,615 $25,285,325 550
Walker $36,648,821 $20,188,248 $13,538,779 $7,713,673 166
Waller $42,671,315 $19,524,531 $12,087,879 $8,713,660 155
Ward $11,640,037 $6,150,721 $3,985,911 $2,896,138 51
Washington $43,385,357 $23,618,286 $15,815,913 $8,531,190 189
Webb $176,614,592 $95,936,402 $64,174,200 $38,155,826 790
(continued)The Annual Benefits Resulting from Reduced Health Care Costs Associated
with the More Efficient Use of Advanced Practice Registered Nurses on Business Activity in Texas as of 2040
County Results

perrymangroup.com 92 © 2012 by The Perryman Group
Total Gross Personal Retail Employment
Expenditures Product Income Sales (Permanent
County (2011 Dollars) (2011 Dollars) (2011 Dollars) (2011 Dollars) Jobs)
Wharton $39,244,974 $21,556,832 $14,603,381 $8,472,659 180
Wheeler $4,753,968 $2,691,527 $1,800,094 $1,234,397 23
Wichita $164,036,162 $91,898,265 $61,675,928 $34,802,436 748
Wilbarger $16,142,167 $8,515,936 $5,693,479 $3,222,469 69
Willacy $8,835,403 $4,981,996 $3,296,222 $2,091,327 41
Williamson $305,478,797 $164,804,480 $109,221,109 $64,124,321 1,321
Wilson $21,355,699 $11,016,725 $7,365,121 $4,216,912 91
Winkler $6,712,974 $3,527,158 $2,299,087 $1,658,825 29
Wise $57,474,363 $30,007,943 $19,558,805 $12,904,161 242
Wood $31,766,764 $16,355,010 $10,820,426 $5,952,643 131
Yoakum $9,154,826 $4,536,914 $2,881,950 $2,264,957 37
Young $25,018,755 $13,324,907 $8,717,802 $5,708,624 108
Zapata $6,963,187 $3,797,843 $2,552,249 $1,746,532 33
Zavala $4,083,824 $2,449,260 $1,720,330 $1,023,397 22
TOTAL STATE IMPACT $46,931,250,896 $23,598,355,948 $15,430,532,595 $7,383,383,524 177,220
SOURCE: US Multi-Regional Impact Assessment System, The Perryman Group
(continued)The Annual Benefits Resulting from Reduced Health Care Costs Associated
with the More Efficient Use of Advanced Practice Registered Nurses on Business Activity in Texas as of 2040
County Results

perrymangroup.com 93 © 2012 by The Perryman Group
APPENDIX C: Detailed Forecast Results

perrymangroup.com 94 © 2012 by The Perryman Group
Forestry,
Fishing, Fishing, Agriculture
Total Related, Forestry & Hunting, & Forestry Total Oil & Gas
Date Agriculture Farm Other Logging Trapping Support Mining Extraction
2001 $6,394.615 $4,967.087 $1,427.528 $261.740 $146.482 $1,019.306 $44,071.477 $35,729.969
2002 $7,456.156 $6,032.070 $1,424.086 $241.350 $132.086 $1,050.650 $39,217.479 $31,950.210
2003 $8,094.240 $6,619.089 $1,475.151 $247.927 $127.936 $1,099.288 $57,914.782 $48,478.872
2004 $9,877.460 $8,308.789 $1,568.671 $245.351 $127.758 $1,195.562 $68,249.420 $56,974.450
2005 $9,239.490 $7,469.879 $1,769.611 $288.976 $128.270 $1,352.365 $91,258.056 $75,638.412
2006 $7,291.057 $5,653.905 $1,637.152 $255.267 $116.212 $1,265.673 $97,228.563 $77,392.590
2007 $8,735.006 $7,112.913 $1,622.093 $254.211 $122.378 $1,245.504 $111,209.986 $86,643.461
2008 $7,934.640 $6,390.608 $1,544.032 $244.883 $109.732 $1,189.417 $142,152.575 $113,610.643
2009 $6,045.850 $4,467.055 $1,578.795 $251.100 $117.418 $1,210.277 $98,488.784 $74,094.087
2010 $6,013.701 $4,530.442 $1,483.259 $228.690 $102.251 $1,152.319 $147,298.587 $123,035.307
2011 $5,974.979 $4,477.261 $1,497.717 $227.660 $101.675 $1,168.382 $178,621.641 $149,502.713
2012 $6,206.844 $4,625.735 $1,581.109 $236.929 $105.695 $1,238.485 $194,812.437 $166,494.670
2013 $6,466.505 $4,792.575 $1,673.930 $247.267 $110.182 $1,316.481 $210,752.948 $181,422.742
2014 $6,759.703 $4,981.623 $1,778.080 $258.897 $115.234 $1,403.949 $228,497.662 $197,255.167
2015 $7,063.406 $5,175.533 $1,887.873 $270.937 $120.457 $1,496.480 $247,649.106 $214,283.496
2016 $7,377.843 $5,374.284 $2,003.559 $283.394 $125.853 $1,594.312 $266,457.033 $231,070.066
2017 $7,703.240 $5,577.848 $2,125.392 $296.275 $131.424 $1,697.692 $285,420.493 $248,053.446
2018 $8,039.818 $5,786.185 $2,253.633 $309.586 $137.174 $1,806.873 $305,343.815 $265,934.259
2019 $8,387.795 $5,999.245 $2,388.551 $323.333 $143.103 $1,922.115 $326,241.546 $284,728.805
2020 $8,747.387 $6,216.967 $2,530.420 $337.520 $149.213 $2,043.687 $348,125.447 $304,450.791
2021 $9,118.803 $6,439.280 $2,679.523 $352.153 $155.506 $2,171.864 $371,004.226 $325,111.169
2022 $9,502.247 $6,666.100 $2,836.146 $367.236 $161.983 $2,306.928 $394,883.288 $346,717.895
2023 $9,897.917 $6,897.334 $3,000.584 $382.772 $168.645 $2,449.167 $419,764.494 $369,275.696
2024 $10,306.007 $7,132.874 $3,173.134 $398.764 $175.492 $2,598.877 $445,645.928 $392,785.838
2025 $10,726.702 $7,372.601 $3,354.101 $415.215 $182.526 $2,756.360 $472,521.676 $417,245.901
2026 $11,160.180 $7,616.384 $3,543.795 $432.128 $189.746 $2,921.922 $500,381.614 $442,649.570
2027 $11,606.610 $7,864.080 $3,742.530 $449.502 $197.152 $3,095.877 $529,211.212 $468,986.429
2028 $12,066.155 $8,115.531 $3,950.625 $467.339 $204.743 $3,278.543 $558,991.359 $496,241.779
2029 $12,538.967 $8,370.567 $4,168.400 $485.637 $212.519 $3,470.244 $589,698.197 $524,396.473
2030 $13,025.188 $8,629.005 $4,396.183 $504.397 $220.479 $3,671.307 $621,302.990 $553,426.762
2031 $13,524.948 $8,890.654 $4,634.294 $523.615 $228.621 $3,882.059 $653,772.055 $583,304.218
2032 $14,038.368 $9,155.308 $4,883.060 $543.287 $236.942 $4,102.830 $687,066.635 $613,995.594
2033 $14,565.556 $9,422.752 $5,142.804 $563.410 $245.441 $4,333.953 $721,142.833 $645,462.748
2034 $15,106.606 $9,692.754 $5,413.852 $583.978 $254.113 $4,575.760 $755,951.588 $677,662.587
2035 $15,661.602 $9,965.074 $5,696.528 $604.985 $262.957 $4,828.586 $791,438.670 $710,547.056
2036 $16,230.633 $10,239.471 $5,991.162 $626.424 $271.967 $5,092.770 $827,543.343 $744,061.966
2037 $16,813.776 $10,515.694 $6,298.082 $648.287 $281.141 $5,368.653 $864,199.573 $778,147.974
2038 $17,411.097 $10,793.481 $6,617.616 $670.567 $290.474 $5,656.575 $901,336.129 $812,740.674
2039 $18,022.648 $11,072.560 $6,950.088 $693.252 $299.962 $5,956.874 $938,876.721 $847,770.718
2040 $18,648.471 $11,352.651 $7,295.820 $716.334 $309.599 $6,269.888 $976,740.173 $883,163.953
*M illio ns o f D o llars
Historical and Projected Values for Nominal Gross Product by Detailed Industrial Classification
for Texas*

perrymangroup.com 95 © 2012 by The Perryman Group
Mining Support Heavy & Specialty
(Except Activities for Total Construction Civil Eng. Trade Total
Date Oil & Gas) Mining Utilities Construction of Buildings Construction Contractors Manufacturing
2001 $965.304 $7,376.204 $24,255.453 $40,258.712 $12,235.790 $5,648.916 $22,374.006 $92,274.322
2002 $907.427 $6,359.842 $24,865.472 $41,870.968 $13,220.942 $5,864.244 $22,785.782 $94,459.945
2003 $950.674 $8,485.236 $27,677.572 $43,473.838 $13,634.576 $5,863.066 $23,976.196 $93,158.092
2004 $1,043.517 $10,231.453 $30,679.882 $45,647.959 $14,104.610 $6,161.344 $25,382.005 $119,031.023
2005 $1,169.955 $14,449.689 $31,881.061 $51,825.218 $15,789.948 $7,245.870 $28,789.400 $125,539.229
2006 $1,538.058 $18,297.915 $25,713.582 $56,129.468 $17,122.570 $8,583.363 $30,423.535 $158,471.416
2007 $1,609.343 $22,957.182 $26,635.212 $59,368.394 $17,811.963 $9,499.812 $32,056.619 $172,047.230
2008 $2,029.664 $26,512.268 $28,722.353 $59,386.392 $17,473.086 $10,623.146 $31,290.160 $152,491.391
2009 $2,119.429 $22,275.268 $28,132.387 $51,433.749 $15,259.615 $9,433.151 $26,740.983 $148,912.310
2010 $1,859.711 $22,403.570 $28,037.874 $48,965.950 $13,950.117 $8,816.308 $26,199.524 $157,147.776
2011 $2,282.133 $26,836.794 $30,607.426 $52,739.278 $14,631.828 $9,569.446 $28,538.003 $168,872.668
2012 $2,268.939 $26,048.828 $32,687.105 $56,287.901 $15,537.432 $10,206.487 $30,543.982 $181,519.628
2013 $2,402.179 $26,928.027 $34,786.727 $60,106.742 $16,485.995 $10,897.220 $32,723.527 $194,507.229
2014 $2,615.113 $28,627.383 $37,485.354 $64,054.140 $17,433.403 $11,616.970 $35,003.767 $207,544.483
2015 $2,853.819 $30,511.790 $40,377.484 $68,126.299 $18,380.427 $12,364.432 $37,381.440 $220,630.557
2016 $3,092.300 $32,294.667 $42,738.698 $72,212.788 $19,302.389 $13,118.187 $39,792.212 $234,137.456
2017 $3,335.538 $34,031.509 $44,973.392 $76,365.558 $20,215.827 $13,887.000 $42,262.732 $248,193.270
2018 $3,592.903 $35,816.653 $47,233.245 $80,607.858 $21,129.464 $14,674.398 $44,803.996 $262,645.207
2019 $3,864.739 $37,648.002 $49,564.007 $84,859.441 $22,024.584 $15,465.159 $47,369.699 $277,771.566
2020 $4,151.366 $39,523.290 $51,963.928 $89,290.859 $22,948.346 $16,289.613 $50,052.900 $293,642.883
2021 $4,453.067 $41,439.990 $54,430.824 $93,914.506 $23,904.908 $17,149.600 $52,859.999 $310,287.700
2022 $4,770.084 $43,395.309 $56,962.057 $98,734.173 $24,897.548 $18,045.057 $55,791.568 $327,735.144
2023 $5,102.611 $45,386.186 $59,554.513 $103,752.278 $25,928.589 $18,975.829 $58,847.859 $346,014.906
2024 $5,450.795 $47,409.295 $62,204.579 $108,976.175 $27,000.907 $19,942.833 $62,032.435 $365,157.223
2025 $5,814.725 $49,461.049 $64,908.124 $114,407.466 $28,116.427 $20,945.819 $65,345.220 $385,192.845
2026 $6,194.434 $51,537.610 $67,660.471 $120,053.780 $29,277.878 $21,985.809 $68,790.093 $406,153.009
2027 $6,589.891 $53,634.893 $70,456.387 $125,919.105 $30,487.771 $23,062.996 $72,368.338 $428,069.407
2028 $7,000.999 $55,748.580 $73,290.080 $132,015.877 $31,750.546 $24,179.150 $76,086.181 $450,974.146
2029 $7,427.593 $57,874.130 $76,155.185 $138,341.338 $33,068.551 $25,332.879 $79,939.909 $474,899.714
2030 $7,869.433 $60,006.795 $79,044.765 $144,905.914 $34,445.728 $26,525.593 $83,934.594 $499,878.934
2031 $8,326.204 $62,141.634 $81,952.523 $151,695.925 $35,881.626 $27,753.972 $88,060.327 $525,944.922
2032 $8,797.512 $64,273.529 $84,871.796 $158,696.776 $37,372.232 $29,015.365 $92,309.179 $553,131.036
2033 $9,282.882 $66,397.203 $87,795.577 $165,908.516 $38,914.252 $30,310.470 $96,683.793 $581,470.821
2034 $9,781.757 $68,507.244 $90,716.535 $173,330.758 $40,504.917 $31,639.758 $101,186.083 $610,997.959
2035 $10,293.493 $70,598.121 $93,627.046 $180,962.662 $42,141.836 $33,003.505 $105,817.322 $641,746.203
2036 $10,817.339 $72,664.038 $96,519.106 $188,802.918 $43,822.884 $34,401.815 $110,578.219 $673,747.770
2037 $11,352.455 $74,699.144 $99,384.419 $196,849.725 $45,546.122 $35,834.640 $115,468.963 $707,034.490
2038 $11,897.914 $76,697.540 $102,214.425 $205,100.778 $47,309.732 $37,301.789 $120,489.257 $741,637.705
2039 $12,452.701 $78,653.301 $105,000.335 $213,553.250 $49,111.965 $38,802.941 $125,638.344 $777,588.158
2040 $13,015.714 $80,560.506 $107,733.169 $222,203.783 $50,951.106 $40,337.649 $130,915.027 $814,915.882
*M illio ns o f D o llars
Historical and Projected Values for Nominal Gross Product by Detailed Industrial Classification
for Texas*

perrymangroup.com 96 © 2012 by The Perryman Group
Electrical
NonMetallic Primary Fabricated Computer & Equipment &
Durable Wood Mineral Metal Metal Machinery Electronic Appliance
Date Goods Products Products Mfg. Products Mfg. Products Manufacturing
2001 $51,189.468 $1,644.698 $4,128.134 $2,191.770 $8,252.355 $7,044.521 $14,229.886 $1,911.107
2002 $52,068.345 $1,686.744 $4,654.429 $1,974.616 $7,867.680 $6,315.606 $14,131.715 $2,047.529
2003 $48,399.588 $1,737.338 $4,039.044 $1,767.872 $7,266.456 $6,469.358 $12,505.088 $1,967.396
2004 $56,708.634 $1,868.983 $4,608.721 $3,255.352 $7,749.737 $9,643.355 $15,485.376 $1,846.177
2005 $62,072.053 $1,842.082 $5,373.223 $2,826.404 $9,507.468 $10,960.823 $16,207.690 $2,027.554
2006 $76,609.402 $1,494.421 $4,377.035 $3,421.742 $10,436.324 $12,746.873 $27,956.194 $2,146.173
2007 $77,248.074 $1,460.768 $4,248.596 $3,365.667 $12,192.740 $15,011.992 $21,947.694 $1,994.328
2008 $80,103.682 $1,382.939 $4,065.354 $4,041.059 $12,714.688 $14,756.853 $23,948.790 $2,380.788
2009 $77,782.850 $1,297.695 $3,732.740 $2,649.784 $11,185.828 $12,575.394 $25,992.626 $2,543.585
2010 $79,437.863 $1,287.397 $4,206.377 $2,547.147 $13,828.351 $15,964.310 $21,568.848 $2,490.871
2011 $85,540.828 $1,384.860 $4,601.611 $2,760.436 $14,683.005 $17,443.344 $23,115.905 $2,649.871
2012 $91,364.473 $1,477.631 $4,992.275 $2,967.689 $15,461.316 $18,901.499 $24,571.135 $2,795.963
2013 $97,284.463 $1,571.802 $5,398.567 $3,181.126 $16,228.160 $20,415.222 $26,036.003 $2,940.866
2014 $103,087.847 $1,663.935 $5,808.790 $3,393.914 $16,948.033 $21,940.126 $27,453.264 $3,078.162
2015 $108,891.789 $1,755.931 $6,229.397 $3,609.974 $17,640.970 $23,500.511 $28,854.282 $3,211.481
2016 $114,725.366 $1,848.265 $6,662.123 $3,830.399 $18,311.841 $25,102.781 $30,246.584 $3,341.716
2017 $120,647.164 $1,941.884 $7,110.540 $4,057.304 $18,969.889 $26,760.216 $31,645.289 $3,470.567
2018 $126,481.699 $2,033.967 $7,564.419 $4,284.936 $19,587.572 $28,434.162 $33,004.129 $3,592.998
2019 $132,483.813 $2,128.619 $8,039.026 $4,522.059 $20,204.650 $30,181.869 $34,389.495 $3,716.300
2020 $138,699.823 $2,226.582 $8,537.679 $4,770.534 $20,827.185 $32,015.507 $35,812.555 $3,841.622
2021 $145,133.284 $2,327.910 $9,061.187 $5,030.798 $21,454.514 $33,937.783 $37,273.234 $3,968.883
2022 $151,787.579 $2,432.656 $9,610.357 $5,303.300 $22,085.944 $35,951.392 $38,771.396 $4,097.997
2023 $158,665.905 $2,540.868 $10,185.994 $5,588.500 $22,720.753 $38,059.006 $40,306.837 $4,228.870
2024 $165,771.254 $2,652.593 $10,788.900 $5,886.869 $23,358.195 $40,263.264 $41,879.283 $4,361.403
2025 $173,106.400 $2,767.875 $11,419.866 $6,198.890 $23,997.500 $42,566.765 $43,488.389 $4,495.489
2026 $180,673.886 $2,886.752 $12,079.677 $6,525.055 $24,637.871 $44,972.060 $45,133.737 $4,631.016
2027 $188,476.004 $3,009.262 $12,769.105 $6,865.870 $25,278.492 $47,481.641 $46,814.837 $4,767.867
2028 $196,514.780 $3,135.438 $13,488.907 $7,221.848 $25,918.526 $50,097.932 $48,531.119 $4,905.918
2029 $204,791.962 $3,265.307 $14,239.821 $7,593.515 $26,557.117 $52,823.281 $50,281.939 $5,045.038
2030 $213,309.002 $3,398.896 $15,022.567 $7,981.408 $27,193.392 $55,659.946 $52,066.573 $5,185.092
2031 $222,067.040 $3,536.225 $15,837.840 $8,386.072 $27,826.464 $58,610.086 $53,884.216 $5,325.946
2032 $231,066.889 $3,677.311 $16,686.308 $8,808.064 $28,455.432 $61,675.750 $55,733.984 $5,467.459
2033 $240,309.024 $3,822.165 $17,568.610 $9,247.950 $29,079.383 $64,858.870 $57,614.910 $5,609.488
2034 $249,793.559 $3,970.796 $18,485.353 $9,706.305 $29,697.397 $68,161.243 $59,525.947 $5,751.884
2035 $259,520.241 $4,123.206 $19,437.108 $10,183.714 $30,308.548 $71,584.528 $61,465.965 $5,894.495
2036 $269,488.335 $4,279.390 $20,424.399 $10,680.768 $30,911.894 $75,130.202 $63,433.732 $6,037.163
2037 $279,696.690 $4,439.340 $21,447.705 $11,198.063 $31,506.489 $78,799.574 $65,427.928 $6,179.724
2038 $290,143.721 $4,603.040 $22,507.460 $11,736.207 $32,091.389 $82,593.767 $67,447.149 $6,322.013
2039 $300,827.397 $4,770.469 $23,604.044 $12,295.810 $32,665.649 $86,513.713 $69,489.907 $6,463.862
2040 $311,745.230 $4,941.600 $24,737.784 $12,877.490 $33,228.330 $90,560.137 $71,554.629 $6,605.096
*M illio ns o f D o llars
Historical and Projected Values for Nominal Gross Product by Detailed Industrial Classification
for Texas*
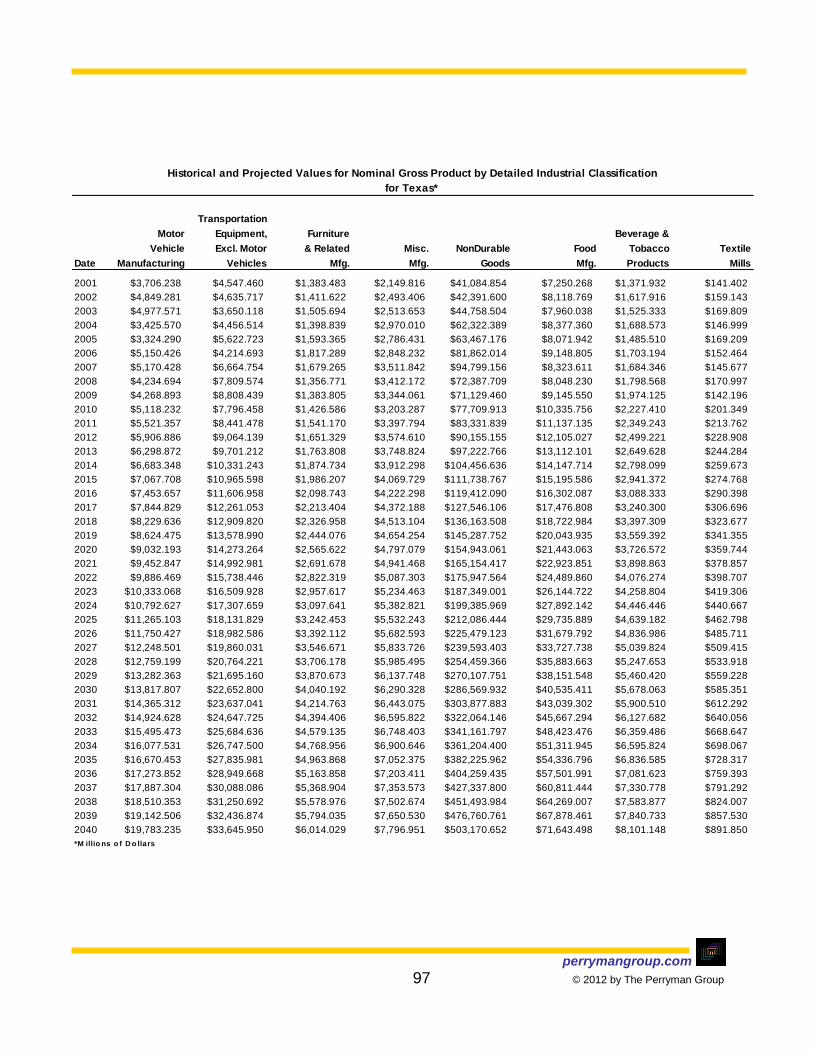
perrymangroup.com 97 © 2012 by The Perryman Group
Transportation
Motor Equipment, Furniture Beverage &
Vehicle Excl. Motor & Related Misc. NonDurable Food Tobacco Textile
Date Manufacturing Vehicles Mfg. Mfg. Goods Mfg. Products Mills
2001 $3,706.238 $4,547.460 $1,383.483 $2,149.816 $41,084.854 $7,250.268 $1,371.932 $141.402
2002 $4,849.281 $4,635.717 $1,411.622 $2,493.406 $42,391.600 $8,118.769 $1,617.916 $159.143
2003 $4,977.571 $3,650.118 $1,505.694 $2,513.653 $44,758.504 $7,960.038 $1,525.333 $169.809
2004 $3,425.570 $4,456.514 $1,398.839 $2,970.010 $62,322.389 $8,377.360 $1,688.573 $146.999
2005 $3,324.290 $5,622.723 $1,593.365 $2,786.431 $63,467.176 $8,071.942 $1,485.510 $169.209
2006 $5,150.426 $4,214.693 $1,817.289 $2,848.232 $81,862.014 $9,148.805 $1,703.194 $152.464
2007 $5,170.428 $6,664.754 $1,679.265 $3,511.842 $94,799.156 $8,323.611 $1,684.346 $145.677
2008 $4,234.694 $7,809.574 $1,356.771 $3,412.172 $72,387.709 $8,048.230 $1,798.568 $170.997
2009 $4,268.893 $8,808.439 $1,383.805 $3,344.061 $71,129.460 $9,145.550 $1,974.125 $142.196
2010 $5,118.232 $7,796.458 $1,426.586 $3,203.287 $77,709.913 $10,335.756 $2,227.410 $201.349
2011 $5,521.357 $8,441.478 $1,541.170 $3,397.794 $83,331.839 $11,137.135 $2,349.243 $213.762
2012 $5,906.886 $9,064.139 $1,651.329 $3,574.610 $90,155.155 $12,105.027 $2,499.221 $228.908
2013 $6,298.872 $9,701.212 $1,763.808 $3,748.824 $97,222.766 $13,112.101 $2,649.628 $244.284
2014 $6,683.348 $10,331.243 $1,874.734 $3,912.298 $104,456.636 $14,147.714 $2,798.099 $259.673
2015 $7,067.708 $10,965.598 $1,986.207 $4,069.729 $111,738.767 $15,195.586 $2,941.372 $274.768
2016 $7,453.657 $11,606.958 $2,098.743 $4,222.298 $119,412.090 $16,302.087 $3,088.333 $290.398
2017 $7,844.829 $12,261.053 $2,213.404 $4,372.188 $127,546.106 $17,476.808 $3,240.300 $306.696
2018 $8,229.636 $12,909.820 $2,326.958 $4,513.104 $136,163.508 $18,722.984 $3,397.309 $323.677
2019 $8,624.475 $13,578.990 $2,444.076 $4,654.254 $145,287.752 $20,043.935 $3,559.392 $341.355
2020 $9,032.193 $14,273.264 $2,565.622 $4,797.079 $154,943.061 $21,443.063 $3,726.572 $359.744
2021 $9,452.847 $14,992.981 $2,691.678 $4,941.468 $165,154.417 $22,923.851 $3,898.863 $378.857
2022 $9,886.469 $15,738.446 $2,822.319 $5,087.303 $175,947.564 $24,489.860 $4,076.274 $398.707
2023 $10,333.068 $16,509.928 $2,957.617 $5,234.463 $187,349.001 $26,144.722 $4,258.804 $419.306
2024 $10,792.627 $17,307.659 $3,097.641 $5,382.821 $199,385.969 $27,892.142 $4,446.446 $440.667
2025 $11,265.103 $18,131.829 $3,242.453 $5,532.243 $212,086.444 $29,735.889 $4,639.182 $462.798
2026 $11,750.427 $18,982.586 $3,392.112 $5,682.593 $225,479.123 $31,679.792 $4,836.986 $485.711
2027 $12,248.501 $19,860.031 $3,546.671 $5,833.726 $239,593.403 $33,727.738 $5,039.824 $509.415
2028 $12,759.199 $20,764.221 $3,706.178 $5,985.495 $254,459.366 $35,883.663 $5,247.653 $533.918
2029 $13,282.363 $21,695.160 $3,870.673 $6,137.748 $270,107.751 $38,151.548 $5,460.420 $559.228
2030 $13,817.807 $22,652.800 $4,040.192 $6,290.328 $286,569.932 $40,535.411 $5,678.063 $585.351
2031 $14,365.312 $23,637.041 $4,214.763 $6,443.075 $303,877.883 $43,039.302 $5,900.510 $612.292
2032 $14,924.628 $24,647.725 $4,394.406 $6,595.822 $322,064.146 $45,667.294 $6,127.682 $640.056
2033 $15,495.473 $25,684.636 $4,579.135 $6,748.403 $341,161.797 $48,423.476 $6,359.486 $668.647
2034 $16,077.531 $26,747.500 $4,768.956 $6,900.646 $361,204.400 $51,311.945 $6,595.824 $698.067
2035 $16,670.453 $27,835.981 $4,963.868 $7,052.375 $382,225.962 $54,336.796 $6,836.585 $728.317
2036 $17,273.852 $28,949.668 $5,163.858 $7,203.411 $404,259.435 $57,501.991 $7,081.623 $759.393
2037 $17,887.304 $30,088.086 $5,368.904 $7,353.573 $427,337.800 $60,811.444 $7,330.778 $791.292
2038 $18,510.353 $31,250.692 $5,578.976 $7,502.674 $451,493.984 $64,269.007 $7,583.877 $824.007
2039 $19,142.506 $32,436.874 $5,794.035 $7,650.530 $476,760.761 $67,878.461 $7,840.733 $857.530
2040 $19,783.235 $33,645.950 $6,014.029 $7,796.951 $503,170.652 $71,643.498 $8,101.148 $891.850
*M illio ns o f D o llars
Historical and Projected Values for Nominal Gross Product by Detailed Industrial Classification
for Texas*

perrymangroup.com 98 © 2012 by The Perryman Group
Textile Leather & Paper Printing Petroleum Chemical Plastics &
Product Apparel Allied Manu- & Related & Coal Manu- Rubber
Date Mills Manufacturing Products facturing Support Products facturing Products
2001 $300.574 $1,608.117 $373.618 $2,481.887 $2,889.326 $9,441.188 $11,167.077 $4,059.465
2002 $321.274 $1,191.370 $284.707 $2,408.500 $2,486.006 $6,603.784 $15,368.839 $3,831.292
2003 $317.644 $617.907 $305.925 $2,251.081 $2,574.770 $7,971.954 $17,428.442 $3,635.601
2004 $274.949 $543.576 $202.021 $2,306.683 $2,396.972 $16,483.813 $25,669.191 $4,232.252
2005 $332.325 $524.515 $251.011 $2,103.615 $2,465.373 $13,360.077 $30,387.918 $4,315.681
2006 $304.120 $372.226 $213.765 $2,145.762 $1,994.437 $28,148.761 $33,318.249 $4,360.231
2007 $287.256 $417.742 $279.767 $2,164.147 $1,999.050 $42,837.599 $31,997.124 $4,662.837
2008 $314.138 $391.790 $285.037 $1,956.024 $1,897.288 $26,249.134 $26,943.325 $4,333.178
2009 $284.987 $217.757 $167.233 $2,315.589 $1,739.841 $26,149.951 $25,116.427 $3,875.804
2010 $366.346 $417.069 $299.363 $2,331.323 $2,150.186 $19,922.236 $33,941.673 $5,517.202
2011 $384.651 $434.844 $308.931 $2,409.591 $2,279.887 $20,888.669 $36,960.451 $5,964.675
2012 $407.418 $457.230 $321.514 $2,511.780 $2,438.115 $22,089.666 $40,592.609 $6,503.665
2013 $430.095 $479.033 $333.403 $2,608.985 $2,598.084 $23,277.029 $44,423.901 $7,066.223
2014 $452.310 $499.829 $344.320 $2,699.029 $2,757.430 $24,429.829 $48,421.795 $7,646.607
2015 $473.550 $519.054 $353.909 $2,779.077 $2,912.857 $25,519.876 $52,532.776 $8,235.942
2016 $495.258 $538.291 $363.274 $2,857.781 $3,073.092 $26,624.442 $56,919.834 $8,859.298
2017 $517.645 $557.745 $372.555 $2,936.247 $3,239.466 $27,754.024 $61,622.653 $9,521.967
2018 $540.718 $577.390 $381.735 $3,014.347 $3,412.045 $28,907.920 $66,659.584 $10,225.799
2019 $564.481 $597.201 $390.797 $3,091.953 $3,590.884 $30,085.356 $72,049.710 $10,972.688
2020 $588.937 $617.151 $399.724 $3,168.938 $3,776.030 $31,285.486 $77,812.847 $11,764.569
2021 $614.090 $637.211 $408.498 $3,245.172 $3,967.519 $32,507.390 $83,969.550 $12,603.415
2022 $639.943 $657.354 $417.103 $3,320.525 $4,165.373 $33,750.077 $90,541.112 $13,491.236
2023 $666.497 $677.549 $425.523 $3,394.868 $4,369.607 $35,012.487 $97,549.564 $14,430.073
2024 $693.753 $697.765 $433.740 $3,468.074 $4,580.220 $36,293.488 $105,017.676 $15,421.998
2025 $721.711 $717.972 $441.739 $3,540.014 $4,797.200 $37,591.881 $112,968.946 $16,469.111
2026 $750.371 $738.139 $449.504 $3,610.564 $5,020.524 $38,906.401 $121,427.597 $17,573.534
2027 $779.730 $758.231 $457.021 $3,679.598 $5,250.152 $40,235.718 $130,418.567 $18,737.408
2028 $809.786 $778.218 $464.273 $3,746.995 $5,486.033 $41,578.440 $139,967.494 $19,962.892
2029 $840.536 $798.066 $471.247 $3,812.635 $5,728.101 $42,933.115 $150,100.700 $21,252.155
2030 $871.976 $817.742 $477.930 $3,876.402 $5,976.277 $44,298.233 $160,845.178 $22,607.370
2031 $904.101 $837.212 $484.307 $3,938.183 $6,230.467 $45,672.230 $172,228.564 $24,030.716
2032 $936.904 $856.442 $490.368 $3,997.867 $6,490.561 $47,053.489 $184,279.118 $25,524.366
2033 $970.378 $875.401 $496.099 $4,055.350 $6,756.435 $48,440.347 $197,025.692 $27,090.486
2034 $1,004.517 $894.053 $501.491 $4,110.528 $7,027.951 $49,831.094 $210,497.702 $28,731.228
2035 $1,039.310 $912.367 $506.532 $4,163.307 $7,304.954 $51,223.979 $224,725.094 $30,448.721
2036 $1,074.745 $930.306 $511.212 $4,213.575 $7,587.248 $52,617.011 $239,737.382 $32,244.948
2037 $1,110.806 $947.834 $515.520 $4,261.230 $7,874.613 $54,008.148 $255,564.303 $34,121.832
2038 $1,147.476 $964.916 $519.446 $4,306.172 $8,166.814 $55,395.299 $272,235.742 $36,081.228
2039 $1,184.737 $981.516 $522.982 $4,348.308 $8,463.596 $56,776.332 $289,781.655 $38,124.911
2040 $1,222.569 $997.600 $526.118 $4,387.548 $8,764.682 $58,149.077 $308,231.987 $40,254.574
*M illio ns o f D o llars
for Texas*
Historical and Projected Values for Nominal Gross Product by Detailed Industrial Classification
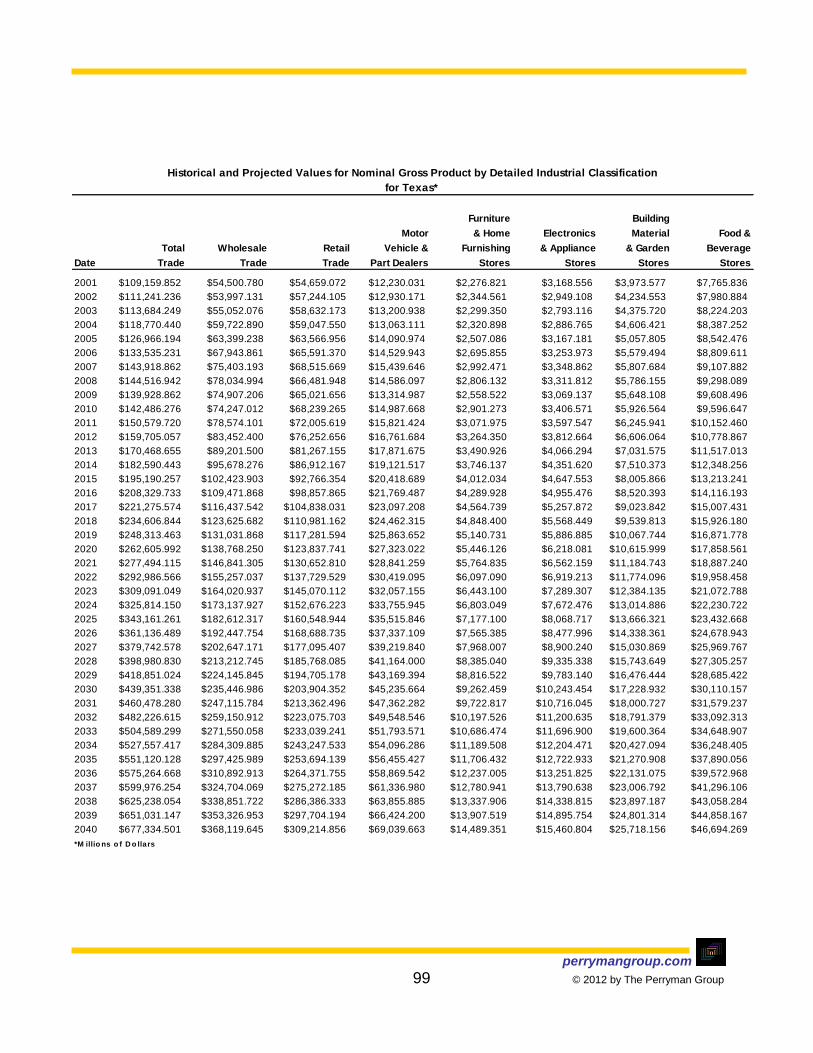
perrymangroup.com 99 © 2012 by The Perryman Group
Furniture Building
Motor & Home Electronics Material Food &
Total Wholesale Retail Vehicle & Furnishing & Appliance & Garden Beverage
Date Trade Trade Trade Part Dealers Stores Stores Stores Stores
2001 $109,159.852 $54,500.780 $54,659.072 $12,230.031 $2,276.821 $3,168.556 $3,973.577 $7,765.836
2002 $111,241.236 $53,997.131 $57,244.105 $12,930.171 $2,344.561 $2,949.108 $4,234.553 $7,980.884
2003 $113,684.249 $55,052.076 $58,632.173 $13,200.938 $2,299.350 $2,793.116 $4,375.720 $8,224.203
2004 $118,770.440 $59,722.890 $59,047.550 $13,063.111 $2,320.898 $2,886.765 $4,606.421 $8,387.252
2005 $126,966.194 $63,399.238 $63,566.956 $14,090.974 $2,507.086 $3,167.181 $5,057.805 $8,542.476
2006 $133,535.231 $67,943.861 $65,591.370 $14,529.943 $2,695.855 $3,253.973 $5,579.494 $8,809.611
2007 $143,918.862 $75,403.193 $68,515.669 $15,439.646 $2,992.471 $3,348.862 $5,807.684 $9,107.882
2008 $144,516.942 $78,034.994 $66,481.948 $14,586.097 $2,806.132 $3,311.812 $5,786.155 $9,298.089
2009 $139,928.862 $74,907.206 $65,021.656 $13,314.987 $2,558.522 $3,069.137 $5,648.108 $9,608.496
2010 $142,486.276 $74,247.012 $68,239.265 $14,987.668 $2,901.273 $3,406.571 $5,926.564 $9,596.647
2011 $150,579.720 $78,574.101 $72,005.619 $15,821.424 $3,071.975 $3,597.547 $6,245.941 $10,152.460
2012 $159,705.057 $83,452.400 $76,252.656 $16,761.684 $3,264.350 $3,812.664 $6,606.064 $10,778.867
2013 $170,468.655 $89,201.500 $81,267.155 $17,871.675 $3,490.926 $4,066.294 $7,031.575 $11,517.013
2014 $182,590.443 $95,678.276 $86,912.167 $19,121.517 $3,746.137 $4,351.620 $7,510.373 $12,348.256
2015 $195,190.257 $102,423.903 $92,766.354 $20,418.689 $4,012.034 $4,647.553 $8,005.866 $13,213.241
2016 $208,329.733 $109,471.868 $98,857.865 $21,769.487 $4,289.928 $4,955.476 $8,520.393 $14,116.193
2017 $221,275.574 $116,437.542 $104,838.031 $23,097.208 $4,564.739 $5,257.872 $9,023.842 $15,007.431
2018 $234,606.844 $123,625.682 $110,981.162 $24,462.315 $4,848.400 $5,568.449 $9,539.813 $15,926.180
2019 $248,313.463 $131,031.868 $117,281.594 $25,863.652 $5,140.731 $5,886.885 $10,067.744 $16,871.778
2020 $262,605.992 $138,768.250 $123,837.741 $27,323.022 $5,446.126 $6,218.081 $10,615.999 $17,858.561
2021 $277,494.115 $146,841.305 $130,652.810 $28,841.259 $5,764.835 $6,562.159 $11,184.743 $18,887.240
2022 $292,986.566 $155,257.037 $137,729.529 $30,419.095 $6,097.090 $6,919.213 $11,774.096 $19,958.458
2023 $309,091.049 $164,020.937 $145,070.112 $32,057.155 $6,443.100 $7,289.307 $12,384.135 $21,072.788
2024 $325,814.150 $173,137.927 $152,676.223 $33,755.945 $6,803.049 $7,672.476 $13,014.886 $22,230.722
2025 $343,161.261 $182,612.317 $160,548.944 $35,515.846 $7,177.100 $8,068.717 $13,666.321 $23,432.668
2026 $361,136.489 $192,447.754 $168,688.735 $37,337.109 $7,565.385 $8,477.996 $14,338.361 $24,678.943
2027 $379,742.578 $202,647.171 $177,095.407 $39,219.840 $7,968.007 $8,900.240 $15,030.869 $25,969.767
2028 $398,980.830 $213,212.745 $185,768.085 $41,164.000 $8,385.040 $9,335.338 $15,743.649 $27,305.257
2029 $418,851.024 $224,145.845 $194,705.178 $43,169.394 $8,816.522 $9,783.140 $16,476.444 $28,685.422
2030 $439,351.338 $235,446.986 $203,904.352 $45,235.664 $9,262.459 $10,243.454 $17,228.932 $30,110.157
2031 $460,478.280 $247,115.784 $213,362.496 $47,362.282 $9,722.817 $10,716.045 $18,000.727 $31,579.237
2032 $482,226.615 $259,150.912 $223,075.703 $49,548.546 $10,197.526 $11,200.635 $18,791.379 $33,092.313
2033 $504,589.299 $271,550.058 $233,039.241 $51,793.571 $10,686.474 $11,696.900 $19,600.364 $34,648.907
2034 $527,557.417 $284,309.885 $243,247.533 $54,096.286 $11,189.508 $12,204.471 $20,427.094 $36,248.405
2035 $551,120.128 $297,425.989 $253,694.139 $56,455.427 $11,706.432 $12,722.933 $21,270.908 $37,890.056
2036 $575,264.668 $310,892.913 $264,371.755 $58,869.542 $12,237.005 $13,251.825 $22,131.075 $39,572.968
2037 $599,976.254 $324,704.069 $275,272.185 $61,336.980 $12,780.941 $13,790.638 $23,006.792 $41,296.106
2038 $625,238.054 $338,851.722 $286,386.333 $63,855.885 $13,337.906 $14,338.815 $23,897.187 $43,058.284
2039 $651,031.147 $353,326.953 $297,704.194 $66,424.200 $13,907.519 $14,895.754 $24,801.314 $44,858.167
2040 $677,334.501 $368,119.645 $309,214.856 $69,039.663 $14,489.351 $15,460.804 $25,718.156 $46,694.269
*M illio ns o f D o llars
for Texas*
Historical and Projected Values for Nominal Gross Product by Detailed Industrial Classification
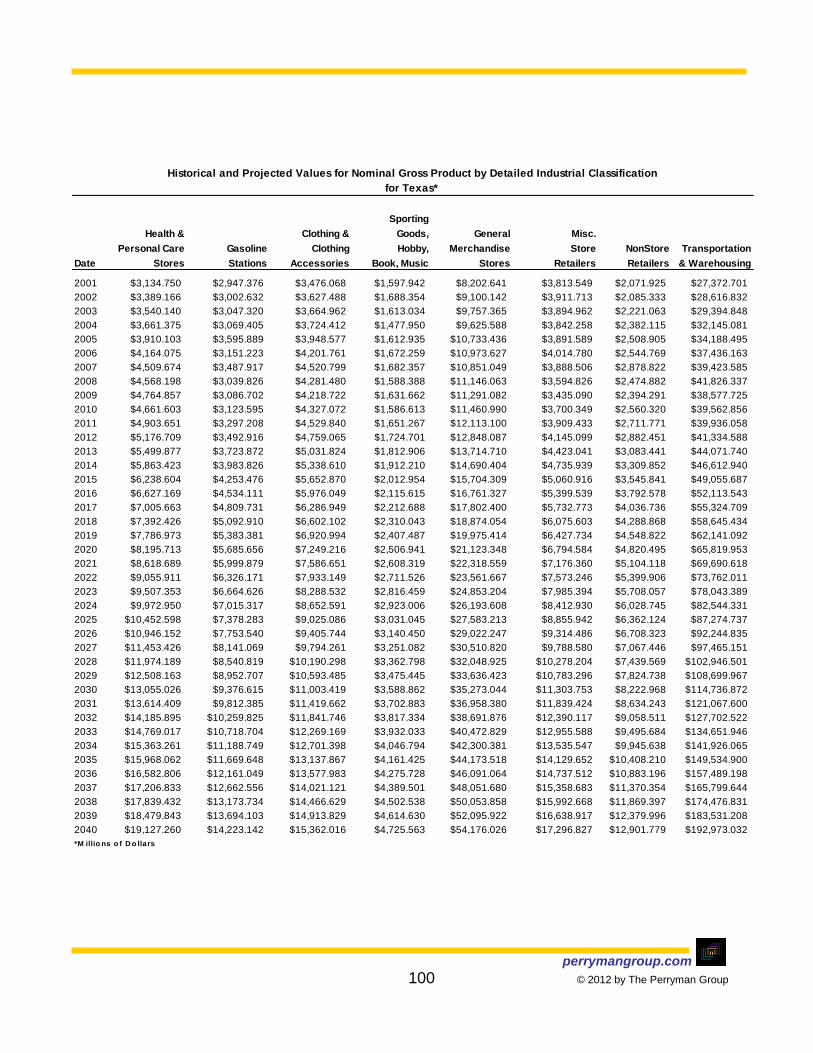
perrymangroup.com 100 © 2012 by The Perryman Group
Sporting
Health & Clothing & Goods, General Misc.
Personal Care Gasoline Clothing Hobby, Merchandise Store NonStore Transportation
Date Stores Stations Accessories Book, Music Stores Retailers Retailers & Warehousing
2001 $3,134.750 $2,947.376 $3,476.068 $1,597.942 $8,202.641 $3,813.549 $2,071.925 $27,372.701
2002 $3,389.166 $3,002.632 $3,627.488 $1,688.354 $9,100.142 $3,911.713 $2,085.333 $28,616.832
2003 $3,540.140 $3,047.320 $3,664.962 $1,613.034 $9,757.365 $3,894.962 $2,221.063 $29,394.848
2004 $3,661.375 $3,069.405 $3,724.412 $1,477.950 $9,625.588 $3,842.258 $2,382.115 $32,145.081
2005 $3,910.103 $3,595.889 $3,948.577 $1,612.935 $10,733.436 $3,891.589 $2,508.905 $34,188.495
2006 $4,164.075 $3,151.223 $4,201.761 $1,672.259 $10,973.627 $4,014.780 $2,544.769 $37,436.163
2007 $4,509.674 $3,487.917 $4,520.799 $1,682.357 $10,851.049 $3,888.506 $2,878.822 $39,423.585
2008 $4,568.198 $3,039.826 $4,281.480 $1,588.388 $11,146.063 $3,594.826 $2,474.882 $41,826.337
2009 $4,764.857 $3,086.702 $4,218.722 $1,631.662 $11,291.082 $3,435.090 $2,394.291 $38,577.725
2010 $4,661.603 $3,123.595 $4,327.072 $1,586.613 $11,460.990 $3,700.349 $2,560.320 $39,562.856
2011 $4,903.651 $3,297.208 $4,529.840 $1,651.267 $12,113.100 $3,909.433 $2,711.771 $39,936.058
2012 $5,176.709 $3,492.916 $4,759.065 $1,724.701 $12,848.087 $4,145.099 $2,882.451 $41,334.588
2013 $5,499.877 $3,723.872 $5,031.824 $1,812.906 $13,714.710 $4,423.041 $3,083.441 $44,071.740
2014 $5,863.423 $3,983.826 $5,338.610 $1,912.210 $14,690.404 $4,735.939 $3,309.852 $46,612.940
2015 $6,238.604 $4,253.476 $5,652.870 $2,012.954 $15,704.309 $5,060.916 $3,545.841 $49,055.687
2016 $6,627.169 $4,534.111 $5,976.049 $2,115.615 $16,761.327 $5,399.539 $3,792.578 $52,113.543
2017 $7,005.663 $4,809.731 $6,286.949 $2,212.688 $17,802.400 $5,732.773 $4,036.736 $55,324.709
2018 $7,392.426 $5,092.910 $6,602.102 $2,310.043 $18,874.054 $6,075.603 $4,288.868 $58,645.434
2019 $7,786.973 $5,383.381 $6,920.994 $2,407.487 $19,975.414 $6,427.734 $4,548.822 $62,141.092
2020 $8,195.713 $5,685.656 $7,249.216 $2,506.941 $21,123.348 $6,794.584 $4,820.495 $65,819.953
2021 $8,618.689 $5,999.879 $7,586.651 $2,608.319 $22,318.559 $7,176.360 $5,104.118 $69,690.618
2022 $9,055.911 $6,326.171 $7,933.149 $2,711.526 $23,561.667 $7,573.246 $5,399.906 $73,762.011
2023 $9,507.353 $6,664.626 $8,288.532 $2,816.459 $24,853.204 $7,985.394 $5,708.057 $78,043.389
2024 $9,972.950 $7,015.317 $8,652.591 $2,923.006 $26,193.608 $8,412.930 $6,028.745 $82,544.331
2025 $10,452.598 $7,378.283 $9,025.086 $3,031.045 $27,583.213 $8,855.942 $6,362.124 $87,274.737
2026 $10,946.152 $7,753.540 $9,405.744 $3,140.450 $29,022.247 $9,314.486 $6,708.323 $92,244.835
2027 $11,453.426 $8,141.069 $9,794.261 $3,251.082 $30,510.820 $9,788.580 $7,067.446 $97,465.151
2028 $11,974.189 $8,540.819 $10,190.298 $3,362.798 $32,048.925 $10,278.204 $7,439.569 $102,946.501
2029 $12,508.163 $8,952.707 $10,593.485 $3,475.445 $33,636.423 $10,783.296 $7,824.738 $108,699.967
2030 $13,055.026 $9,376.615 $11,003.419 $3,588.862 $35,273.044 $11,303.753 $8,222.968 $114,736.872
2031 $13,614.409 $9,812.385 $11,419.662 $3,702.883 $36,958.380 $11,839.424 $8,634.243 $121,067.600
2032 $14,185.895 $10,259.825 $11,841.746 $3,817.334 $38,691.876 $12,390.117 $9,058.511 $127,702.522
2033 $14,769.017 $10,718.704 $12,269.169 $3,932.033 $40,472.829 $12,955.588 $9,495.684 $134,651.946
2034 $15,363.261 $11,188.749 $12,701.398 $4,046.794 $42,300.381 $13,535.547 $9,945.638 $141,926.065
2035 $15,968.062 $11,669.648 $13,137.867 $4,161.425 $44,173.518 $14,129.652 $10,408.210 $149,534.900
2036 $16,582.806 $12,161.049 $13,577.983 $4,275.728 $46,091.064 $14,737.512 $10,883.196 $157,489.198
2037 $17,206.833 $12,662.556 $14,021.121 $4,389.501 $48,051.680 $15,358.683 $11,370.354 $165,799.644
2038 $17,839.432 $13,173.734 $14,466.629 $4,502.538 $50,053.858 $15,992.668 $11,869.397 $174,476.831
2039 $18,479.843 $13,694.103 $14,913.829 $4,614.630 $52,095.922 $16,638.917 $12,379.996 $183,531.208
2040 $19,127.260 $14,223.142 $15,362.016 $4,725.563 $54,176.026 $17,296.827 $12,901.779 $192,973.032
*M illio ns o f D o llars
for Texas*
Historical and Projected Values for Nominal Gross Product by Detailed Industrial Classification

perrymangroup.com 101 © 2012 by The Perryman Group
Transit & Scenic & Support
Air Rail Water Truck Ground Pipeline Sightseeing Activities
Date Transportation Transp. Transp. Transp. Passenger Transp. Transp. Transportation
2001 $5,958.359 $2,108.846 $645.292 $7,082.030 $761.551 $3,561.427 $29.757 $4,569.220
2002 $6,238.595 $2,266.394 $579.983 $7,129.953 $790.101 $3,774.316 $29.934 $4,938.739
2003 $6,765.365 $2,416.775 $643.022 $7,419.249 $770.078 $3,074.343 $26.604 $5,186.936
2004 $6,486.422 $2,467.929 $681.730 $8,459.544 $816.815 $3,326.940 $28.401 $5,855.913
2005 $6,361.127 $2,754.913 $748.156 $9,370.515 $795.920 $2,924.513 $34.821 $6,664.481
2006 $7,607.236 $2,878.793 $896.667 $10,237.145 $1,239.531 $3,356.000 $31.403 $6,893.683
2007 $7,623.682 $2,974.922 $935.543 $11,259.341 $1,292.431 $3,898.748 $31.194 $6,683.063
2008 $7,703.924 $3,239.683 $1,086.902 $11,128.709 $1,218.446 $4,860.387 $31.671 $7,342.505
2009 $7,928.699 $2,929.727 $1,140.317 $10,125.706 $1,239.799 $3,336.330 $37.020 $6,774.351
2010 $7,594.942 $3,105.646 $925.858 $10,282.751 $1,157.601 $4,733.350 $29.196 $6,909.425
2011 $7,701.259 $3,214.020 $946.305 $10,274.278 $1,167.722 $4,794.871 $28.793 $6,926.907
2012 $8,007.620 $3,413.178 $991.385 $10,524.689 $1,207.400 $4,978.822 $29.094 $7,118.186
2013 $8,577.034 $3,733.556 $1,069.689 $11,106.118 $1,285.800 $5,324.719 $30.264 $7,533.746
2014 $9,113.108 $4,050.889 $1,144.658 $11,625.448 $1,358.017 $5,647.894 $31.209 $7,907.944
2015 $9,634.508 $4,372.986 $1,218.522 $12,108.424 $1,426.864 $5,959.807 $32.002 $8,257.779
2016 $10,281.797 $4,764.825 $1,309.096 $12,730.252 $1,513.027 $6,347.090 $33.105 $8,702.640
2017 $10,965.157 $5,187.820 $1,405.134 $13,374.758 $1,602.971 $6,753.704 $34.199 $9,163.364
2018 $11,676.352 $5,639.367 $1,505.604 $14,030.489 $1,695.344 $7,174.186 $35.255 $9,631.930
2019 $12,428.823 $6,127.248 $1,612.251 $14,712.274 $1,791.948 $7,616.383 $36.304 $10,118.320
2020 $13,224.783 $6,654.169 $1,725.389 $15,420.925 $1,892.918 $8,081.163 $37.346 $10,622.916
2021 $14,066.551 $7,223.016 $1,845.343 $16,157.264 $1,998.389 $8,569.412 $38.379 $11,146.087
2022 $14,956.557 $7,836.863 $1,972.447 $16,922.116 $2,108.498 $9,082.032 $39.400 $11,688.187
2023 $15,897.339 $8,498.990 $2,107.046 $17,716.311 $2,223.378 $9,619.935 $40.407 $12,249.552
2024 $16,891.550 $9,212.884 $2,249.496 $18,540.673 $2,343.162 $10,184.042 $41.398 $12,830.496
2025 $17,941.959 $9,982.250 $2,400.160 $19,396.026 $2,467.980 $10,775.281 $42.370 $13,431.308
2026 $19,051.449 $10,811.027 $2,559.412 $20,283.182 $2,597.958 $11,394.584 $43.321 $14,052.248
2027 $20,223.022 $11,703.390 $2,727.631 $21,202.939 $2,733.221 $12,042.879 $44.249 $14,693.544
2028 $21,459.792 $12,663.762 $2,905.203 $22,156.073 $2,873.884 $12,721.088 $45.152 $15,355.383
2029 $22,764.989 $13,696.820 $3,092.520 $23,143.332 $3,020.058 $13,430.120 $46.027 $16,037.907
2030 $24,141.949 $14,807.503 $3,289.978 $24,165.428 $3,171.846 $14,170.866 $46.871 $16,741.209
2031 $25,593.873 $16,000.865 $3,497.938 $25,222.787 $3,329.310 $14,944.047 $47.682 $17,465.158
2032 $27,124.016 $17,282.194 $3,716.758 $26,315.757 $3,492.495 $15,750.327 $48.457 $18,209.540
2033 $28,735.676 $18,657.006 $3,946.785 $27,444.590 $3,661.430 $16,590.306 $49.193 $18,974.054
2034 $30,432.188 $20,131.047 $4,188.351 $28,609.442 $3,836.124 $17,464.506 $49.887 $19,758.302
2035 $32,216.908 $21,710.285 $4,441.776 $29,810.357 $4,016.566 $18,373.366 $50.536 $20,561.787
2036 $34,093.336 $23,401.055 $4,707.391 $31,047.467 $4,202.751 $19,317.355 $51.138 $21,384.046
2037 $36,065.009 $25,209.956 $4,985.513 $32,320.816 $4,394.655 $20,296.872 $51.691 $22,224.531
2038 $38,135.490 $27,143.839 $5,276.442 $33,630.354 $4,592.235 $21,312.229 $52.192 $23,082.610
2039 $40,308.357 $29,209.811 $5,580.460 $34,975.929 $4,795.429 $22,363.650 $52.638 $23,957.555
2040 $42,587.188 $31,415.224 $5,897.827 $36,357.285 $5,004.151 $23,451.261 $53.029 $24,848.549
*M illio ns o f D o llars
Historical and Projected Values for Nominal Gross Product by Detailed Industrial Classification
for Texas*

perrymangroup.com 102 © 2012 by The Perryman Group
Motion
Publishing Picture Broad- ISPs, Search
Couriers & Warehousing Total Industries, & Sound casting, Telecommuni- Portals, Data
Date Messengers & Storage Information Exc. Internet Recording Exc. Internet cations Process
2001 $1,544.685 $1,111.534 $36,990.874 $6,384.106 $984.899 $8,734.739 $17,144.045 $3,392.128
2002 $1,600.421 $1,268.396 $36,531.945 $6,849.242 $1,162.232 $8,969.483 $15,259.221 $3,949.707
2003 $1,571.943 $1,520.533 $36,040.535 $6,790.765 $1,184.114 $8,940.544 $14,757.475 $4,029.722
2004 $1,865.254 $2,156.133 $38,544.915 $7,548.159 $1,227.779 $9,462.232 $15,214.447 $4,681.875
2005 $1,964.507 $2,569.542 $39,598.823 $8,077.904 $1,206.733 $9,906.085 $15,359.761 $4,679.883
2006 $1,924.034 $2,371.671 $44,076.344 $7,332.812 $1,637.419 $11,245.098 $17,053.805 $6,298.935
2007 $1,957.636 $2,767.025 $47,523.666 $8,221.535 $1,775.021 $11,780.624 $19,575.658 $5,518.391
2008 $2,096.474 $3,117.636 $48,222.552 $8,383.836 $1,703.517 $12,310.986 $18,647.870 $6,459.429
2009 $1,971.025 $3,094.751 $46,836.729 $7,961.579 $1,766.699 $11,862.520 $18,065.994 $6,450.977
2010 $1,980.881 $2,843.205 $46,871.735 $8,336.061 $1,646.067 $11,916.615 $17,998.409 $6,251.385
2011 $1,989.947 $2,891.956 $47,813.599 $8,497.442 $1,673.252 $12,280.554 $18,261.543 $6,349.215
2012 $2,049.071 $3,015.142 $49,871.822 $8,856.665 $1,738.979 $12,940.110 $18,944.289 $6,593.277
2013 $2,173.123 $3,237.692 $52,737.980 $9,358.536 $1,832.094 $13,823.359 $19,923.123 $6,940.981
2014 $2,285.718 $3,448.055 $56,000.247 $9,929.676 $1,938.008 $14,827.849 $21,038.184 $7,336.893
2015 $2,391.707 $3,653.087 $59,630.435 $10,564.893 $2,055.567 $15,949.412 $22,276.348 $7,776.575
2016 $2,525.698 $3,906.014 $63,320.334 $11,209.431 $2,174.009 $17,107.967 $23,520.684 $8,219.299
2017 $2,664.839 $4,172.764 $67,170.784 $11,881.063 $2,296.729 $18,331.743 $24,807.938 $8,677.926
2018 $2,806.823 $4,450.084 $71,183.546 $12,579.989 $2,423.692 $19,622.772 $26,137.609 $9,152.328
2019 $2,954.580 $4,742.960 $75,359.982 $13,306.336 $2,554.842 $20,983.013 $27,509.027 $9,642.317
2020 $3,108.256 $5,052.087 $79,701.023 $14,060.149 $2,690.110 $22,414.336 $28,921.345 $10,147.642
2021 $3,267.993 $5,378.183 $84,207.144 $14,841.389 $2,829.407 $23,918.505 $30,373.537 $10,667.987
2022 $3,433.930 $5,721.980 $88,878.331 $15,649.931 $2,972.627 $25,497.164 $31,864.390 $11,202.970
2023 $3,606.203 $6,084.228 $93,714.058 $16,485.554 $3,119.643 $27,151.825 $33,392.501 $11,752.140
2024 $3,784.941 $6,465.689 $98,713.255 $17,347.941 $3,270.311 $28,883.851 $34,956.273 $12,314.976
2025 $3,970.266 $6,867.137 $103,874.288 $18,236.671 $3,424.466 $30,694.438 $36,553.911 $12,890.886
2026 $4,162.294 $7,289.359 $109,194.935 $19,151.217 $3,581.923 $32,584.610 $38,183.423 $13,479.203
2027 $4,361.132 $7,733.145 $114,672.359 $20,090.944 $3,742.475 $34,555.194 $39,842.617 $14,079.190
2028 $4,566.873 $8,199.291 $120,303.097 $21,055.105 $3,905.894 $36,606.806 $41,529.104 $14,690.035
2029 $4,779.601 $8,688.593 $126,083.034 $22,042.839 $4,071.935 $38,739.833 $43,240.300 $15,310.853
2030 $4,999.383 $9,201.839 $132,007.395 $23,053.169 $4,240.330 $40,954.419 $44,973.425 $15,940.690
2031 $5,226.221 $9,739.718 $138,070.726 $24,084.992 $4,410.794 $43,250.457 $46,725.521 $16,578.520
2032 $5,460.091 $10,302.887 $144,266.889 $25,137.085 $4,583.022 $45,627.568 $48,493.445 $17,223.250
2033 $5,700.943 $10,891.963 $150,589.054 $26,208.104 $4,756.691 $48,085.088 $50,273.880 $17,873.719
2034 $5,948.697 $11,507.520 $157,029.699 $27,296.588 $4,931.461 $50,622.053 $52,063.343 $18,528.703
2035 $6,203.243 $12,150.077 $163,580.605 $28,400.953 $5,106.974 $53,237.193 $53,858.189 $19,186.915
2036 $6,464.478 $12,820.180 $170,232.955 $29,519.520 $5,282.860 $55,928.942 $55,654.658 $19,847.023
2037 $6,732.275 $13,518.326 $176,977.260 $30,650.493 $5,458.735 $58,695.405 $57,448.852 $20,507.639
2038 $7,006.478 $14,244.962 $183,803.375 $31,791.971 $5,634.201 $61,534.358 $59,236.756 $21,167.328
2039 $7,286.904 $15,000.473 $190,700.512 $32,941.947 $5,808.849 $64,443.229 $61,014.246 $21,824.609
2040 $7,573.336 $15,785.181 $197,657.260 $34,098.312 $5,982.260 $67,419.102 $62,777.107 $22,477.964
*M illio ns o f D o llars
Historical and Projected Values for Nominal Gross Product by Detailed Industrial Classification
for Texas*
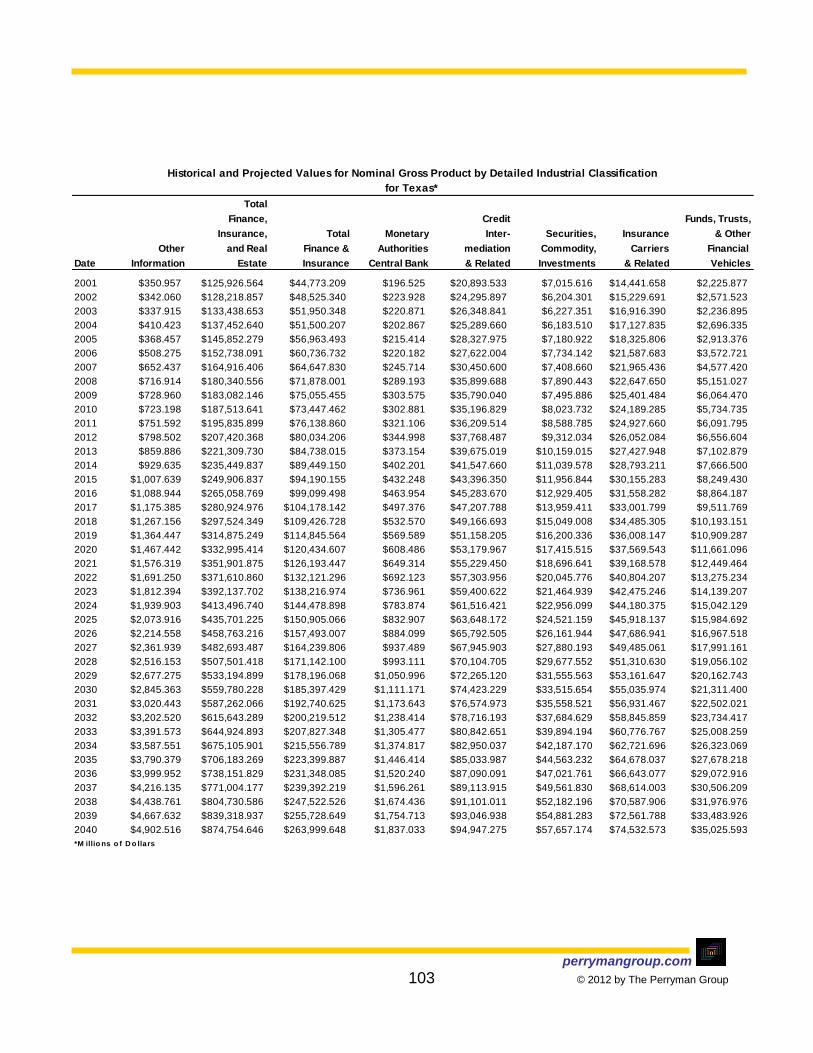
perrymangroup.com 103 © 2012 by The Perryman Group
Total
Finance, Credit Funds, Trusts,
Insurance, Total Monetary Inter- Securities, Insurance & Other
Other and Real Finance & Authorities mediation Commodity, Carriers Financial
Date Information Estate Insurance Central Bank & Related Investments & Related Vehicles
2001 $350.957 $125,926.564 $44,773.209 $196.525 $20,893.533 $7,015.616 $14,441.658 $2,225.877
2002 $342.060 $128,218.857 $48,525.340 $223.928 $24,295.897 $6,204.301 $15,229.691 $2,571.523
2003 $337.915 $133,438.653 $51,950.348 $220.871 $26,348.841 $6,227.351 $16,916.390 $2,236.895
2004 $410.423 $137,452.640 $51,500.207 $202.867 $25,289.660 $6,183.510 $17,127.835 $2,696.335
2005 $368.457 $145,852.279 $56,963.493 $215.414 $28,327.975 $7,180.922 $18,325.806 $2,913.376
2006 $508.275 $152,738.091 $60,736.732 $220.182 $27,622.004 $7,734.142 $21,587.683 $3,572.721
2007 $652.437 $164,916.406 $64,647.830 $245.714 $30,450.600 $7,408.660 $21,965.436 $4,577.420
2008 $716.914 $180,340.556 $71,878.001 $289.193 $35,899.688 $7,890.443 $22,647.650 $5,151.027
2009 $728.960 $183,082.146 $75,055.455 $303.575 $35,790.040 $7,495.886 $25,401.484 $6,064.470
2010 $723.198 $187,513.641 $73,447.462 $302.881 $35,196.829 $8,023.732 $24,189.285 $5,734.735
2011 $751.592 $195,835.899 $76,138.860 $321.106 $36,209.514 $8,588.785 $24,927.660 $6,091.795
2012 $798.502 $207,420.368 $80,034.206 $344.998 $37,768.487 $9,312.034 $26,052.084 $6,556.604
2013 $859.886 $221,309.730 $84,738.015 $373.154 $39,675.019 $10,159.015 $27,427.948 $7,102.879
2014 $929.635 $235,449.837 $89,449.150 $402.201 $41,547.660 $11,039.578 $28,793.211 $7,666.500
2015 $1,007.639 $249,906.837 $94,190.155 $432.248 $43,396.350 $11,956.844 $30,155.283 $8,249.430
2016 $1,088.944 $265,058.769 $99,099.498 $463.954 $45,283.670 $12,929.405 $31,558.282 $8,864.187
2017 $1,175.385 $280,924.976 $104,178.142 $497.376 $47,207.788 $13,959.411 $33,001.799 $9,511.769
2018 $1,267.156 $297,524.349 $109,426.728 $532.570 $49,166.693 $15,049.008 $34,485.305 $10,193.151
2019 $1,364.447 $314,875.249 $114,845.564 $569.589 $51,158.205 $16,200.336 $36,008.147 $10,909.287
2020 $1,467.442 $332,995.414 $120,434.607 $608.486 $53,179.967 $17,415.515 $37,569.543 $11,661.096
2021 $1,576.319 $351,901.875 $126,193.447 $649.314 $55,229.450 $18,696.641 $39,168.578 $12,449.464
2022 $1,691.250 $371,610.860 $132,121.296 $692.123 $57,303.956 $20,045.776 $40,804.207 $13,275.234
2023 $1,812.394 $392,137.702 $138,216.974 $736.961 $59,400.622 $21,464.939 $42,475.246 $14,139.207
2024 $1,939.903 $413,496.740 $144,478.898 $783.874 $61,516.421 $22,956.099 $44,180.375 $15,042.129
2025 $2,073.916 $435,701.225 $150,905.066 $832.907 $63,648.172 $24,521.159 $45,918.137 $15,984.692
2026 $2,214.558 $458,763.216 $157,493.007 $884.099 $65,792.505 $26,161.944 $47,686.941 $16,967.518
2027 $2,361.939 $482,693.487 $164,239.806 $937.489 $67,945.903 $27,880.193 $49,485.061 $17,991.161
2028 $2,516.153 $507,501.418 $171,142.100 $993.111 $70,104.705 $29,677.552 $51,310.630 $19,056.102
2029 $2,677.275 $533,194.899 $178,196.068 $1,050.996 $72,265.120 $31,555.563 $53,161.647 $20,162.743
2030 $2,845.363 $559,780.228 $185,397.429 $1,111.171 $74,423.229 $33,515.654 $55,035.974 $21,311.400
2031 $3,020.443 $587,262.066 $192,740.625 $1,173.643 $76,574.973 $35,558.521 $56,931.467 $22,502.021
2032 $3,202.520 $615,643.289 $200,219.512 $1,238.414 $78,716.193 $37,684.629 $58,845.859 $23,734.417
2033 $3,391.573 $644,924.893 $207,827.348 $1,305.477 $80,842.651 $39,894.194 $60,776.767 $25,008.259
2034 $3,587.551 $675,105.901 $215,556.789 $1,374.817 $82,950.037 $42,187.170 $62,721.696 $26,323.069
2035 $3,790.379 $706,183.269 $223,399.887 $1,446.414 $85,033.987 $44,563.232 $64,678.037 $27,678.218
2036 $3,999.952 $738,151.829 $231,348.085 $1,520.240 $87,090.091 $47,021.761 $66,643.077 $29,072.916
2037 $4,216.135 $771,004.177 $239,392.219 $1,596.261 $89,113.915 $49,561.830 $68,614.003 $30,506.209
2038 $4,438.761 $804,730.586 $247,522.526 $1,674.436 $91,101.011 $52,182.196 $70,587.906 $31,976.976
2039 $4,667.632 $839,318.937 $255,728.649 $1,754.713 $93,046.938 $54,881.283 $72,561.788 $33,483.926
2040 $4,902.516 $874,754.646 $263,999.648 $1,837.033 $94,947.275 $57,657.174 $74,532.573 $35,025.593
*M illio ns o f D o llars
Historical and Projected Values for Nominal Gross Product by Detailed Industrial Classification
for Texas*
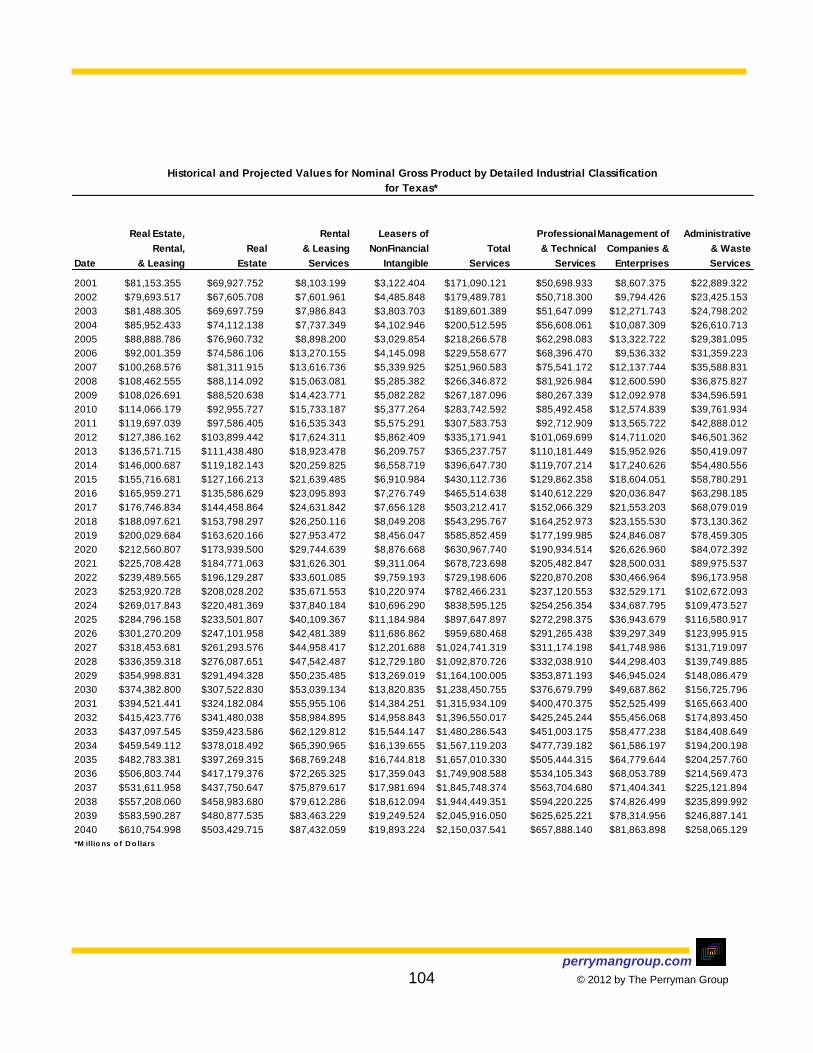
perrymangroup.com 104 © 2012 by The Perryman Group
Real Estate, Rental Leasers of ProfessionalManagement of Administrative
Rental, Real & Leasing NonFinancial Total & Technical Companies & & Waste
Date & Leasing Estate Services Intangible Services Services Enterprises Services
2001 $81,153.355 $69,927.752 $8,103.199 $3,122.404 $171,090.121 $50,698.933 $8,607.375 $22,889.322
2002 $79,693.517 $67,605.708 $7,601.961 $4,485.848 $179,489.781 $50,718.300 $9,794.426 $23,425.153
2003 $81,488.305 $69,697.759 $7,986.843 $3,803.703 $189,601.389 $51,647.099 $12,271.743 $24,798.202
2004 $85,952.433 $74,112.138 $7,737.349 $4,102.946 $200,512.595 $56,608.061 $10,087.309 $26,610.713
2005 $88,888.786 $76,960.732 $8,898.200 $3,029.854 $218,266.578 $62,298.083 $13,322.722 $29,381.095
2006 $92,001.359 $74,586.106 $13,270.155 $4,145.098 $229,558.677 $68,396.470 $9,536.332 $31,359.223
2007 $100,268.576 $81,311.915 $13,616.736 $5,339.925 $251,960.583 $75,541.172 $12,137.744 $35,588.831
2008 $108,462.555 $88,114.092 $15,063.081 $5,285.382 $266,346.872 $81,926.984 $12,600.590 $36,875.827
2009 $108,026.691 $88,520.638 $14,423.771 $5,082.282 $267,187.096 $80,267.339 $12,092.978 $34,596.591
2010 $114,066.179 $92,955.727 $15,733.187 $5,377.264 $283,742.592 $85,492.458 $12,574.839 $39,761.934
2011 $119,697.039 $97,586.405 $16,535.343 $5,575.291 $307,583.753 $92,712.909 $13,565.722 $42,888.012
2012 $127,386.162 $103,899.442 $17,624.311 $5,862.409 $335,171.941 $101,069.699 $14,711.020 $46,501.362
2013 $136,571.715 $111,438.480 $18,923.478 $6,209.757 $365,237.757 $110,181.449 $15,952.926 $50,419.097
2014 $146,000.687 $119,182.143 $20,259.825 $6,558.719 $396,647.730 $119,707.214 $17,240.626 $54,480.556
2015 $155,716.681 $127,166.213 $21,639.485 $6,910.984 $430,112.736 $129,862.358 $18,604.051 $58,780.291
2016 $165,959.271 $135,586.629 $23,095.893 $7,276.749 $465,514.638 $140,612.229 $20,036.847 $63,298.185
2017 $176,746.834 $144,458.864 $24,631.842 $7,656.128 $503,212.417 $152,066.329 $21,553.203 $68,079.019
2018 $188,097.621 $153,798.297 $26,250.116 $8,049.208 $543,295.767 $164,252.973 $23,155.530 $73,130.362
2019 $200,029.684 $163,620.166 $27,953.472 $8,456.047 $585,852.459 $177,199.985 $24,846.087 $78,459.305
2020 $212,560.807 $173,939.500 $29,744.639 $8,876.668 $630,967.740 $190,934.514 $26,626.960 $84,072.392
2021 $225,708.428 $184,771.063 $31,626.301 $9,311.064 $678,723.698 $205,482.847 $28,500.031 $89,975.537
2022 $239,489.565 $196,129.287 $33,601.085 $9,759.193 $729,198.606 $220,870.208 $30,466.964 $96,173.958
2023 $253,920.728 $208,028.202 $35,671.553 $10,220.974 $782,466.231 $237,120.553 $32,529.171 $102,672.093
2024 $269,017.843 $220,481.369 $37,840.184 $10,696.290 $838,595.125 $254,256.354 $34,687.795 $109,473.527
2025 $284,796.158 $233,501.807 $40,109.367 $11,184.984 $897,647.897 $272,298.375 $36,943.679 $116,580.917
2026 $301,270.209 $247,101.958 $42,481.389 $11,686.862 $959,680.468 $291,265.438 $39,297.349 $123,995.915
2027 $318,453.681 $261,293.576 $44,958.417 $12,201.688 $1,024,741.319 $311,174.198 $41,748.986 $131,719.097
2028 $336,359.318 $276,087.651 $47,542.487 $12,729.180 $1,092,870.726 $332,038.910 $44,298.403 $139,749.885
2029 $354,998.831 $291,494.328 $50,235.485 $13,269.019 $1,164,100.005 $353,871.193 $46,945.024 $148,086.479
2030 $374,382.800 $307,522.830 $53,039.134 $13,820.835 $1,238,450.755 $376,679.799 $49,687.862 $156,725.796
2031 $394,521.441 $324,182.084 $55,955.106 $14,384.251 $1,315,934.109 $400,470.375 $52,525.499 $165,663.400
2032 $415,423.776 $341,480.038 $58,984.895 $14,958.843 $1,396,550.017 $425,245.244 $55,456.068 $174,893.450
2033 $437,097.545 $359,423.586 $62,129.812 $15,544.147 $1,480,286.543 $451,003.175 $58,477.238 $184,408.649
2034 $459,549.112 $378,018.492 $65,390.965 $16,139.655 $1,567,119.203 $477,739.182 $61,586.197 $194,200.198
2035 $482,783.381 $397,269.315 $68,769.248 $16,744.818 $1,657,010.330 $505,444.315 $64,779.644 $204,257.760
2036 $506,803.744 $417,179.376 $72,265.325 $17,359.043 $1,749,908.588 $534,105.343 $68,053.789 $214,569.473
2037 $531,611.958 $437,750.647 $75,879.617 $17,981.694 $1,845,748.374 $563,704.680 $71,404.341 $225,121.894
2038 $557,208.060 $458,983.680 $79,612.286 $18,612.094 $1,944,449.351 $594,220.225 $74,826.499 $235,899.992
2039 $583,590.287 $480,877.535 $83,463.229 $19,249.524 $2,045,916.050 $625,625.221 $78,314.956 $246,887.141
2040 $610,754.998 $503,429.715 $87,432.059 $19,893.224 $2,150,037.541 $657,888.140 $81,863.898 $258,065.129
*M illio ns o f D o llars
Historical and Projected Values for Nominal Gross Product by Detailed Industrial Classification
for Texas*
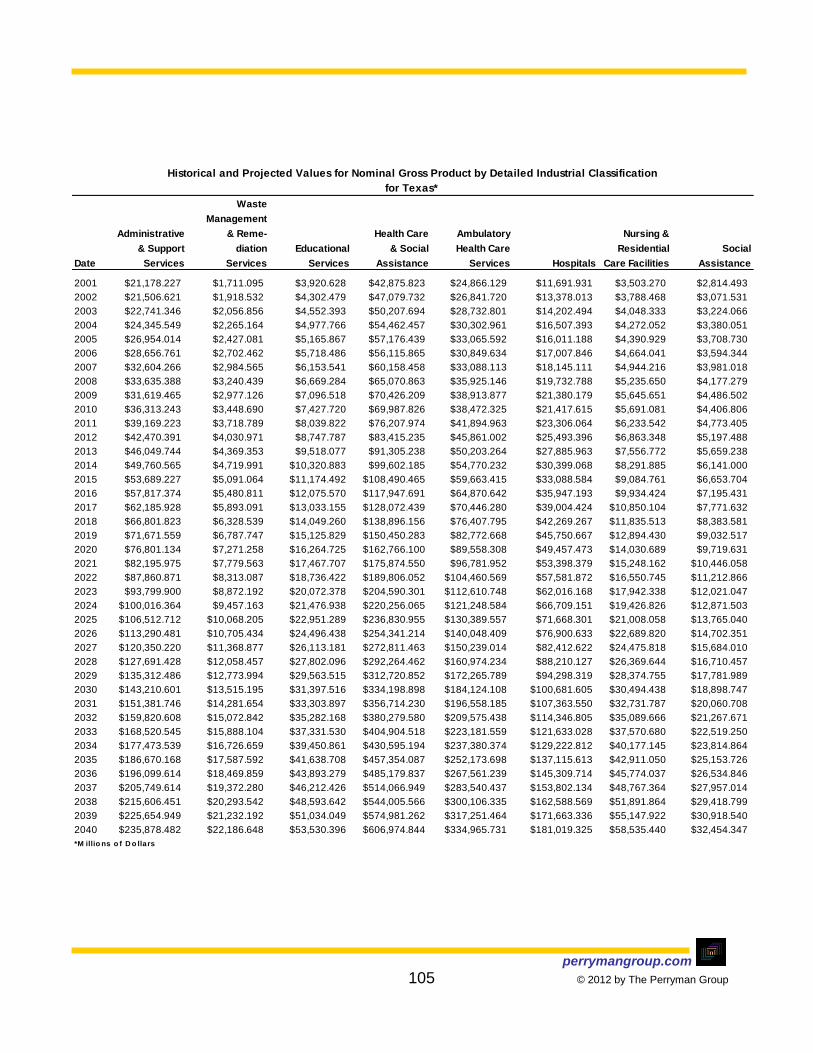
perrymangroup.com 105 © 2012 by The Perryman Group
Waste
Management
Administrative & Reme- Health Care Ambulatory Nursing &
& Support diation Educational & Social Health Care Residential Social
Date Services Services Services Assistance Services Hospitals Care Facilities Assistance
2001 $21,178.227 $1,711.095 $3,920.628 $42,875.823 $24,866.129 $11,691.931 $3,503.270 $2,814.493
2002 $21,506.621 $1,918.532 $4,302.479 $47,079.732 $26,841.720 $13,378.013 $3,788.468 $3,071.531
2003 $22,741.346 $2,056.856 $4,552.393 $50,207.694 $28,732.801 $14,202.494 $4,048.333 $3,224.066
2004 $24,345.549 $2,265.164 $4,977.766 $54,462.457 $30,302.961 $16,507.393 $4,272.052 $3,380.051
2005 $26,954.014 $2,427.081 $5,165.867 $57,176.439 $33,065.592 $16,011.188 $4,390.929 $3,708.730
2006 $28,656.761 $2,702.462 $5,718.486 $56,115.865 $30,849.634 $17,007.846 $4,664.041 $3,594.344
2007 $32,604.266 $2,984.565 $6,153.541 $60,158.458 $33,088.113 $18,145.111 $4,944.216 $3,981.018
2008 $33,635.388 $3,240.439 $6,669.284 $65,070.863 $35,925.146 $19,732.788 $5,235.650 $4,177.279
2009 $31,619.465 $2,977.126 $7,096.518 $70,426.209 $38,913.877 $21,380.179 $5,645.651 $4,486.502
2010 $36,313.243 $3,448.690 $7,427.720 $69,987.826 $38,472.325 $21,417.615 $5,691.081 $4,406.806
2011 $39,169.223 $3,718.789 $8,039.822 $76,207.974 $41,894.963 $23,306.064 $6,233.542 $4,773.405
2012 $42,470.391 $4,030.971 $8,747.787 $83,415.235 $45,861.002 $25,493.396 $6,863.348 $5,197.488
2013 $46,049.744 $4,369.353 $9,518.077 $91,305.238 $50,203.264 $27,885.963 $7,556.772 $5,659.238
2014 $49,760.565 $4,719.991 $10,320.883 $99,602.185 $54,770.232 $30,399.068 $8,291.885 $6,141.000
2015 $53,689.227 $5,091.064 $11,174.492 $108,490.465 $59,663.415 $33,088.584 $9,084.761 $6,653.704
2016 $57,817.374 $5,480.811 $12,075.570 $117,947.691 $64,870.642 $35,947.193 $9,934.424 $7,195.431
2017 $62,185.928 $5,893.091 $13,033.155 $128,072.439 $70,446.280 $39,004.424 $10,850.104 $7,771.632
2018 $66,801.823 $6,328.539 $14,049.260 $138,896.156 $76,407.795 $42,269.267 $11,835.513 $8,383.581
2019 $71,671.559 $6,787.747 $15,125.829 $150,450.283 $82,772.668 $45,750.667 $12,894.430 $9,032.517
2020 $76,801.134 $7,271.258 $16,264.725 $162,766.100 $89,558.308 $49,457.473 $14,030.689 $9,719.631
2021 $82,195.975 $7,779.563 $17,467.707 $175,874.550 $96,781.952 $53,398.379 $15,248.162 $10,446.058
2022 $87,860.871 $8,313.087 $18,736.422 $189,806.052 $104,460.569 $57,581.872 $16,550.745 $11,212.866
2023 $93,799.900 $8,872.192 $20,072.378 $204,590.301 $112,610.748 $62,016.168 $17,942.338 $12,021.047
2024 $100,016.364 $9,457.163 $21,476.938 $220,256.065 $121,248.584 $66,709.151 $19,426.826 $12,871.503
2025 $106,512.712 $10,068.205 $22,951.289 $236,830.955 $130,389.557 $71,668.301 $21,008.058 $13,765.040
2026 $113,290.481 $10,705.434 $24,496.438 $254,341.214 $140,048.409 $76,900.633 $22,689.820 $14,702.351
2027 $120,350.220 $11,368.877 $26,113.181 $272,811.463 $150,239.014 $82,412.622 $24,475.818 $15,684.010
2028 $127,691.428 $12,058.457 $27,802.096 $292,264.462 $160,974.234 $88,210.127 $26,369.644 $16,710.457
2029 $135,312.486 $12,773.994 $29,563.515 $312,720.852 $172,265.789 $94,298.319 $28,374.755 $17,781.989
2030 $143,210.601 $13,515.195 $31,397.516 $334,198.898 $184,124.108 $100,681.605 $30,494.438 $18,898.747
2031 $151,381.746 $14,281.654 $33,303.897 $356,714.230 $196,558.185 $107,363.550 $32,731.787 $20,060.708
2032 $159,820.608 $15,072.842 $35,282.168 $380,279.580 $209,575.438 $114,346.805 $35,089.666 $21,267.671
2033 $168,520.545 $15,888.104 $37,331.530 $404,904.518 $223,181.559 $121,633.028 $37,570.680 $22,519.250
2034 $177,473.539 $16,726.659 $39,450.861 $430,595.194 $237,380.374 $129,222.812 $40,177.145 $23,814.864
2035 $186,670.168 $17,587.592 $41,638.708 $457,354.087 $252,173.698 $137,115.613 $42,911.050 $25,153.726
2036 $196,099.614 $18,469.859 $43,893.279 $485,179.837 $267,561.239 $145,309.714 $45,774.037 $26,534.846
2037 $205,749.614 $19,372.280 $46,212.426 $514,066.949 $283,540.437 $153,802.134 $48,767.364 $27,957.014
2038 $215,606.451 $20,293.542 $48,593.642 $544,005.566 $300,106.335 $162,588.569 $51,891.864 $29,418.799
2039 $225,654.949 $21,232.192 $51,034.049 $574,981.262 $317,251.464 $171,663.336 $55,147.922 $30,918.540
2040 $235,878.482 $22,186.648 $53,530.396 $606,974.844 $334,965.731 $181,019.325 $58,535.440 $32,454.347
*M illio ns o f D o llars
Historical and Projected Values for Nominal Gross Product by Detailed Industrial Classification
for Texas*

perrymangroup.com 106 © 2012 by The Perryman Group
Performing Accommo- Other
Arts, Arts & Museums, Amusement, dation Food Services Services,
Entertainment Spectator History Sites Gambling, & Food Accommo- & Drinking Exc. Public
Date & Recreation Sports Zoos, Parks & Recreation Services dation Places Administration
2001 $4,526.715 $1,712.615 $252.176 $2,561.924 $19,465.998 $4,776.388 $14,689.610 $18,105.327
2002 $5,052.658 $2,070.255 $307.744 $2,674.659 $20,439.344 $4,875.197 $15,564.147 $18,677.689
2003 $5,338.793 $2,156.178 $336.782 $2,845.833 $21,140.939 $4,820.910 $16,320.029 $19,644.526
2004 $5,584.870 $2,247.479 $368.709 $2,968.682 $22,292.036 $5,054.320 $17,237.716 $19,889.383
2005 $5,883.473 $2,372.176 $402.418 $3,108.879 $23,871.039 $5,630.093 $18,240.946 $21,167.860
2006 $6,527.543 $2,940.481 $486.204 $3,100.858 $28,445.044 $6,103.315 $22,341.729 $23,459.714
2007 $6,729.495 $3,052.295 $515.901 $3,161.299 $30,599.895 $6,578.277 $24,021.618 $25,051.447
2008 $7,051.580 $3,130.808 $546.688 $3,374.084 $30,480.782 $6,368.819 $24,111.963 $25,670.962
2009 $6,820.287 $3,257.551 $553.889 $3,008.847 $30,256.867 $6,010.485 $24,246.382 $25,630.307
2010 $7,435.449 $3,311.850 $582.539 $3,541.060 $33,550.984 $6,477.367 $27,073.617 $27,511.381
2011 $8,086.152 $3,598.552 $634.644 $3,852.956 $36,354.706 $7,036.209 $29,318.497 $29,728.456
2012 $8,839.396 $3,930.144 $694.948 $4,214.304 $39,595.762 $7,682.122 $31,913.640 $32,291.680
2013 $9,662.455 $4,291.912 $760.905 $4,609.639 $43,122.876 $8,386.184 $34,736.691 $35,075.639
2014 $10,525.778 $4,670.596 $830.199 $5,024.984 $46,801.001 $9,122.336 $37,678.665 $37,969.487
2015 $11,448.521 $5,074.574 $904.343 $5,469.603 $50,712.804 $9,906.792 $40,806.012 $41,039.756
2016 $12,427.927 $5,502.479 $983.128 $5,942.319 $54,842.944 $10,736.709 $44,106.235 $44,273.246
2017 $13,473.963 $5,958.568 $1,067.347 $6,448.048 $59,232.180 $11,620.208 $47,611.972 $47,702.130
2018 $14,589.464 $6,443.916 $1,157.229 $6,988.318 $63,889.339 $12,559.180 $51,330.159 $51,332.684
2019 $15,777.225 $6,959.570 $1,253.002 $7,564.653 $68,822.859 $13,555.437 $55,267.422 $55,170.885
2020 $17,039.983 $7,506.532 $1,354.885 $8,178.566 $74,040.708 $14,610.689 $59,430.019 $59,222.358
2021 $18,380.400 $8,085.755 $1,463.092 $8,831.553 $79,550.305 $15,726.533 $63,823.773 $63,492.320
2022 $19,801.040 $8,698.134 $1,577.824 $9,525.081 $85,358.442 $16,904.428 $68,454.014 $67,985.522
2023 $21,304.347 $9,344.494 $1,699.275 $10,260.577 $91,471.194 $18,145.682 $73,325.512 $72,706.193
2024 $22,892.627 $10,025.582 $1,827.624 $11,039.422 $97,893.838 $19,451.433 $78,442.405 $77,657.982
2025 $24,568.022 $10,742.055 $1,963.033 $11,862.935 $104,630.765 $20,822.625 $83,808.139 $82,843.895
2026 $26,332.490 $11,494.473 $2,105.649 $12,732.368 $111,685.381 $22,259.981 $89,425.401 $88,266.244
2027 $28,187.776 $12,283.287 $2,255.600 $13,648.889 $119,060.035 $23,763.988 $95,296.047 $93,926.583
2028 $30,135.394 $13,108.830 $2,412.991 $14,613.573 $126,755.927 $25,334.886 $101,421.041 $99,825.651
2029 $32,176.596 $13,971.305 $2,577.903 $15,627.388 $134,773.029 $26,972.642 $107,800.386 $105,963.318
2030 $34,312.353 $14,870.776 $2,750.393 $16,691.184 $143,110.004 $28,676.938 $114,433.066 $112,338.528
2031 $36,543.327 $15,807.160 $2,930.488 $17,805.679 $151,764.130 $30,447.150 $121,316.981 $118,949.250
2032 $38,869.850 $16,780.215 $3,118.188 $18,971.447 $160,731.230 $32,282.334 $128,448.896 $125,792.427
2033 $41,291.897 $17,789.534 $3,313.458 $20,188.905 $170,005.599 $34,181.211 $135,824.388 $132,863.937
2034 $43,809.069 $18,834.536 $3,516.231 $21,458.302 $179,579.953 $36,142.156 $143,437.798 $140,158.547
2035 $46,420.566 $19,914.457 $3,726.404 $22,779.704 $189,445.371 $38,163.181 $151,282.190 $147,669.879
2036 $49,125.179 $21,028.350 $3,943.838 $24,152.990 $199,591.295 $40,241.943 $159,349.351 $155,390.394
2037 $51,921.264 $22,175.072 $4,168.356 $25,577.836 $210,005.461 $42,375.726 $167,629.735 $163,311.359
2038 $54,806.727 $23,353.284 $4,399.740 $27,053.703 $220,673.874 $44,561.433 $176,112.441 $171,422.826
2039 $57,779.007 $24,561.446 $4,637.732 $28,579.828 $231,580.791 $46,795.586 $184,785.205 $179,713.623
2040 $60,835.064 $25,797.814 $4,882.034 $30,155.216 $242,708.717 $49,074.326 $193,634.391 $188,171.352
*M illio ns o f D o llars
Historical and Projected Values for Nominal Gross Product by Detailed Industrial Classification
for Texas*
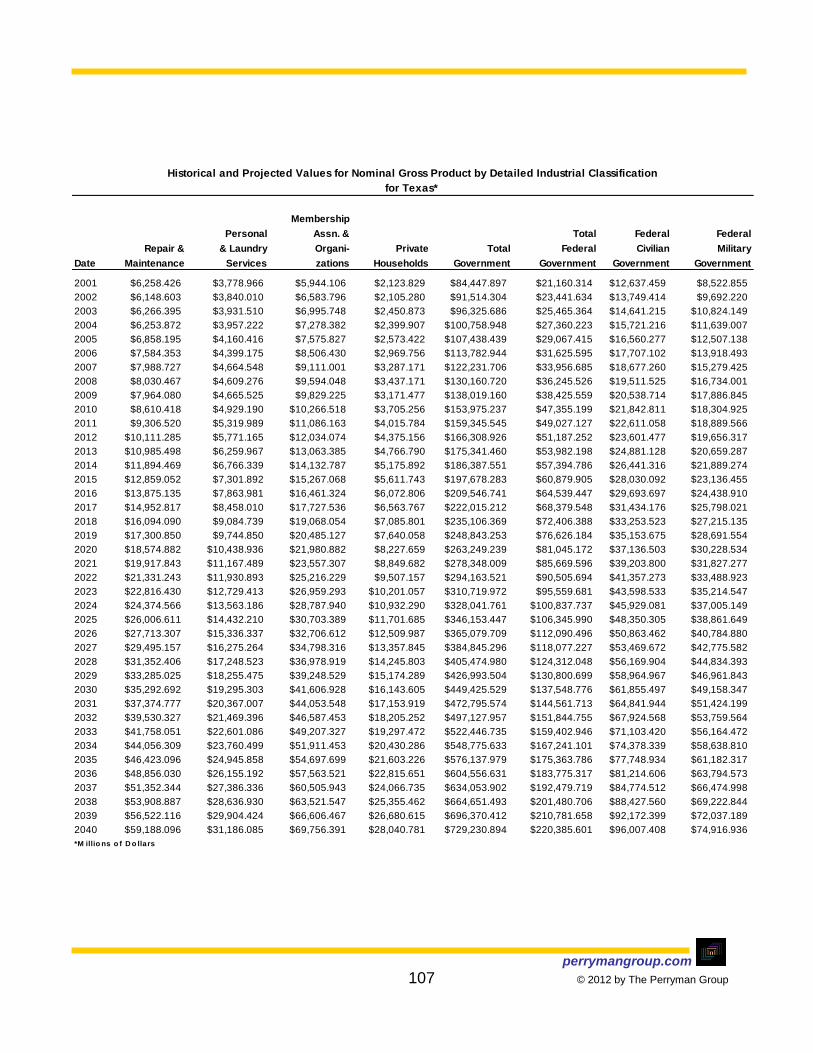
perrymangroup.com 107 © 2012 by The Perryman Group
Membership
Personal Assn. & Total Federal Federal
Repair & & Laundry Organi- Private Total Federal Civilian Military
Date Maintenance Services zations Households Government Government Government Government
2001 $6,258.426 $3,778.966 $5,944.106 $2,123.829 $84,447.897 $21,160.314 $12,637.459 $8,522.855
2002 $6,148.603 $3,840.010 $6,583.796 $2,105.280 $91,514.304 $23,441.634 $13,749.414 $9,692.220
2003 $6,266.395 $3,931.510 $6,995.748 $2,450.873 $96,325.686 $25,465.364 $14,641.215 $10,824.149
2004 $6,253.872 $3,957.222 $7,278.382 $2,399.907 $100,758.948 $27,360.223 $15,721.216 $11,639.007
2005 $6,858.195 $4,160.416 $7,575.827 $2,573.422 $107,438.439 $29,067.415 $16,560.277 $12,507.138
2006 $7,584.353 $4,399.175 $8,506.430 $2,969.756 $113,782.944 $31,625.595 $17,707.102 $13,918.493
2007 $7,988.727 $4,664.548 $9,111.001 $3,287.171 $122,231.706 $33,956.685 $18,677.260 $15,279.425
2008 $8,030.467 $4,609.276 $9,594.048 $3,437.171 $130,160.720 $36,245.526 $19,511.525 $16,734.001
2009 $7,964.080 $4,665.525 $9,829.225 $3,171.477 $138,019.160 $38,425.559 $20,538.714 $17,886.845
2010 $8,610.418 $4,929.190 $10,266.518 $3,705.256 $153,975.237 $47,355.199 $21,842.811 $18,304.925
2011 $9,306.520 $5,319.989 $11,086.163 $4,015.784 $159,345.545 $49,027.127 $22,611.058 $18,889.566
2012 $10,111.285 $5,771.165 $12,034.074 $4,375.156 $166,308.926 $51,187.252 $23,601.477 $19,656.317
2013 $10,985.498 $6,259.967 $13,063.385 $4,766.790 $175,341.460 $53,982.198 $24,881.128 $20,659.287
2014 $11,894.469 $6,766.339 $14,132.787 $5,175.892 $186,387.551 $57,394.786 $26,441.316 $21,889.274
2015 $12,859.052 $7,301.892 $15,267.068 $5,611.743 $197,678.283 $60,879.905 $28,030.092 $23,136.455
2016 $13,875.135 $7,863.981 $16,461.324 $6,072.806 $209,546.741 $64,539.447 $29,693.697 $24,438.910
2017 $14,952.817 $8,458.010 $17,727.536 $6,563.767 $222,015.212 $68,379.548 $31,434.176 $25,798.021
2018 $16,094.090 $9,084.739 $19,068.054 $7,085.801 $235,106.369 $72,406.388 $33,253.523 $27,215.135
2019 $17,300.850 $9,744.850 $20,485.127 $7,640.058 $248,843.253 $76,626.184 $35,153.675 $28,691.554
2020 $18,574.882 $10,438.936 $21,980.882 $8,227.659 $263,249.239 $81,045.172 $37,136.503 $30,228.534
2021 $19,917.843 $11,167.489 $23,557.307 $8,849.682 $278,348.009 $85,669.596 $39,203.800 $31,827.277
2022 $21,331.243 $11,930.893 $25,216.229 $9,507.157 $294,163.521 $90,505.694 $41,357.273 $33,488.923
2023 $22,816.430 $12,729.413 $26,959.293 $10,201.057 $310,719.972 $95,559.681 $43,598.533 $35,214.547
2024 $24,374.566 $13,563.186 $28,787.940 $10,932.290 $328,041.761 $100,837.737 $45,929.081 $37,005.149
2025 $26,006.611 $14,432.210 $30,703.389 $11,701.685 $346,153.447 $106,345.990 $48,350.305 $38,861.649
2026 $27,713.307 $15,336.337 $32,706.612 $12,509.987 $365,079.709 $112,090.496 $50,863.462 $40,784.880
2027 $29,495.157 $16,275.264 $34,798.316 $13,357.845 $384,845.296 $118,077.227 $53,469.672 $42,775.582
2028 $31,352.406 $17,248.523 $36,978.919 $14,245.803 $405,474.980 $124,312.048 $56,169.904 $44,834.393
2029 $33,285.025 $18,255.475 $39,248.529 $15,174.289 $426,993.504 $130,800.699 $58,964.967 $46,961.843
2030 $35,292.692 $19,295.303 $41,606.928 $16,143.605 $449,425.529 $137,548.776 $61,855.497 $49,158.347
2031 $37,374.777 $20,367.007 $44,053.548 $17,153.919 $472,795.574 $144,561.713 $64,841.944 $51,424.199
2032 $39,530.327 $21,469.396 $46,587.453 $18,205.252 $497,127.957 $151,844.755 $67,924.568 $53,759.564
2033 $41,758.051 $22,601.086 $49,207.327 $19,297.472 $522,446.735 $159,402.946 $71,103.420 $56,164.472
2034 $44,056.309 $23,760.499 $51,911.453 $20,430.286 $548,775.633 $167,241.101 $74,378.339 $58,638.810
2035 $46,423.096 $24,945.858 $54,697.699 $21,603.226 $576,137.979 $175,363.786 $77,748.934 $61,182.317
2036 $48,856.030 $26,155.192 $57,563.521 $22,815.651 $604,556.631 $183,775.317 $81,214.606 $63,794.573
2037 $51,352.344 $27,386.336 $60,505.943 $24,066.735 $634,053.902 $192,479.719 $84,774.512 $66,474.998
2038 $53,908.887 $28,636.930 $63,521.547 $25,355.462 $664,651.493 $201,480.706 $88,427.560 $69,222.844
2039 $56,522.116 $29,904.424 $66,606.467 $26,680.615 $696,370.412 $210,781.658 $92,172.399 $72,037.189
2040 $59,188.096 $31,186.085 $69,756.391 $28,040.781 $729,230.894 $220,385.601 $96,007.408 $74,916.936
*M illio ns o f D o llars
for Texas*
Historical and Projected Values for Nominal Gross Product by Detailed Industrial Classification

perrymangroup.com 108 © 2012 by The Perryman Group
State & Total
Local State Local All
Date Government Government Government Industries
2001 $63,287.583 $16,351.667 $46,935.916 $762,242.588
2002 $68,072.670 $17,725.879 $50,346.791 $783,482.975
2003 $70,860.322 $18,143.034 $52,717.288 $828,803.884
2004 $73,398.725 $17,463.831 $55,934.894 $901,670.363
2005 $78,371.024 $18,796.030 $59,574.994 $982,053.862
2006 $82,157.349 $19,894.073 $62,263.276 $1,055,961.536
2007 $88,275.021 $21,077.167 $67,197.854 $1,147,970.636
2008 $93,915.194 $22,440.491 $71,474.703 $1,202,101.330
2009 $99,593.601 $23,861.944 $75,731.657 $1,146,644.798
2010 $106,620.038 $25,512.388 $81,107.650 $1,241,616.226
2011 $110,318.418 $26,416.069 $83,902.349 $1,337,910.565
2012 $115,121.674 $27,585.775 $87,535.900 $1,431,326.617
2013 $121,359.263 $29,101.069 $92,258.193 $1,535,787.474
2014 $128,992.766 $30,953.469 $98,039.296 $1,648,030.090
2015 $136,798.378 $32,849.813 $103,948.564 $1,765,421.085
2016 $145,007.294 $34,845.750 $110,161.544 $1,886,807.578
2017 $153,635.664 $36,945.371 $116,690.293 $2,012,579.624
2018 $162,699.981 $39,152.865 $123,547.117 $2,144,232.252
2019 $172,217.069 $41,472.509 $130,744.561 $2,282,209.853
2020 $182,204.067 $43,908.669 $138,295.398 $2,427,109.866
2021 $192,678.413 $46,465.796 $146,212.617 $2,579,121.518
2022 $203,657.827 $49,148.420 $154,509.407 $2,738,416.804
2023 $215,160.291 $51,961.148 $163,199.143 $2,905,156.507
2024 $227,204.023 $54,908.656 $172,295.367 $3,079,495.273
2025 $239,807.457 $57,995.685 $181,811.772 $3,261,569.668
2026 $252,989.213 $61,227.034 $191,762.178 $3,451,508.705
2027 $266,768.068 $64,607.555 $202,160.513 $3,649,422.912
2028 $281,162.931 $68,142.144 $213,020.788 $3,855,415.170
2029 $296,192.805 $71,835.732 $224,357.073 $4,069,555.834
2030 $311,876.752 $75,693.280 $236,183.472 $4,291,909.908
2031 $328,233.861 $79,719.769 $248,514.092 $4,522,498.729
2032 $345,283.202 $83,920.187 $261,363.015 $4,761,321.900
2033 $363,043.789 $88,299.526 $274,744.263 $5,008,371.773
2034 $381,534.531 $92,862.762 $288,671.769 $5,263,617.361
2035 $400,774.193 $97,614.852 $303,159.340 $5,527,003.395
2036 $420,781.314 $102,560.712 $318,220.602 $5,798,447.638
2037 $441,574.183 $107,705.207 $333,868.976 $6,077,841.594
2038 $463,170.787 $113,053.146 $350,117.642 $6,365,049.824
2039 $485,588.754 $118,609.260 $366,979.494 $6,659,909.377
2040 $508,845.293 $124,378.193 $384,467.101 $6,962,229.351
*M illio ns o f D o llars
for Texas*
Historical and Projected Values for Nominal Gross Product by Detailed Industrial Classification

perrymangroup.com 109 © 2012 by The Perryman Group
Forestry,
Fishing, Fishing, Agriculture
Total Related, Forestry & Hunting, & Forestry Total Oil & Gas
Date Agriculture Farm Other Logging Trapping Support Mining Extraction
2001 $6,506.885 $5,065.941 $1,440.944 $264.199 $147.849 $1,028.896 $104,228.882 $87,397.639
2002 $8,267.535 $6,771.896 $1,495.639 $253.474 $138.738 $1,103.427 $109,586.036 $96,632.138
2003 $8,073.702 $6,557.430 $1,516.272 $254.843 $131.501 $1,129.928 $103,029.483 $87,475.232
2004 $8,471.961 $6,879.715 $1,592.246 $249.040 $129.660 $1,213.546 $101,150.490 $83,652.390
2005 $9,239.490 $7,469.879 $1,769.611 $288.976 $128.270 $1,352.365 $91,258.056 $75,638.412
2006 $7,624.815 $6,023.884 $1,600.931 $249.614 $113.652 $1,237.665 $90,034.698 $76,622.047
2007 $7,119.413 $5,593.744 $1,525.669 $239.099 $115.101 $1,171.469 $96,158.562 $81,145.129
2008 $6,384.895 $4,987.458 $1,397.437 $221.629 $99.318 $1,076.490 $91,516.335 $74,023.927
2009 $6,116.202 $4,663.856 $1,452.346 $230.991 $108.016 $1,113.339 $121,636.640 $104,378.116
2010 $6,039.739 $4,701.894 $1,337.845 $206.270 $92.226 $1,039.349 $126,537.753 $110,611.089
2011 $5,902.211 $4,586.873 $1,315.338 $199.937 $89.294 $1,026.107 $148,412.514 $129,713.174
2012 $5,998.568 $4,653.555 $1,345.013 $201.550 $89.912 $1,053.551 $156,684.973 $138,955.872
2013 $6,105.121 $4,727.749 $1,377.372 $203.461 $90.662 $1,083.249 $163,313.901 $145,440.066
2014 $6,234.790 $4,819.390 $1,415.400 $206.089 $91.729 $1,117.581 $170,501.946 $151,964.453
2015 $6,365.018 $4,910.966 $1,454.052 $208.677 $92.776 $1,152.598 $178,000.097 $158,718.956
2016 $6,495.725 $5,002.401 $1,493.324 $211.224 $93.803 $1,188.298 $184,554.104 $164,632.280
2017 $6,626.831 $5,093.620 $1,533.212 $213.727 $94.807 $1,224.678 $190,579.323 $170,079.580
2018 $6,758.253 $5,184.544 $1,573.709 $216.184 $95.788 $1,261.737 $196,632.437 $175,558.051
2019 $6,889.905 $5,275.095 $1,614.810 $218.593 $96.746 $1,299.470 $202,703.783 $181,059.336
2020 $7,021.699 $5,365.193 $1,656.506 $220.953 $97.680 $1,337.873 $208,783.346 $186,574.685
2021 $7,153.548 $5,454.756 $1,698.792 $223.262 $98.589 $1,376.941 $214,860.788 $192,095.039
2022 $7,285.360 $5,543.703 $1,741.657 $225.517 $99.473 $1,416.668 $220,925.468 $197,611.050
2023 $7,417.042 $5,631.950 $1,785.093 $227.717 $100.329 $1,457.047 $226,966.475 $203,113.106
2024 $7,548.502 $5,719.413 $1,829.089 $229.859 $101.159 $1,498.070 $232,972.656 $208,591.360
2025 $7,679.643 $5,806.008 $1,873.635 $231.944 $101.961 $1,539.731 $238,932.649 $214,035.755
2026 $7,810.368 $5,891.649 $1,918.719 $233.967 $102.734 $1,582.018 $244,834.918 $219,436.054
2027 $7,940.581 $5,976.251 $1,964.329 $235.929 $103.478 $1,624.922 $250,667.785 $224,781.866
2028 $8,070.180 $6,059.728 $2,010.452 $237.826 $104.193 $1,668.433 $256,419.471 $230,062.684
2029 $8,199.068 $6,141.995 $2,057.073 $239.658 $104.877 $1,712.538 $262,078.133 $235,267.914
2030 $8,327.142 $6,222.964 $2,104.178 $241.423 $105.530 $1,757.225 $267,631.903 $240,386.910
2031 $8,454.301 $6,302.553 $2,151.748 $243.119 $106.151 $1,802.477 $273,068.929 $245,408.994
2032 $8,580.442 $6,380.678 $2,199.764 $244.745 $106.740 $1,848.279 $278,377.417 $250,323.507
2033 $8,705.463 $6,457.257 $2,248.206 $246.298 $107.296 $1,894.612 $283,545.674 $255,119.851
2034 $8,829.261 $6,532.208 $2,297.052 $247.777 $107.818 $1,941.457 $288,562.146 $259,787.519
2035 $8,951.732 $6,605.450 $2,346.282 $249.181 $108.306 $1,988.794 $293,415.466 $264,316.138
2036 $9,072.772 $6,676.902 $2,395.870 $250.508 $108.760 $2,036.603 $298,094.494 $268,695.480
2037 $9,192.279 $6,746.485 $2,445.794 $251.756 $109.178 $2,084.860 $302,588.360 $272,915.515
2038 $9,310.150 $6,814.122 $2,496.028 $252.924 $109.561 $2,133.543 $306,886.503 $276,966.452
2039 $9,426.281 $6,879.735 $2,546.545 $254.011 $109.907 $2,182.627 $310,978.719 $280,838.783
2040 $9,540.570 $6,943.250 $2,597.320 $255.016 $110.217 $2,232.087 $314,855.193 $284,523.316
*M illio ns o f 2005 D o llars
Historical and Projected Values for Real Gross Product by Detailed Industrial Classification
for Texas*
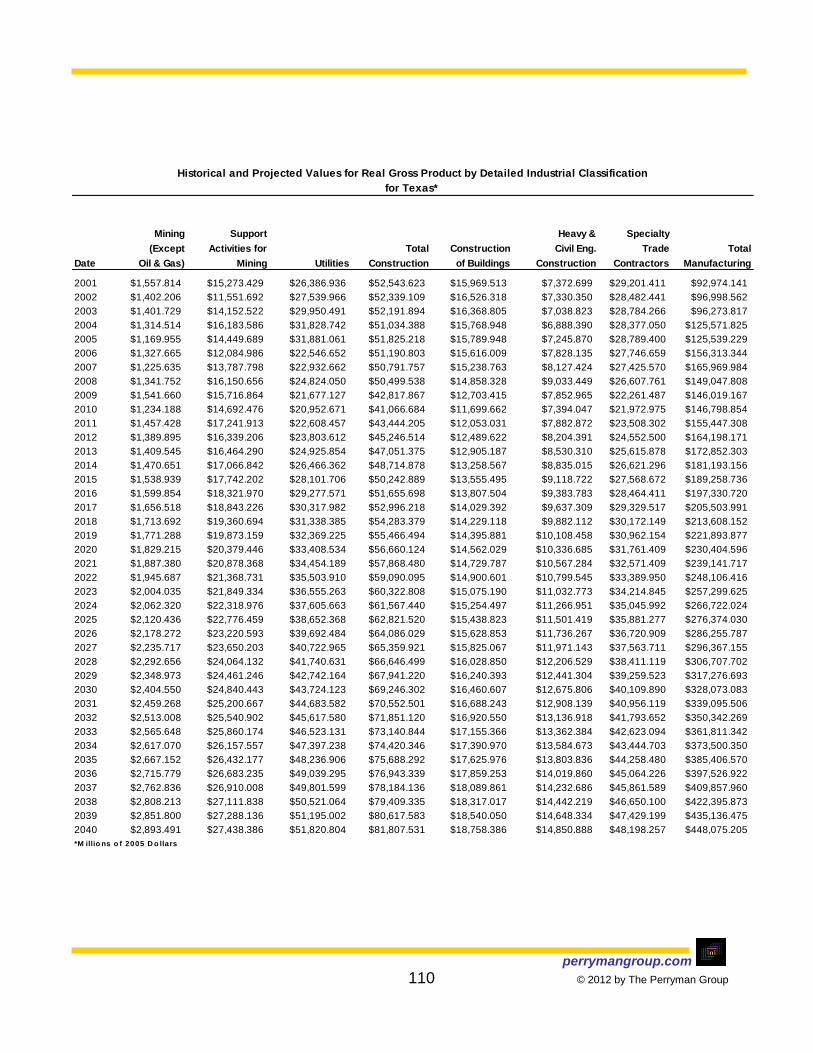
perrymangroup.com 110 © 2012 by The Perryman Group
Mining Support Heavy & Specialty
(Except Activities for Total Construction Civil Eng. Trade Total
Date Oil & Gas) Mining Utilities Construction of Buildings Construction Contractors Manufacturing
2001 $1,557.814 $15,273.429 $26,386.936 $52,543.623 $15,969.513 $7,372.699 $29,201.411 $92,974.141
2002 $1,402.206 $11,551.692 $27,539.966 $52,339.109 $16,526.318 $7,330.350 $28,482.441 $96,998.562
2003 $1,401.729 $14,152.522 $29,950.491 $52,191.894 $16,368.805 $7,038.823 $28,784.266 $96,273.817
2004 $1,314.514 $16,183.586 $31,828.742 $51,034.388 $15,768.948 $6,888.390 $28,377.050 $125,571.825
2005 $1,169.955 $14,449.689 $31,881.061 $51,825.218 $15,789.948 $7,245.870 $28,789.400 $125,539.229
2006 $1,327.665 $12,084.986 $22,546.652 $51,190.803 $15,616.009 $7,828.135 $27,746.659 $156,313.344
2007 $1,225.635 $13,787.798 $22,932.662 $50,791.757 $15,238.763 $8,127.424 $27,425.570 $165,969.984
2008 $1,341.752 $16,150.656 $24,824.050 $50,499.538 $14,858.328 $9,033.449 $26,607.761 $149,047.808
2009 $1,541.660 $15,716.864 $21,677.127 $42,817.867 $12,703.415 $7,852.965 $22,261.487 $146,019.167
2010 $1,234.188 $14,692.476 $20,952.671 $41,066.684 $11,699.662 $7,394.047 $21,972.975 $146,798.854
2011 $1,457.428 $17,241.913 $22,608.457 $43,444.205 $12,053.031 $7,882.872 $23,508.302 $155,447.308
2012 $1,389.895 $16,339.206 $23,803.612 $45,246.514 $12,489.622 $8,204.391 $24,552.500 $164,198.171
2013 $1,409.545 $16,464.290 $24,925.854 $47,051.375 $12,905.187 $8,530.310 $25,615.878 $172,852.303
2014 $1,470.651 $17,066.842 $26,466.362 $48,714.878 $13,258.567 $8,835.015 $26,621.296 $181,193.156
2015 $1,538.939 $17,742.202 $28,101.706 $50,242.889 $13,555.495 $9,118.722 $27,568.672 $189,258.736
2016 $1,599.854 $18,321.970 $29,277.571 $51,655.698 $13,807.504 $9,383.783 $28,464.411 $197,330.720
2017 $1,656.518 $18,843.226 $30,317.982 $52,996.218 $14,029.392 $9,637.309 $29,329.517 $205,503.991
2018 $1,713.692 $19,360.694 $31,338.385 $54,283.379 $14,229.118 $9,882.112 $30,172.149 $213,608.152
2019 $1,771.288 $19,873.159 $32,369.225 $55,466.494 $14,395.881 $10,108.458 $30,962.154 $221,893.877
2020 $1,829.215 $20,379.446 $33,408.534 $56,660.124 $14,562.029 $10,336.685 $31,761.409 $230,404.596
2021 $1,887.380 $20,878.368 $34,454.189 $57,868.480 $14,729.787 $10,567.284 $32,571.409 $239,141.717
2022 $1,945.687 $21,368.731 $35,503.910 $59,090.095 $14,900.601 $10,799.545 $33,389.950 $248,106.416
2023 $2,004.035 $21,849.334 $36,555.263 $60,322.808 $15,075.190 $11,032.773 $34,214.845 $257,299.625
2024 $2,062.320 $22,318.976 $37,605.663 $61,567.440 $15,254.497 $11,266.951 $35,045.992 $266,722.024
2025 $2,120.436 $22,776.459 $38,652.368 $62,821.520 $15,438.823 $11,501.419 $35,881.277 $276,374.030
2026 $2,178.272 $23,220.593 $39,692.484 $64,086.029 $15,628.853 $11,736.267 $36,720.909 $286,255.787
2027 $2,235.717 $23,650.203 $40,722.965 $65,359.921 $15,825.067 $11,971.143 $37,563.711 $296,367.155
2028 $2,292.656 $24,064.132 $41,740.631 $66,646.499 $16,028.850 $12,206.529 $38,411.119 $306,707.702
2029 $2,348.973 $24,461.246 $42,742.164 $67,941.220 $16,240.393 $12,441.304 $39,259.523 $317,276.693
2030 $2,404.550 $24,840.443 $43,724.123 $69,246.302 $16,460.607 $12,675.806 $40,109.890 $328,073.083
2031 $2,459.268 $25,200.667 $44,683.582 $70,552.501 $16,688.243 $12,908.139 $40,956.119 $339,095.506
2032 $2,513.008 $25,540.902 $45,617.580 $71,851.120 $16,920.550 $13,136.918 $41,793.652 $350,342.269
2033 $2,565.648 $25,860.174 $46,523.131 $73,140.844 $17,155.366 $13,362.384 $42,623.094 $361,811.342
2034 $2,617.070 $26,157.557 $47,397.238 $74,420.346 $17,390.970 $13,584.673 $43,444.703 $373,500.350
2035 $2,667.152 $26,432.177 $48,236.906 $75,688.292 $17,625.976 $13,803.836 $44,258.480 $385,406.570
2036 $2,715.779 $26,683.235 $49,039.295 $76,943.339 $17,859.253 $14,019.860 $45,064.226 $397,526.922
2037 $2,762.836 $26,910.008 $49,801.599 $78,184.136 $18,089.861 $14,232.686 $45,861.589 $409,857.960
2038 $2,808.213 $27,111.838 $50,521.064 $79,409.335 $18,317.017 $14,442.219 $46,650.100 $422,395.873
2039 $2,851.800 $27,288.136 $51,195.002 $80,617.583 $18,540.050 $14,648.334 $47,429.199 $435,136.475
2040 $2,893.491 $27,438.386 $51,820.804 $81,807.531 $18,758.386 $14,850.888 $48,198.257 $448,075.205
*M illio ns o f 2005 D o llars
Historical and Projected Values for Real Gross Product by Detailed Industrial Classification
for Texas*

perrymangroup.com 111 © 2012 by The Perryman Group
Electrical
NonMetallic Primary Fabricated Computer & Equipment &
Durable Wood Mineral Metal Metal Machinery Electronic Appliance
Date Goods Products Products Mfg. Products Mfg. Products Manufacturing
2001 $47,360.640 $1,903.853 $4,450.672 $3,169.481 $8,610.008 $6,867.799 $9,006.824 $1,795.111
2002 $49,101.526 $1,983.330 $4,896.883 $2,870.879 $8,232.227 $6,139.759 $10,044.186 $1,949.933
2003 $47,251.592 $1,966.075 $4,380.186 $2,634.570 $7,755.442 $6,366.387 $10,158.446 $1,939.459
2004 $56,674.208 $1,819.760 $4,942.343 $3,759.532 $8,202.138 $9,889.733 $14,047.671 $1,875.950
2005 $62,072.053 $1,842.082 $5,373.223 $2,826.404 $9,507.468 $10,960.823 $16,207.690 $2,027.554
2006 $79,261.041 $1,621.916 $3,866.815 $2,665.990 $10,481.857 $12,703.983 $31,280.885 $2,114.486
2007 $81,466.153 $1,830.399 $3,771.041 $2,434.681 $11,805.524 $14,666.709 $27,576.733 $1,872.533
2008 $87,891.295 $1,846.107 $3,788.442 $2,866.131 $11,817.713 $14,404.138 $33,361.572 $2,180.383
2009 $82,321.642 $1,721.838 $3,140.781 $2,743.443 $8,623.903 $10,628.705 $36,996.249 $2,049.581
2010 $81,675.711 $1,731.802 $3,501.286 $2,620.522 $10,810.628 $13,417.637 $31,176.403 $2,069.301
2011 $87,555.374 $1,865.265 $3,742.384 $2,787.263 $11,496.310 $14,400.724 $33,511.938 $2,241.454
2012 $92,886.265 $1,988.224 $3,958.193 $2,934.497 $12,097.662 $15,295.776 $35,647.734 $2,402.586
2013 $98,184.129 $2,111.611 $4,170.770 $3,078.917 $12,683.018 $16,187.520 $37,780.339 $2,565.744
2014 $103,294.269 $2,232.081 $4,373.513 $3,215.845 $13,232.637 $17,050.423 $39,849.763 $2,726.822
2015 $108,338.313 $2,352.225 $4,571.574 $3,349.278 $13,762.551 $17,904.499 $41,902.289 $2,888.918
2016 $113,347.441 $2,472.708 $4,766.235 $3,480.324 $14,276.886 $18,754.896 $43,949.621 $3,052.823
2017 $118,380.947 $2,594.824 $4,959.942 $3,610.916 $14,783.153 $19,611.444 $46,014.519 $3,220.122
2018 $123,268.422 $2,714.834 $5,145.517 $3,735.978 $15,260.175 $20,445.925 $48,030.472 $3,386.155
2019 $128,260.633 $2,838.244 $5,333.405 $3,863.244 $15,739.202 $21,299.929 $50,094.836 $3,557.761
2020 $133,401.214 $2,966.061 $5,525.313 $3,994.062 $16,225.211 $22,180.811 $52,224.810 $3,736.246
2021 $138,691.885 $3,098.376 $5,721.191 $4,128.502 $16,717.941 $23,088.988 $54,421.301 $3,921.775
2022 $144,134.251 $3,235.274 $5,920.978 $4,266.635 $17,217.113 $24,024.863 $56,685.167 $4,114.515
2023 $149,729.793 $3,376.841 $6,124.607 $4,408.534 $17,722.430 $24,988.821 $59,017.215 $4,314.625
2024 $155,479.861 $3,523.157 $6,332.003 $4,554.272 $18,233.580 $25,981.233 $61,418.199 $4,522.265
2025 $161,385.667 $3,674.304 $6,543.083 $4,703.920 $18,750.231 $27,002.452 $63,888.812 $4,737.590
2026 $167,448.279 $3,830.356 $6,757.755 $4,857.552 $19,272.037 $28,052.811 $66,429.689 $4,960.749
2027 $173,668.609 $3,991.386 $6,975.919 $5,015.242 $19,798.634 $29,132.623 $69,041.398 $5,191.888
2028 $180,047.412 $4,157.464 $7,197.466 $5,177.063 $20,329.639 $30,242.179 $71,724.437 $5,431.149
2029 $186,585.275 $4,328.654 $7,422.281 $5,343.090 $20,864.657 $31,381.747 $74,479.236 $5,678.666
2030 $193,282.611 $4,505.017 $7,650.237 $5,513.395 $21,403.274 $32,551.573 $77,306.146 $5,934.567
2031 $200,139.652 $4,686.611 $7,881.201 $5,688.052 $21,945.062 $33,751.874 $80,205.439 $6,198.978
2032 $207,156.442 $4,873.489 $8,115.030 $5,867.137 $22,489.576 $34,982.843 $83,177.303 $6,472.019
2033 $214,332.828 $5,065.700 $8,351.574 $6,050.722 $23,036.357 $36,244.641 $86,221.841 $6,753.802
2034 $221,668.460 $5,263.286 $8,590.674 $6,238.882 $23,584.933 $37,537.405 $89,339.065 $7,044.430
2035 $229,162.776 $5,466.286 $8,832.162 $6,431.690 $24,134.815 $38,861.237 $92,528.896 $7,344.000
2036 $236,815.002 $5,674.737 $9,075.862 $6,629.220 $24,685.506 $40,216.208 $95,791.157 $7,652.599
2037 $244,624.144 $5,888.672 $9,321.590 $6,831.545 $25,236.491 $41,602.357 $99,125.571 $7,970.303
2038 $252,588.983 $6,108.118 $9,569.155 $7,038.737 $25,787.246 $43,019.687 $102,531.760 $8,297.180
2039 $260,708.069 $6,333.095 $9,818.357 $7,250.868 $26,337.237 $44,468.167 $106,009.241 $8,633.288
2040 $268,979.715 $6,563.618 $10,068.988 $7,468.012 $26,885.917 $45,947.728 $109,557.422 $8,978.671
*M illio ns o f 2005 D o llars
Historical and Projected Values for Real Gross Product by Detailed Industrial Classification
for Texas*

perrymangroup.com 112 © 2012 by The Perryman Group
Transportation
Motor Equipment, Furniture Beverage &
Vehicle Excl. Motor & Related Misc. NonDurable Food Tobacco Textile
Date Manufacturing Vehicles Mfg. Mfg. Goods Mfg. Products Mills
2001 $2,904.548 $5,109.880 $1,384.782 $2,157.682 $45,613.501 $7,424.093 $1,404.824 $135.025
2002 $4,018.097 $5,118.222 $1,390.239 $2,457.771 $47,897.036 $7,884.705 $1,571.276 $155.465
2003 $4,207.254 $3,877.559 $1,493.940 $2,472.274 $49,022.225 $8,024.979 $1,537.775 $179.343
2004 $3,101.954 $4,605.284 $1,459.180 $2,970.663 $68,897.617 $8,051.665 $1,622.929 $148.492
2005 $3,324.290 $5,622.723 $1,593.365 $2,786.431 $63,467.176 $8,071.942 $1,485.510 $169.209
2006 $5,791.864 $4,101.569 $1,794.241 $2,837.435 $77,052.303 $9,737.364 $1,812.761 $147.739
2007 $5,984.254 $6,473.823 $1,604.957 $3,445.499 $84,503.831 $9,234.868 $1,868.749 $144.258
2008 $5,398.431 $7,584.744 $1,286.262 $3,357.372 $61,156.513 $7,931.269 $1,772.432 $164.208
2009 $4,199.740 $7,963.151 $1,138.759 $3,115.492 $63,697.525 $7,784.489 $1,680.335 $125.689
2010 $5,114.173 $7,080.506 $1,163.870 $2,989.583 $65,123.143 $8,499.378 $1,843.527 $173.054
2011 $5,534.112 $7,606.839 $1,231.295 $3,137.791 $67,891.934 $8,888.359 $1,899.292 $179.464
2012 $5,925.649 $8,087.219 $1,289.249 $3,259.476 $71,311.906 $9,364.846 $1,971.388 $187.504
2013 $6,320.945 $8,566.275 $1,345.149 $3,373.841 $74,668.173 $9,835.414 $2,039.669 $195.278
2014 $6,709.817 $9,030.401 $1,396.973 $3,475.994 $77,898.887 $10,291.770 $2,102.553 $202.625
2015 $7,099.830 $9,490.093 $1,446.490 $3,570.565 $80,920.423 $10,722.638 $2,157.961 $209.336
2016 $7,492.854 $9,947.995 $1,494.190 $3,658.910 $83,983.279 $11,161.019 $2,212.717 $216.063
2017 $7,892.697 $10,409.246 $1,540.907 $3,743.178 $87,123.044 $11,611.658 $2,267.734 $222.894
2018 $8,287.861 $10,858.790 $1,584.480 $3,818.237 $90,339.730 $12,074.599 $2,322.964 $229.828
2019 $8,695.012 $11,318.634 $1,628.205 $3,892.162 $93,633.243 $12,549.867 $2,378.357 $236.860
2020 $9,117.216 $11,792.631 $1,672.619 $3,966.234 $97,003.382 $13,037.471 $2,433.863 $243.985
2021 $9,554.744 $12,280.945 $1,717.714 $4,040.409 $100,449.832 $13,537.401 $2,489.430 $251.201
2022 $10,007.852 $12,783.730 $1,763.482 $4,114.644 $103,972.165 $14,049.629 $2,545.006 $258.501
2023 $10,476.786 $13,301.126 $1,809.912 $4,188.896 $107,569.832 $14,574.106 $2,600.537 $265.883
2024 $10,961.775 $13,833.262 $1,856.995 $4,263.119 $111,242.163 $15,110.764 $2,655.968 $273.340
2025 $11,463.037 $14,380.250 $1,904.721 $4,337.267 $114,988.363 $15,659.514 $2,711.242 $280.868
2026 $11,980.769 $14,942.188 $1,953.076 $4,411.295 $118,807.509 $16,220.246 $2,766.303 $288.461
2027 $12,515.155 $15,519.159 $2,002.049 $4,485.155 $122,698.547 $16,792.829 $2,821.095 $296.113
2028 $13,066.359 $16,111.229 $2,051.626 $4,558.801 $126,660.290 $17,377.107 $2,875.558 $303.819
2029 $13,634.524 $16,718.445 $2,101.793 $4,632.183 $130,691.418 $17,972.905 $2,929.635 $311.573
2030 $14,219.774 $17,340.840 $2,152.535 $4,705.254 $134,790.472 $18,580.022 $2,983.266 $319.368
2031 $14,822.210 $17,978.425 $2,203.836 $4,777.965 $138,955.854 $19,198.235 $3,036.393 $327.198
2032 $15,441.910 $18,631.191 $2,255.678 $4,850.265 $143,185.827 $19,827.296 $3,088.956 $335.056
2033 $16,078.929 $19,299.111 $2,308.045 $4,922.107 $147,478.513 $20,466.935 $3,140.895 $342.935
2034 $16,733.293 $19,982.136 $2,360.918 $4,993.439 $151,831.890 $21,116.857 $3,192.152 $350.829
2035 $17,405.005 $20,680.197 $2,414.276 $5,064.211 $156,243.795 $21,776.740 $3,242.667 $358.729
2036 $18,094.040 $21,393.200 $2,468.101 $5,134.373 $160,711.920 $22,446.254 $3,292.380 $366.630
2037 $18,800.341 $22,121.029 $2,522.370 $5,203.874 $165,233.816 $23,125.044 $3,341.233 $374.522
2038 $19,523.826 $22,863.547 $2,577.062 $5,272.664 $169,806.890 $23,812.731 $3,389.167 $382.399
2039 $20,264.379 $23,620.591 $2,632.154 $5,340.692 $174,428.406 $24,508.914 $3,436.125 $390.252
2040 $21,021.854 $24,391.974 $2,687.622 $5,407.908 $179,095.490 $25,213.170 $3,482.050 $398.074
*M illio ns o f 2005 D o llars
Historical and Projected Values for Real Gross Product by Detailed Industrial Classification
for Texas*
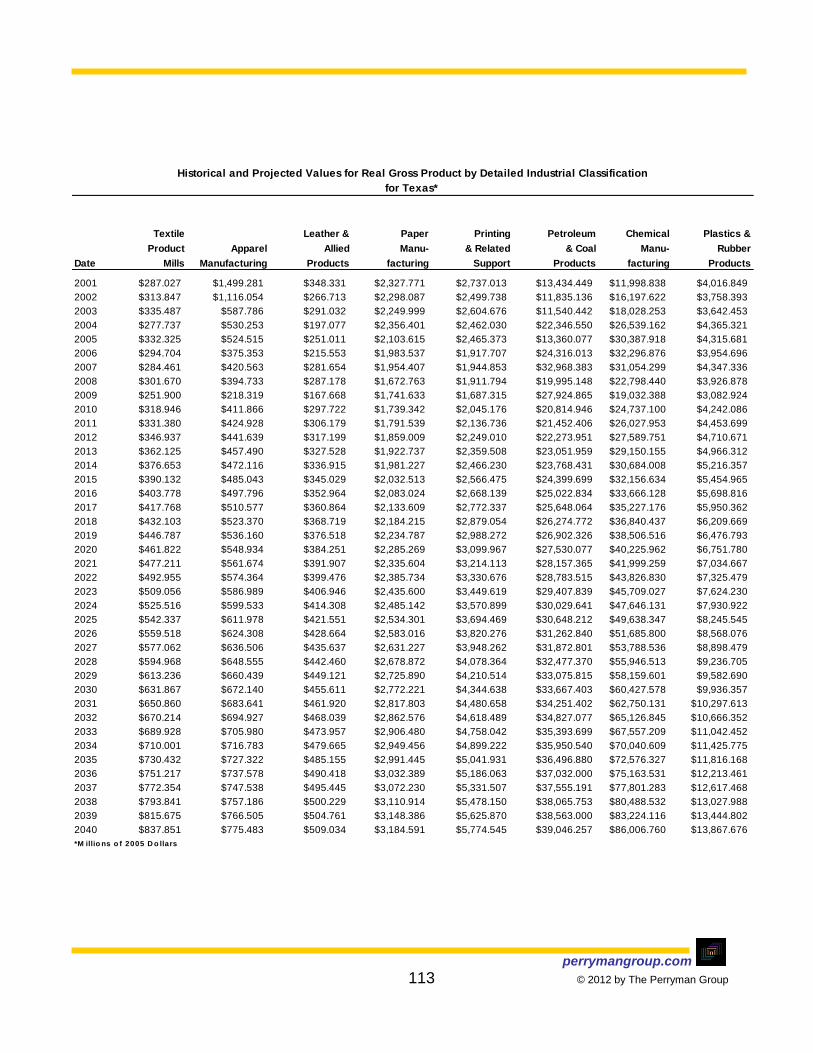
perrymangroup.com 113 © 2012 by The Perryman Group
Textile Leather & Paper Printing Petroleum Chemical Plastics &
Product Apparel Allied Manu- & Related & Coal Manu- Rubber
Date Mills Manufacturing Products facturing Support Products facturing Products
2001 $287.027 $1,499.281 $348.331 $2,327.771 $2,737.013 $13,434.449 $11,998.838 $4,016.849
2002 $313.847 $1,116.054 $266.713 $2,298.087 $2,499.738 $11,835.136 $16,197.622 $3,758.393
2003 $335.487 $587.786 $291.032 $2,249.999 $2,604.676 $11,540.442 $18,028.253 $3,642.453
2004 $277.737 $530.253 $197.077 $2,356.401 $2,462.030 $22,346.550 $26,539.162 $4,365.321
2005 $332.325 $524.515 $251.011 $2,103.615 $2,465.373 $13,360.077 $30,387.918 $4,315.681
2006 $294.704 $375.353 $215.553 $1,983.537 $1,917.707 $24,316.013 $32,296.876 $3,954.696
2007 $284.461 $420.563 $281.654 $1,954.407 $1,944.853 $32,968.383 $31,054.299 $4,347.336
2008 $301.670 $394.733 $287.178 $1,672.763 $1,911.794 $19,995.148 $22,798.440 $3,926.878
2009 $251.900 $218.319 $167.668 $1,741.633 $1,687.315 $27,924.865 $19,032.388 $3,082.924
2010 $318.946 $411.866 $297.722 $1,739.342 $2,045.176 $20,814.946 $24,737.100 $4,242.086
2011 $331.380 $424.928 $306.179 $1,791.539 $2,136.736 $21,452.406 $26,027.953 $4,453.699
2012 $346.937 $441.639 $317.199 $1,859.009 $2,249.010 $22,273.951 $27,589.751 $4,710.671
2013 $362.125 $457.490 $327.528 $1,922.737 $2,359.508 $23,051.959 $29,150.155 $4,966.312
2014 $376.653 $472.116 $336.915 $1,981.227 $2,466.230 $23,768.431 $30,684.008 $5,216.357
2015 $390.132 $485.043 $345.029 $2,032.513 $2,566.475 $24,399.699 $32,156.634 $5,454.965
2016 $403.778 $497.796 $352.964 $2,083.024 $2,668.139 $25,022.834 $33,666.128 $5,698.816
2017 $417.768 $510.577 $360.864 $2,133.609 $2,772.337 $25,648.064 $35,227.176 $5,950.362
2018 $432.103 $523.370 $368.719 $2,184.215 $2,879.054 $26,274.772 $36,840.437 $6,209.669
2019 $446.787 $536.160 $376.518 $2,234.787 $2,988.272 $26,902.326 $38,506.516 $6,476.793
2020 $461.822 $548.934 $384.251 $2,285.269 $3,099.967 $27,530.077 $40,225.962 $6,751.780
2021 $477.211 $561.674 $391.907 $2,335.604 $3,214.113 $28,157.365 $41,999.259 $7,034.667
2022 $492.955 $574.364 $399.476 $2,385.734 $3,330.676 $28,783.515 $43,826.830 $7,325.479
2023 $509.056 $586.989 $406.946 $2,435.600 $3,449.619 $29,407.839 $45,709.027 $7,624.230
2024 $525.516 $599.533 $414.308 $2,485.142 $3,570.899 $30,029.641 $47,646.131 $7,930.922
2025 $542.337 $611.978 $421.551 $2,534.301 $3,694.469 $30,648.212 $49,638.347 $8,245.545
2026 $559.518 $624.308 $428.664 $2,583.016 $3,820.276 $31,262.840 $51,685.800 $8,568.076
2027 $577.062 $636.506 $435.637 $2,631.227 $3,948.262 $31,872.801 $53,788.536 $8,898.479
2028 $594.968 $648.555 $442.460 $2,678.872 $4,078.364 $32,477.370 $55,946.513 $9,236.705
2029 $613.236 $660.439 $449.121 $2,725.890 $4,210.514 $33,075.815 $58,159.601 $9,582.690
2030 $631.867 $672.140 $455.611 $2,772.221 $4,344.638 $33,667.403 $60,427.578 $9,936.357
2031 $650.860 $683.641 $461.920 $2,817.803 $4,480.658 $34,251.402 $62,750.131 $10,297.613
2032 $670.214 $694.927 $468.039 $2,862.576 $4,618.489 $34,827.077 $65,126.845 $10,666.352
2033 $689.928 $705.980 $473.957 $2,906.480 $4,758.042 $35,393.699 $67,557.209 $11,042.452
2034 $710.001 $716.783 $479.665 $2,949.456 $4,899.222 $35,950.540 $70,040.609 $11,425.775
2035 $730.432 $727.322 $485.155 $2,991.445 $5,041.931 $36,496.880 $72,576.327 $11,816.168
2036 $751.217 $737.578 $490.418 $3,032.389 $5,186.063 $37,032.000 $75,163.531 $12,213.461
2037 $772.354 $747.538 $495.445 $3,072.230 $5,331.507 $37,555.191 $77,801.283 $12,617.468
2038 $793.841 $757.186 $500.229 $3,110.914 $5,478.150 $38,065.753 $80,488.532 $13,027.988
2039 $815.675 $766.505 $504.761 $3,148.386 $5,625.870 $38,563.000 $83,224.116 $13,444.802
2040 $837.851 $775.483 $509.034 $3,184.591 $5,774.545 $39,046.257 $86,006.760 $13,867.676
*M illio ns o f 2005 D o llars
for Texas*
Historical and Projected Values for Real Gross Product by Detailed Industrial Classification

perrymangroup.com 114 © 2012 by The Perryman Group
Furniture Building
Motor & Home Electronics Material Food &
Total Wholesale Retail Vehicle & Furnishing & Appliance & Garden Beverage
Date Trade Trade Trade Part Dealers Stores Stores Stores Stores
2001 $116,718.718 $56,549.287 $60,169.431 $13,462.973 $2,506.358 $3,487.993 $4,374.159 $8,548.729
2002 $119,081.071 $56,412.925 $62,668.146 $14,155.346 $2,566.727 $3,228.529 $4,635.792 $8,737.101
2003 $121,190.519 $58,774.281 $62,416.238 $14,052.916 $2,447.755 $2,973.375 $4,658.124 $8,754.988
2004 $123,469.598 $62,628.063 $60,841.535 $13,460.013 $2,391.417 $2,974.476 $4,746.374 $8,642.081
2005 $126,966.194 $63,399.238 $63,566.956 $14,090.974 $2,507.086 $3,167.181 $5,057.805 $8,542.476
2006 $130,016.716 $65,992.141 $64,024.575 $14,182.874 $2,631.457 $3,176.242 $5,446.215 $8,599.178
2007 $140,069.684 $73,154.009 $66,915.675 $15,079.093 $2,922.592 $3,270.656 $5,672.065 $8,895.198
2008 $138,460.799 $74,743.280 $63,717.519 $13,979.584 $2,689.449 $3,174.107 $5,545.566 $8,911.454
2009 $140,403.861 $77,754.388 $62,649.473 $12,829.219 $2,465.177 $2,957.170 $5,442.049 $9,257.951
2010 $141,208.550 $75,961.028 $65,247.522 $14,330.579 $2,774.076 $3,257.221 $5,666.732 $9,175.911
2011 $146,674.682 $78,761.297 $67,913.385 $14,922.259 $2,897.388 $3,393.091 $5,890.971 $9,575.474
2012 $152,488.767 $81,739.708 $70,749.058 $15,551.896 $3,028.742 $3,537.482 $6,129.266 $10,000.893
2013 $159,213.174 $85,196.436 $74,016.738 $16,277.217 $3,179.476 $3,703.511 $6,404.239 $10,489.499
2014 $166,843.622 $89,126.918 $77,716.704 $17,098.426 $3,349.789 $3,891.211 $6,715.762 $11,041.789
2015 $174,529.412 $93,075.293 $81,454.118 $17,928.766 $3,522.793 $4,080.815 $7,029.604 $11,601.975
2016 $182,315.033 $97,065.396 $85,249.637 $18,772.820 $3,699.400 $4,273.332 $7,347.523 $12,173.035
2017 $189,560.236 $100,756.945 $88,803.292 $19,564.542 $3,866.572 $4,453.692 $7,643.666 $12,712.078
2018 $196,779.018 $104,424.395 $92,354.623 $20,356.679 $4,034.668 $4,633.867 $7,938.697 $13,253.207
2019 $203,959.775 $108,061.939 $95,897.836 $21,147.975 $4,203.430 $4,813.539 $8,232.109 $13,795.575
2020 $211,269.513 $111,758.285 $99,511.229 $21,955.726 $4,376.297 $4,996.610 $8,530.607 $14,350.450
2021 $218,703.488 $115,510.873 $103,192.615 $22,779.494 $4,553.201 $5,182.945 $8,833.969 $14,917.579
2022 $226,256.549 $119,316.955 $106,939.595 $23,618.797 $4,734.064 $5,372.398 $9,141.955 $15,496.673
2023 $233,923.138 $123,173.589 $110,749.549 $24,473.101 $4,918.797 $5,564.809 $9,454.307 $16,087.406
2024 $241,697.286 $127,077.644 $114,619.641 $25,341.826 $5,107.299 $5,760.009 $9,770.752 $16,689.419
2025 $249,572.620 $131,025.801 $118,546.818 $26,224.343 $5,299.458 $5,957.814 $10,090.997 $17,302.314
2026 $257,542.362 $135,014.553 $122,527.808 $27,119.974 $5,495.151 $6,158.030 $10,414.732 $17,925.659
2027 $265,599.334 $139,040.210 $126,559.124 $28,027.991 $5,694.241 $6,360.450 $10,741.632 $18,558.984
2028 $273,735.964 $143,098.901 $130,637.063 $28,947.621 $5,896.583 $6,564.858 $11,071.353 $19,201.783
2029 $281,944.294 $147,186.580 $134,757.714 $29,878.039 $6,102.017 $6,771.025 $11,403.538 $19,853.513
2030 $290,215.987 $151,299.029 $138,916.958 $30,818.375 $6,310.373 $6,978.711 $11,737.811 $20,513.595
2031 $298,542.335 $155,431.865 $143,110.470 $31,767.713 $6,521.469 $7,187.666 $12,073.783 $21,181.415
2032 $306,914.276 $159,580.544 $147,333.732 $32,725.089 $6,735.111 $7,397.629 $12,411.051 $21,856.320
2033 $315,322.403 $163,740.371 $151,582.031 $33,689.497 $6,951.093 $7,608.332 $12,749.196 $22,537.628
2034 $323,756.976 $167,906.504 $155,850.472 $34,659.886 $7,169.200 $7,819.494 $13,087.789 $23,224.618
2035 $332,207.945 $172,073.965 $160,133.980 $35,635.164 $7,389.203 $8,030.828 $13,426.385 $23,916.537
2036 $340,664.960 $176,237.678 $164,427.282 $36,614.195 $7,610.864 $8,242.036 $13,764.528 $24,612.597
2037 $349,117.395 $180,392.452 $168,724.943 $37,595.801 $7,833.932 $8,452.814 $14,101.751 $25,311.976
2038 $357,554.364 $184,532.988 $173,021.375 $38,578.772 $8,058.146 $8,662.849 $14,437.575 $26,013.823
2039 $365,964.743 $188,653.894 $177,310.850 $39,561.859 $8,283.236 $8,871.823 $14,771.515 $26,717.258
2040 $374,337.198 $192,749.690 $181,587.508 $40,543.784 $8,508.922 $9,079.411 $15,103.077 $27,421.373
*M illio ns o f 2005 D o llars
for Texas*
Historical and Projected Values for Real Gross Product by Detailed Industrial Classification

perrymangroup.com 115 © 2012 by The Perryman Group
Sporting
Health & Clothing & Goods, General Misc.
Personal Care Gasoline Clothing Hobby, Merchandise Store NonStore Transportation
Date Stores Stations Accessories Book, Music Stores Retailers Retailers & Warehousing
2001 $3,450.772 $3,244.523 $3,826.496 $1,759.047 $9,029.570 $4,197.990 $2,280.821 $27,089.000
2002 $3,710.299 $3,287.139 $3,971.197 $1,848.339 $9,962.407 $4,282.359 $2,282.911 $28,069.368
2003 $3,768.620 $3,244.002 $3,901.475 $1,717.143 $10,387.091 $4,146.348 $2,364.401 $28,944.680
2004 $3,772.614 $3,162.650 $3,837.563 $1,522.853 $9,918.029 $3,958.981 $2,454.484 $32,011.328
2005 $3,910.103 $3,595.889 $3,948.577 $1,612.935 $10,733.436 $3,891.589 $2,508.905 $34,188.495
2006 $4,064.605 $3,075.948 $4,101.392 $1,632.307 $10,711.496 $3,918.880 $2,483.981 $36,259.804
2007 $4,404.355 $3,406.467 $4,415.227 $1,643.066 $10,597.660 $3,797.699 $2,811.597 $37,541.835
2008 $4,378.239 $2,913.426 $4,103.450 $1,522.337 $10,682.589 $3,445.348 $2,371.970 $38,881.329
2009 $4,591.021 $2,974.093 $4,064.806 $1,572.126 $10,879.153 $3,309.767 $2,306.941 $33,601.440
2010 $4,457.229 $2,986.650 $4,137.364 $1,517.053 $10,958.518 $3,538.118 $2,448.070 $34,267.550
2011 $4,624.966 $3,109.821 $4,272.400 $1,557.422 $11,424.687 $3,687.252 $2,557.655 $33,899.295
2012 $4,803.076 $3,240.811 $4,415.576 $1,600.219 $11,920.766 $3,845.923 $2,674.407 $34,475.858
2013 $5,009.194 $3,391.639 $4,582.900 $1,651.163 $12,491.123 $4,028.431 $2,808.346 $36,161.890
2014 $5,243.062 $3,562.330 $4,773.776 $1,709.895 $13,136.133 $4,234.868 $2,959.663 $37,594.818
2015 $5,477.848 $3,734.794 $4,963.540 $1,767.488 $13,789.274 $4,443.771 $3,113.450 $38,881.860
2016 $5,714.909 $3,909.970 $5,153.419 $1,824.392 $14,454.056 $4,656.268 $3,270.513 $40,632.883
2017 $5,934.163 $4,074.094 $5,325.374 $1,874.262 $15,079.563 $4,855.959 $3,419.326 $42,443.165
2018 $6,151.717 $4,238.140 $5,494.037 $1,922.336 $15,706.324 $5,055.903 $3,569.045 $44,266.531
2019 $6,367.187 $4,401.838 $5,659.100 $1,968.534 $16,333.330 $5,255.776 $3,719.443 $46,149.262
2020 $6,585.758 $4,568.774 $5,825.190 $2,014.481 $16,973.907 $5,459.865 $3,873.563 $48,092.889
2021 $6,807.240 $4,738.844 $5,992.112 $2,060.111 $17,627.715 $5,668.055 $4,031.350 $50,098.975
2022 $7,031.429 $4,911.932 $6,159.665 $2,105.355 $18,294.371 $5,880.219 $4,192.738 $52,169.101
2023 $7,258.111 $5,087.915 $6,327.638 $2,150.144 $18,973.454 $6,096.217 $4,357.650 $54,304.869
2024 $7,487.059 $5,266.655 $6,495.818 $2,194.408 $19,664.502 $6,315.895 $4,526.000 $56,507.898
2025 $7,718.034 $5,448.009 $6,663.982 $2,238.076 $20,367.011 $6,539.088 $4,697.692 $58,779.815
2026 $7,950.786 $5,631.818 $6,831.904 $2,281.080 $21,080.437 $6,765.618 $4,872.620 $61,122.261
2027 $8,185.055 $5,817.918 $6,999.352 $2,323.347 $21,804.194 $6,995.292 $5,050.666 $63,536.877
2028 $8,420.568 $6,006.131 $7,166.089 $2,364.809 $22,537.657 $7,227.907 $5,231.703 $66,025.294
2029 $8,657.044 $6,196.273 $7,331.874 $2,405.396 $23,280.159 $7,463.245 $5,415.592 $68,589.129
2030 $8,894.192 $6,388.146 $7,496.463 $2,445.038 $24,030.993 $7,701.076 $5,602.184 $71,229.969
2031 $9,131.710 $6,581.546 $7,659.609 $2,483.667 $24,789.414 $7,941.159 $5,791.320 $73,948.734
2032 $9,369.290 $6,776.257 $7,821.061 $2,521.216 $25,554.636 $8,183.241 $5,982.831 $76,746.224
2033 $9,606.612 $6,972.057 $7,980.568 $2,557.619 $26,325.839 $8,427.054 $6,176.535 $79,623.113
2034 $9,843.354 $7,168.713 $8,137.878 $2,592.811 $27,102.163 $8,672.324 $6,372.243 $82,579.929
2035 $10,079.181 $7,365.985 $8,292.738 $2,626.728 $27,882.715 $8,918.761 $6,569.754 $85,617.046
2036 $10,313.756 $7,563.623 $8,444.892 $2,659.310 $28,666.559 $9,166.067 $6,768.856 $88,734.533
2037 $10,546.732 $7,761.369 $8,594.086 $2,690.495 $29,452.729 $9,413.930 $6,969.329 $91,932.269
2038 $10,777.759 $7,958.961 $8,740.068 $2,720.225 $30,240.226 $9,662.030 $7,170.941 $95,209.936
2039 $11,006.485 $8,156.127 $8,882.588 $2,748.446 $31,028.022 $9,910.040 $7,373.452 $98,567.002
2040 $11,232.551 $8,352.590 $9,021.398 $2,775.103 $31,815.062 $10,157.622 $7,576.615 $102,002.710
*M illio ns o f 2005 D o llars
for Texas*
Historical and Projected Values for Real Gross Product by Detailed Industrial Classification

perrymangroup.com 116 © 2012 by The Perryman Group
Transit & Scenic & Support
Air Rail Water Truck Ground Pipeline Sightseeing Activities
Date Transportation Transp. Transp. Transp. Passenger Transp. Transp. Transportation
2001 $4,982.630 $2,434.951 $481.716 $7,364.863 $864.018 $3,245.511 $33.760 $4,846.870
2002 $5,573.627 $2,521.592 $381.069 $7,263.220 $867.622 $3,320.600 $32.865 $5,105.784
2003 $6,191.776 $2,688.654 $373.190 $7,469.442 $808.986 $2,841.074 $27.946 $5,325.707
2004 $6,349.355 $2,724.145 $481.735 $8,456.342 $840.155 $3,136.507 $29.209 $5,937.310
2005 $6,361.127 $2,754.913 $748.156 $9,370.515 $795.920 $2,924.513 $34.821 $6,664.481
2006 $7,324.819 $2,565.558 $1,079.563 $10,233.974 $1,201.366 $2,915.839 $30.533 $6,703.454
2007 $7,234.375 $2,533.102 $1,254.835 $11,333.123 $1,222.586 $3,242.471 $29.109 $6,236.417
2008 $6,918.056 $2,481.864 $1,612.252 $11,110.949 $1,141.223 $4,084.321 $28.993 $6,721.116
2009 $6,430.418 $2,155.345 $1,782.058 $9,400.126 $1,079.331 $2,540.817 $31.300 $5,727.212
2010 $6,206.797 $2,289.840 $1,444.674 $9,552.678 $1,016.374 $3,603.248 $25.063 $5,870.955
2011 $6,195.960 $2,320.218 $1,440.486 $9,331.565 $1,010.184 $3,564.403 $24.520 $5,779.805
2012 $6,359.457 $2,418.689 $1,476.207 $9,369.809 $1,031.819 $3,623.558 $24.643 $5,848.127
2013 $6,731.506 $2,599.971 $1,560.034 $9,702.943 $1,086.704 $3,798.297 $25.527 $6,101.955
2014 $7,061.835 $2,769.703 $1,633.794 $9,958.643 $1,134.102 $3,945.257 $26.193 $6,309.536
2015 $7,369.507 $2,934.778 $1,701.915 $10,167.681 $1,177.136 $4,075.638 $26.719 $6,489.380
2016 $7,770.433 $3,141.693 $1,791.120 $10,489.093 $1,234.254 $4,253.231 $27.523 $6,743.035
2017 $8,188.925 $3,361.138 $1,883.848 $10,815.232 $1,293.221 $4,435.402 $28.319 $7,002.317
2018 $8,616.332 $3,589.888 $1,978.057 $11,134.058 $1,352.601 $4,617.167 $29.076 $7,259.389
2019 $9,061.845 $3,832.049 $2,075.810 $11,457.095 $1,413.771 $4,803.197 $29.822 $7,521.666
2020 $9,526.113 $4,088.292 $2,177.193 $11,784.304 $1,476.744 $4,993.469 $30.554 $7,789.123
2021 $10,009.801 $4,359.313 $2,282.293 $12,115.643 $1,541.535 $5,187.954 $31.273 $8,061.734
2022 $10,513.597 $4,645.835 $2,391.199 $12,451.063 $1,608.155 $5,386.619 $31.976 $8,339.461
2023 $11,038.206 $4,948.611 $2,503.996 $12,790.510 $1,676.612 $5,589.418 $32.661 $8,622.263
2024 $11,584.349 $5,268.418 $2,620.771 $13,133.923 $1,746.913 $5,796.301 $33.328 $8,910.087
2025 $12,152.767 $5,606.062 $2,741.608 $13,481.234 $1,819.062 $6,007.208 $33.975 $9,202.872
2026 $12,744.217 $5,962.377 $2,866.589 $13,832.366 $1,893.058 $6,222.069 $34.600 $9,500.550
2027 $13,359.473 $6,338.225 $2,995.795 $14,187.233 $1,968.900 $6,440.805 $35.202 $9,803.039
2028 $13,999.320 $6,734.493 $3,129.304 $14,545.738 $2,046.581 $6,663.327 $35.779 $10,110.246
2029 $14,664.557 $7,152.094 $3,267.192 $14,907.769 $2,126.091 $6,889.532 $36.331 $10,422.066
2030 $15,355.992 $7,591.966 $3,409.528 $15,273.202 $2,207.416 $7,119.306 $36.855 $10,738.378
2031 $16,074.300 $8,055.003 $3,556.348 $15,641.762 $2,290.517 $7,352.459 $37.351 $11,058.952
2032 $16,820.145 $8,542.106 $3,707.678 $16,013.151 $2,375.347 $7,588.778 $37.816 $11,383.531
2033 $17,594.167 $9,054.179 $3,863.533 $16,387.045 $2,461.854 $7,828.032 $38.250 $11,711.835
2034 $18,396.985 $9,592.132 $4,023.920 $16,763.094 $2,549.974 $8,069.968 $38.649 $12,043.559
2035 $19,229.188 $10,156.871 $4,188.829 $17,140.922 $2,639.640 $8,314.312 $39.015 $12,378.369
2036 $20,091.283 $10,749.281 $4,358.235 $17,520.104 $2,730.768 $8,560.756 $39.343 $12,715.889
2037 $20,983.733 $11,370.239 $4,532.099 $17,900.191 $2,823.269 $8,808.972 $39.635 $13,055.718
2038 $21,906.955 $12,020.604 $4,710.366 $18,280.703 $2,917.043 $9,058.606 $39.887 $13,397.423
2039 $22,861.315 $12,701.214 $4,892.966 $18,661.140 $3,011.980 $9,309.285 $40.100 $13,740.548
2040 $23,847.121 $13,412.881 $5,079.811 $19,040.972 $3,107.964 $9,560.614 $40.271 $14,084.607
*M illio ns o f 2005 D o llars
Historical and Projected Values for Real Gross Product by Detailed Industrial Classification
for Texas*
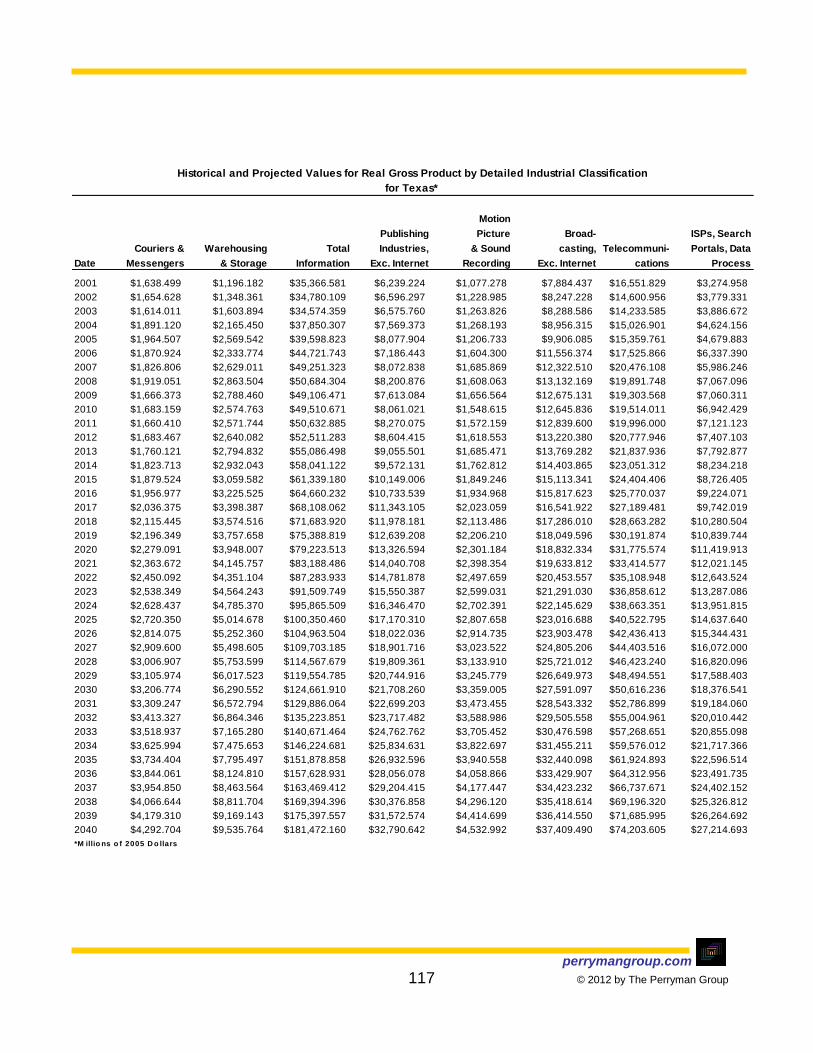
perrymangroup.com 117 © 2012 by The Perryman Group
Motion
Publishing Picture Broad- ISPs, Search
Couriers & Warehousing Total Industries, & Sound casting, Telecommuni- Portals, Data
Date Messengers & Storage Information Exc. Internet Recording Exc. Internet cations Process
2001 $1,638.499 $1,196.182 $35,366.581 $6,239.224 $1,077.278 $7,884.437 $16,551.829 $3,274.958
2002 $1,654.628 $1,348.361 $34,780.109 $6,596.297 $1,228.985 $8,247.228 $14,600.956 $3,779.331
2003 $1,614.011 $1,603.894 $34,574.359 $6,575.760 $1,263.826 $8,288.586 $14,233.585 $3,886.672
2004 $1,891.120 $2,165.450 $37,850.307 $7,569.373 $1,268.193 $8,956.315 $15,026.901 $4,624.156
2005 $1,964.507 $2,569.542 $39,598.823 $8,077.904 $1,206.733 $9,906.085 $15,359.761 $4,679.883
2006 $1,870.924 $2,333.774 $44,721.743 $7,186.443 $1,604.300 $11,556.374 $17,525.866 $6,337.390
2007 $1,826.806 $2,629.011 $49,251.323 $8,072.838 $1,685.869 $12,322.510 $20,476.108 $5,986.246
2008 $1,919.051 $2,863.504 $50,684.304 $8,200.876 $1,608.063 $13,132.169 $19,891.748 $7,067.096
2009 $1,666.373 $2,788.460 $49,106.471 $7,613.084 $1,656.564 $12,675.131 $19,303.568 $7,060.311
2010 $1,683.159 $2,574.763 $49,510.671 $8,061.021 $1,548.615 $12,645.836 $19,514.011 $6,942.429
2011 $1,660.410 $2,571.744 $50,632.885 $8,270.075 $1,572.159 $12,839.600 $19,996.000 $7,121.123
2012 $1,683.467 $2,640.082 $52,511.283 $8,604.415 $1,618.553 $13,220.380 $20,777.946 $7,407.103
2013 $1,760.121 $2,794.832 $55,086.498 $9,055.501 $1,685.471 $13,769.282 $21,837.936 $7,792.877
2014 $1,823.713 $2,932.043 $58,041.122 $9,572.131 $1,762.812 $14,403.865 $23,051.312 $8,234.218
2015 $1,879.524 $3,059.582 $61,339.180 $10,149.006 $1,849.246 $15,113.341 $24,404.406 $8,726.405
2016 $1,956.977 $3,225.525 $64,660.232 $10,733.539 $1,934.968 $15,817.623 $25,770.037 $9,224.071
2017 $2,036.375 $3,398.387 $68,108.062 $11,343.105 $2,023.059 $16,541.922 $27,189.481 $9,742.019
2018 $2,115.445 $3,574.516 $71,683.920 $11,978.181 $2,113.486 $17,286.010 $28,663.282 $10,280.504
2019 $2,196.349 $3,757.658 $75,388.819 $12,639.208 $2,206.210 $18,049.596 $30,191.874 $10,839.744
2020 $2,279.091 $3,948.007 $79,223.513 $13,326.594 $2,301.184 $18,832.334 $31,775.574 $11,419.913
2021 $2,363.672 $4,145.757 $83,188.486 $14,040.708 $2,398.354 $19,633.812 $33,414.577 $12,021.145
2022 $2,450.092 $4,351.104 $87,283.933 $14,781.878 $2,497.659 $20,453.557 $35,108.948 $12,643.524
2023 $2,538.349 $4,564.243 $91,509.749 $15,550.387 $2,599.031 $21,291.030 $36,858.612 $13,287.086
2024 $2,628.437 $4,785.370 $95,865.509 $16,346.470 $2,702.391 $22,145.629 $38,663.351 $13,951.815
2025 $2,720.350 $5,014.678 $100,350.460 $17,170.310 $2,807.658 $23,016.688 $40,522.795 $14,637.640
2026 $2,814.075 $5,252.360 $104,963.504 $18,022.036 $2,914.735 $23,903.478 $42,436.413 $15,344.431
2027 $2,909.600 $5,498.605 $109,703.185 $18,901.716 $3,023.522 $24,805.206 $44,403.516 $16,072.000
2028 $3,006.907 $5,753.599 $114,567.679 $19,809.361 $3,133.910 $25,721.012 $46,423.240 $16,820.096
2029 $3,105.974 $6,017.523 $119,554.785 $20,744.916 $3,245.779 $26,649.973 $48,494.551 $17,588.403
2030 $3,206.774 $6,290.552 $124,661.910 $21,708.260 $3,359.005 $27,591.097 $50,616.236 $18,376.541
2031 $3,309.247 $6,572.794 $129,886.064 $22,699.203 $3,473.455 $28,543.332 $52,786.899 $19,184.060
2032 $3,413.327 $6,864.346 $135,223.851 $23,717.482 $3,588.986 $29,505.558 $55,004.961 $20,010.442
2033 $3,518.937 $7,165.280 $140,671.464 $24,762.762 $3,705.452 $30,476.598 $57,268.651 $20,855.098
2034 $3,625.994 $7,475.653 $146,224.681 $25,834.631 $3,822.697 $31,455.211 $59,576.012 $21,717.366
2035 $3,734.404 $7,795.497 $151,878.858 $26,932.596 $3,940.558 $32,440.098 $61,924.893 $22,596.514
2036 $3,844.061 $8,124.810 $157,628.931 $28,056.078 $4,058.866 $33,429.907 $64,312.956 $23,491.735
2037 $3,954.850 $8,463.564 $163,469.412 $29,204.415 $4,177.447 $34,423.232 $66,737.671 $24,402.152
2038 $4,066.644 $8,811.704 $169,394.396 $30,376.858 $4,296.120 $35,418.614 $69,196.320 $25,326.812
2039 $4,179.310 $9,169.143 $175,397.557 $31,572.574 $4,414.699 $36,414.550 $71,685.995 $26,264.692
2040 $4,292.704 $9,535.764 $181,472.160 $32,790.642 $4,532.992 $37,409.490 $74,203.605 $27,214.693
*M illio ns o f 2005 D o llars
Historical and Projected Values for Real Gross Product by Detailed Industrial Classification
for Texas*

perrymangroup.com 118 © 2012 by The Perryman Group
Total
Finance, Credit Funds, Trusts,
Insurance, Total Monetary Inter- Securities, Insurance & Other
Other and Real Finance & Authorities mediation Commodity, Carriers Financial
Date Information Estate Insurance Central Bank & Related Investments & Related Vehicles
2001 $338.855 $140,301.033 $50,061.641 $213.263 $22,673.101 $7,912.727 $17,278.461 $1,984.089
2002 $327.312 $138,192.407 $52,389.851 $232.405 $25,215.773 $7,031.412 $17,460.485 $2,449.776
2003 $325.930 $139,934.131 $54,319.684 $223.654 $26,680.925 $6,961.904 $18,314.444 $2,138.757
2004 $405.369 $140,571.207 $52,431.358 $203.268 $25,339.916 $6,461.558 $17,738.826 $2,687.790
2005 $368.457 $145,852.279 $56,963.493 $215.414 $28,327.975 $7,180.922 $18,325.806 $2,913.376
2006 $511.370 $149,595.788 $60,403.356 $221.365 $27,770.450 $7,503.199 $21,229.659 $3,678.683
2007 $707.752 $158,527.138 $63,209.727 $242.778 $30,086.735 $6,518.684 $21,497.197 $4,864.333
2008 $784.352 $168,617.849 $68,424.075 $274.175 $34,035.050 $6,371.928 $22,416.266 $5,326.656
2009 $797.813 $169,428.155 $71,004.696 $290.423 $34,239.496 $6,381.317 $24,160.886 $5,932.574
2010 $798.760 $169,325.061 $68,039.528 $282.543 $32,687.074 $6,630.881 $23,002.599 $5,436.431
2011 $833.929 $172,396.654 $69,000.567 $291.553 $32,586.711 $6,878.153 $23,657.751 $5,586.398
2012 $882.885 $177,565.843 $70,785.125 $304.116 $32,855.898 $7,208.595 $24,614.617 $5,801.900
2013 $945.430 $184,868.186 $73,397.857 $320.421 $33,476.938 $7,627.856 $25,886.986 $6,085.655
2014 $1,016.785 $191,944.796 $75,896.303 $336.454 $34,007.834 $8,040.947 $27,150.313 $6,360.755
2015 $1,096.775 $198,854.389 $78,305.324 $352.296 $34,462.618 $8,449.556 $28,412.114 $6,628.741
2016 $1,179.995 $205,892.870 $80,742.468 $368.456 $34,894.587 $8,865.786 $29,714.444 $6,899.193
2017 $1,268.475 $213,056.469 $83,206.367 $384.927 $35,302.882 $9,289.362 $31,057.371 $7,171.825
2018 $1,362.458 $220,341.058 $85,695.582 $401.697 $35,686.688 $9,719.981 $32,440.879 $7,446.337
2019 $1,462.187 $227,742.155 $88,208.604 $418.757 $36,045.243 $10,157.316 $33,864.875 $7,722.413
2020 $1,567.914 $235,254.917 $90,743.847 $436.093 $36,377.836 $10,601.014 $35,329.174 $7,999.730
2021 $1,679.890 $242,874.144 $93,299.659 $453.694 $36,683.812 $11,050.695 $36,833.507 $8,277.949
2022 $1,798.368 $250,594.275 $95,874.311 $471.546 $36,962.574 $11,505.957 $38,377.511 $8,556.722
2023 $1,923.603 $258,409.394 $98,466.007 $489.633 $37,213.583 $11,966.371 $39,960.729 $8,835.691
2024 $2,055.853 $266,313.228 $101,072.881 $507.940 $37,436.362 $12,431.483 $41,582.608 $9,114.489
2025 $2,195.370 $274,299.154 $103,692.997 $526.450 $37,630.495 $12,900.819 $43,242.495 $9,392.738
2026 $2,342.410 $282,360.205 $106,324.324 $545.147 $37,795.609 $13,373.873 $44,939.643 $9,670.052
2027 $2,497.224 $290,489.071 $108,964.766 $564.011 $37,931.394 $13,850.121 $46,673.204 $9,946.035
2028 $2,660.061 $298,678.111 $111,612.161 $583.023 $38,037.607 $14,329.016 $48,442.226 $10,220.289
2029 $2,831.163 $306,919.359 $114,264.283 $602.164 $38,114.069 $14,809.992 $50,245.651 $10,492.408
2030 $3,010.771 $315,204.536 $116,918.843 $621.411 $38,160.667 $15,292.463 $52,082.317 $10,761.986
2031 $3,199.116 $323,525.059 $119,573.132 $640.738 $38,177.322 $15,775.552 $53,951.052 $11,028.469
2032 $3,396.421 $331,872.052 $122,224.377 $660.114 $38,164.026 $16,258.356 $55,850.580 $11,291.301
2033 $3,602.903 $340,236.361 $124,869.741 $679.510 $38,120.843 $16,739.941 $57,779.525 $11,549.922
2034 $3,818.765 $348,608.569 $127,506.334 $698.894 $38,047.905 $17,219.353 $59,736.410 $11,803.772
2035 $4,044.200 $356,979.010 $130,131.212 $718.235 $37,945.415 $17,695.617 $61,719.656 $12,052.289
2036 $4,279.389 $365,337.786 $132,741.377 $737.500 $37,813.640 $18,167.740 $63,727.580 $12,294.918
2037 $4,524.496 $373,674.785 $135,333.788 $756.654 $37,652.916 $18,634.713 $65,758.399 $12,531.106
2038 $4,779.672 $381,979.701 $137,905.368 $775.664 $37,463.644 $19,095.518 $67,810.234 $12,760.308
2039 $5,045.048 $390,242.049 $140,453.009 $794.495 $37,246.289 $19,549.131 $69,881.106 $12,981.988
2040 $5,320.738 $398,451.194 $142,973.580 $813.111 $37,001.379 $19,994.523 $71,968.944 $13,195.623
*M illio ns o f 2005 D o llars
Historical and Projected Values for Real Gross Product by Detailed Industrial Classification
for Texas*

perrymangroup.com 119 © 2012 by The Perryman Group
Real Estate, Rental Leasers of ProfessionalManagement of Administrative
Rental, Real & Leasing NonFinancial Total & Technical Companies & & Waste
Date & Leasing Estate Services Intangible Services Services Enterprises Services
2001 $90,239.392 $77,598.972 $9,124.487 $3,515.933 $192,477.969 $55,553.811 $11,051.307 $24,068.429
2002 $85,802.556 $72,215.473 $8,544.837 $5,042.246 $196,785.617 $54,917.958 $12,375.834 $24,030.593
2003 $85,614.447 $72,844.577 $8,650.222 $4,119.648 $202,848.428 $54,767.194 $14,421.568 $25,566.672
2004 $88,139.849 $75,943.844 $7,969.808 $4,226.197 $207,255.451 $58,493.001 $10,980.761 $26,753.617
2005 $88,888.786 $76,960.732 $8,898.200 $3,029.854 $218,266.578 $62,298.083 $13,322.722 $29,381.095
2006 $89,192.432 $72,149.588 $12,986.387 $4,056.457 $221,929.040 $65,847.614 $8,950.387 $30,506.707
2007 $95,317.411 $76,951.758 $13,192.212 $5,173.441 $232,485.456 $69,333.297 $10,228.232 $33,405.435
2008 $100,193.774 $81,366.841 $13,936.756 $4,890.177 $241,259.500 $73,777.048 $10,756.218 $34,812.424
2009 $98,423.459 $80,445.578 $13,293.763 $4,684.118 $234,209.123 $71,524.577 $10,662.025 $31,196.977
2010 $101,285.533 $82,323.112 $14,129.299 $4,833.122 $242,805.846 $74,442.193 $10,928.294 $35,323.756
2011 $103,396.087 $84,073.704 $14,444.077 $4,878.306 $255,779.021 $78,520.214 $11,567.064 $37,361.107
2012 $106,780.718 $86,861.884 $14,937.640 $4,981.194 $270,057.419 $83,009.788 $12,271.067 $39,603.698
2013 $111,470.329 $90,714.069 $15,615.036 $5,141.224 $284,807.566 $87,655.982 $13,003.155 $41,930.842
2014 $116,048.493 $94,478.385 $16,278.294 $5,291.814 $299,436.903 $92,276.794 $13,736.514 $44,255.511
2015 $120,549.064 $98,182.263 $16,932.072 $5,434.730 $314,444.673 $97,026.181 $14,494.139 $46,651.295
2016 $125,150.402 $101,970.920 $17,601.378 $5,578.105 $329,681.042 $101,858.358 $15,269.404 $49,096.238
2017 $129,850.102 $105,842.463 $18,285.895 $5,721.743 $345,340.709 $106,833.892 $16,071.589 $51,619.532
2018 $134,645.475 $109,794.768 $18,985.263 $5,865.444 $361,414.564 $111,950.533 $16,900.616 $54,220.203
2019 $139,533.551 $113,825.470 $19,699.079 $6,009.002 $377,891.907 $117,205.532 $17,756.333 $56,896.998
2020 $144,511.070 $117,931.968 $20,426.895 $6,152.206 $394,760.422 $122,595.630 $18,638.503 $59,648.373
2021 $149,574.485 $122,111.420 $21,168.220 $6,294.845 $412,006.140 $128,117.039 $19,546.805 $62,472.485
2022 $154,719.964 $126,360.746 $21,922.519 $6,436.700 $429,613.422 $133,765.439 $20,480.828 $65,367.187
2023 $159,943.386 $130,676.622 $22,689.212 $6,577.553 $447,564.947 $139,535.967 $21,440.071 $68,330.018
2024 $165,240.346 $135,055.489 $23,467.674 $6,717.182 $465,841.698 $145,423.212 $22,423.939 $71,358.201
2025 $170,606.158 $139,493.552 $24,257.240 $6,855.365 $484,422.966 $151,421.212 $23,431.741 $74,448.638
2026 $176,035.881 $143,986.801 $25,057.201 $6,991.879 $503,286.358 $157,523.447 $24,462.689 $77,597.914
2027 $181,524.305 $148,530.997 $25,866.807 $7,126.501 $522,407.814 $163,722.845 $25,515.897 $80,802.289
2028 $187,065.949 $153,121.676 $26,685.266 $7,259.006 $541,761.626 $170,011.788 $26,590.376 $84,057.702
2029 $192,655.076 $157,754.155 $27,511.746 $7,389.175 $561,320.477 $176,382.116 $27,685.039 $87,359.773
2030 $198,285.693 $162,423.535 $28,345.373 $7,516.784 $581,055.480 $182,825.140 $28,798.698 $90,703.807
2031 $203,951.927 $167,125.008 $29,185.288 $7,641.631 $600,936.229 $189,331.640 $29,930.054 $94,084.807
2032 $209,647.675 $171,853.572 $30,030.593 $7,763.510 $620,930.859 $195,891.891 $31,077.709 $97,497.473
2033 $215,366.620 $176,604.039 $30,880.359 $7,882.222 $641,006.112 $202,495.681 $32,240.164 $100,936.216
2034 $221,102.235 $181,371.045 $31,733.619 $7,997.570 $661,127.417 $209,132.333 $33,415.822 $104,395.170
2035 $226,847.798 $186,149.057 $32,589.378 $8,109.362 $681,258.973 $215,790.725 $34,602.989 $107,868.200
2036 $232,596.409 $190,932.393 $33,446.608 $8,217.408 $701,363.843 $222,459.266 $35,799.883 $111,348.932
2037 $238,340.997 $195,715.223 $34,304.251 $8,321.523 $721,404.058 $229,125.971 $37,004.631 $114,830.762
2038 $244,074.333 $200,491.579 $35,161.224 $8,421.530 $741,340.727 $235,778.494 $38,215.276 $118,306.868
2039 $249,789.040 $205,255.366 $36,016.419 $8,517.256 $761,134.150 $242,404.162 $39,429.776 $121,770.237
2040 $255,477.614 $210,000.376 $36,868.704 $8,608.533 $780,743.949 $248,990.013 $40,646.016 $125,213.682
*M illio ns o f 2005 D o llars
Historical and Projected Values for Real Gross Product by Detailed Industrial Classification
for Texas*

perrymangroup.com 120 © 2012 by The Perryman Group
Waste
Management
Administrative & Reme- Health Care Ambulatory Nursing &
& Support diation Educational & Social Health Care Residential Social
Date Services Services Services Assistance Services Hospitals Care Facilities Assistance
2001 $22,147.465 $1,920.964 $5,048.655 $48,597.646 $27,155.853 $14,002.390 $4,195.542 $3,243.861
2002 $21,969.357 $2,061.236 $5,210.586 $51,669.144 $28,845.211 $15,156.060 $4,291.998 $3,375.875
2003 $23,423.115 $2,143.557 $5,167.673 $53,322.551 $30,111.468 $15,393.825 $4,387.915 $3,429.343
2004 $24,450.498 $2,303.119 $5,298.057 $56,019.554 $30,943.000 $17,129.817 $4,433.142 $3,513.595
2005 $26,954.014 $2,427.081 $5,165.867 $57,176.439 $33,065.592 $16,011.188 $4,390.929 $3,708.730
2006 $27,863.659 $2,643.048 $5,378.214 $54,792.192 $30,450.228 $16,383.094 $4,492.722 $3,466.148
2007 $30,567.684 $2,837.751 $5,461.105 $56,378.410 $31,262.056 $16,836.630 $4,587.680 $3,692.044
2008 $31,831.483 $2,980.941 $5,621.363 $59,789.565 $33,426.325 $17,855.283 $4,737.502 $3,770.455
2009 $28,548.922 $2,648.055 $5,593.627 $62,240.712 $34,977.097 $18,487.768 $4,881.876 $3,893.971
2010 $32,302.631 $3,021.125 $5,792.092 $60,063.230 $33,580.080 $18,055.201 $4,742.226 $3,685.724
2011 $34,167.659 $3,193.448 $6,173.280 $63,222.296 $35,345.532 $19,065.222 $4,982.191 $3,829.350
2012 $36,220.618 $3,383.080 $6,594.131 $66,700.561 $37,289.207 $20,177.529 $5,246.203 $3,987.622
2013 $38,351.160 $3,579.682 $7,035.241 $70,291.853 $39,295.812 $21,330.417 $5,517.916 $4,147.707
2014 $40,479.698 $3,775.813 $7,482.286 $73,850.047 $41,283.635 $22,479.676 $5,785.814 $4,300.922
2015 $42,673.549 $3,977.746 $7,947.859 $77,498.518 $43,321.624 $23,662.832 $6,059.541 $4,454.521
2016 $44,912.643 $4,183.595 $8,428.535 $81,200.437 $45,389.167 $24,868.806 $6,336.166 $4,606.298
2017 $47,223.695 $4,395.837 $8,929.626 $85,003.883 $47,513.115 $26,112.463 $6,619.392 $4,758.913
2018 $49,605.831 $4,614.372 $9,451.345 $88,906.683 $49,692.228 $27,393.361 $6,908.984 $4,912.109
2019 $52,057.919 $4,839.079 $9,993.853 $92,906.289 $51,925.055 $28,710.931 $7,204.681 $5,065.622
2020 $54,578.563 $5,069.810 $10,557.260 $96,999.768 $54,209.929 $30,064.472 $7,506.193 $5,219.175
2021 $57,166.092 $5,306.393 $11,141.617 $101,183.797 $56,544.965 $31,453.149 $7,813.199 $5,372.484
2022 $59,818.556 $5,548.631 $11,746.918 $105,454.654 $58,928.058 $32,875.986 $8,125.352 $5,525.259
2023 $62,533.718 $5,796.300 $12,373.091 $109,808.219 $61,356.878 $34,331.869 $8,442.274 $5,677.198
2024 $65,309.051 $6,049.149 $13,019.998 $114,239.967 $63,828.870 $35,819.538 $8,763.561 $5,827.998
2025 $68,141.737 $6,306.901 $13,687.430 $118,744.971 $66,341.256 $37,337.590 $9,088.779 $5,977.347
2026 $71,028.662 $6,569.253 $14,375.108 $123,317.905 $68,891.035 $38,884.473 $9,417.466 $6,124.930
2027 $73,966.416 $6,835.873 $15,082.676 $127,953.046 $71,474.985 $40,458.492 $9,749.137 $6,270.431
2028 $76,951.296 $7,106.406 $15,809.702 $132,644.279 $74,089.667 $42,057.805 $10,083.277 $6,413.530
2029 $79,979.306 $7,380.467 $16,555.673 $137,385.101 $76,731.426 $43,680.422 $10,419.348 $6,553.905
2030 $83,046.158 $7,657.650 $17,319.995 $142,168.633 $79,396.399 $45,324.211 $10,756.788 $6,691.236
2031 $86,147.288 $7,937.519 $18,101.990 $146,987.640 $82,080.525 $46,986.899 $11,095.012 $6,825.204
2032 $89,277.854 $8,219.619 $18,900.899 $151,834.532 $84,779.549 $48,666.076 $11,433.414 $6,955.494
2033 $92,432.750 $8,503.467 $19,715.876 $156,701.389 $87,489.029 $50,359.197 $11,771.370 $7,081.793
2034 $95,606.610 $8,788.560 $20,545.990 $161,579.970 $90,204.351 $52,063.587 $12,108.237 $7,203.794
2035 $98,793.825 $9,074.375 $21,390.224 $166,461.737 $92,920.735 $53,776.447 $12,443.357 $7,321.197
2036 $101,988.564 $9,360.369 $22,247.481 $171,337.905 $95,633.271 $55,494.866 $12,776.059 $7,433.709
2037 $105,184.781 $9,645.981 $23,116.579 $176,199.444 $98,336.912 $57,215.825 $13,105.659 $7,541.048
2038 $108,376.234 $9,930.635 $23,996.253 $181,037.094 $101,026.489 $58,936.198 $13,431.467 $7,642.940
2039 $111,556.499 $10,213.738 $24,885.159 $185,841.405 $103,696.728 $60,652.770 $13,752.783 $7,739.123
2040 $114,718.995 $10,494.688 $25,781.875 $190,602.756 $106,342.266 $62,362.238 $14,068.904 $7,829.348
*M illio ns o f 2005 D o llars
Historical and Projected Values for Real Gross Product by Detailed Industrial Classification
for Texas*
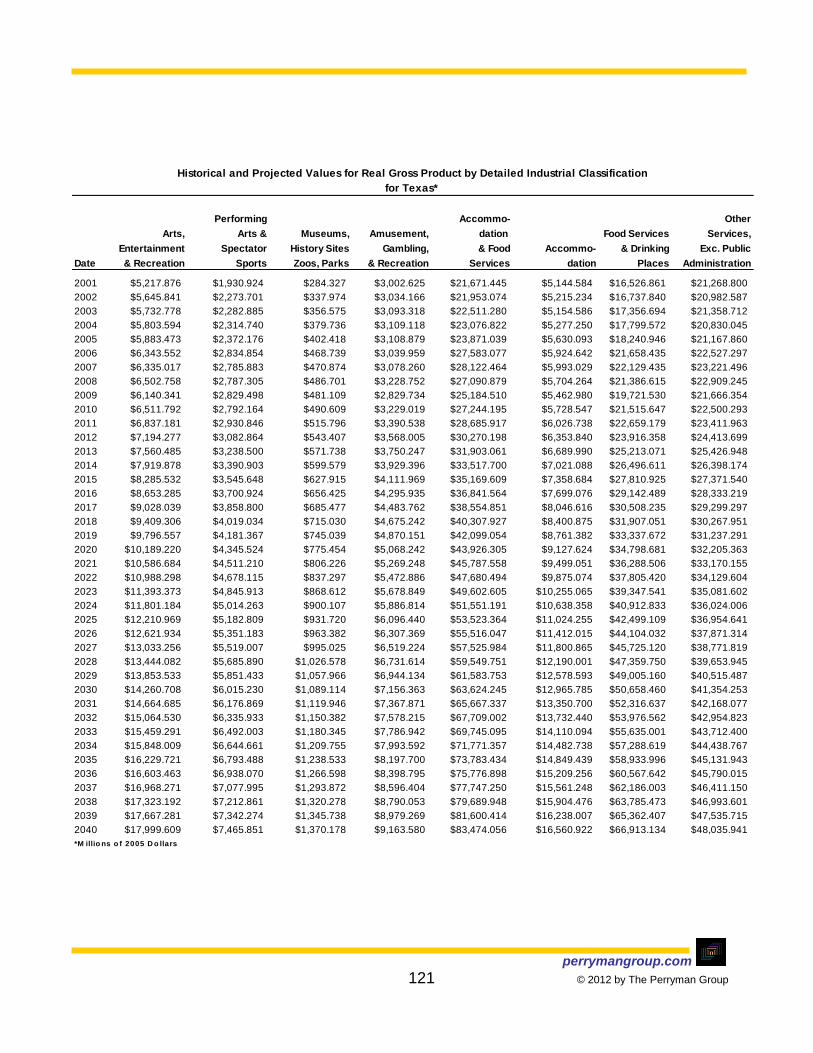
perrymangroup.com 121 © 2012 by The Perryman Group
Performing Accommo- Other
Arts, Arts & Museums, Amusement, dation Food Services Services,
Entertainment Spectator History Sites Gambling, & Food Accommo- & Drinking Exc. Public
Date & Recreation Sports Zoos, Parks & Recreation Services dation Places Administration
2001 $5,217.876 $1,930.924 $284.327 $3,002.625 $21,671.445 $5,144.584 $16,526.861 $21,268.800
2002 $5,645.841 $2,273.701 $337.974 $3,034.166 $21,953.074 $5,215.234 $16,737.840 $20,982.587
2003 $5,732.778 $2,282.885 $356.575 $3,093.318 $22,511.280 $5,154.586 $17,356.694 $21,358.712
2004 $5,803.594 $2,314.740 $379.736 $3,109.118 $23,076.822 $5,277.250 $17,799.572 $20,830.045
2005 $5,883.473 $2,372.176 $402.418 $3,108.879 $23,871.039 $5,630.093 $18,240.946 $21,167.860
2006 $6,343.552 $2,834.854 $468.739 $3,039.959 $27,583.077 $5,924.642 $21,658.435 $22,527.297
2007 $6,335.017 $2,785.883 $470.874 $3,078.260 $28,122.464 $5,993.029 $22,129.435 $23,221.496
2008 $6,502.758 $2,787.305 $486.701 $3,228.752 $27,090.879 $5,704.264 $21,386.615 $22,909.245
2009 $6,140.341 $2,829.498 $481.109 $2,829.734 $25,184.510 $5,462.980 $19,721.530 $21,666.354
2010 $6,511.792 $2,792.164 $490.609 $3,229.019 $27,244.195 $5,728.547 $21,515.647 $22,500.293
2011 $6,837.181 $2,930.846 $515.796 $3,390.538 $28,685.917 $6,026.738 $22,659.179 $23,411.963
2012 $7,194.277 $3,082.864 $543.407 $3,568.005 $30,270.198 $6,353.840 $23,916.358 $24,413.699
2013 $7,560.485 $3,238.500 $571.738 $3,750.247 $31,903.061 $6,689.990 $25,213.071 $25,426.948
2014 $7,919.878 $3,390.903 $599.579 $3,929.396 $33,517.700 $7,021.088 $26,496.611 $26,398.174
2015 $8,285.532 $3,545.648 $627.915 $4,111.969 $35,169.609 $7,358.684 $27,810.925 $27,371.540
2016 $8,653.285 $3,700.924 $656.425 $4,295.935 $36,841.564 $7,699.076 $29,142.489 $28,333.219
2017 $9,028.039 $3,858.800 $685.477 $4,483.762 $38,554.851 $8,046.616 $30,508.235 $29,299.297
2018 $9,409.306 $4,019.034 $715.030 $4,675.242 $40,307.927 $8,400.875 $31,907.051 $30,267.951
2019 $9,796.557 $4,181.367 $745.039 $4,870.151 $42,099.054 $8,761.382 $33,337.672 $31,237.291
2020 $10,189.220 $4,345.524 $775.454 $5,068.242 $43,926.305 $9,127.624 $34,798.681 $32,205.363
2021 $10,586.684 $4,511.210 $806.226 $5,269.248 $45,787.558 $9,499.051 $36,288.506 $33,170.155
2022 $10,988.298 $4,678.115 $837.297 $5,472.886 $47,680.494 $9,875.074 $37,805.420 $34,129.604
2023 $11,393.373 $4,845.913 $868.612 $5,678.849 $49,602.605 $10,255.065 $39,347.541 $35,081.602
2024 $11,801.184 $5,014.263 $900.107 $5,886.814 $51,551.191 $10,638.358 $40,912.833 $36,024.006
2025 $12,210.969 $5,182.809 $931.720 $6,096.440 $53,523.364 $11,024.255 $42,499.109 $36,954.641
2026 $12,621.934 $5,351.183 $963.382 $6,307.369 $55,516.047 $11,412.015 $44,104.032 $37,871.314
2027 $13,033.256 $5,519.007 $995.025 $6,519.224 $57,525.984 $11,800.865 $45,725.120 $38,771.819
2028 $13,444.082 $5,685.890 $1,026.578 $6,731.614 $59,549.751 $12,190.001 $47,359.750 $39,653.945
2029 $13,853.533 $5,851.433 $1,057.966 $6,944.134 $61,583.753 $12,578.593 $49,005.160 $40,515.487
2030 $14,260.708 $6,015.230 $1,089.114 $7,156.363 $63,624.245 $12,965.785 $50,658.460 $41,354.253
2031 $14,664.685 $6,176.869 $1,119.946 $7,367.871 $65,667.337 $13,350.700 $52,316.637 $42,168.077
2032 $15,064.530 $6,335.933 $1,150.382 $7,578.215 $67,709.002 $13,732.440 $53,976.562 $42,954.823
2033 $15,459.291 $6,492.003 $1,180.345 $7,786.942 $69,745.095 $14,110.094 $55,635.001 $43,712.400
2034 $15,848.009 $6,644.661 $1,209.755 $7,993.592 $71,771.357 $14,482.738 $57,288.619 $44,438.767
2035 $16,229.721 $6,793.488 $1,238.533 $8,197.700 $73,783.434 $14,849.439 $58,933.996 $45,131.943
2036 $16,603.463 $6,938.070 $1,266.598 $8,398.795 $75,776.898 $15,209.256 $60,567.642 $45,790.015
2037 $16,968.271 $7,077.995 $1,293.872 $8,596.404 $77,747.250 $15,561.248 $62,186.003 $46,411.150
2038 $17,323.192 $7,212.861 $1,320.278 $8,790.053 $79,689.948 $15,904.476 $63,785.473 $46,993.601
2039 $17,667.281 $7,342.274 $1,345.738 $8,979.269 $81,600.414 $16,238.007 $65,362.407 $47,535.715
2040 $17,999.609 $7,465.851 $1,370.178 $9,163.580 $83,474.056 $16,560.922 $66,913.134 $48,035.941
*M illio ns o f 2005 D o llars
Historical and Projected Values for Real Gross Product by Detailed Industrial Classification
for Texas*
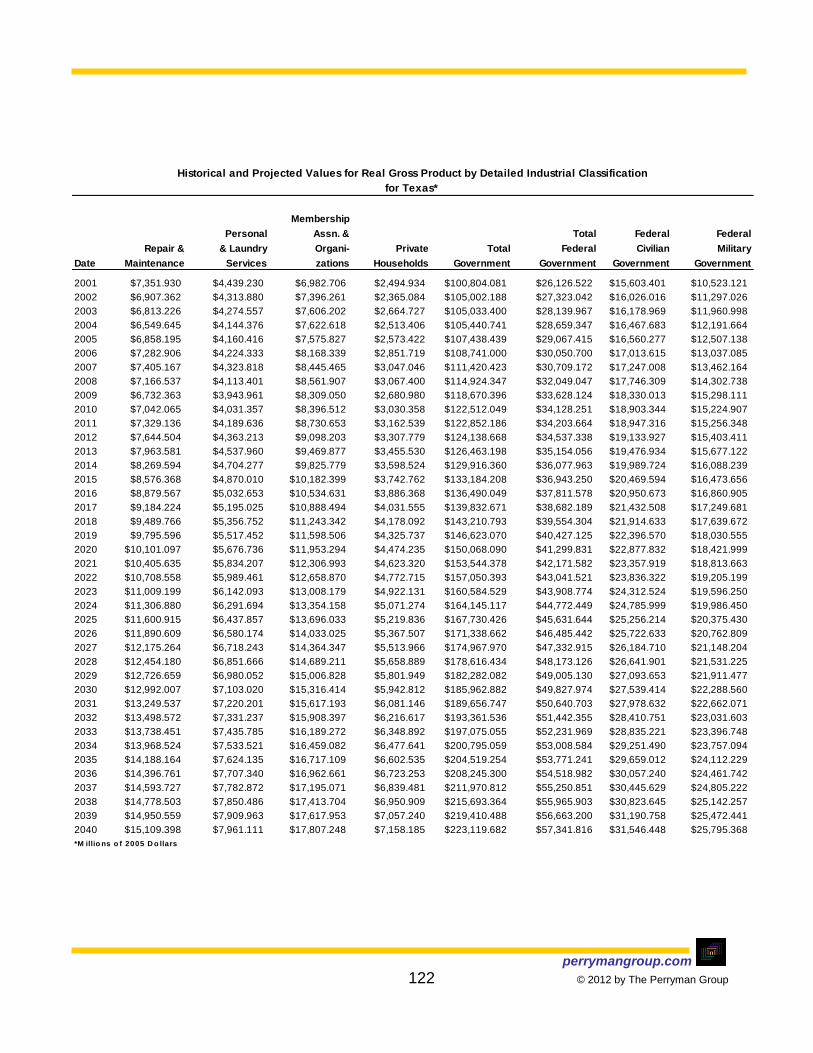
perrymangroup.com 122 © 2012 by The Perryman Group
Membership
Personal Assn. & Total Federal Federal
Repair & & Laundry Organi- Private Total Federal Civilian Military
Date Maintenance Services zations Households Government Government Government Government
2001 $7,351.930 $4,439.230 $6,982.706 $2,494.934 $100,804.081 $26,126.522 $15,603.401 $10,523.121
2002 $6,907.362 $4,313.880 $7,396.261 $2,365.084 $105,002.188 $27,323.042 $16,026.016 $11,297.026
2003 $6,813.226 $4,274.557 $7,606.202 $2,664.727 $105,033.400 $28,139.967 $16,178.969 $11,960.998
2004 $6,549.645 $4,144.376 $7,622.618 $2,513.406 $105,440.741 $28,659.347 $16,467.683 $12,191.664
2005 $6,858.195 $4,160.416 $7,575.827 $2,573.422 $107,438.439 $29,067.415 $16,560.277 $12,507.138
2006 $7,282.906 $4,224.333 $8,168.339 $2,851.719 $108,741.000 $30,050.700 $17,013.615 $13,037.085
2007 $7,405.167 $4,323.818 $8,445.465 $3,047.046 $111,420.423 $30,709.172 $17,247.008 $13,462.164
2008 $7,166.537 $4,113.401 $8,561.907 $3,067.400 $114,924.347 $32,049.047 $17,746.309 $14,302.738
2009 $6,732.363 $3,943.961 $8,309.050 $2,680.980 $118,670.396 $33,628.124 $18,330.013 $15,298.111
2010 $7,042.065 $4,031.357 $8,396.512 $3,030.358 $122,512.049 $34,128.251 $18,903.344 $15,224.907
2011 $7,329.136 $4,189.636 $8,730.653 $3,162.539 $122,852.186 $34,203.664 $18,947.316 $15,256.348
2012 $7,644.504 $4,363.213 $9,098.203 $3,307.779 $124,138.668 $34,537.338 $19,133.927 $15,403.411
2013 $7,963.581 $4,537.960 $9,469.877 $3,455.530 $126,463.198 $35,154.056 $19,476.934 $15,677.122
2014 $8,269.594 $4,704.277 $9,825.779 $3,598.524 $129,916.360 $36,077.963 $19,989.724 $16,088.239
2015 $8,576.368 $4,870.010 $10,182.399 $3,742.762 $133,184.208 $36,943.250 $20,469.594 $16,473.656
2016 $8,879.567 $5,032.653 $10,534.631 $3,886.368 $136,490.049 $37,811.578 $20,950.673 $16,860.905
2017 $9,184.224 $5,195.025 $10,888.494 $4,031.555 $139,832.671 $38,682.189 $21,432.508 $17,249.681
2018 $9,489.766 $5,356.752 $11,243.342 $4,178.092 $143,210.793 $39,554.304 $21,914.633 $17,639.672
2019 $9,795.596 $5,517.452 $11,598.506 $4,325.737 $146,623.070 $40,427.125 $22,396.570 $18,030.555
2020 $10,101.097 $5,676.736 $11,953.294 $4,474.235 $150,068.090 $41,299.831 $22,877.832 $18,421.999
2021 $10,405.635 $5,834.207 $12,306.993 $4,623.320 $153,544.378 $42,171.582 $23,357.919 $18,813.663
2022 $10,708.558 $5,989.461 $12,658.870 $4,772.715 $157,050.393 $43,041.521 $23,836.322 $19,205.199
2023 $11,009.199 $6,142.093 $13,008.179 $4,922.131 $160,584.529 $43,908.774 $24,312.524 $19,596.250
2024 $11,306.880 $6,291.694 $13,354.158 $5,071.274 $164,145.117 $44,772.449 $24,785.999 $19,986.450
2025 $11,600.915 $6,437.857 $13,696.033 $5,219.836 $167,730.426 $45,631.644 $25,256.214 $20,375.430
2026 $11,890.609 $6,580.174 $14,033.025 $5,367.507 $171,338.662 $46,485.442 $25,722.633 $20,762.809
2027 $12,175.264 $6,718.243 $14,364.347 $5,513.966 $174,967.970 $47,332.915 $26,184.710 $21,148.204
2028 $12,454.180 $6,851.666 $14,689.211 $5,658.889 $178,616.434 $48,173.126 $26,641.901 $21,531.225
2029 $12,726.659 $6,980.052 $15,006.828 $5,801.949 $182,282.082 $49,005.130 $27,093.653 $21,911.477
2030 $12,992.007 $7,103.020 $15,316.414 $5,942.812 $185,962.882 $49,827.974 $27,539.414 $22,288.560
2031 $13,249.537 $7,220.201 $15,617.193 $6,081.146 $189,656.747 $50,640.703 $27,978.632 $22,662.071
2032 $13,498.572 $7,331.237 $15,908.397 $6,216.617 $193,361.536 $51,442.355 $28,410.751 $23,031.603
2033 $13,738.451 $7,435.785 $16,189.272 $6,348.892 $197,075.055 $52,231.969 $28,835.221 $23,396.748
2034 $13,968.524 $7,533.521 $16,459.082 $6,477.641 $200,795.059 $53,008.584 $29,251.490 $23,757.094
2035 $14,188.164 $7,624.135 $16,717.109 $6,602.535 $204,519.254 $53,771.241 $29,659.012 $24,112.229
2036 $14,396.761 $7,707.340 $16,962.661 $6,723.253 $208,245.300 $54,518.982 $30,057.240 $24,461.742
2037 $14,593.727 $7,782.872 $17,195.071 $6,839.481 $211,970.812 $55,250.851 $30,445.629 $24,805.222
2038 $14,778.503 $7,850.486 $17,413.704 $6,950.909 $215,693.364 $55,965.903 $30,823.645 $25,142.257
2039 $14,950.559 $7,909.963 $17,617.953 $7,057.240 $219,410.488 $56,663.200 $31,190.758 $25,472.441
2040 $15,109.398 $7,961.111 $17,807.248 $7,158.185 $223,119.682 $57,341.816 $31,546.448 $25,795.368
*M illio ns o f 2005 D o llars
for Texas*
Historical and Projected Values for Real Gross Product by Detailed Industrial Classification
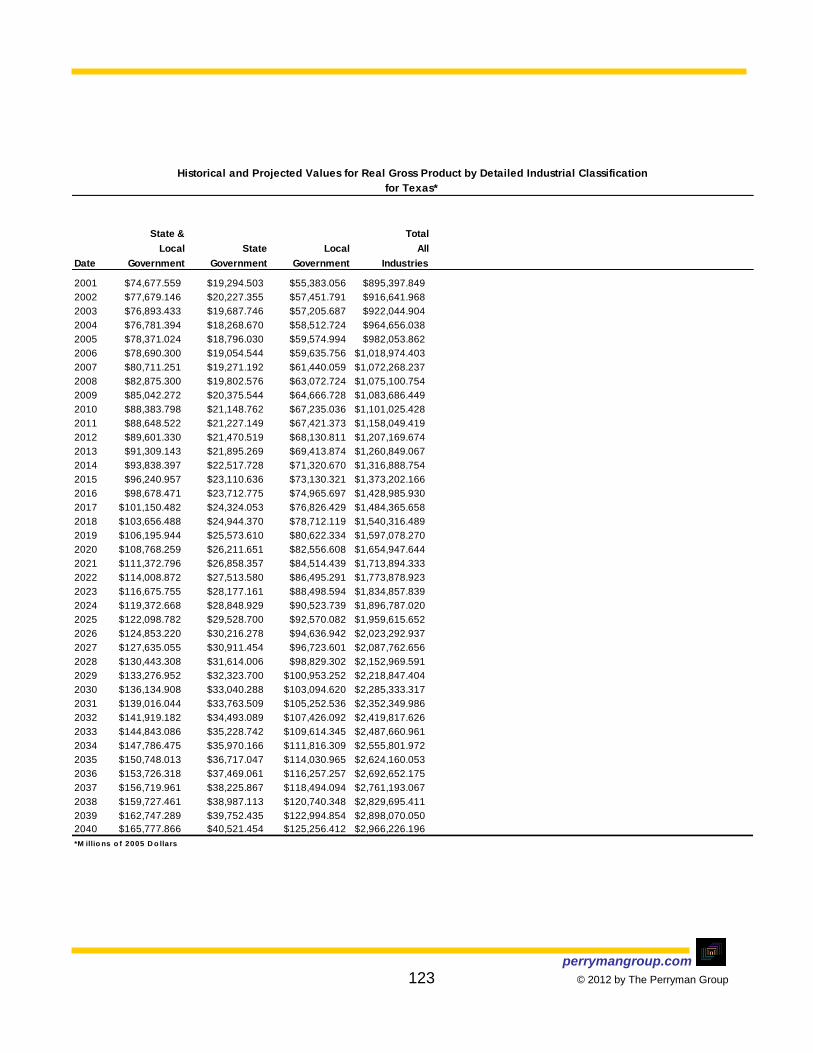
perrymangroup.com 123 © 2012 by The Perryman Group
State & Total
Local State Local All
Date Government Government Government Industries
2001 $74,677.559 $19,294.503 $55,383.056 $895,397.849
2002 $77,679.146 $20,227.355 $57,451.791 $916,641.968
2003 $76,893.433 $19,687.746 $57,205.687 $922,044.904
2004 $76,781.394 $18,268.670 $58,512.724 $964,656.038
2005 $78,371.024 $18,796.030 $59,574.994 $982,053.862
2006 $78,690.300 $19,054.544 $59,635.756 $1,018,974.403
2007 $80,711.251 $19,271.192 $61,440.059 $1,072,268.237
2008 $82,875.300 $19,802.576 $63,072.724 $1,075,100.754
2009 $85,042.272 $20,375.544 $64,666.728 $1,083,686.449
2010 $88,383.798 $21,148.762 $67,235.036 $1,101,025.428
2011 $88,648.522 $21,227.149 $67,421.373 $1,158,049.419
2012 $89,601.330 $21,470.519 $68,130.811 $1,207,169.674
2013 $91,309.143 $21,895.269 $69,413.874 $1,260,849.067
2014 $93,838.397 $22,517.728 $71,320.670 $1,316,888.754
2015 $96,240.957 $23,110.636 $73,130.321 $1,373,202.166
2016 $98,678.471 $23,712.775 $74,965.697 $1,428,985.930
2017 $101,150.482 $24,324.053 $76,826.429 $1,484,365.658
2018 $103,656.488 $24,944.370 $78,712.119 $1,540,316.489
2019 $106,195.944 $25,573.610 $80,622.334 $1,597,078.270
2020 $108,768.259 $26,211.651 $82,556.608 $1,654,947.644
2021 $111,372.796 $26,858.357 $84,514.439 $1,713,894.333
2022 $114,008.872 $27,513.580 $86,495.291 $1,773,878.923
2023 $116,675.755 $28,177.161 $88,498.594 $1,834,857.839
2024 $119,372.668 $28,848.929 $90,523.739 $1,896,787.020
2025 $122,098.782 $29,528.700 $92,570.082 $1,959,615.652
2026 $124,853.220 $30,216.278 $94,636.942 $2,023,292.937
2027 $127,635.055 $30,911.454 $96,723.601 $2,087,762.656
2028 $130,443.308 $31,614.006 $98,829.302 $2,152,969.591
2029 $133,276.952 $32,323.700 $100,953.252 $2,218,847.404
2030 $136,134.908 $33,040.288 $103,094.620 $2,285,333.317
2031 $139,016.044 $33,763.509 $105,252.536 $2,352,349.986
2032 $141,919.182 $34,493.089 $107,426.092 $2,419,817.626
2033 $144,843.086 $35,228.742 $109,614.345 $2,487,660.961
2034 $147,786.475 $35,970.166 $111,816.309 $2,555,801.972
2035 $150,748.013 $36,717.047 $114,030.965 $2,624,160.053
2036 $153,726.318 $37,469.061 $116,257.257 $2,692,652.175
2037 $156,719.961 $38,225.867 $118,494.094 $2,761,193.067
2038 $159,727.461 $38,987.113 $120,740.348 $2,829,695.411
2039 $162,747.289 $39,752.435 $122,994.854 $2,898,070.050
2040 $165,777.866 $40,521.454 $125,256.412 $2,966,226.196
*M illio ns o f 2005 D o llars
for Texas*
Historical and Projected Values for Real Gross Product by Detailed Industrial Classification

perrymangroup.com 124 © 2012 by The Perryman Group
Forestry,
Fishing, Fishing, Agriculture
Total Related, Forestry & Hunting, & Forestry Total Oil & Gas
Date Agriculture Farm Other Logging Trapping Support Mining Extraction
2001 88.456 59.135 29.321 2.672 1.771 24.878 150.359 64.450
2002 79.365 49.973 29.392 2.627 1.729 25.036 143.405 64.157
2003 75.860 46.905 28.955 2.470 1.633 24.852 144.234 62.961
2004 71.492 42.602 28.890 2.415 1.657 24.818 151.657 64.054
2005 76.168 46.382 29.786 2.383 1.614 25.789 162.851 66.331
2006 68.028 39.303 28.725 2.230 1.618 24.877 183.999 70.732
2007 71.908 43.404 28.504 2.132 1.619 24.753 204.434 75.766
2008 70.531 42.587 27.944 2.179 1.609 24.156 227.661 83.085
2009 75.821 49.666 26.155 2.027 1.662 22.466 202.053 85.500
2010 75.471 45.006 30.465 2.326 1.715 26.424 206.533 82.074
2011 73.651 43.647 30.004 2.266 1.670 26.068 237.271 89.444
2012 74.035 43.600 30.435 2.275 1.675 26.486 244.891 96.144
2013 74.204 43.425 30.779 2.276 1.674 26.828 249.166 101.407
2014 74.355 43.239 31.115 2.276 1.674 27.165 253.266 105.262
2015 74.489 43.044 31.445 2.276 1.672 27.497 257.478 108.309
2016 74.605 42.838 31.767 2.275 1.670 27.822 260.020 110.125
2017 74.704 42.622 32.082 2.273 1.667 28.142 261.585 111.208
2018 74.785 42.396 32.389 2.270 1.664 28.455 262.987 112.036
2019 74.849 42.161 32.688 2.266 1.660 28.761 264.226 112.689
2020 74.895 41.916 32.979 2.262 1.656 29.061 265.297 113.212
2021 74.923 41.662 33.261 2.257 1.651 29.353 266.200 113.633
2022 74.933 41.398 33.535 2.251 1.645 29.638 266.932 113.966
2023 74.926 41.126 33.800 2.244 1.639 29.916 267.492 114.220
2024 74.901 40.845 34.056 2.237 1.633 30.186 267.879 114.400
2025 74.858 40.555 34.303 2.229 1.626 30.448 268.092 114.509
2026 74.798 40.257 34.540 2.220 1.618 30.702 268.131 114.549
2027 74.720 39.951 34.769 2.211 1.610 30.948 267.995 114.521
2028 74.624 39.637 34.987 2.200 1.601 31.185 267.685 114.426
2029 74.511 39.315 35.196 2.189 1.592 31.414 267.202 114.264
2030 74.380 38.986 35.394 2.178 1.583 31.634 266.547 114.037
2031 74.232 38.642 35.590 2.166 1.573 31.851 265.720 113.712
2032 74.067 38.292 35.775 2.153 1.563 32.059 264.723 113.323
2033 73.885 37.935 35.949 2.140 1.552 32.257 263.559 112.872
2034 73.685 37.572 36.113 2.127 1.541 32.446 262.229 112.358
2035 73.469 37.202 36.266 2.112 1.529 32.625 260.736 111.783
2036 73.236 36.827 36.409 2.097 1.517 32.794 259.083 111.147
2037 72.986 36.446 36.540 2.082 1.505 32.953 257.273 110.451
2038 72.721 36.060 36.660 2.066 1.492 33.103 255.310 109.696
2039 72.438 35.669 36.770 2.049 1.479 33.242 253.197 108.885
2040 72.140 35.273 36.868 2.032 1.466 33.370 250.938 108.017
*T ho usands o f P erso ns
Historical and Projected Values for Wage and Salary Employment by Detailed Industrial Classification
for Texas*

perrymangroup.com 125 © 2012 by The Perryman Group
Mining Support Heavy & Specialty
(Except Activities for Total Construction Civil Eng. Trade Total
Date Oil & Gas) Mining Utilities Construction of Buildings Construction Contractors Manufacturing
2001 9.663 76.246 50.800 602.431 152.637 105.296 344.498 1,030.760
2002 9.767 69.481 51.593 591.981 153.069 102.579 336.333 950.966
2003 9.923 71.350 48.440 576.754 147.321 99.984 329.449 902.925
2004 10.138 77.465 47.251 570.308 138.509 103.497 328.302 891.705
2005 9.434 87.086 45.842 590.088 142.476 109.984 337.628 902.404
2006 9.869 103.398 44.559 630.584 153.999 119.885 356.700 929.803
2007 10.371 118.297 45.605 673.014 160.706 132.078 380.230 934.915
2008 11.013 133.563 47.530 700.670 165.756 138.866 396.048 925.162
2009 9.833 106.720 47.959 625.701 146.478 120.038 359.185 839.083
2010 9.448 115.012 44.093 595.740 140.728 117.309 337.703 811.831
2011 11.200 136.626 44.692 625.002 149.180 122.333 353.489 827.363
2012 11.248 137.499 45.709 643.922 157.644 124.677 361.602 838.576
2013 11.150 136.609 47.165 661.128 165.089 126.832 369.207 851.592
2014 11.144 136.860 48.792 676.033 171.379 128.686 375.968 862.559
2015 11.206 137.964 50.252 688.632 176.599 130.219 381.814 872.278
2016 11.233 138.662 51.116 699.379 180.950 131.497 386.932 880.991
2017 11.241 139.136 51.601 708.887 184.668 132.617 391.601 888.904
2018 11.255 139.696 52.000 717.449 187.898 133.619 395.932 895.265
2019 11.268 140.268 52.370 724.402 190.518 134.367 399.517 901.343
2020 11.277 140.807 52.708 731.308 192.983 135.142 403.184 907.340
2021 11.280 141.287 53.013 738.167 195.327 135.934 406.906 913.254
2022 11.276 141.690 53.282 744.974 197.577 136.735 410.662 919.083
2023 11.264 142.009 53.515 751.728 199.753 137.541 414.434 924.823
2024 11.243 142.236 53.709 758.426 201.870 138.347 418.210 930.473
2025 11.214 142.369 53.863 765.066 203.937 139.150 421.979 936.031
2026 11.176 142.406 53.975 771.644 205.963 139.947 425.734 941.495
2027 11.129 142.345 54.043 778.158 207.953 140.736 429.469 946.861
2028 11.074 142.186 54.067 784.606 209.911 141.517 433.178 952.130
2029 11.010 141.928 54.046 790.985 211.841 142.288 436.856 957.297
2030 10.937 141.573 53.977 797.293 213.744 143.047 440.502 962.361
2031 10.864 141.144 54.024 803.527 215.639 143.769 444.119 967.321
2032 10.783 140.616 54.028 809.684 217.509 144.478 447.698 972.173
2033 10.694 139.993 53.987 815.763 219.353 145.174 451.236 976.917
2034 10.597 139.274 53.900 821.760 221.173 145.856 454.731 981.549
2035 10.492 138.461 53.766 827.673 222.968 146.525 458.180 986.070
2036 10.380 137.556 53.585 833.499 224.737 147.179 461.583 990.475
2037 10.261 136.562 53.358 839.237 226.481 147.818 464.938 994.764
2038 10.134 135.479 53.085 844.884 228.199 148.443 468.242 998.935
2039 10.002 134.310 52.766 850.438 229.890 149.053 471.495 1,002.987
2040 9.863 133.058 52.403 855.895 231.554 149.647 474.694 1,006.916
*T ho usands o f P erso ns
Historical and Projected Values for Wage and Salary Employment by Detailed Industrial Classification
for Texas*
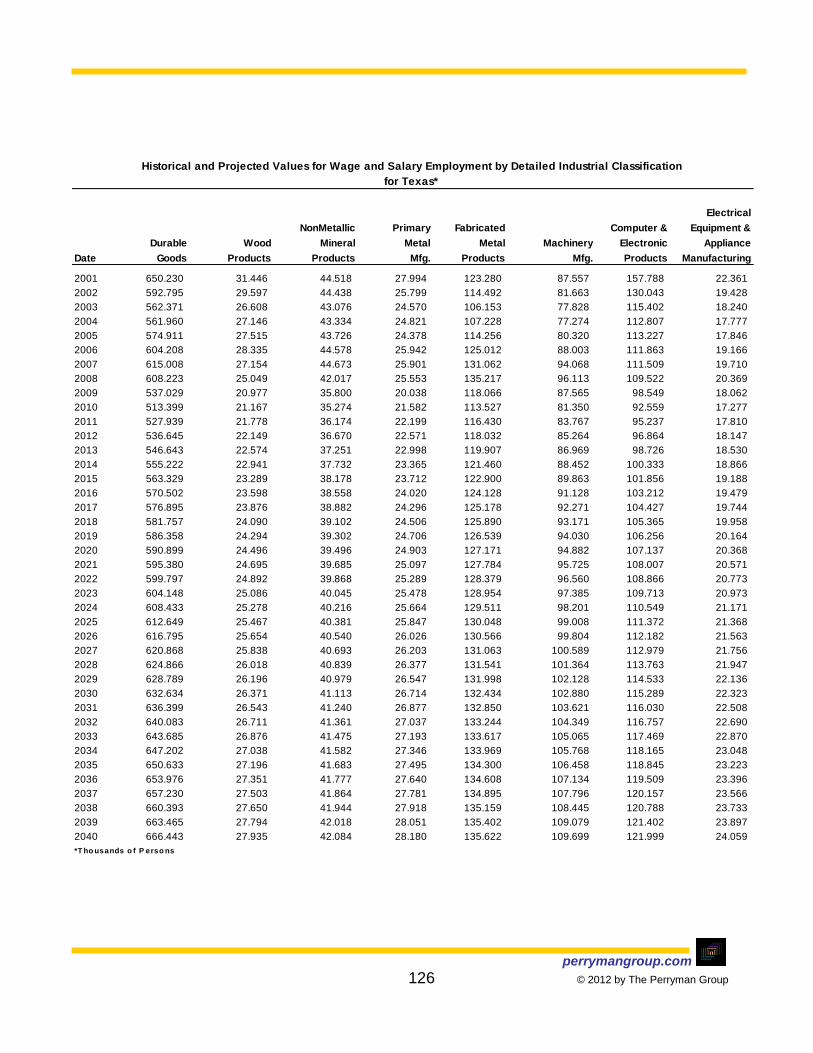
perrymangroup.com 126 © 2012 by The Perryman Group
Electrical
NonMetallic Primary Fabricated Computer & Equipment &
Durable Wood Mineral Metal Metal Machinery Electronic Appliance
Date Goods Products Products Mfg. Products Mfg. Products Manufacturing
2001 650.230 31.446 44.518 27.994 123.280 87.557 157.788 22.361
2002 592.795 29.597 44.438 25.799 114.492 81.663 130.043 19.428
2003 562.371 26.608 43.076 24.570 106.153 77.828 115.402 18.240
2004 561.960 27.146 43.334 24.821 107.228 77.274 112.807 17.777
2005 574.911 27.515 43.726 24.378 114.256 80.320 113.227 17.846
2006 604.208 28.335 44.578 25.942 125.012 88.003 111.863 19.166
2007 615.008 27.154 44.673 25.901 131.062 94.068 111.509 19.710
2008 608.223 25.049 42.017 25.553 135.217 96.113 109.522 20.369
2009 537.029 20.977 35.800 20.038 118.066 87.565 98.549 18.062
2010 513.399 21.167 35.274 21.582 113.527 81.350 92.559 17.277
2011 527.939 21.778 36.174 22.199 116.430 83.767 95.237 17.810
2012 536.645 22.149 36.670 22.571 118.032 85.264 96.864 18.147
2013 546.643 22.574 37.251 22.998 119.907 86.969 98.726 18.530
2014 555.222 22.941 37.732 23.365 121.460 88.452 100.333 18.866
2015 563.329 23.289 38.178 23.712 122.900 89.863 101.856 19.188
2016 570.502 23.598 38.558 24.020 124.128 91.128 103.212 19.479
2017 576.895 23.876 38.882 24.296 125.178 92.271 104.427 19.744
2018 581.757 24.090 39.102 24.506 125.890 93.171 105.365 19.958
2019 586.358 24.294 39.302 24.706 126.539 94.030 106.256 20.164
2020 590.899 24.496 39.496 24.903 127.171 94.882 107.137 20.368
2021 595.380 24.695 39.685 25.097 127.784 95.725 108.007 20.571
2022 599.797 24.892 39.868 25.289 128.379 96.560 108.866 20.773
2023 604.148 25.086 40.045 25.478 128.954 97.385 109.713 20.973
2024 608.433 25.278 40.216 25.664 129.511 98.201 110.549 21.171
2025 612.649 25.467 40.381 25.847 130.048 99.008 111.372 21.368
2026 616.795 25.654 40.540 26.026 130.566 99.804 112.182 21.563
2027 620.868 25.838 40.693 26.203 131.063 100.589 112.979 21.756
2028 624.866 26.018 40.839 26.377 131.541 101.364 113.763 21.947
2029 628.789 26.196 40.979 26.547 131.998 102.128 114.533 22.136
2030 632.634 26.371 41.113 26.714 132.434 102.880 115.289 22.323
2031 636.399 26.543 41.240 26.877 132.850 103.621 116.030 22.508
2032 640.083 26.711 41.361 27.037 133.244 104.349 116.757 22.690
2033 643.685 26.876 41.475 27.193 133.617 105.065 117.469 22.870
2034 647.202 27.038 41.582 27.346 133.969 105.768 118.165 23.048
2035 650.633 27.196 41.683 27.495 134.300 106.458 118.845 23.223
2036 653.976 27.351 41.777 27.640 134.608 107.134 119.509 23.396
2037 657.230 27.503 41.864 27.781 134.895 107.796 120.157 23.566
2038 660.393 27.650 41.944 27.918 135.159 108.445 120.788 23.733
2039 663.465 27.794 42.018 28.051 135.402 109.079 121.402 23.897
2040 666.443 27.935 42.084 28.180 135.622 109.699 121.999 24.059
*T ho usands o f P erso ns
Historical and Projected Values for Wage and Salary Employment by Detailed Industrial Classification
for Texas*

perrymangroup.com 127 © 2012 by The Perryman Group
Transportation
Motor Equipment, Furniture Beverage &
Vehicle Excl. Motor & Related Misc. NonDurable Food Tobacco Textile
Date Manufacturing Vehicles Mfg. Mfg. Goods Mfg. Products Mills
2001 32.457 52.098 33.627 37.104 380.530 93.492 11.392 3.533
2002 31.050 49.322 31.498 35.465 358.171 93.440 11.053 3.340
2003 29.851 55.317 30.669 34.657 340.554 91.408 10.820 3.450
2004 30.760 55.239 31.052 34.522 329.745 89.902 10.262 3.346
2005 31.575 57.424 31.364 33.280 327.493 91.559 10.532 3.271
2006 35.212 59.992 33.056 33.049 325.595 91.550 11.114 3.166
2007 36.998 60.287 31.718 31.928 319.907 88.202 11.303 3.094
2008 34.237 60.558 28.988 30.600 316.939 88.020 11.506 3.118
2009 28.232 56.864 24.646 28.230 302.054 88.343 11.350 2.579
2010 29.068 51.430 24.596 25.569 298.432 82.937 10.859 2.899
2011 29.979 53.047 25.358 26.160 299.424 83.240 10.907 2.891
2012 30.562 54.086 25.842 26.457 301.932 83.962 11.010 2.896
2013 31.221 55.261 26.391 26.813 304.949 84.825 11.131 2.906
2014 31.803 56.299 26.874 27.095 307.337 85.512 11.229 2.910
2015 32.361 57.293 27.337 27.351 308.949 85.983 11.298 2.907
2016 32.867 58.198 27.755 27.558 310.489 86.432 11.364 2.902
2017 33.331 59.027 28.138 27.725 312.009 86.874 11.429 2.897
2018 33.709 59.704 28.447 27.816 313.508 87.309 11.493 2.892
2019 34.073 60.356 28.745 27.893 314.985 87.737 11.556 2.886
2020 34.435 61.006 29.041 27.965 316.441 88.158 11.618 2.880
2021 34.795 61.652 29.335 28.033 317.875 88.572 11.679 2.874
2022 35.153 62.295 29.627 28.096 319.286 88.978 11.738 2.867
2023 35.508 62.934 29.917 28.155 320.674 89.376 11.797 2.860
2024 35.862 63.568 30.205 28.209 322.040 89.767 11.854 2.853
2025 36.212 64.198 30.490 28.258 323.382 90.150 11.910 2.845
2026 36.560 64.824 30.773 28.303 324.700 90.525 11.965 2.837
2027 36.906 65.445 31.053 28.343 325.994 90.893 12.018 2.828
2028 37.248 66.060 31.331 28.378 327.263 91.252 12.070 2.820
2029 37.587 66.671 31.606 28.409 328.508 91.603 12.121 2.811
2030 37.923 67.275 31.877 28.435 329.727 91.946 12.171 2.801
2031 38.255 67.874 32.146 28.456 330.921 92.281 12.219 2.792
2032 38.584 68.466 32.412 28.472 332.090 92.609 12.267 2.782
2033 38.909 69.053 32.674 28.484 333.232 92.928 12.313 2.771
2034 39.230 69.632 32.933 28.491 334.348 93.238 12.357 2.761
2035 39.547 70.205 33.189 28.493 335.437 93.540 12.401 2.750
2036 39.860 70.770 33.441 28.490 336.499 93.833 12.443 2.739
2037 40.169 71.328 33.689 28.482 337.534 94.117 12.483 2.728
2038 40.474 71.878 33.933 28.470 338.542 94.392 12.523 2.716
2039 40.774 72.421 34.173 28.453 339.522 94.659 12.561 2.704
2040 41.069 72.955 34.409 28.431 340.474 94.916 12.597 2.692
*T ho usands o f P erso ns
for Texas*
Historical and Projected Values for Wage and Salary Employment by Detailed Industrial Classification

perrymangroup.com 128 © 2012 by The Perryman Group
Textile Leather & Paper Printing Petroleum Chemical Plastics &
Product Apparel Allied Manu- & Related & Coal Manu- Rubber
Date Mills Manufacturing Products facturing Support Products facturing Products
2001 9.144 26.980 5.496 26.564 44.452 23.667 83.802 52.008
2002 8.444 20.910 4.815 25.126 40.824 23.229 78.855 48.135
2003 8.243 14.816 4.509 23.879 38.513 22.852 76.301 45.763
2004 8.184 11.360 4.324 22.392 37.336 22.914 74.405 45.320
2005 8.053 9.484 4.408 21.697 36.171 22.882 73.306 46.130
2006 7.982 7.981 4.374 20.657 35.249 23.554 73.234 46.734
2007 7.984 6.315 4.425 20.149 34.541 24.415 74.402 45.077
2008 7.101 5.612 4.122 19.326 33.106 25.382 76.004 43.642
2009 6.189 5.038 3.992 18.025 29.675 25.207 72.861 38.795
2010 6.637 5.152 3.718 17.606 31.260 24.002 72.156 41.204
2011 6.637 5.104 3.652 17.374 31.406 24.132 72.689 41.394
2012 6.671 5.082 3.604 17.231 31.710 24.383 73.592 41.792
2013 6.717 5.068 3.562 17.116 32.067 24.676 74.622 42.260
2014 6.750 5.042 3.513 16.964 32.357 24.917 75.502 42.640
2015 6.767 5.004 3.456 16.770 32.564 25.096 76.193 42.912
2016 6.783 4.964 3.399 16.573 32.764 25.268 76.868 43.172
2017 6.800 4.924 3.342 16.377 32.960 25.438 77.538 43.429
2018 6.818 4.884 3.286 16.180 33.153 25.606 78.205 43.681
2019 6.836 4.844 3.230 15.984 33.344 25.772 78.867 43.929
2020 6.855 4.803 3.175 15.789 33.531 25.935 79.524 44.173
2021 6.875 4.762 3.120 15.593 33.714 26.096 80.177 44.413
2022 6.895 4.721 3.066 15.399 33.895 26.255 80.825 44.648
2023 6.916 4.679 3.012 15.204 34.072 26.412 81.467 44.879
2024 6.937 4.638 2.959 15.011 34.245 26.566 82.105 45.105
2025 6.959 4.596 2.907 14.818 34.416 26.718 82.737 45.327
2026 6.982 4.554 2.855 14.625 34.582 26.867 83.364 45.544
2027 7.006 4.512 2.804 14.433 34.746 27.014 83.985 45.756
2028 7.030 4.469 2.753 14.242 34.905 27.158 84.600 45.964
2029 7.055 4.427 2.703 14.052 35.061 27.299 85.209 46.167
2030 7.080 4.384 2.654 13.863 35.214 27.438 85.811 46.366
2031 7.099 4.341 2.605 13.675 35.364 27.575 86.410 46.560
2032 7.119 4.298 2.557 13.487 35.510 27.709 87.002 46.750
2033 7.140 4.255 2.509 13.301 35.652 27.841 87.588 46.935
2034 7.161 4.212 2.462 13.116 35.790 27.969 88.167 47.114
2035 7.182 4.169 2.415 12.931 35.925 28.095 88.739 47.289
2036 7.205 4.126 2.369 12.748 36.056 28.218 89.303 47.459
2037 7.228 4.083 2.324 12.566 36.182 28.338 89.861 47.623
2038 7.252 4.040 2.279 12.385 36.305 28.456 90.411 47.782
2039 7.277 3.997 2.235 12.205 36.424 28.570 90.954 47.936
2040 7.303 3.953 2.192 12.026 36.540 28.681 91.489 48.085
*T ho usands o f P erso ns
for Texas*
Historical and Projected Values for Wage and Salary Employment by Detailed Industrial Classification
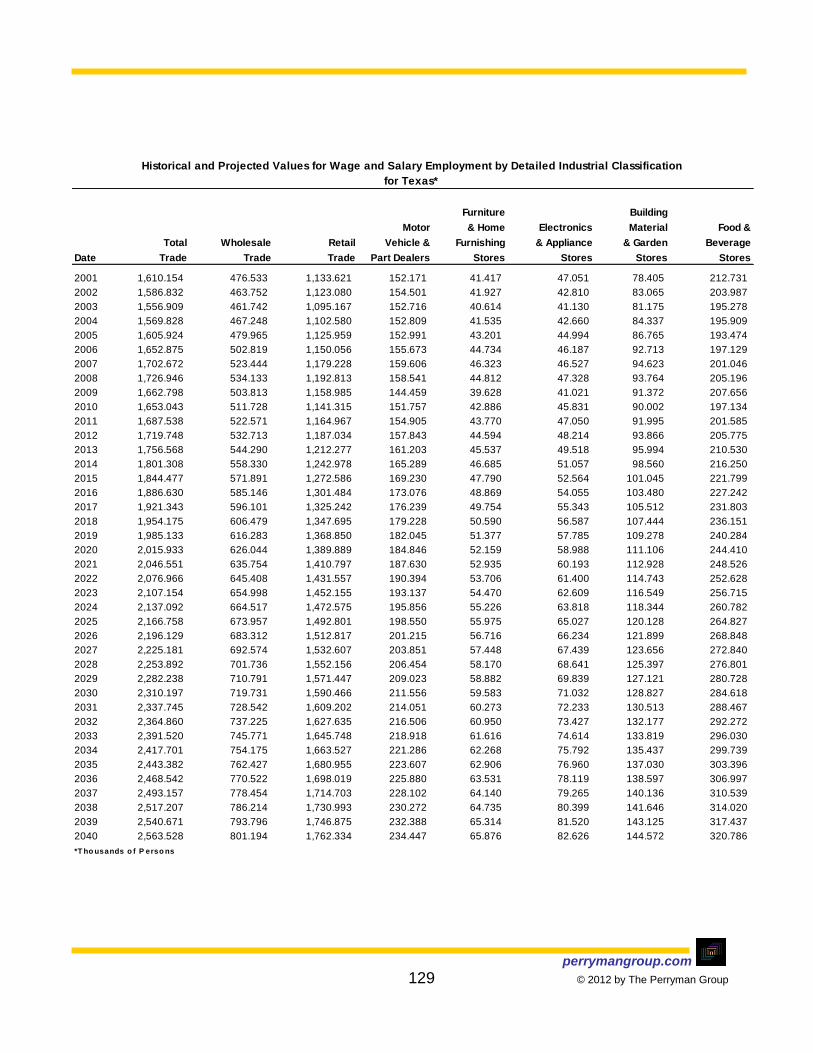
perrymangroup.com 129 © 2012 by The Perryman Group
Furniture Building
Motor & Home Electronics Material Food &
Total Wholesale Retail Vehicle & Furnishing & Appliance & Garden Beverage
Date Trade Trade Trade Part Dealers Stores Stores Stores Stores
2001 1,610.154 476.533 1,133.621 152.171 41.417 47.051 78.405 212.731
2002 1,586.832 463.752 1,123.080 154.501 41.927 42.810 83.065 203.987
2003 1,556.909 461.742 1,095.167 152.716 40.614 41.130 81.175 195.278
2004 1,569.828 467.248 1,102.580 152.809 41.535 42.660 84.337 195.909
2005 1,605.924 479.965 1,125.959 152.991 43.201 44.994 86.765 193.474
2006 1,652.875 502.819 1,150.056 155.673 44.734 46.187 92.713 197.129
2007 1,702.672 523.444 1,179.228 159.606 46.323 46.527 94.623 201.046
2008 1,726.946 534.133 1,192.813 158.541 44.812 47.328 93.764 205.196
2009 1,662.798 503.813 1,158.985 144.459 39.628 41.021 91.372 207.656
2010 1,653.043 511.728 1,141.315 151.757 42.886 45.831 90.002 197.134
2011 1,687.538 522.571 1,164.967 154.905 43.770 47.050 91.995 201.585
2012 1,719.748 532.713 1,187.034 157.843 44.594 48.214 93.866 205.775
2013 1,756.568 544.290 1,212.277 161.203 45.537 49.518 95.994 210.530
2014 1,801.308 558.330 1,242.978 165.289 46.685 51.057 98.560 216.250
2015 1,844.477 571.891 1,272.586 169.230 47.790 52.564 101.045 221.799
2016 1,886.630 585.146 1,301.484 173.076 48.869 54.055 103.480 227.242
2017 1,921.343 596.101 1,325.242 176.239 49.754 55.343 105.512 231.803
2018 1,954.175 606.479 1,347.695 179.228 50.590 56.587 107.444 236.151
2019 1,985.133 616.283 1,368.850 182.045 51.377 57.785 109.278 240.284
2020 2,015.933 626.044 1,389.889 184.846 52.159 58.988 111.106 244.410
2021 2,046.551 635.754 1,410.797 187.630 52.935 60.193 112.928 248.526
2022 2,076.966 645.408 1,431.557 190.394 53.706 61.400 114.743 252.628
2023 2,107.154 654.998 1,452.155 193.137 54.470 62.609 116.549 256.715
2024 2,137.092 664.517 1,472.575 195.856 55.226 63.818 118.344 260.782
2025 2,166.758 673.957 1,492.801 198.550 55.975 65.027 120.128 264.827
2026 2,196.129 683.312 1,512.817 201.215 56.716 66.234 121.899 268.848
2027 2,225.181 692.574 1,532.607 203.851 57.448 67.439 123.656 272.840
2028 2,253.892 701.736 1,552.156 206.454 58.170 68.641 125.397 276.801
2029 2,282.238 710.791 1,571.447 209.023 58.882 69.839 127.121 280.728
2030 2,310.197 719.731 1,590.466 211.556 59.583 71.032 128.827 284.618
2031 2,337.745 728.542 1,609.202 214.051 60.273 72.233 130.513 288.467
2032 2,364.860 737.225 1,627.635 216.506 60.950 73.427 132.177 292.272
2033 2,391.520 745.771 1,645.748 218.918 61.616 74.614 133.819 296.030
2034 2,417.701 754.175 1,663.527 221.286 62.268 75.792 135.437 299.739
2035 2,443.382 762.427 1,680.955 223.607 62.906 76.960 137.030 303.396
2036 2,468.542 770.522 1,698.019 225.880 63.531 78.119 138.597 306.997
2037 2,493.157 778.454 1,714.703 228.102 64.140 79.265 140.136 310.539
2038 2,517.207 786.214 1,730.993 230.272 64.735 80.399 141.646 314.020
2039 2,540.671 793.796 1,746.875 232.388 65.314 81.520 143.125 317.437
2040 2,563.528 801.194 1,762.334 234.447 65.876 82.626 144.572 320.786
*T ho usands o f P erso ns
for Texas*
Historical and Projected Values for Wage and Salary Employment by Detailed Industrial Classification

perrymangroup.com 130 © 2012 by The Perryman Group
Sporting
Health & Clothing & Goods, General Misc.
Personal Care Gasoline Clothing Hobby, Merchandise Store NonStore Transportation
Date Stores Stations Accessories Book, Music Stores Retailers Retailers & Warehousing
2001 56.794 71.719 99.842 41.441 235.236 70.087 26.727 357.854
2002 57.260 70.804 98.020 39.993 239.195 66.887 24.631 344.987
2003 56.876 68.881 99.176 37.746 236.919 63.494 21.162 341.159
2004 57.466 69.804 100.956 35.771 236.599 63.401 21.333 355.736
2005 57.222 69.424 104.874 36.982 251.581 63.297 21.154 365.542
2006 58.994 68.478 112.152 37.542 252.945 62.652 20.857 381.071
2007 62.220 69.099 121.194 37.570 258.210 61.454 21.356 393.727
2008 64.515 70.031 118.579 38.299 267.599 62.326 21.823 399.305
2009 65.498 70.683 115.122 40.163 263.091 59.878 20.414 376.578
2010 61.494 67.098 112.260 36.528 255.549 59.766 21.009 372.429
2011 62.634 68.519 113.955 37.218 260.773 61.058 21.505 373.177
2012 63.685 69.849 115.473 37.854 265.637 62.269 21.975 375.915
2013 64.900 71.366 117.278 38.589 271.208 63.648 22.506 384.236
2014 66.401 73.206 119.583 39.494 277.996 65.317 23.142 392.140
2015 67.837 74.983 121.755 40.360 284.533 66.930 23.760 399.243
2016 69.228 76.719 123.831 41.201 290.907 68.508 24.368 406.405
2017 70.340 78.153 125.393 41.876 296.128 69.818 24.883 412.929
2018 71.377 79.511 126.810 42.507 301.052 71.061 25.376 419.020
2019 72.341 80.793 128.087 43.095 305.682 72.238 25.847 425.125
2020 73.293 82.070 129.333 43.676 310.281 73.409 26.317 431.242
2021 74.234 83.339 130.549 44.251 314.847 74.576 26.788 437.371
2022 75.163 84.600 131.734 44.818 319.377 75.736 27.259 443.509
2023 76.078 85.852 132.886 45.378 323.865 76.889 27.728 449.656
2024 76.979 87.094 134.004 45.931 328.309 78.035 28.197 455.809
2025 77.866 88.325 135.088 46.474 332.706 79.171 28.663 461.967
2026 78.737 89.545 136.136 47.009 337.052 80.298 29.129 468.129
2027 79.592 90.751 137.147 47.534 341.343 81.414 29.592 474.292
2028 80.430 91.944 138.121 48.050 345.576 82.519 30.052 480.455
2029 81.250 93.123 139.056 48.555 349.747 83.612 30.510 486.616
2030 82.051 94.285 139.952 49.050 353.853 84.691 30.965 492.772
2031 82.834 95.431 140.807 49.533 357.889 85.756 31.416 498.756
2032 83.596 96.558 141.621 50.005 361.852 86.806 31.863 504.726
2033 84.338 97.668 142.394 50.465 365.741 87.841 32.306 510.680
2034 85.058 98.758 143.124 50.912 369.550 88.858 32.745 516.614
2035 85.757 99.827 143.810 51.347 373.277 89.858 33.179 522.527
2036 86.434 100.875 144.453 51.768 376.919 90.840 33.607 528.415
2037 87.087 101.901 145.051 52.176 380.472 91.802 34.030 534.275
2038 87.717 102.904 145.605 52.570 383.934 92.745 34.447 540.103
2039 88.322 103.883 146.113 52.950 387.301 93.666 34.858 545.896
2040 88.903 104.837 146.575 53.314 390.570 94.566 35.262 551.648
*T ho usands o f P erso ns
for Texas*
Historical and Projected Values for Wage and Salary Employment by Detailed Industrial Classification
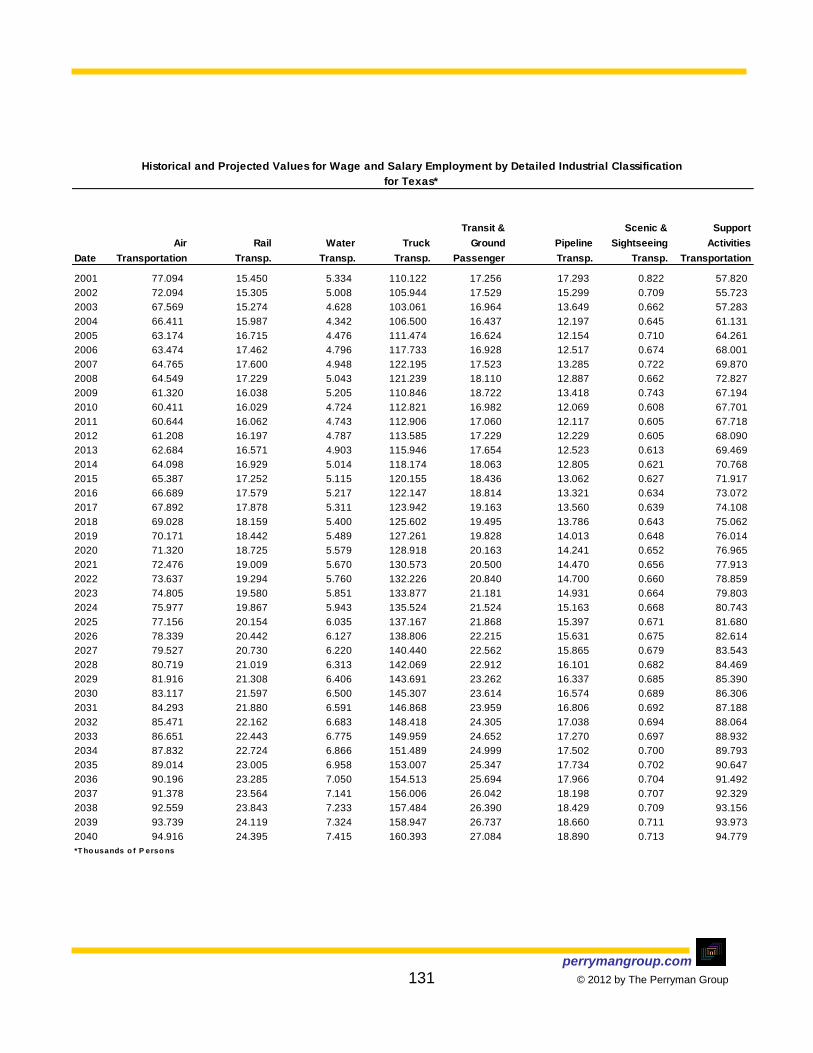
perrymangroup.com 131 © 2012 by The Perryman Group
Transit & Scenic & Support
Air Rail Water Truck Ground Pipeline Sightseeing Activities
Date Transportation Transp. Transp. Transp. Passenger Transp. Transp. Transportation
2001 77.094 15.450 5.334 110.122 17.256 17.293 0.822 57.820
2002 72.094 15.305 5.008 105.944 17.529 15.299 0.709 55.723
2003 67.569 15.274 4.628 103.061 16.964 13.649 0.662 57.283
2004 66.411 15.987 4.342 106.500 16.437 12.197 0.645 61.131
2005 63.174 16.715 4.476 111.474 16.624 12.154 0.710 64.261
2006 63.474 17.462 4.796 117.733 16.928 12.517 0.674 68.001
2007 64.765 17.600 4.948 122.195 17.523 13.285 0.722 69.870
2008 64.549 17.229 5.043 121.239 18.110 12.887 0.662 72.827
2009 61.320 16.038 5.205 110.846 18.722 13.418 0.743 67.194
2010 60.411 16.029 4.724 112.821 16.982 12.069 0.608 67.701
2011 60.644 16.062 4.743 112.906 17.060 12.117 0.605 67.718
2012 61.208 16.197 4.787 113.585 17.229 12.229 0.605 68.090
2013 62.684 16.571 4.903 115.946 17.654 12.523 0.613 69.469
2014 64.098 16.929 5.014 118.174 18.063 12.805 0.621 70.768
2015 65.387 17.252 5.115 120.155 18.436 13.062 0.627 71.917
2016 66.689 17.579 5.217 122.147 18.814 13.321 0.634 73.072
2017 67.892 17.878 5.311 123.942 19.163 13.560 0.639 74.108
2018 69.028 18.159 5.400 125.602 19.495 13.786 0.643 75.062
2019 70.171 18.442 5.489 127.261 19.828 14.013 0.648 76.014
2020 71.320 18.725 5.579 128.918 20.163 14.241 0.652 76.965
2021 72.476 19.009 5.670 130.573 20.500 14.470 0.656 77.913
2022 73.637 19.294 5.760 132.226 20.840 14.700 0.660 78.859
2023 74.805 19.580 5.851 133.877 21.181 14.931 0.664 79.803
2024 75.977 19.867 5.943 135.524 21.524 15.163 0.668 80.743
2025 77.156 20.154 6.035 137.167 21.868 15.397 0.671 81.680
2026 78.339 20.442 6.127 138.806 22.215 15.631 0.675 82.614
2027 79.527 20.730 6.220 140.440 22.562 15.865 0.679 83.543
2028 80.719 21.019 6.313 142.069 22.912 16.101 0.682 84.469
2029 81.916 21.308 6.406 143.691 23.262 16.337 0.685 85.390
2030 83.117 21.597 6.500 145.307 23.614 16.574 0.689 86.306
2031 84.293 21.880 6.591 146.868 23.959 16.806 0.692 87.188
2032 85.471 22.162 6.683 148.418 24.305 17.038 0.694 88.064
2033 86.651 22.443 6.775 149.959 24.652 17.270 0.697 88.932
2034 87.832 22.724 6.866 151.489 24.999 17.502 0.700 89.793
2035 89.014 23.005 6.958 153.007 25.347 17.734 0.702 90.647
2036 90.196 23.285 7.050 154.513 25.694 17.966 0.704 91.492
2037 91.378 23.564 7.141 156.006 26.042 18.198 0.707 92.329
2038 92.559 23.843 7.233 157.484 26.390 18.429 0.709 93.156
2039 93.739 24.119 7.324 158.947 26.737 18.660 0.711 93.973
2040 94.916 24.395 7.415 160.393 27.084 18.890 0.713 94.779
*T ho usands o f P erso ns
for Texas*
Historical and Projected Values for Wage and Salary Employment by Detailed Industrial Classification

perrymangroup.com 132 © 2012 by The Perryman Group
Motion
Publishing Picture Broad- ISPs, Search
Couriers & Warehousing Total Industries, & Sound casting, Telecommuni- Portals, Data
Date Messengers & Storage Information Exc. Internet Recording Exc. Internet cations Process
2001 36.783 19.880 270.150 55.928 17.410 25.221 126.273 42.895
2002 35.511 21.865 249.612 53.200 17.883 25.073 112.114 38.962
2003 36.455 25.614 236.485 50.682 18.140 25.287 102.021 36.757
2004 35.791 36.295 226.594 49.421 16.932 25.409 95.573 35.380
2005 37.107 38.847 223.480 49.629 16.733 25.873 92.307 35.085
2006 38.431 41.055 223.675 50.056 16.892 26.368 89.429 36.850
2007 38.976 43.843 222.003 49.238 16.456 26.574 95.356 29.866
2008 38.917 47.842 217.450 47.446 16.317 23.587 96.436 29.028
2009 35.926 47.166 205.688 43.497 16.499 22.167 92.642 26.393
2010 36.471 44.612 202.877 44.346 15.115 22.265 89.691 27.067
2011 36.628 44.692 202.075 44.212 14.998 22.300 89.194 26.961
2012 36.979 45.007 203.467 44.560 15.042 22.575 89.667 27.148
2013 37.881 45.990 206.990 45.376 15.243 23.085 91.080 27.620
2014 38.745 46.922 211.140 46.331 15.486 23.666 92.764 28.176
2015 39.534 47.758 216.100 47.466 15.786 24.339 94.802 28.841
2016 40.332 48.600 220.691 48.523 16.055 24.972 96.674 29.458
2017 41.069 49.365 225.284 49.583 16.321 25.606 98.543 30.076
2018 41.766 50.078 229.873 50.645 16.584 26.241 100.408 30.695
2019 42.468 50.792 234.455 51.708 16.842 26.874 102.267 31.314
2020 43.173 51.506 239.025 52.772 17.097 27.507 104.118 31.932
2021 43.882 52.222 243.580 53.834 17.347 28.137 105.960 32.549
2022 44.595 52.938 248.114 54.896 17.592 28.764 107.790 33.165
2023 45.311 53.654 252.624 55.955 17.832 29.387 109.608 33.779
2024 46.031 54.370 257.106 57.010 18.067 30.006 111.412 34.390
2025 46.754 55.086 261.554 58.062 18.297 30.619 113.199 34.998
2026 47.480 55.802 265.965 59.108 18.520 31.225 114.969 35.603
2027 48.208 56.517 270.335 60.148 18.738 31.824 116.719 36.203
2028 48.940 57.232 274.657 61.181 18.949 32.415 118.448 36.799
2029 49.674 57.945 278.929 62.206 19.153 32.997 120.154 37.389
2030 50.410 58.657 283.146 63.222 19.351 33.569 121.836 37.973
2031 51.132 59.348 287.302 64.226 19.544 34.158 123.469 38.544
2032 51.855 60.037 291.395 65.220 19.730 34.737 125.073 39.108
2033 52.578 60.723 295.418 66.201 19.908 35.305 126.647 39.664
2034 53.302 61.406 299.368 67.169 20.079 35.860 128.189 40.212
2035 54.027 62.085 303.240 68.123 20.241 36.401 129.698 40.751
2036 54.752 62.761 307.031 69.062 20.395 36.928 131.171 41.280
2037 55.476 63.433 310.735 69.985 20.541 37.440 132.607 41.800
2038 56.200 64.100 314.349 70.892 20.677 37.936 134.005 42.309
2039 56.923 64.762 317.867 71.780 20.805 38.416 135.363 42.806
2040 57.644 65.419 321.287 72.649 20.924 38.877 136.680 43.293
*T ho usands o f P erso ns
for Texas*
Historical and Projected Values for Wage and Salary Employment by Detailed Industrial Classification

perrymangroup.com 133 © 2012 by The Perryman Group
Total
Finance, Credit Funds, Trusts,
Insurance, Total Monetary Inter- Securities, Insurance & Other
Other and Real Finance & Authorities mediation Commodity, Carriers Financial
Date Information Estate Insurance Central Bank & Related Investments & Related Vehicles
2001 2.423 580.640 402.378 1.753 195.555 40.573 156.652 7.845
2002 2.380 585.350 408.142 1.901 201.559 39.250 157.207 8.225
2003 3.598 594.233 418.757 1.897 210.511 38.478 160.276 7.595
2004 3.879 602.745 425.971 1.738 218.145 38.690 159.384 8.014
2005 3.853 616.975 438.413 1.703 229.576 40.268 158.273 8.593
2006 4.080 639.770 457.311 1.895 241.557 42.776 162.619 8.464
2007 4.513 652.643 465.602 1.915 246.161 46.617 163.073 7.836
2008 4.636 659.094 467.833 1.863 242.021 49.593 166.216 8.140
2009 4.490 641.089 458.740 1.799 236.858 48.230 164.245 7.608
2010 4.393 635.547 450.208 1.816 230.801 48.591 161.111 7.889
2011 4.410 639.297 452.410 1.837 230.873 49.269 162.477 7.955
2012 4.475 648.134 458.206 1.872 232.759 50.348 165.142 8.085
2013 4.588 662.412 467.834 1.924 236.555 51.866 169.206 8.284
2014 4.717 673.729 475.356 1.967 239.245 53.170 172.528 8.446
2015 4.866 683.913 482.067 2.007 241.492 54.401 175.572 8.594
2016 5.009 694.030 488.718 2.048 243.678 55.641 178.608 8.742
2017 5.153 704.071 495.306 2.089 245.801 56.891 181.636 8.890
2018 5.300 714.029 501.824 2.130 247.858 58.148 184.652 9.037
2019 5.449 723.897 508.269 2.170 249.847 59.413 187.654 9.183
2020 5.600 733.667 514.634 2.211 251.767 60.686 190.641 9.329
2021 5.753 743.331 520.916 2.252 253.616 61.964 193.610 9.473
2022 5.907 752.882 527.109 2.293 255.392 63.248 196.558 9.617
2023 6.063 762.312 533.207 2.334 257.093 64.537 199.483 9.760
2024 6.221 771.614 539.207 2.375 258.718 65.829 202.384 9.901
2025 6.380 780.780 545.104 2.416 260.265 67.125 205.257 10.041
2026 6.541 789.802 550.891 2.457 261.732 68.423 208.100 10.179
2027 6.703 798.674 556.566 2.497 263.119 69.723 210.911 10.316
2028 6.866 807.387 562.123 2.538 264.423 71.023 213.688 10.451
2029 7.030 815.934 567.557 2.578 265.643 72.323 216.428 10.584
2030 7.196 824.309 572.863 2.618 266.779 73.621 219.129 10.716
2031 7.361 832.504 578.038 2.658 267.829 74.918 221.788 10.845
2032 7.526 840.512 583.077 2.697 268.792 76.212 224.404 10.972
2033 7.693 848.325 587.976 2.736 269.667 77.502 226.974 11.097
2034 7.860 855.938 592.729 2.775 270.454 78.786 229.495 11.220
2035 8.027 863.344 597.334 2.813 271.151 80.065 231.966 11.340
2036 8.194 870.535 601.787 2.851 271.757 81.338 234.383 11.457
2037 8.362 877.506 606.082 2.889 272.273 82.602 236.746 11.572
2038 8.529 884.250 610.217 2.926 272.697 83.858 239.052 11.684
2039 8.697 890.762 614.187 2.962 273.030 85.104 241.299 11.793
2040 8.864 897.034 617.990 2.998 273.270 86.340 243.484 11.899
*T ho usands o f P erso ns
for Texas*
Historical and Projected Values for Wage and Salary Employment by Detailed Industrial Classification

perrymangroup.com 134 © 2012 by The Perryman Group
Real Estate, Rental Leasers of ProfessionalManagement of Administrative
Rental, Real & Leasing NonFinancial Total & Technical Companies & & Waste
Date & Leasing Estate Services Intangible Services Services Enterprises Services
2001 178.262 115.753 60.391 2.118 3,451.571 480.595 35.637 586.827
2002 177.208 116.305 58.905 1.998 3,499.865 465.038 40.281 568.098
2003 175.476 115.480 58.125 1.871 3,538.544 459.838 41.277 557.954
2004 176.774 116.659 58.263 1.852 3,637.181 475.384 47.232 582.473
2005 178.562 117.913 58.670 1.979 3,754.906 500.700 53.284 615.405
2006 182.459 120.441 59.834 2.184 3,909.267 533.483 56.862 656.842
2007 187.041 123.868 60.946 2.227 4,072.356 566.421 67.858 679.395
2008 191.261 126.913 62.018 2.330 4,184.520 596.379 75.011 681.878
2009 182.349 125.114 54.989 2.246 4,141.351 570.725 76.461 621.388
2010 185.339 122.963 60.121 2.255 4,217.740 602.375 75.783 686.782
2011 186.887 123.980 60.634 2.273 4,355.045 622.615 78.338 708.843
2012 189.929 125.987 61.633 2.309 4,508.487 645.196 81.188 733.503
2013 194.578 129.061 63.154 2.364 4,663.143 667.988 84.066 758.332
2014 198.373 131.567 64.398 2.409 4,809.394 689.610 86.797 781.765
2015 201.847 133.860 65.538 2.449 4,955.558 711.253 89.531 805.154
2016 205.311 136.146 66.675 2.490 5,099.305 732.581 92.227 828.120
2017 208.765 138.425 67.810 2.530 5,243.714 754.035 94.939 851.163
2018 212.205 140.694 68.940 2.571 5,388.606 775.590 97.664 874.254
2019 215.628 142.952 70.065 2.611 5,533.799 797.218 100.400 897.361
2020 219.032 145.197 71.185 2.650 5,679.104 818.892 103.142 920.453
2021 222.415 147.427 72.298 2.690 5,824.328 840.583 105.886 943.499
2022 225.773 149.641 73.404 2.729 5,969.271 862.262 108.630 966.464
2023 229.105 151.836 74.501 2.768 6,113.730 883.898 111.370 989.317
2024 232.407 154.012 75.589 2.806 6,257.498 905.462 114.101 1,012.022
2025 235.676 156.166 76.667 2.844 6,400.364 926.922 116.819 1,034.545
2026 238.911 158.296 77.733 2.881 6,542.115 948.245 119.521 1,056.850
2027 242.108 160.401 78.788 2.918 6,682.534 969.400 122.202 1,078.904
2028 245.264 162.479 79.831 2.954 6,821.402 990.353 124.859 1,100.670
2029 248.378 164.528 80.859 2.990 6,958.500 1,011.072 127.486 1,122.112
2030 251.446 166.547 81.873 3.025 7,093.607 1,031.522 130.081 1,143.196
2031 254.466 168.533 82.872 3.060 7,226.501 1,051.710 132.636 1,163.869
2032 257.434 170.486 83.855 3.094 7,356.963 1,071.565 135.149 1,184.111
2033 260.350 172.402 84.820 3.127 7,484.772 1,091.052 137.617 1,203.887
2034 263.209 174.281 85.768 3.160 7,609.709 1,110.138 140.034 1,223.162
2035 266.009 176.121 86.696 3.192 7,731.558 1,128.791 142.397 1,241.902
2036 268.748 177.920 87.606 3.223 7,850.106 1,146.977 144.702 1,260.073
2037 271.424 179.677 88.494 3.253 7,965.142 1,164.663 146.944 1,277.642
2038 274.033 181.389 89.362 3.282 8,076.460 1,181.819 149.119 1,294.576
2039 276.574 183.056 90.207 3.311 8,183.857 1,198.412 151.224 1,310.844
2040 279.044 184.676 91.030 3.339 8,287.138 1,214.413 153.254 1,326.415
*T ho usands o f P erso ns
for Texas*
Historical and Projected Values for Wage and Salary Employment by Detailed Industrial Classification
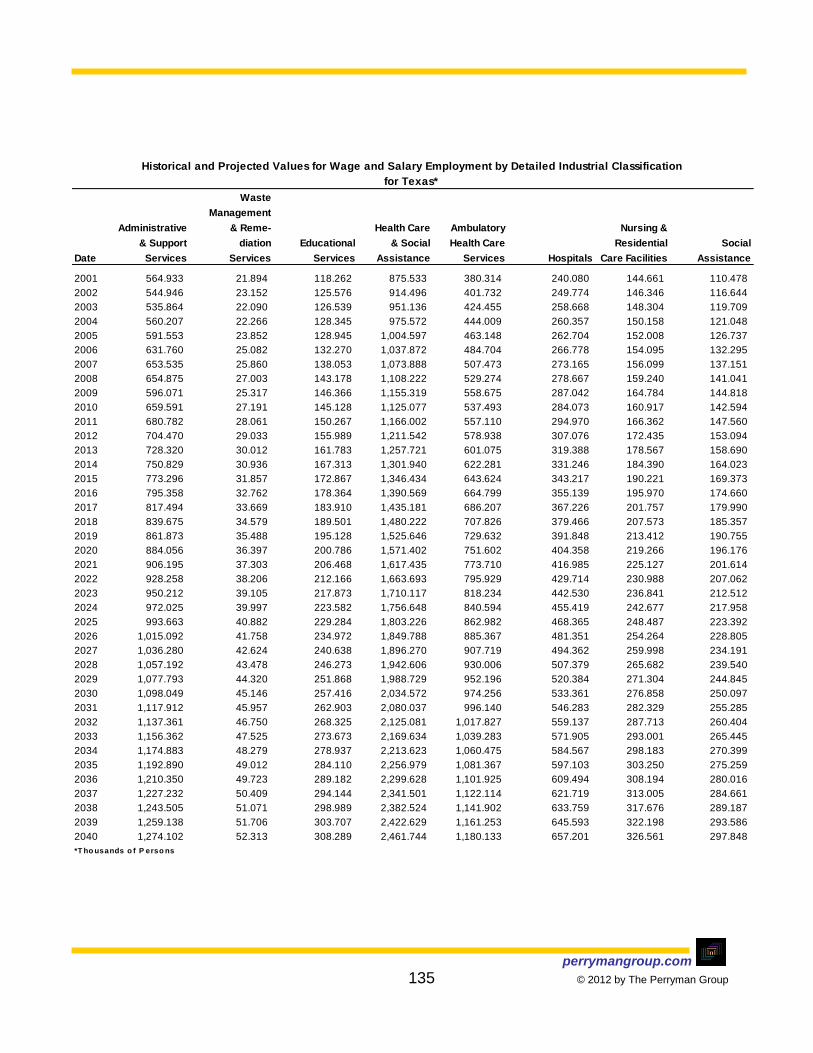
perrymangroup.com 135 © 2012 by The Perryman Group
Waste
Management
Administrative & Reme- Health Care Ambulatory Nursing &
& Support diation Educational & Social Health Care Residential Social
Date Services Services Services Assistance Services Hospitals Care Facilities Assistance
2001 564.933 21.894 118.262 875.533 380.314 240.080 144.661 110.478
2002 544.946 23.152 125.576 914.496 401.732 249.774 146.346 116.644
2003 535.864 22.090 126.539 951.136 424.455 258.668 148.304 119.709
2004 560.207 22.266 128.345 975.572 444.009 260.357 150.158 121.048
2005 591.553 23.852 128.945 1,004.597 463.148 262.704 152.008 126.737
2006 631.760 25.082 132.270 1,037.872 484.704 266.778 154.095 132.295
2007 653.535 25.860 138.053 1,073.888 507.473 273.165 156.099 137.151
2008 654.875 27.003 143.178 1,108.222 529.274 278.667 159.240 141.041
2009 596.071 25.317 146.366 1,155.319 558.675 287.042 164.784 144.818
2010 659.591 27.191 145.128 1,125.077 537.493 284.073 160.917 142.594
2011 680.782 28.061 150.267 1,166.002 557.110 294.970 166.362 147.560
2012 704.470 29.033 155.989 1,211.542 578.938 307.076 172.435 153.094
2013 728.320 30.012 161.783 1,257.721 601.075 319.388 178.567 158.690
2014 750.829 30.936 167.313 1,301.940 622.281 331.246 184.390 164.023
2015 773.296 31.857 172.867 1,346.434 643.624 343.217 190.221 169.373
2016 795.358 32.762 178.364 1,390.569 664.799 355.139 195.970 174.660
2017 817.494 33.669 183.910 1,435.181 686.207 367.226 201.757 179.990
2018 839.675 34.579 189.501 1,480.222 707.826 379.466 207.573 185.357
2019 861.873 35.488 195.128 1,525.646 729.632 391.848 213.412 190.755
2020 884.056 36.397 200.786 1,571.402 751.602 404.358 219.266 196.176
2021 906.195 37.303 206.468 1,617.435 773.710 416.985 225.127 201.614
2022 928.258 38.206 212.166 1,663.693 795.929 429.714 230.988 207.062
2023 950.212 39.105 217.873 1,710.117 818.234 442.530 236.841 212.512
2024 972.025 39.997 223.582 1,756.648 840.594 455.419 242.677 217.958
2025 993.663 40.882 229.284 1,803.226 862.982 468.365 248.487 223.392
2026 1,015.092 41.758 234.972 1,849.788 885.367 481.351 254.264 228.805
2027 1,036.280 42.624 240.638 1,896.270 907.719 494.362 259.998 234.191
2028 1,057.192 43.478 246.273 1,942.606 930.006 507.379 265.682 239.540
2029 1,077.793 44.320 251.868 1,988.729 952.196 520.384 271.304 244.845
2030 1,098.049 45.146 257.416 2,034.572 974.256 533.361 276.858 250.097
2031 1,117.912 45.957 262.903 2,080.037 996.140 546.283 282.329 255.285
2032 1,137.361 46.750 268.325 2,125.081 1,017.827 559.137 287.713 260.404
2033 1,156.362 47.525 273.673 2,169.634 1,039.283 571.905 293.001 265.445
2034 1,174.883 48.279 278.937 2,213.623 1,060.475 584.567 298.183 270.399
2035 1,192.890 49.012 284.110 2,256.979 1,081.367 597.103 303.250 275.259
2036 1,210.350 49.723 289.182 2,299.628 1,101.925 609.494 308.194 280.016
2037 1,227.232 50.409 294.144 2,341.501 1,122.114 621.719 313.005 284.661
2038 1,243.505 51.071 298.989 2,382.524 1,141.902 633.759 317.676 289.187
2039 1,259.138 51.706 303.707 2,422.629 1,161.253 645.593 322.198 293.586
2040 1,274.102 52.313 308.289 2,461.744 1,180.133 657.201 326.561 297.848
*T ho usands o f P erso ns
Historical and Projected Values for Wage and Salary Employment by Detailed Industrial Classification
for Texas*
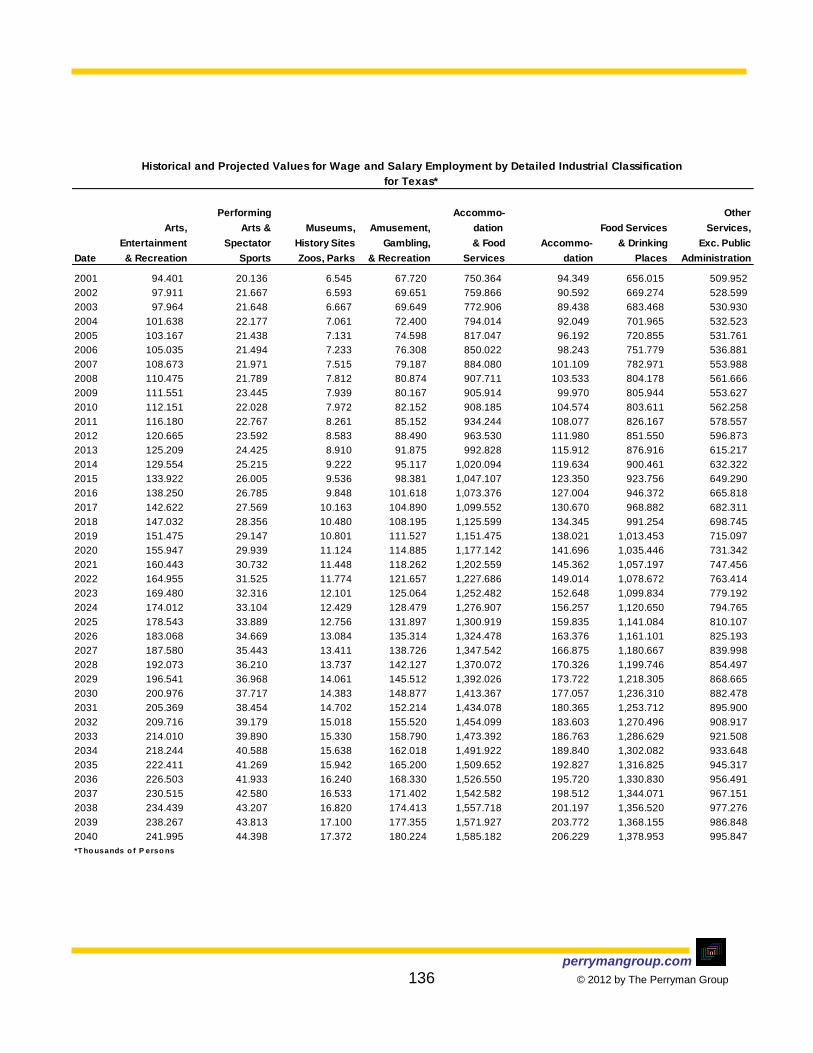
perrymangroup.com 136 © 2012 by The Perryman Group
Performing Accommo- Other
Arts, Arts & Museums, Amusement, dation Food Services Services,
Entertainment Spectator History Sites Gambling, & Food Accommo- & Drinking Exc. Public
Date & Recreation Sports Zoos, Parks & Recreation Services dation Places Administration
2001 94.401 20.136 6.545 67.720 750.364 94.349 656.015 509.952
2002 97.911 21.667 6.593 69.651 759.866 90.592 669.274 528.599
2003 97.964 21.648 6.667 69.649 772.906 89.438 683.468 530.930
2004 101.638 22.177 7.061 72.400 794.014 92.049 701.965 532.523
2005 103.167 21.438 7.131 74.598 817.047 96.192 720.855 531.761
2006 105.035 21.494 7.233 76.308 850.022 98.243 751.779 536.881
2007 108.673 21.971 7.515 79.187 884.080 101.109 782.971 553.988
2008 110.475 21.789 7.812 80.874 907.711 103.533 804.178 561.666
2009 111.551 23.445 7.939 80.167 905.914 99.970 805.944 553.627
2010 112.151 22.028 7.972 82.152 908.185 104.574 803.611 562.258
2011 116.180 22.767 8.261 85.152 934.244 108.077 826.167 578.557
2012 120.665 23.592 8.583 88.490 963.530 111.980 851.550 596.873
2013 125.209 24.425 8.910 91.875 992.828 115.912 876.916 615.217
2014 129.554 25.215 9.222 95.117 1,020.094 119.634 900.461 632.322
2015 133.922 26.005 9.536 98.381 1,047.107 123.350 923.756 649.290
2016 138.250 26.785 9.848 101.618 1,073.376 127.004 946.372 665.818
2017 142.622 27.569 10.163 104.890 1,099.552 130.670 968.882 682.311
2018 147.032 28.356 10.480 108.195 1,125.599 134.345 991.254 698.745
2019 151.475 29.147 10.801 111.527 1,151.475 138.021 1,013.453 715.097
2020 155.947 29.939 11.124 114.885 1,177.142 141.696 1,035.446 731.342
2021 160.443 30.732 11.448 118.262 1,202.559 145.362 1,057.197 747.456
2022 164.955 31.525 11.774 121.657 1,227.686 149.014 1,078.672 763.414
2023 169.480 32.316 12.101 125.064 1,252.482 152.648 1,099.834 779.192
2024 174.012 33.104 12.429 128.479 1,276.907 156.257 1,120.650 794.765
2025 178.543 33.889 12.756 131.897 1,300.919 159.835 1,141.084 810.107
2026 183.068 34.669 13.084 135.314 1,324.478 163.376 1,161.101 825.193
2027 187.580 35.443 13.411 138.726 1,347.542 166.875 1,180.667 839.998
2028 192.073 36.210 13.737 142.127 1,370.072 170.326 1,199.746 854.497
2029 196.541 36.968 14.061 145.512 1,392.026 173.722 1,218.305 868.665
2030 200.976 37.717 14.383 148.877 1,413.367 177.057 1,236.310 882.478
2031 205.369 38.454 14.702 152.214 1,434.078 180.365 1,253.712 895.900
2032 209.716 39.179 15.018 155.520 1,454.099 183.603 1,270.496 908.917
2033 214.010 39.890 15.330 158.790 1,473.392 186.763 1,286.629 921.508
2034 218.244 40.588 15.638 162.018 1,491.922 189.840 1,302.082 933.648
2035 222.411 41.269 15.942 165.200 1,509.652 192.827 1,316.825 945.317
2036 226.503 41.933 16.240 168.330 1,526.550 195.720 1,330.830 956.491
2037 230.515 42.580 16.533 171.402 1,542.582 198.512 1,344.071 967.151
2038 234.439 43.207 16.820 174.413 1,557.718 201.197 1,356.520 977.276
2039 238.267 43.813 17.100 177.355 1,571.927 203.772 1,368.155 986.848
2040 241.995 44.398 17.372 180.224 1,585.182 206.229 1,378.953 995.847
*T ho usands o f P erso ns
Historical and Projected Values for Wage and Salary Employment by Detailed Industrial Classification
for Texas*
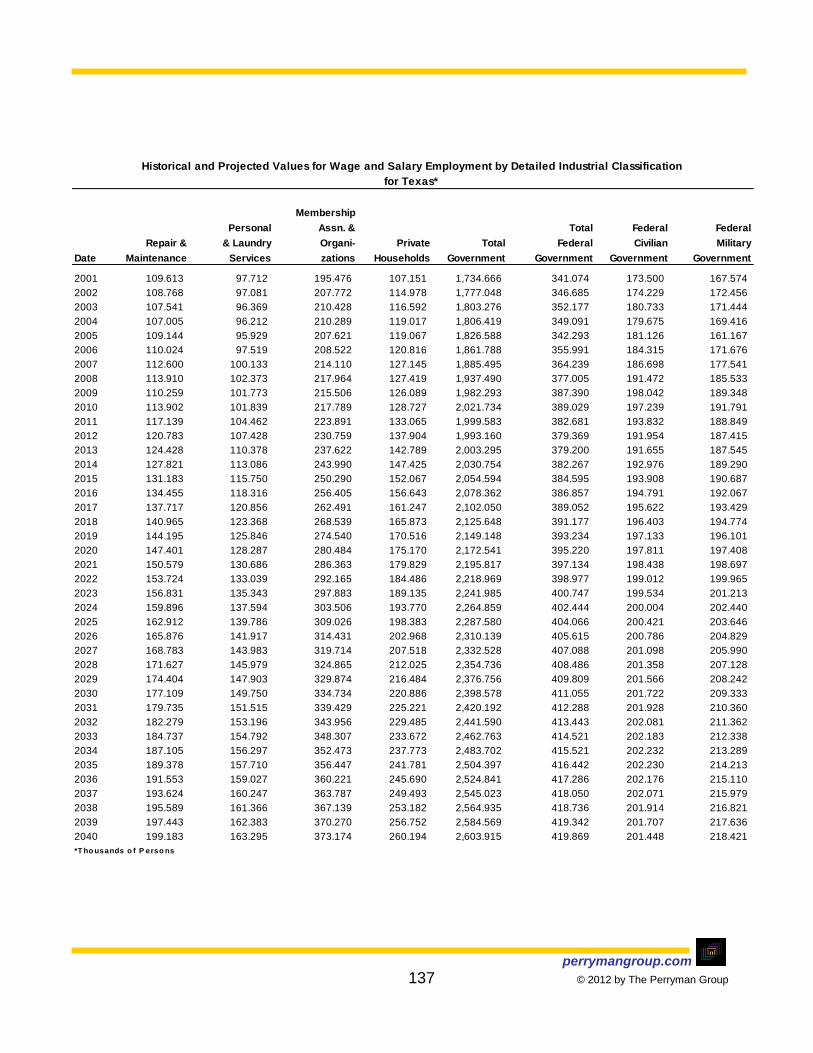
perrymangroup.com 137 © 2012 by The Perryman Group
Membership
Personal Assn. & Total Federal Federal
Repair & & Laundry Organi- Private Total Federal Civilian Military
Date Maintenance Services zations Households Government Government Government Government
2001 109.613 97.712 195.476 107.151 1,734.666 341.074 173.500 167.574
2002 108.768 97.081 207.772 114.978 1,777.048 346.685 174.229 172.456
2003 107.541 96.369 210.428 116.592 1,803.276 352.177 180.733 171.444
2004 107.005 96.212 210.289 119.017 1,806.419 349.091 179.675 169.416
2005 109.144 95.929 207.621 119.067 1,826.588 342.293 181.126 161.167
2006 110.024 97.519 208.522 120.816 1,861.788 355.991 184.315 171.676
2007 112.600 100.133 214.110 127.145 1,885.495 364.239 186.698 177.541
2008 113.910 102.373 217.964 127.419 1,937.490 377.005 191.472 185.533
2009 110.259 101.773 215.506 126.089 1,982.293 387.390 198.042 189.348
2010 113.902 101.839 217.789 128.727 2,021.734 389.029 197.239 191.791
2011 117.139 104.462 223.891 133.065 1,999.583 382.681 193.832 188.849
2012 120.783 107.428 230.759 137.904 1,993.160 379.369 191.954 187.415
2013 124.428 110.378 237.622 142.789 2,003.295 379.200 191.655 187.545
2014 127.821 113.086 243.990 147.425 2,030.754 382.267 192.976 189.290
2015 131.183 115.750 250.290 152.067 2,054.594 384.595 193.908 190.687
2016 134.455 118.316 256.405 156.643 2,078.362 386.857 194.791 192.067
2017 137.717 120.856 262.491 161.247 2,102.050 389.052 195.622 193.429
2018 140.965 123.368 268.539 165.873 2,125.648 391.177 196.403 194.774
2019 144.195 125.846 274.540 170.516 2,149.148 393.234 197.133 196.101
2020 147.401 128.287 280.484 175.170 2,172.541 395.220 197.811 197.408
2021 150.579 130.686 286.363 179.829 2,195.817 397.134 198.438 198.697
2022 153.724 133.039 292.165 184.486 2,218.969 398.977 199.012 199.965
2023 156.831 135.343 297.883 189.135 2,241.985 400.747 199.534 201.213
2024 159.896 137.594 303.506 193.770 2,264.859 402.444 200.004 202.440
2025 162.912 139.786 309.026 198.383 2,287.580 404.066 200.421 203.646
2026 165.876 141.917 314.431 202.968 2,310.139 405.615 200.786 204.829
2027 168.783 143.983 319.714 207.518 2,332.528 407.088 201.098 205.990
2028 171.627 145.979 324.865 212.025 2,354.736 408.486 201.358 207.128
2029 174.404 147.903 329.874 216.484 2,376.756 409.809 201.566 208.242
2030 177.109 149.750 334.734 220.886 2,398.578 411.055 201.722 209.333
2031 179.735 151.515 339.429 225.221 2,420.192 412.288 201.928 210.360
2032 182.279 153.196 343.956 229.485 2,441.590 413.443 202.081 211.362
2033 184.737 154.792 348.307 233.672 2,462.763 414.521 202.183 212.338
2034 187.105 156.297 352.473 237.773 2,483.702 415.521 202.232 213.289
2035 189.378 157.710 356.447 241.781 2,504.397 416.442 202.230 214.213
2036 191.553 159.027 360.221 245.690 2,524.841 417.286 202.176 215.110
2037 193.624 160.247 363.787 249.493 2,545.023 418.050 202.071 215.979
2038 195.589 161.366 367.139 253.182 2,564.935 418.736 201.914 216.821
2039 197.443 162.383 370.270 256.752 2,584.569 419.342 201.707 217.636
2040 199.183 163.295 373.174 260.194 2,603.915 419.869 201.448 218.421
*T ho usands o f P erso ns
for Texas*
Historical and Projected Values for Wage and Salary Employment by Detailed Industrial Classification
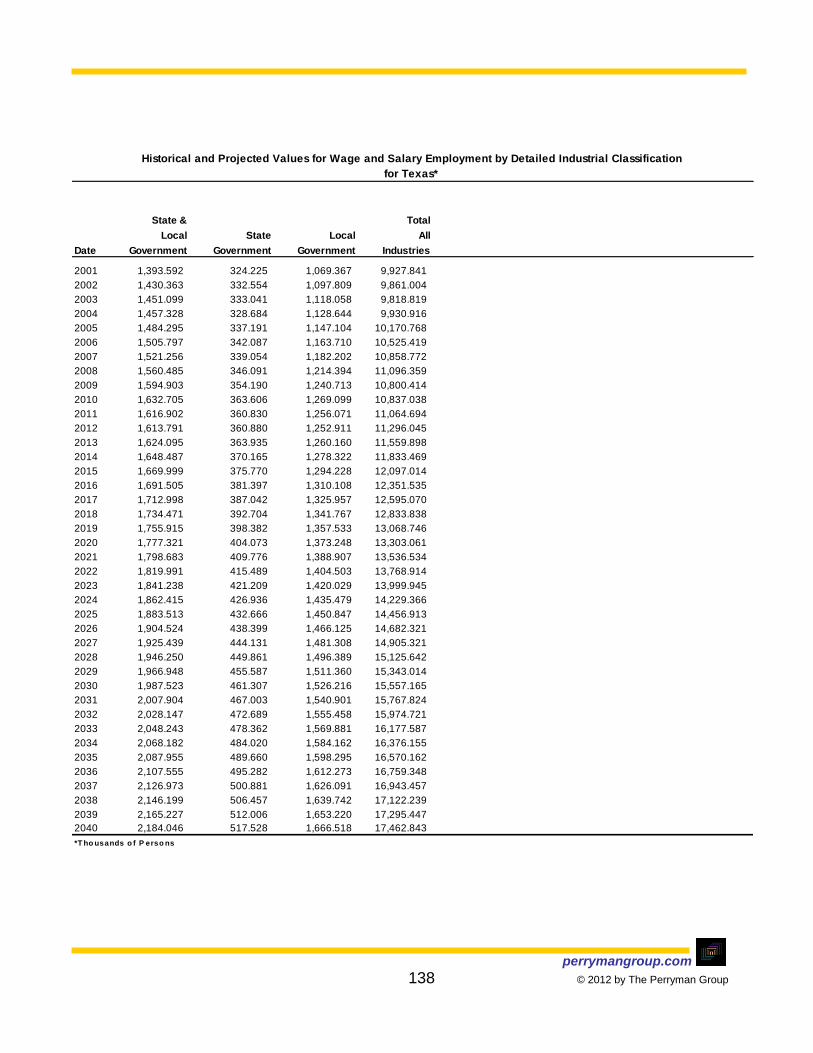
perrymangroup.com 138 © 2012 by The Perryman Group
State & Total
Local State Local All
Date Government Government Government Industries
2001 1,393.592 324.225 1,069.367 9,927.841
2002 1,430.363 332.554 1,097.809 9,861.004
2003 1,451.099 333.041 1,118.058 9,818.819
2004 1,457.328 328.684 1,128.644 9,930.916
2005 1,484.295 337.191 1,147.104 10,170.768
2006 1,505.797 342.087 1,163.710 10,525.419
2007 1,521.256 339.054 1,182.202 10,858.772
2008 1,560.485 346.091 1,214.394 11,096.359
2009 1,594.903 354.190 1,240.713 10,800.414
2010 1,632.705 363.606 1,269.099 10,837.038
2011 1,616.902 360.830 1,256.071 11,064.694
2012 1,613.791 360.880 1,252.911 11,296.045
2013 1,624.095 363.935 1,260.160 11,559.898
2014 1,648.487 370.165 1,278.322 11,833.469
2015 1,669.999 375.770 1,294.228 12,097.014
2016 1,691.505 381.397 1,310.108 12,351.535
2017 1,712.998 387.042 1,325.957 12,595.070
2018 1,734.471 392.704 1,341.767 12,833.838
2019 1,755.915 398.382 1,357.533 13,068.746
2020 1,777.321 404.073 1,373.248 13,303.061
2021 1,798.683 409.776 1,388.907 13,536.534
2022 1,819.991 415.489 1,404.503 13,768.914
2023 1,841.238 421.209 1,420.029 13,999.945
2024 1,862.415 426.936 1,435.479 14,229.366
2025 1,883.513 432.666 1,450.847 14,456.913
2026 1,904.524 438.399 1,466.125 14,682.321
2027 1,925.439 444.131 1,481.308 14,905.321
2028 1,946.250 449.861 1,496.389 15,125.642
2029 1,966.948 455.587 1,511.360 15,343.014
2030 1,987.523 461.307 1,526.216 15,557.165
2031 2,007.904 467.003 1,540.901 15,767.824
2032 2,028.147 472.689 1,555.458 15,974.721
2033 2,048.243 478.362 1,569.881 16,177.587
2034 2,068.182 484.020 1,584.162 16,376.155
2035 2,087.955 489.660 1,598.295 16,570.162
2036 2,107.555 495.282 1,612.273 16,759.348
2037 2,126.973 500.881 1,626.091 16,943.457
2038 2,146.199 506.457 1,639.742 17,122.239
2039 2,165.227 512.006 1,653.220 17,295.447
2040 2,184.046 517.528 1,666.518 17,462.843
*T ho usands o f P erso ns
for Texas*
Historical and Projected Values for Wage and Salary Employment by Detailed Industrial Classification