“the economic cost of environmental degradation: a case
TRANSCRIPT
Electronic copy available at: http://ssrn.com/abstract=2534429
“The Economic Cost of Environmental Degradation: A Case Study of
Agricultural Land Degradation in Ghana”
Kwame Boakye Fredua
Environmental Protection Agency, Ghana
Phone: +233(0) 20731 1070
Email: [email protected]

Electronic copy available at: http://ssrn.com/abstract=2534429
Abstract
Land is a key environment and natural resource assets in Agriculture. It is also the case that the
viability of arable land has a direct relationship with productivity. Land degradation caused by soil
erosion is a major threat to the sustainability of agriculture. Soil erosion is one of the main forms
of land degradation in Ghana, a problem that has been studied and researched by numerous scholars
both local and abroad. Since 2006, the agricultural sector’s contribution to Gross Domestic Product
has declined, possibly because of the negative effects of land degradation i.e. soil erosion
challenges among others. The paper assesses the cost of land or soil degradation in the Agricultural
Sector and its effect on the economy of Ghana with focus on the on-site effects of soil erosion on
agricultural productivity. The study draws on the productivity loss and nutrient replacement cost
approaches in estimating the cost of soil degradation in the agricultural sector. The results show
the Northern region as the most prone to soil degradation, and that the real cost of agricultural soil
degradation as a percentage of real Gross Domestic Product is approximately 2.5% on average, for
a 4 year period from 2006 to 2012, which is equivalent to approximately GH¢ 964.92 million in
monetary terms. The Sustainable Land Management (SLM) practices would be key in efforts to
mitigate land degradation; enhancing agricultural biodiversity, and reducing poverty. SLM should
thus be implemented particularly in the northern part of the country.

Acknowledgements
My deepest gratitude goes to the African Capacity Building Foundation (ACBF) for their immense
support and assistance in this study. I also want to express my utmost thanks to the Executive
Director, Mr. Daniel S. Amlalo and all staff of the Environmental Protection Agency especially,
the Head of the Strategic Environmental Assessment (SEA) Unit, Ms. Christine O. Asare.
I also acknowledge the assistance and support received from Mr. Kingsley Amoako of the Ministry
of Food and Agriculture.
.
,

iv
Table of Contents
Contents Page
Abstract .............................................................................................................................................................. ii
Acknowledgements ...........................................................................................................................................iii
List of Abbreviations/Acronyms .....................................................................................................................viii
Chapter 1: Introduction ......................................................................................................................................................................................................10
1.1 Background of Study ............................................................................................................................. 10
1.2 Problem Statement ................................................................................................................................. 12
1.3 Research Questions ................................................................................................................................ 13
1.4 Objectives of the Study .......................................................................................................................... 13
1.5 Research Methodology .......................................................................................................................... 14
1.5.1 Data requirements and sources .......................................................................................................... 14
1.6 Justification and relevance ..................................................................................................................... 15
1.7 Organization of the Study ...................................................................................................................... 16
Chapter 2: Overview of Agricultural Land Degradation In Ghana .......................................................... 17
2.1 Introduction ............................................................................................................................................ 17
2.2 Land Resources and Use ........................................................................................................................ 18
2.3 Soils and Topography ............................................................................................................................ 19
2.4 Climate and Agro Ecological Zones ...................................................................................................... 20
2.5 Land degradation as a major environmental issue ................................................................................. 22
2.6 Trends and forms of Land Degradation ................................................................................................. 23
2.6.1 Soil Erosion ....................................................................................................................................... 25
2.6.2 Depletion of Soil Nutrients ................................................................................................................ 25
2.6.3 Reduction of Vegetation Cover ......................................................................................................... 25
2.7 Agricultural Farming Systems in Ghana ................................................................................................ 26
2.8 Causes of land degradation .................................................................................................................... 27
2.8.1 Poverty ............................................................................................................................................... 27
2.8.2 Deforestation ..................................................................................................................................... 28
2.8.3 Overgrazing ....................................................................................................................................... 28
2.8.4 Unsustainable farming practices ........................................................................................................ 28
2.8.5 Population growth and Urbanization ................................................................................................. 29

v
2.8.6 Mining Activities ............................................................................................................................... 29
2.8.7 Climate change .................................................................................................................................. 29
2.9 Impact of Land Degradation in Ghana ................................................................................................... 29
Chapter 3: Literature Review ........................................................................................................................................................................................31
3 .1 Introduction ............................................................................................................................................ 31
3.2 Types of Land (Soil) degradation .......................................................................................................... 32
3.2.1 Soil Erosion ....................................................................................................................................... 32
3.2.1.1 Effects of Soil Erosion on Agricultural Soils ................................................................................... 33
3.2.2 Soil salination .................................................................................................................................... 34
3.3 Soil degradation and Food Security ....................................................................................................... 35
3.4 Link between Population growth and soil degradation .......................................................................... 36
3.5 Evidence of the Agricultural Soil Degradation on the Ghanaian Economy ........................................... 37
3.6 On-Site Costs of Soil Erosion on Java, Indonesia .................................................................................. 38
3.7 On-Site Costs of Soil Erosion, Magat Watershed, the Philippines ........................................................ 39
Chapter 4: Research Methodology ...........................................................................................................................................................................41
4.1 Introduction ..................................................................................................................................... 41
4.2 Measuring the Cost of Soil Erosion: Methodologies and Models .................................................. 42
4.2.1 Valuation of On-Site Effects ...................................................................................................... 44
4.3 Empirical and Theoretical Models .................................................................................................. 45
4.3.1 Universal Soil Loss Equation (USLE) ........................................................................................ 45
4.3.2 Erosion-Productivity Impact Calculator (EPIC) ......................................................................... 46
4.3.3 Contingent Valuation and Hedonic Pricing ................................................................................ 47
4.4 Productivity Loss Method ............................................................................................................... 48
4.5 Nutrient Replacement Cost Method ................................................................................................ 51
4.6 Methodology: Strengths and Weaknesses ....................................................................................... 54
Chapter 5: Results And Discussions ........................................................................................................................................................................55
5.1 Introduction ............................................................................................................................................ 55
5.2 Presentation of Results ........................................................................................................................... 55
5.2.1 Estimation of Agricultural Soil Degradation for the year, 2006 ........................................................ 56
5.2.2 Estimation of Agricultural Soil Degradation for the year, 2008 ........................................................ 58
5.2.3 Estimation of Agricultural Soil Degradation for the year 2010 ......................................................... 60
5.2.4 Estimation of Agricultural Soil Degradation for the year 2012 ......................................................... 62
vi
5.3 Summary and discussion of results ........................................................................................................ 64
5.4 Economic consequences of agricultural soil degradation ...................................................................... 65
5.5 Key policy interventions and recommendations .................................................................................... 65
Chapter 6: Conclusion And Way Forward ..................................................................................................................................... 68
6.1 Conclusion ............................................................................................................................................. 68
6.2 Way forward .......................................................................................................................................... 68
Annexes ........................................................................................................................................................... 70
Annex 1: Major Environmental Problems in Ghana ................................................................................................ 70
Annex 2: Environmental Problems in Ghana ........................................................................................................... 71
References ....................................................................................................................................................... 73
List of Tables
Table 1.1: Data sources and requirements ................................................................................................................ 15
Table 2.1: Rainfall Distribution by Agro-ecological zones ...................................................................................... 21
Table 2.2: On-site effects of agricultural practices on agricultural soil in Ghana .................................................... 26
Table 3.1: On-site and off-site losses caused by Soil Erosion.................................................................................. 34
Table 3.2: On-Site Costs of Soil Erosion in Java, 1985 ........................................................................................... 39
Table 3.3: On-Site Costs of Soil Erosion, Magat Watershed, the Philippines ........................................................ 40
Table 4.1: Potential Soil Loss estimates on regional basis ....................................................................................... 49
Table 4.2: Agro-ecological zone specific data ......................................................................................................... 52
Table 5.1: Agriculture Productivity Loss, 2006 ....................................................................................................... 56
Table 5.2: Agriculture Nutrient Replacement Cost, 2006 ........................................................................................ 57
Table 5.3: Agriculture Productivity Loss, 2008 ....................................................................................................... 58
Table 5.4: Agriculture Nutrient Replacement Cost, 2008 ........................................................................................ 59
Table 5.5: Agriculture Productivity Loss, 2010 ....................................................................................................... 60
Table 5.6: Agriculture Nutrient Replacement Cost 2010 ......................................................................................... 61
Table 5.7: Agriculture Productivity Loss, 2012 ....................................................................................................... 62
Table 5.8: Agriculture Nutrient Replacement Cost 2012 ......................................................................................... 63
Table 5.9: Annual Estimates of the Cost of Productivity Loss and Nutrient Replacement ...................................... 64
Table 5.10: Annual Cost of Agricultural Soil Degradation ...................................................................................... 64

vii
List of Figures
Figure 2.1: Sectoral Contribution to National Output (2006-2012*) .................................................................. 18
Figure 2.2: Agro-ecological Zones of Ghana ...................................................................................................... 22
Figure 2.3: Major Environmental Concerns in Ghana ........................................................................................ 23
Figure 4.1: Changes in prices and production as a result of soil degradation ..................................................... 43

viii
List of Abbreviations/Acronyms
₱ Philippine Peso
AEZ Agro-Ecological Zones
AFAMIN African Agricultural Market Information Network
AgGDP Agricultural Gross Domestic Product
AR Ashanti Region
BAR Brong Ahafo Region
CEA Country Environmental Analysis
CLA Land Area under crops
CMF Crop/Vegetation Management Factor
CoASD Cost of Agricultural Soil Degradation
CoED Cost of Environmental Degradation
CR Central Region
CSIR Council for Scientific Industrial Research
DFID Department for International Development
EEA European Environmental Agency
EPA Environmental Protection Agency
EPIC Erosion Productivity Impact Calculator
ER Eastern Region
FAO Food and Agriculture Organization
GAR Greater Accra Region
GDP Gross Domestic Product
GLASOD Global Assessment of Human Induced Soil Degradation
GPRS Ghana Poverty Reduction Strategy
GSS Ghana Statistical Service
ha Hectare
ISSER Institute of Statistical, Social and Economic Research
Kg Kilograms
MoFA Ministry of Food and Agriculture
MUSLE Modified Universal Soil Loss Equation
NPK Nitrogen, Phosphorous, Potassium
NR Northern Region
NRC Nutrient Replacement Cost
ix
NREG Natural Resource and Environmental Governance
ODA Official Development Assistance
PPP Policies, Plans, and Programmes
PSL Potential Soil Loss
QYF Crop Yield Loss
Rp Indonesian Rupiah
RUSLE Revised Universal Soil Loss Equation
SEA Strategic Environmental Assessment
SLM Sustainable Land Management
SNL Nutrients Lost in the form of NPK
SoE State of the Environment
SRID Statistics Research and Information Directorate
TLA Total Land Area
TNL Total Quantity of Nutrients Eroded from Soils
TNRC Total Nutrient Replacement Cost
TVPL Total Value of Crop Productivity Loss
UER Upper East Region
UN United Nations
UNDESA United Nations Department of Economic and Social Affairs
UNDP United Nations Development Programme
UNEP United Nations Environment Programme
USLE Universal Soil Loss Equation
UWR Upper West Region
VR Volta Region
WDI World Development Index
WEPP Water Erosion Prediction Project
WR Western Region

10
CHAPTER 1
INTRODUCTION
1.1 Background of Study
Environmental degradation is one of the major threats facing humanity in recent times. It includes
deforestation, desertification, pollution, and climate change, all of which are issues of concern for
the international community. Environmental degradation increases the vulnerability of many
societies and contributes to the scarcity of resources. Fundamentally, the environment provides the
resource base for the economic development of many nations.
The environment refers to the natural and physical surroundings and the relationship of people with
it. It includes land, water, air, structures, living organisms, and the social, cultural and economic
conditions. The continuity of human life is premised on how sustainably environmental resources
are used. For instance land, as an agricultural resource is an important asset upon which the
livelihoods of people especially the poor and vulnerable, largely depend. There is thus, the need to
protect, conserve, and use environmental resources in a way that ensures sustainable economic
growth and development in the long run. Environmental resources are also an essential part of the
overall production process i.e. both marketed resources such as metals, minerals, and land, etc. and
non-market resources (clean air, favourable weather conditions, biodiversity and ecosystem
services, etc.).
Environmental degradation has become a topical issue of intense discussion at diverse levels of
decision-making in recent times. It is the deterioration of the natural environment through human
activities and natural disasters (United Nations, 1997). UNDESA (2011) notes that environmental
degradation and climate change contribute to the increasing occurrence of disasters which are
linked to natural hazards”. It is also one of the ten threats officially cautioned by the High Level
Threat Panel of the United Nations. The United Nations International Strategy for Disaster
11
Reduction defines environmental degradation as “the reduction of the capacity of the environment
to meet social and ecological objectives, and needs”. Some forms of environmental degradation
may include; deforestation, pollution (air, water, and noise), soil erosion, etc.
There is considerable pressure on the environment in recent times due to rising global population
coupled with the attendant problems of urbanization and increased human and industrial activities.
These factors have led to the deterioration of the environment through pollution, deforestation,
improper disposal and management of household and industrial waste, loss of biodiversity and the
alteration of ecosystems.
In Ghana, the environment and natural resources that serves as the base for socio-economic activity,
and on which the population’s livelihood depend are being depleted at an unsustainable rate.
According to the Country Environmental Analysis (CEA) carried out by the World Bank in 2006,1
more than 50 % of forest areas have been converted to agricultural land by clearance for perennial
or annual cropping and slash-and-burn cultivation practices. Crop yields have stagnated, and
productivity has declined because of rampant soil erosion. Fish, timber, and non-timber forest
product stocks are decreasing rapidly. Coastal towns are facing severe water shortages during the
dry season. Wildlife populations and biodiversity are in serious decline. Health-related pollution
i.e. indoor and outdoor air pollution, and water and sanitation issues have also emerged as serious
health threats for the majority of the population.
1 The World Bank Country Environmental Analysis (CEA) Report presented an assessment of the country’s
environmental priorities, the environmental implications of key economic and sector policies, and the
country’s institutional capacity to address them. It also proposed practical management, institutional, and
policy solutions to handle issues of natural resource management, environmental degradation, and
sustainability of growth.

12
1.2 Problem Statement
In 2006, the Country Environmental Analysis (CEA) carried out by the World Bank suggested that
the estimated Cost of Environmental Degradation in Ghana (CoED) was 10 % of Gross Domestic
Product (GDP) whiles the economy grew at 6 %. The cost of environmental degradation to GDP
represented almost one half of Ghana’s US$1.5 billion annual Official Development Assistance
(ODA). This pointed to the fact that the country was on an unsustainable developmental path and
demanded that steps be taken to address these environmental problems. The incidence of
environmental degradation particularly land degradation is on the ascendancy. Soil erosion is
estimated to cost around 2 % and forest degradation, about 5 % of the national GDP (World Bank,
DFID, ISSER, 2005). This is equivalent to about US$ 530 million, or more than one third of
Ghana‘s annual ODA.
The effect of this is that prices of commodities and malnutrition may rise as land expansion and
technological development fail to compensate for decreasing soil productivity. Soil degradation is
thus likely to impact greatly on incomes and output from the agricultural sector as yields decline
and input costs rise especially in irrigated, rain-fed, and densely populated poor quality lands.
Already, the agricultural sector’s contribution to national output has dwindled compared to other
sectors of the economy. If essential steps are not taken to mitigate this problem, gains from the
sector will be eroded substantially leading to huge unemployment2in the country, food shortages,
hikes in rural-urban migration, and other attendant problems.
Other studies have also shown that land degradation and its extreme form, desertification is a
growing threat. It manifests itself in the form of soil erosion, loss of vegetative cover of land,
biodiversity erosion, and breakdown of natural ecosystems, aridity among others. Out of the
2 It is estimated that more than 50% of the country’s population is into agriculture.

13
country's total land's surface, 23 % is prone to very severe sheet and gully erosion, 46 % to severe
erosion and 31 %, moderate to slight erosion. Soil erosion is common and severe in areas of
extensive vegetation removal in all the major ecological zones.
Increased cultivation has also contributed to reduced vegetation cover, and the precipitation pattern,
with heavy rains on a very dry unprotected soils, thereby increasing the risk of soil erosion. When
soil erosion occurs, nutrients and organic matter are removed, which affects soil fertility and
agricultural production capacity. With agriculture as a major source of revenue, and employing
about 50 % of the population, it can also be concluded that poverty is highly linked to the access
and use of land for economic activities.
1.3 Research Questions
The study is driven by a number of plausible questions that border on environmental degradation.
It has been argued that, degradation of the environmental resource base will eventually put
economic activity itself at risk if measures are not taken to remedy the situation. This study
therefore seeks to answer the following questions; what is the cost of agricultural soil degradation
in Ghana; how does the loss in productivity affect the prospects of growth in the national output;
and how can issues of agricultural soil degradation be sustainably addressed?
1.4 Objectives of the Study
The main objective of the study is to estimate the cost of environmental degradation of agricultural
soils and the factors that drive this degradation. The specific objectives of the study however are as
follows:
i) To determine the economic Cost of Agricultural Soil Degradation (CoASD).
ii) Analyze the trend of agricultural soil degradation from year 2006, 2008, 2010 and 2012,
and its effect on the growth in output.

14
iii) Finally, based on the findings of the study; recommendations and some policy initiatives
will be discussed aimed at mitigating agricultural soil/land degradation in Ghana.
1.5 Research Methodology
The process of estimating the cost of environmental degradation involves quantifying or placing a
monetary value on its consequences, which often implies estimating the changes in soil
productivity. The cost of soil loss is undertaken by estimating the on-site and off-site effects of
erosion. The foremost on-site impact is the reduction in soil quality that results from the loss of the
nutrient-rich upper layers of the soil, and the reduced water-holding capacity of many eroded soils.
Off-site effects arise when the soil is detached by accelerated water or wind erosion and transported
to considerable distances. The main off-site effect of water erosion is the movement of sediment
and agricultural pollutants into watercourses. This can lead to the silting-up of dams, disruption of
the ecosystems of lakes, and contamination of drinking water. In some cases, increased downstream
flooding may also occur due to the reduced capacity of eroded soil to absorb the water. However,
due to the unavailability of data on off-site of erosion-induced soil loss, the study will focus
primarily on on-site impacts.
There are a number of valuation techniques that can be used in the assessment of soil degradation
in agriculture. The study will however adopt the nutrient replacement cost and productivity loss
methods in estimating the cost of agricultural soil degradation because of data availabity.
1.5.1 Data requirements and sources
Secondary data sources will mainly be used for the study. Table 1.1 summarizes the data sources
and specific data requirements to be used in the estimation.\

15
Table 1.1: Data sources and requirements
Sources of data/Institutions Type of data used for the analysis
Ministry of Food and Agriculture Area of land under cultivation in hectares by
districts/regions, total crop yield, etc.
Crop Research Institute - Council for
Scientific Industrial Research (CSIR)
Potential Soil Loss figures by regions and agro-
ecological zones, C-Factor figures, and Nitrogen,
Phosphorous and Potassium (NPK) contents of
eroded soils from experimental farms from sites in all
the agro-ecological zones.
African Agricultural Market
Information Network (AFAMIN) Commercial fertilizer (NPK) prices, market values.
Ghana Statistical Service Gross Domestic Product (GDP), Contribution of
Agriculture to GDP, etc.
Case Studies on soil degradation
Yield loss – Soil loss parameters, expert opinions,
e.g. ISSER/DFID/World Bank, 2005, Diao and
Sarpong (2007), Quansah (2001), etc.
1.6 Justification and relevance
The contribution of natural resources and the environment to the Gross Domestic Product (GDP)
is quite substantial, and in order to safeguard the country’s advancement towards an upper middle
status, the rate of degradation and depletion of natural capital (natural resources and the
environment) must be checked to ensure sustainable socio-economic growth and development. It
has been estimated that the loss in annual GDP growth in Ghana due to agricultural soil erosion
and poor land management in crop production is 1.1–2.4 % (ISSER/DFID/World Bank, 2005).
Losses resulting from soil degradation pose serious cumulative consequences, generating marginal
costs for society, which bears the on-site and off-site economic costs of soil degradation. Marginal
costs incurred by farmers are passed on to consumers as price increases for agricultural products.

16
Social marginal costs are borne by society, together with the adverse effects on their social well-
being.
The study would provide information on major arable land use practices, and the current state of
the environment especially with regards to agricultural soil/land degradation and its implication for
the country. It will also invariably fill the gaps with regards to studies on agricultural soil loss
estimations. The findings and results of the study will also inform decision-makers in government
i.e. the Ministry of Food and Agriculture, environmental organizations and other interest groups,
thereby reshaping policies, plans and programmes (PPP) that border on agriculture and the
environment.
1.7 Organization of the Study
The study is presented in five (5) chapters. Chapter one provides a general introduction and
background to the study. Chapter two presents an overview of agricultural land degradation. The
third chapter presents a review of various literatures on the assessment of Agricultural soil
degradation with focus on major environment-poverty dimensions. The methodological
frameworks are discussed in chapter four, whiles the results and discussions are presented in
chapter five. The final chapter, chapter six presents the conclusion and recommendations for policy
design, formulation and implementation.

17
CHAPTER 2
OVERVIEW OF AGRICULTURAL LAND DEGRADATION IN GHANA
2.1 Introduction
The Agricultural sector plays a multi-dimensional role with regards to the environment and the socio-
economic development of Ghana. It is predominantly smallholder, traditional and rain-fed (SRID,
2001). The Ministry of Food and Agriculture (MoFA) is the lead ministry responsible for policy
formulation and planning for the agriculture sector. It is estimated that about 136, 000 km2 of land
which covers approximately 57 % of the country’s total land area is designated as “agricultural land
area”. A total of 58,000 km2 i.e. 24.4 % of the total land mass is under cultivation. The sector is also
characterized by limited access to irrigation and a high reliance on favourable climatic conditions.
Subsistence agricultural practices like slash and burn, shifting cultivation and mechanisation all result
in declining soil quality and land degradation which is estimated to affect about 150,000 km2 of
agricultural land.
The economy of Ghana has been predominantly agro-based since the 1980s, with more than 50 % of
the population engaged in agriculture i.e. farming, fisheries and animal husbandry, etc. The sector is
divided into five (5) main sub-sectors namely; the crops, fisheries, cocoa, livestock/poultry and the
forestry sub-sectors. In recent times however, the performance of the agricultural sector with respect
to its contribution to national output has changed since 2006. This change has been attributed to the
relatively fast growing service sector without giving much thought to the underlying effects of land
(soil) degradation in the sector; which is one of the factors that is eroding the gains of the agricultural
sector. Figure 2.1 shows the contribution to output of the various sectors from 2006 to 2012.

18
Source: Ghana Statistical Service (GSS)
Figure 2.1: Sectoral Contribution to National Output (2006-2012*)3
2.2 Land Resources and Use
Land use is mainly classified into agricultural or non-agricultural use. Agricultural land use
encompasses the cultivation of annual and tree crops, bush fallow and other uses, and unimproved
pasture. Non-agricultural land use includes forest reserves, wildlife reserves, unreserved closed
forests, unreserved savannah lands, lands for mining, settlements, and institutional uses which covers
about 48 % of the country‘s surface (Quansah, 2001).
There is no doubt that land or soil for that matter is a valuable resource in terms of the creation of
wealth in the agricultural sector. Land contributes to the provision, maintenance, and regulation of
critical ecosystem functions. Land as a resource may include; forest resources, wildlife, wetlands,
and water resources. It also serves as habitats for biodiversity species, supports nutrient cycling,
contributes to the provision of food, fresh water and wood, and helps in the regulation of the climate
3 Percentage of total; 2006 constant prices
30.4 29.131.0 31.8
29.8
25.622.7
20.8 20.7 20.4 19.0 19.1
25.9 27.3
48.8 50.248.6 49.2
51.148.5 50.0
2006 2007 2008 2009 2010 2011 2012
Agriculture Industry Service

19
and floods. For instance, the forest, savannah, wetland, and coastal ecosystems is reported as habitats
for at least 2,975 plant species, 728 birds, 225 mammals, and 221 reptiles. It is also worthy to note
that the agriculture sector strives on the productivity of soils. Most rural households (about 63 % of
the total population) depend largely on land resources for their livelihoods. The poor are the most
dependent on land resources (CEA, 2006).
2.3 Soils and Topography
The major soils are Lixisols, Acrisols, Nitisols, Luvisols, Lithosols, Plinthosols, Gleysols and
Cambisols. Alluvial soils (Fluvisols) and eroded shallow soils (Leptosols) are found in all the
ecological zones. Most of the soils are developed from thoroughly weathered parent materials, with
alluvial soils (Fluvisols) and eroded shallow soils (Leptosols) common to all the ecological zones.
Generally, their organic matter content, buffering capacity and cation exchange capacity are low.
The soils are consequently of low inherent fertility with nitrogen and phosphorus as the most
deficient nutrients. Many of the soils have predominantly light textured surface horizons, heavier
textured soils being confined to the valley bottoms and the Accra Plains (MoFA, 2010). The soils in
the forest zone are grouped under Forest Oxysols and Forest Acid Gleysols. They are porous, well
drained and generally loamy and are distinguished from those of the Savannah zones by the greater
accumulation of organic matter in the surface resulting from higher accumulation of biomass. They
occur in areas underlain by various igneous, metamorphic and sedimentary rocks, which have
influenced the nature and properties of the soil (MoFA, 1998).
Soils of the Savannah zones, especially in the Interior Savannah, are low in organic matter (less than
2% in the topsoil), have high levels of iron concretions and are susceptible to severe erosion. Thus
well-drained upland areas tend to be droughty and when exposed to severe incident sun scorch, tend
to develop cement-like plinthite. These conditions make it imperative that manure be incorporated
regularly into the soils in the Savannah zones (MoFA, 1998). The topography of the country is mainly

20
undulating with most slopes less than 5% and many not exceeding 1%. The topography of the high
rainforest is, however, mainly strongly rolling.
2.4 Climate and Agro Ecological Zones
Ghana’s climate is characterized by the hot, dry and dusty-laden air mass that move from the north
east across the Sahara and by the tropical maritime air mass that moves from the south-west across
the southern Atlantic Ocean. The climate ranges from the bimodal rainfall equatorial type in the south
to the tropical unimodal monsoon type in the north. The mean monthly temperature over most of the
country on the average is above 25oC, as a result of the low latitude position of Ghana and the absence
of high altitude areas. Mean annual temperature averages 27oC. Absolute maxima approach 40oC,
especially in the north, with absolute minima descending to about 15oC.
In the coastal areas, where the modifying influence of the sea breeze is felt the annual range of
temperature is between 5 and 6oC. In the interior on the other hand, the range is higher, about 7 to
9°C (Dickson and Benneh, 1988; Benneh et al. 1990). The rainfall generally decreases from the south
to the north. The wettest area is the extreme southwest where the rainfall is over 2,000 mm per
annum. In the extreme north, the annual rainfall is less than 1,100 mm. The driest area is in the south-
eastern coastal tip where the rainfall is about 750 mm. The annual mean relative humidity is about
80% in the south and 44% in the north (Dickson and Benneh, 1988; Benneh et al. 1990).

21
Table 2.1: Rainfall Distribution by Agro-ecological zones
4Agro-ecological zone Mean Annual
Rainfall (mm)
Growing Period (Days)
Major season Minor season
Rain forest 2,200 150-160 100
Deciduous Forest 1,500 150-160 90
Transitional 1,300 200-220 60
Coastal 800 100-110 50
Guinea Savannah 1,100 180-200 *
Sudan Savannah 1,000 150-160 *
Source: Meteorological Services Department, MoFA, 2010
Agro-ecological zones are divided into six major zones, namely; Rain Forest, Deciduous Forest,
Forest-Savannah Transition, Coastal Savannah and Northern (Interior) Savannah which comprises
Guinea and Sudan Savannahs as shown in figure 2.2. The bimodal rainfall pattern in the Forest,
Deciduous Forest, Transitional and Coastal Savannah Zones gives rise to major and minor growing
seasons. In the Northern Savannah, the unimodal distribution results in a single growing season. The
rainfall determines largely the type of agricultural enterprise carried out in each zone. Table 2.1
shows the rainfall distribution by agro-ecological zones in the country.
4 *Rainfall distribution is bimodal in the Forest, Transitional and Coastal Zones, giving a major and minor
growing season; elsewhere (Guinea Savanna and Sudan Savanna), the unimodal distribution gives a single
growing season.

22
Source: Ministry of Food and Agriculture
Figure 2.2: Agro-ecological Zones of Ghana
2.5 Land degradation as a major environmental issue
The State of the Environment (SoE) Report, 2004 outlined land degradation, coastal erosion,
pollution of water bodies, deforestation, poor waste management, risk from chemical use, indoor and
outdoor air pollution and desertification as major 5environmental problems confronting the nation.
An analysis of the Strategic Environmental Assessment Reports of the District Medium-Term
5 Details of these environmental problems are shown in annex 2 in the appendices.

23
Development Plans (DMTDP) 2010-2013 shows that some of the most serious environmental threats
to the country out of thirty-three (33) threats6 identified include: deforestation, water pollution, waste
disposal & management, bush fires, stone & sand winning, air pollution, bad farming practices, soil
erosion, illegal logging activities, charcoal production, illegal mining/"galamsey", flooding, climate
change, and overgrazing. These environmental issues are consistent with those identified in the SoE
Report, 2004. These findings seem to suggest that the problem of natural resources and
environmental degradation is on the ascendancy and must be effectively addressed. Some of the
problems are illustrated in Figure 2.3.
Source: Authors analysis from SEA Reports of District Medium-Term
Development Plans (2010-2013)
Figure 2.3: Major Environmental Concerns in Ghana
2.6 Trends and forms of Land Degradation
According to Vitousek et al. 1997, land degradation is a vital societal concern because of its impact
on human populations (food security, economics, sustainability, etc.) and environment quality (dust
storms, trace gas emissions to the atmosphere, soil erosion, etc.). Ghana has a relatively large amount
6 See annex 1: Major Environmental Problems in Ghana
11%
11%11%
9%
8%
7%
7%
7%7% 7%
5%
4%
3%3%
Deforestation
Water pollution
Waste disposal & management
Bush fires
Stone & Sand winning
Air pollution
Bad farming practices
Soil Erosion
Illegal logging activities
Charcoal Production
Illegal mining/"Galamsey"
Flooding
Climate change
Overgrazing

24
of cultivated land per capita; however, most lands are characterized by low fertility and are subject
to degradation. To sustain crop production increases and ensure food security, soil, nutrient and water
resources need to be properly managed and conserved (Quansah, 1996).
Increasing production through area expansion, unsustainable agricultural practices, rising competing
demands for water are factors that have led to the increased degradation of land resources especially
in agricultural lands. Illegal logging activities, bushfires and wildfires, encroachment on forest
reserves, poaching, and illegal mining i.e. “galamsey” have also contributed largely to the destruction
of forests and other natural habitats. Furthermore, the depletion of forest and vegetative covers due
to improper land use management have also led to increased siltation, sedimentation, and
eutrophication in water bodies (rivers, basins, lakes).
Soil degradation is geographically widespread in all areas of the country. Diverse forms of soil
erosion are however present in all agro-ecological zones and regions, although the most degraded
areas in the country are the Upper East and Volta Regions (CEA, 2006). Although other regions are
also at risk of land degradation, the associated social vulnerability may well be most severe in the
north of the country. The Global Assessment of Human Induced Soil Degradation (GLASOD)
carried out in 1980s, maps out the severity of soil degradation for most countries. The GLASOD
assessment for Ghana identified that soil degradation is very severe in the Upper East Region.
Comparatively, the Upper East Region is classified as ‘very severe’, as against the rest of Ghana,
which is classified as ranging from light to moderate.
Land degradation can be attributed to physical, chemical and biological processes. The physical
processes include soil erosion, compaction, soil crusting, and iron-pan formation. The depletion of
soil nutrients, salinity, and acidification mainly result from chemical processes, whiles the loss of

25
organic matter may be as a result of biological processes. The major forms of land degradation
include:
2.6.1 Soil Erosion
Soil erosion is the primary form of land degradation in Ghana. Soil erosion is a naturally occurring
process on land. The agents of soil erosion are mainly water and wind, with each contributing
significantly to soil loss each year. The main forms of soil erosion in Ghana are sheet erosion through
surface runoff, rill erosion in permanent and shifting micro channels, and gully erosion in permanent
channels. Studies on the extent of erosion reveals land areas susceptible to the various forms of
erosion as 70,441 km2
to slight to moderate sheet erosion, 103,248 km2
to severe sheet and gully
erosion and 54,712 km2
to very severe sheet and gully erosion (EPA, 2002). Ghana‘s topography
does not present steep slopes, and with relatively high rainfalls intensity in all ecological zones, the
rains also tend to be highly erosive.
2.6.2 Depletion of Soil Nutrients
The organic matter content in most soils is low i.e. less than 2% (MoFA, 1998) as most of the soils
are old and have been percolated over a long period of time. The levels of organic carbon, nitrogen
and available phosphorus are also generally low (FAO, 2005). The frequent burning, removal and
grazing of crop residues also prevent the build-up of new organic matter in the soil.
2.6.3 Reduction of Vegetation Cover
Forest resources were depleted at a rate of 1.7 % per annum 1990-2000 (WDI 2005), but, according
to the National Action Program to combat Drought and Desertification, the rate of depletion was 3
% in most desert-prone areas. The reduction of soil fertility and productivity has forced farmers to
expand their cultivated lands and such, cleared forest areas leading to deforestation.

26
2.7 Agricultural Farming Systems in Ghana
Most agricultural farming systems and practices impact negatively on soil or land resources.
Assuming-Brempong, Seini and Botchie (2003) identified some agricultural farming systems in
Ghana and their impact on agricultural soils. The effects of these farming practices are summarised
in Table 2.2. The main agricultural farming systems are the rotational bush fallow system, permanent
tree crop, compound farming, mixed farming, and special horticultural farming systems. The most
dominant farming system is the rotational bush fallow system that is characterized by slashing and
burning of the surrounding vegetation. The practice makes the soil highly susceptible to erosion
leading to soil loss and infertility.
Table 2.2: On-site effects of agricultural practices on agricultural soil in Ghana
Type of farming system Farming practice Effects on soil
Rotational bush fallow
System
Slash and burn. Fallow
periods. With or without
fertilizer
Destroy vegetative cover.
Expose the soil to erosion.
Leaching of soil nutrients
Permanent tree crop system Slash and burn but provide
tree cover
No serious soil loss
consequence identified in
this system.
Good forest cover
Compound farming system
Slash and burn with or
without fertilizer/manure.
Grazing livestock
Soil loss as a result of
erosion
Leaching of soil nutrients,
Compaction from livestock
Mixed farming system Slash and burn with or
without fertilizer/manure
Soil erosion and nutrient
depletion
Special horticultural farming
system
Slash and burn with
fertilizer/manure and
chemical application
Soil erosion, eutrophication
and acidification of the soil
as a result of fertilizer and
chemical application
Source: Asuming-Brempong, Seini and Botchie (2003)

27
2.8 Causes of land degradation
Generally, degradation is caused by both natural and human-induced factors. The most common
causes of land (soil) degradation among others include poverty, deforestation or indiscriminate
felling of trees, overgrazing, unsustainable farming practices, rapid population growth and
urbanization, environmentally unfriendly mining activities, and extreme climatic conditions.
2.8.1 Poverty
Poverty is said to be both the cause and effect of soil degradation in Ghana. The link between poverty
and environment is an extremely complex phenomenon. Even though poverty is a key contributor to
degradation, there is also no doubt that the latter further accentuates poverty especially among the
rural population of Ghana. Due to the traditional nature of farming systems coupled with the over-
reliance on favourable weather conditions, output of many farmers in the country is low, especially
those that are done on subsistence basis. This causes most farmers to supplement their output and
incomes by clearing trees and other vegetation for fuelwood, etc. Most farming communities have
also abandoned farming and have resorted to illegal mining activities in recent times.
(Diao & Sarpong, 2007)7 reports that agricultural soil loss reduces the total cumulative agricultural
income by approximately five % for the period 2006–2015, which is equivalent to a loss of US$4.2
billion over a 10 year period. Their work further revealed that the effect of soil loss on poverty is
significant at the national level, equivalent to five %age points higher poverty rate in the projected
year 2015 than would be the case in the absence of soil loss effects.
7 The paper uses an economy-wide, multimarket model to establish the effects of agricultural soil erosion on
crop yields at the subnational regional level for eight main staple crops. It further evaluated the aggregate
economic costs of soil erosion, taking into account economy-wide linkages between production and
consumption, across sectors and agricultural subsectors.

28
2.8.2 Deforestation
Deforestation represents probably the most serious form of natural resource degradation in Ghana,
and it is one of the main direct causes of soil degradation in the country. Amidst a rapidly growing
population, the demand for more land for agriculture, and for fuel wood and other wood products
(e.g. firewood, charcoal, etc.), which the majority of rural people rely on for their livelihoods, has
increased. The poor enforcement of regulations controlling access to and use of forestry products has
in most cases failed to deter and prevent unsustainable logging practices and indiscriminate fuel
wood extraction. Lands or soil become extremely prone to soil erosion in the absence of protective
vegetative cover.
2.8.3 Overgrazing
Overgrazing caused by the combination of rapid increase in the livestock population, sedentarization
of pastoral populations, and the reliance of the livestock sector on extensive grazing on natural
pastures and poor development of pasturelands has led to increasing pressures on land resources.
Increased livestock population also has a direct link to the physical compaction of most soils.
Overgrazing is a major factor in land degradation, causing half of the damage assessed in Africa and
one-fourth in other developing regions as revealed by some studies.
2.8.4 Unsustainable farming practices
The traditional farming system (bush-fallow system), which involves slashing and burning of forests
and grassland, and the rotation of cultivated fields (rather than crops) over years has proven to be
unsustainable given the context of rapidly increasing human and animal population. The absence of
sustainable soil and water conservation measures and external nutrient replacement practices has
accentuated the degradation of soils in the country. This leads to a progressive reduction of soil
nutrients, organic matter, and other chemical processes, and the subsequent decline in productivity
and crop yields.
29
2.8.5 Population growth and Urbanization
Rapid urbanization and increased population have also increased the pressure on land, not only with
respect to farming to meet increased food requirements, but also for other competing uses like
housing and infrastructure development. Ghana has experienced a rapid population growth in the last
decades. Population almost tripled over the last 40 years, from 6.7 million in 1960 to 18.4 million in
2000 (GSS, 2000). In the Upper East, Upper West, and Northern Regions, the regions most prone to
land degradation, population density has increased between 1984 and 2000 from 87, 24, and 17 to
104, 31, and 21 persons per km2, respectively, an increase of 20, 29, and 24 %, respectively (GSS,
2000).
2.8.6 Mining Activities
Mining, particularly illegal mining activities, is one of direct causes of land degradation. These
activities are usually accompanied by deforestation and removal of the fertile topsoil of adjacent
agricultural lands. Illegal mining activities in recent times, great cause a lot of havoc to many
communities, destroying large stretches of arable lands, water bodies, and other sensitive ecosystems.
2.8.7 Climate change
Climate change has also exacerbated the problem of soil degradation. Increased rainfall variability
and overall drop in rainfall and rise in temperatures have negative impact on agricultural productivity,
increasing the chances of droughts and/or extreme climate events e.g. floods, and desertification
particularly in the northern regions.
2.9 Impact of Land Degradation in Ghana
Land degradation is compromising the capacity of ecosystems to provide, maintain, and regulate
critical functions and services, including resilience to climate variability and natural hazards e.g.
regulating floods and preventing droughts. Upstream land degradation reduces the capacity of

30
ecosystems to retain water and regulate water flows, thus preventing excessive runoff during the
rainy season. Downstream sedimentation and siltation reduces the water storage capacity of water
bodies, thus reducing their capacity to retain excessive water flows during the rainy season, and their
capacity to store water for the dry season.
Rural households, which constitute the most vulnerable part of the population and who directly,
depend on land resources for their livelihoods are the most affected by land degradation that results
in the reduction of soil productivity and associated increased food insecurity. Some of consequences
of land degradation, particularly in the northern regions, include increased migration i.e. from north
to south, and from rural areas to urban centres. Land degradation in Northern Ghana has resulted in
fragile environmental conditions coupled with harsh climatic conditions of droughts and periodic
floods (Destombes, 1999). In some other instances persistent drought has manifested in chronic
malnutrition and wide spread poverty. The effect of land degradation in Northern Ghana has led to
the migration of farmers from degraded regions to the rural areas of the Brong Ahafo Region, which
has relatively more fertile agricultural soil.
31
CHAPTER 3
LITERATURE REVIEW
3 .1 Introduction
This chapter reviews the different works that have been carried out by other authors and researchers
in the areas of assessing the cost of agricultural land (soil) degradation. The review covers
discussions under different themes relevant to this study.
Land degradation definitions are very variable and dynamic due to the different spatial, temporal,
economic, cultural and environmental complexities (Warren, 2002). Land degradation has been
referred to as being a “loss in productivity of the land” (Muchena et al., 2005, p23). This is
especially important when one considers the negative effect of land degradation on a community
that relies on natural resources for their livelihood. Land degradation is defined as a change in one
or more of land’s properties that results in a decline in land/soil quality (Wiebe, 2003). As soil is a
fundamental component of land, soil degradation is a fundamental component of land degradation.
Lindert (2000) however, defines soil degradation more specifically as any chemical, physical, or
biological change in the soil’s condition that lowers its agricultural productivity, which is defined
as its contribution to the economic value of yields per unit of land area, holding other agricultural
inputs the same.
The key soil characteristics that affect yield are nutrient content, water holding capacity, organic
matter content, soil reaction (acidity), topsoil depth, salinity, and soil biomass. Change over time
in these characteristics constitutes “degradation” or “improvement.” Degradation processes include
erosion, compaction and hard setting, acidification, declining soil organic matter, soil fertility
depletion, biological degradation, and soil pollution (Lal and Stewart, 1990). Various types of soil
and land degradation have been explained by some authors like (FAO/UNDP/UNEP, 1994) and
(Scherr, 1999). As expected, these authors differ in their approach to describing and classifying

32
land (soil) degradation. Douglas (1994) notes that land degradation has five main components
namely; soil degradation, vegetation degradation, water degradation, climate deterioration, and
losses to urban or industrial development.
3.2 Types of Land (Soil) degradation
Some examples of soil degradation include loss of topsoil through erosion by water or wind,
depletion of soil nutrients, loss of soil organic matter, compaction, waterlogging, salinization, and
acidification. Soil degradation occurs as a result of both natural and human induced processes, such
as agricultural production.
3.2.1 Soil Erosion
Soil erosion, the most visible and most widespread form of soil degradation, could have a serious
negative effect on economic development in Ghana as the economy of this country depends heavily
on land, forests, and water bodies for its agricultural growth and rural development (Diao &
Sarpong, 2007). Generally, soil erosion involves a three-step process that begins with the
detachment of soil particles, continues with the transport of these particles, which ends up at a new
location. Myers (1993) reports that approximately 75 billion tons of fertile soil are lost from World
Agricultural systems each year, with much less erosion taking place in natural systems. In the
United States, it is estimated that the amount of soil lost to erosion is about 3 billion tons per annum
(Carnell, 2011). The main forms of water-induced erosion include; sheet, gully and rill.
Sheet erosion is the uniform removal of a thin film of soil from the land surface without the
development of any recognizable water channels. This type of erosion is barely perceptible, but the
loss of a single millimetre of soil depth from an acre of land, which can be easily lost during a
single irrigation or rain event, works out to a total loss of up to 6.1 tons of soil (Pimentel, 2000).

33
Rill erosion unlike the former is easier to recognize. It is the removal of soil through the cutting of
multiple small water channels. Rills are small enough to be smoothed by normal tillage operations
and will not form again in the same location. Together, sheet and rill erosion account for most soil
erosion in agricultural land (Brady and Weil, 1999). Gully erosion occurs in areas where water
runoff is concentrated, and as a result cuts deep channels into the land surface.
Gullies are incised channels that are larger than rills. You can remove small, ephemeral gullies by
tilling, but they will form again in the same location on the landscape. Gullies actually represent
less soil loss than sheet or rill erosion, but they pose added management concerns such as damage
to machinery, barriers to livestock and equipment, and increased labour costs to repair eroded areas.
3.2.1.1 Effects of Soil Erosion on Agricultural Soils
The effect of Soil erosion on agriculture is far-reaching, and could be very detrimental if not
checked. It basically results in the reduction of soil productivity i.e. a decline in soil fertility leading
to low crop yields. According to Troeh et al, 2004, erosion increases water run-off, which decreases
water filtration and the water-storage capacity of the soil. Organic matter and other essential plant
nutrients like phosphorous, nitrogen, calcium, etc. are also carried away from the soil. Young
(1989) estimated that eroded soils contain about three times more nutrients per unit weight than are
left in the remaining soil. Nutrient losses are often not directly accounted for and are a hidden cost
of soil erosion. Soil erosion is associated with about 85 % of the world’s land degradation, and
causes a 17 % reduction in crop productivity (Oldeman et al., 1990). Alfsen et al (1997) also
indicated that because agriculture in Ghana is characterized by small unit farms, which almost
solely rely on land and labour as input factors, it causes nutrients to be mined, and also reduces the
productivity of soils.

34
Soil erosion has adverse effects both on and off production sites as shown in Table 3.1, which have
economic consequences that are important to farmers and society (Bennett, 1935; Pimentel et al.,
1995; Uri, 1999, 2000, 2001).
Table 3.1: On-site and off-site losses caused by Soil Erosion
On-site Off-site
Soil loss
Nutrient loss
Loss of organic matter
Drop in the soil fertility
Yield drop
Production loss
Shrinkage of the available planting area
Sedimentation
Flooding
Landslides
Eutrophication
Loss of biodiversity
Drop in food supply
Food price increase
Water treatments
Destruction of roads, railways, waterways, etc.
Source: Clark (1985), Pimentel et al. (1995), Uri (2001) and Crosson (2007)
Adama (2003) noted that sustainable agricultural production depends on productive soils, but land
(soil) resources in Ghana particularly the Upper East Region are being degraded by both natural
and anthropogenic factors. Folly (1997) also adds that soil erosion poses a major threat to
sustainable agricultural production in the Sudan Savanna regions of the country.
3.2.2 Soil salination
Saline soils are soils that contain sufficient amounts of salts in the root zone that impairs plant
growth (Ponnamperuma, 1984). This form of degradation normally occurs in naturally dry areas
that undergo irrigation and do not allow for any fallow periods for the land to recover. Irrigation
schemes are set up to provide a constant flow of water to drylands so that crops can be grown.
Poorly designed irrigation schemes cause the water-table level to rise bringing natural salts to the
surface of the soil or land. This restricts the root activity of crops and therefore slows down growth.
This problem is further aggravated in areas with high rates of evaporation, as the salts become even

35
more concentrated. The end result is that the soils become too salty for crops to grow in them. Soils
affected by salinization are very difficult and expensive to rejuvenate and often remain unused or
abandoned.
3.3 Soil degradation and Food Security
The effects of soil degradation on agricultural productivity vary with the type of soil, crop,
degradation, and initial soil conditions, and may not be necessarily linear. Lower potential
production due to degradation may not show up in intensive, high-input systems until yields are
approaching their ceiling. Reduced efficiency of inputs (fertilizer, water, biocides, labor, etc.) could
show up in higher production costs rather than lower yields. The loss of agricultural productivity
as a result of soil degradation implies the loss of revenue that could be used for the socio-economic
development of the nation (Bonsu et al, 1992).
Food security is a multidimensional concept, which encompasses; availability, stability, access and
utilization at household, regional, national and global levels. It is also a measure of the percentage
of domestic food production over total consumption. Food security is threatened where cropland
degradation is allowed to occur because of the significant reduction in crop productivity. Shortages
of cropland are already having negative impacts on global food production (Pimentel et al, 2009).
According to the Food and Agricultural Organization (FAO), per capita production in terms of
grain has been on a decline for more than two (2) decades due to degradation of agricultural soils
and lands. This could lead to famine and hunger in some countries. Sub-Saharan African countries
like Ghana can be widely affected because agriculture is predominantly subsistent in nature.
Soil degradation has been predicted to impact heavily on agricultural supply, economic growth,
rural poverty, and long- term national wealth. Policy, therefore will need to be guided by country
assessments, with consideration given to the importance of agriculture in the economy, the
vulnerability of agricultural land to degradation (land scarcity, soil vulnerability and resilience, and

36
the anticipated rate of change in crop ping intensity), and the capacity of farmers to respond
effectively to the threat of degradation i.e. profitability of farming, availability and cost of soil-
conserving technology, and availability of financing for land improvements (Scherr, 1999).
3.4 Link between Population growth and soil degradation
Increasing population size is a major force driving the increase in global food production, and the
strain on the environment. Population growth exerts its influence synergistically with other factors.
As the global population grows and people over-cultivate scarce land resources, the nutrient values
of most soils reduce, which eventually affects productivity. Land degradation leads to population
displacement. It is estimated that hundreds of thousands of hectares of land are abandoned annually
for being too degraded for either cultivation or grazing. The implication of this is that, people or
communities especially the rural poor whose livelihoods depend on these land resources for their
subsistence have to move to other areas to settle.
Most parts of the world are currently facing increasingly serious soil erosion of various degrees
caused by both natural and human factors. This situation has given rise to widespread concerns in
both developed and developing countries (e.g. Boardman, 1998; EEA, 2000; Andrews et al., 2002;
Yang, 2004). Processes and impacts of natural resource change in agricultural environments and
their relationship with population growth and conservation management are fundamentally
influenced by biophysical conditions. Key factors are soil characteristics (affecting crop choice,
cropping frequency and input use), rainfall and ground and surface water resources (affecting crop
product choice, risks of soil degradation and land use intensity), and topography (affecting the
spatial distribution of production systems).
Further landscape differences and resource management challenges arise from variations in
settlement history, past history of degradation, crop mix, perennial and livestock components and
the mix of commercial and subsistence enterprises (Turner et al., 1993). The modern soil erosion

37
rate is much higher than that in the geological past because of the interaction of socioeconomic and
biophysical factors such as increasing population and poorly designed farm policies, or by
unfavourable climatic conditions (Roberts, 1994). Population growth is not necessarily harmful to
agricultural productivity, nor will relieving demographic pressure necessarily curb land
degradation. However, if we can monitor and control demographically-induced changes in the
landholding structure, we can diminish their damaging effects on land resources.
3.5 Evidence of the Agricultural Soil Degradation on the Ghanaian Economy
Alfsen et al. (1997, 2007), identified soil degradation, deforestation and pollution from mining
industries as the most serious environmental problems in Ghana. With regards to soil degradation,
they addressed two main issues; how the loss of land productivity affects the prospects for
economic growth in Ghana, and how the productivity loss can be combated in an economically
efficient way.
World Bank et al., 2005 also estimated annual cost of land degradation mainly through erosion,
ranges from 1.1 to 2.4% of the GDP corresponding to 2.9 and 6.3% of Agricultural Gross Domestic
Product (AgGDP). This is consistent with the estimate of 5% of AGDP for cost of annual
production loss through erosion and nutrient depletion (Convery and Tutu, 1990). Using the
Replacement Cost Approach, Quansah et al. (2000) estimated the seasonal cost of Nitrogen,
Phosphorous, Potassium (NPK) lost through erosion per hectare under a maize monocrop grown
under excessively tilled land as ¢ 15,528.00, equivalent to $7. Akyea (2009) reported the total cost
in Ghana Cedis terms of replacing lost nutrients by straight fertilizers under various tillage
treatments for cassava cultivation as 1,304.90, 831.70, 875.90, 210.15 for bare plot, planting on the
flat, zero tilled plot and ridging across slope respectively.

38
3.6 On-Site Costs of Soil Erosion on Java, Indonesia
Magrath and Arens (1989) conducted an analysis of the on-site costs of soil erosion for mainly
upland rainfed cropping systems in Java, Indonesia8 using the change in agricultural productivity
approach. The study assumed that yields and farm revenues would decline as erosion persist, and
that costs that tend to fall along with output account for a small share of production costs in Javanese
agricultural systems. The study accounted for possible adjustments in cropping systems by
constructing farm budgets for a variety of representative dryland cropping systems across Java,
which were then used to estimate the effects of yield losses from erosion on net farm incomes. This
was done for a single year i.e. 1985. Based on the assumption that the one-year loss in net income
recurs over each successive year, the study capitalized the one-year cost of erosion to obtain a total
present value of current and future losses. On-Site cost of soil erosion in Java was thus, equivalent
to the total present value of future losses.
The method and results are illustrated in Table 3.2. The one-percent decline in productivity and the
predicted average yield declines from soil erosion for dryland farming systems in each province of
Java are applied to the total area of these cropping systems. This yields the single-year cost of soil
erosion for 1985. This one-year loss is then capitalized to obtain the present value of losses in farm
income in current and future years. For Java as a whole, this on-site cost of soil erosion in 1985
was estimated to be approximately Rp 539.6 million (US$ 327 million), which amounted to around
4% of the total value of dryland crops in Java.
8 Given data limitations, Magrath and Arens (1989) were able to provide an estimation of on-site erosion
costs for 1985 only. However, the results for 1985 were extrapolated for other years over the 1971-85 period
by indexing physical erosion rates to the dryland cropping area in each year and indexing the costs of erosion
to dryland crop prices in each year.

39
Table 3.2: On-Site Costs of Soil Erosion in Java, 1985
Indonesian Rupiah (Rp) 1,650 = US$ 1
Dryland
Area
(‘000 ha)
Estimated
Current
Net Farm
Income
(Rp/ha)
Weighted
Production
Loss (%)
Annual Cost
of a 1 %
Productivity
Decline
(Rp/ha)
Single
Year
Cost
(Rp
mil.)
Capitalized
Cost (Rp
mil.)
On-Site
Cost as a
% of Total
Dryland
Crop
Value
West Java 1,440 95,039 4.4 3,718 23,508 235,080 10%
Central
Java 1,366 8,196 4.1 859 4,810 48,100 1%
Jogyakarta 196 9,531 4.7 1,026 948 9,480 1%
East Java 1,744 14,499 4.1 3,453 24,690 246,900 4%
ALL JAVA 4,747 83,649 4.3 2,686 53,956 539,560 4%
Source: Magrath and Arens (1989)
3.7 On-Site Costs of Soil Erosion, Magat Watershed, the Philippines
Cruz, Francisco and Conway (1988) estimated the on-site costs of soil erosion in the Magat watershed of
the Philippines using the nutrient replacement cost method. The average annual sheet erosion rate for
grasslands was estimated to be around 88 tons per hectare compared to 28 tons for all other land uses. The
nutrient losses associated with this erosion on representative land unit areas for grasslands were translated
into equivalent quantities of inorganic fertilizers; nitrogen (N), phosphorous (P) and potassium (K) lost
per ton of soil erosion. The cost of replacing these equivalent fertilizer losses was then valued in terms of
both nominal and shadow fertilizer prices. The resulting estimate was considered to be the on-site cost of
soil erosion from land conversion in the Magat watershed as shown in Table 3.3. On-Site cost of soil
erosion was estimated to be ₱1,068 per ha (US$ 50.1/ha) in nominal prices and ₱2,716 per ha (US$
127.5/ha) in shadow prices.

40
Table 3.3: On-Site Costs of Soil Erosion, Magat Watershed, the Philippines
Philippine Peso (₱) 21.3 = US$ 1
Quantity
(kg)
Valuation in terms of
Nominal Price
(₱)
Shadow Price
(₱)
Urea
Price 3.60/kg 9.86/kg
Amount lost/ton of soil eroded 3.08 11.09 30.37
Amount lost/ha of affected land 118.13 677.23 1,854.96
Solophos (P2O5)
Price 2.50/kg 6.20/kg
Amount lost/ton of soil eroded 0.79 1.98 4.90
Amount lost/ha of affected land 70.65 176.63 438.03
Muriate of Potash (K2O)
Price 4.20/kg 8.28/kg
Amount lost/ton of soil eroded 0.57 2.39 4.72
Amount lost/ha of affected land 51.07 214.49 422.86
All Fertilizers
Cost/ton of soil eroded 15.46 39.99
Cost/ha of affected land 1,068.35 2,715.85
Source: Cruz, Francisco and Conway (1988).

41
CHAPTER 4
RESEARCH METHODOLOGY
4.1 Introduction
This chapter discusses the available methodology that has been used by different scholars in
assessing the cost of agricultural soil degradation in different countries. The chapter examines the
relative strengths and weaknesses of these methods and discusses into detail the approach adopted
by the study i.e. the productivity loss and nutrient replacement cost approaches.
Land and other environmental resources supply goods and a flow of direct and indirect services to
society. Socio-economic activity in this regard usually leads to changes in the flow of these services
and the quality of these goods. Unfortunately, changes in the flow processes are not incorporated
in the value of environmental goods and ecosystem services and for that do not reflect in terms of
market prices. This is due to the fact that natural resources and environmental goods typically are
public goods. This lack of market prices is often interpreted as if the environmental resource has
no value, a problem that leads to overuse of the natural resources and environmental degradation.
Different methods for defining the value of environmental resources and the cost associated with
their overuse or degradation have been developed in recent times by numerous experts. The
principal motivation for environmental valuation is to make it possible to include environmental
impacts in cost-benefit analysis. Valuation methods are usually divided into two different
approaches: 9stated preferences and 10revealed preferences methods.
9 A set of pricing methods where people are asked how much they would agree to pay for avoiding a
degradation of the environment or, alternatively, how much they would ask as a compensation for the
degradation. 10 Revealed preference techniques associate a non-market good or service with the actual markets for a
complementary (i.e. proxy) good or service.

42
4.2 Measuring the Cost of Soil Erosion: Methodologies and Models
Soil is one of the most important natural resource assets for humans. It is a limited, strategic
resource of huge social, economic and environmental significance. However, the use of
inappropriate farming methods can lead to erosion and limit the productive capacity of the soil (Lal,
2006; Sparovek and De Maria, 2003). Most human activities have a negative impact on the
environment. In order to estimate the costs associated with these impacts, economic concepts have
been used to develop models that estimate the costs of these forms of environmental degradation
as well as the benefit of safeguarding these natural resources. For instance, when soil degradation
(erosion) occurs, it causes changes in prices and production (i.e. both demand and supply side).
This illustrated in Figure 4.1.
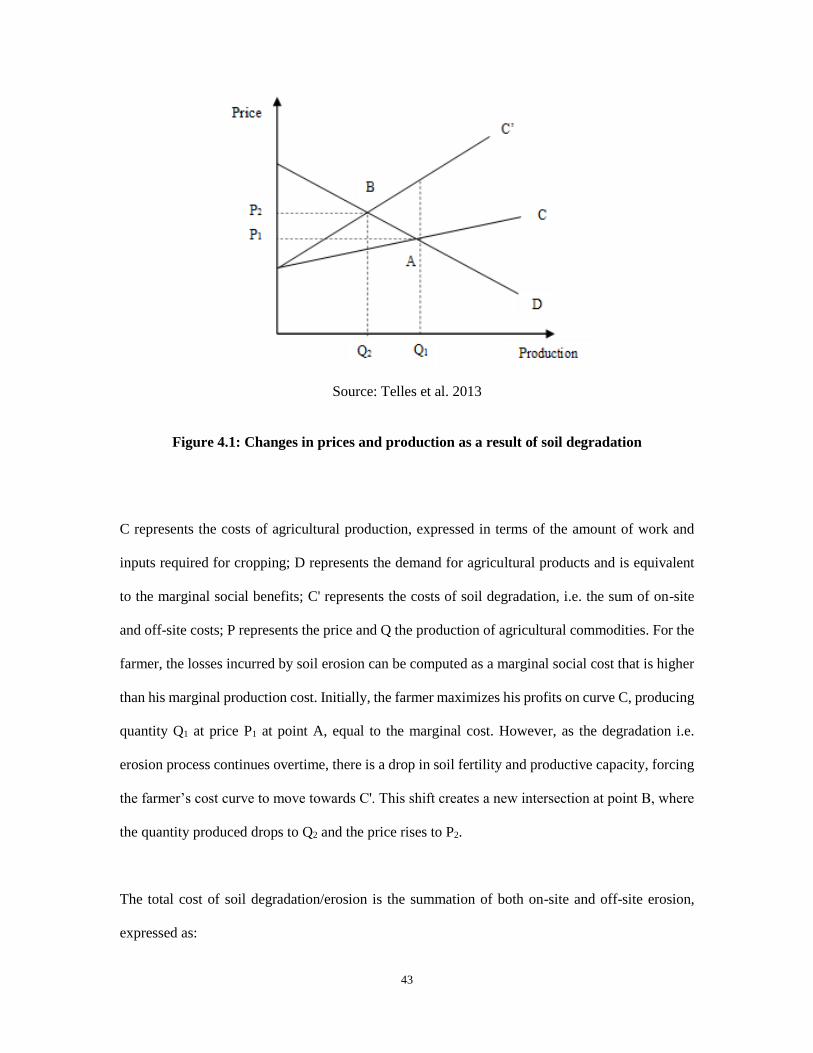
43
Source: Telles et al. 2013
Figure 4.1: Changes in prices and production as a result of soil degradation
C represents the costs of agricultural production, expressed in terms of the amount of work and
inputs required for cropping; D represents the demand for agricultural products and is equivalent
to the marginal social benefits; C' represents the costs of soil degradation, i.e. the sum of on-site
and off-site costs; P represents the price and Q the production of agricultural commodities. For the
farmer, the losses incurred by soil erosion can be computed as a marginal social cost that is higher
than his marginal production cost. Initially, the farmer maximizes his profits on curve C, producing
quantity Q1 at price P1 at point A, equal to the marginal cost. However, as the degradation i.e.
erosion process continues overtime, there is a drop in soil fertility and productive capacity, forcing
the farmer’s cost curve to move towards C'. This shift creates a new intersection at point B, where
the quantity produced drops to Q2 and the price rises to P2.
The total cost of soil degradation/erosion is the summation of both on-site and off-site erosion,
expressed as:

44
where C' = total costs of agricultural soil erosion; Con-site = costs resulting from losses occurring on
agricultural property; and Coff-site = costs resulting from losses occurring away from agricultural
property and affecting society as a whole. A modified version of the total costs of agricultural soil
erosion (C') focusing on only on-site costs is given by:
(3.1)
(3.2)
where Ci = prices of different types of nutrients (per unit); Qi =quantities of nutrients carried off
by soil estimated by USLE; and i = nutrient.
4.2.1 Valuation of On-Site Effects
There are two main methods used in the valuation of on-site effects of erosion: the impact on the
properties of the soil and the impact on agricultural production. The effects of erosion on soil
properties can be examined from the perspective of soil as a resource, or in terms of certain soil
characteristics as indicators of soil productivity e.g. soil nutrient content, soil moisture capacity.
The effects of erosion on agricultural production can be valued in terms of reductions in crop yields.
This may be the reduction in market value of crop production or, where the farming system involves
the production of fodder crops, erosion can be valued in terms of the decrease in livestock
production. Crop yields are not dependent on soil productivity alone; yields are determined by the
interaction of a number of factors such as fertiliser application rates, climate, pests, and the use of
irrigation systems. The impact of erosion on soil properties can however cause declining crop
yields, especially in the absence of increased inputs.
siteonCC'
m
1i
iiQC )(C siteon
site off site on C C C'

45
4.3 Empirical and Theoretical Models
The models that are used in the estimation of soil degradation (erosion) in the literature include;
the Universal Soil Loss Equation (USLE), the Revised Universal Soil Loss Equation (RUSLE),
Modified Universal Soil Loss Equation (MUSLE) and the Water Erosion Prediction Project
(WEPP).
4.3.1 Universal Soil Loss Equation (USLE)
The Universal Soil Loss Equation (USLE) predicts the long-term average annual rate of erosion on
a field slope based on rainfall pattern, soil type, topography, crop system and management
practices. It only predicts the amount of soil loss that results from sheet or rill erosion on a single
slope and does not account for additional soil losses that might occur from gully, wind or tillage
erosion. This erosion model was created for use in selected cropping and management systems, but
is also applicable to non-agricultural conditions such as construction sites. The USLE can be used
to compare soil losses from a particular field with a specific crop and management system to
"tolerable soil loss" rates. Alternative management and crop systems may also be evaluated to
determine the adequacy of conservation measures in farm planning.
The model uses five (5) major factors to calculate the soil loss for a given site. Each factor is the
numerical estimate of a specific condition that affects the severity of soil erosion at a particular
location. The erosion values reflected by these factors can vary considerably due to varying weather
conditions. Therefore, the values obtained from the USLE more accurately represent long-term
averages. It is expressed as:
A = R × K × LS × C × P
where:
A = potential long-term average annual soil loss in tons per hectare per annum
R = rainfall and runoff factor by geographic location

46
K = soil erosivity index
LS = slope length-gradient factor
C = crop/vegetation and management factor
P = support practice factor
The USLE examines only sheet and rill erosion and excludes gully erosion. It also calculates soil
movement, not soil loss, as it does not account for the deposition of sediment. In summary, the
USLE is not suitable for studies in areas for which appropriate factor values are not available.
Day et al (1992) calculated the effects of soil conservation on erosion rates in Mali, using different
combinations of soil conservation technologies and crop management strategies. Erosion rates are
calculated for the different combi-nations by multiplying the maximum potential erosion rate by
factors for soil physical structure and crop cover adjusted for West African conditions. The erosion
rates are entered into a soil-water balance/crop yield response model to calculate the impact on crop
yields. The yield data are entered into a linear programming model of a typical farming system,
which maximises net cash income subject to resource constraints, and the fulfilment of household
requirements for grain consumption.
4.3.2 Erosion-Productivity Impact Calculator (EPIC)
There are a number of empirical models used to estimate the effects of erosion on crop yields. The
models range from relatively simple relationships derived from regression analysis to highly
complex computer simulations of crop growth, such as the Erosion-Productivity Impact Calculator
(EPIC). They are based on specific assumptions and are generally representative only of the
geographical area in which they are developed. Some of the models require small quantities of data
that are relatively easy to obtain whiles others require large data sets that are rarely available in
developing countries. Benson et al (1989) to study the effects of erosion on soil productivity over
a 100-year period and to examine its effect on yields over the soil's productive life.

47
4.3.3 Contingent Valuation and Hedonic Pricing
Contingent valuation and hedonic pricing are alternative methods for valuing the on-site effects of
soil erosion. Contingent valuation involves questioning individuals such as farmers about their
willingness to accept compensation for the effects of erosion or their willingness to pay for the
benefits of reduced erosion e.g. as a result of soil conservation. Purvis et al (1989) used this
approach in the valuation of the on-site effects of filter strips under a conservation programme in
Michigan, US. Farmers were questioned about their willingness to accept compensation in return
for the establishment of filter strips on their land. The aim of the filter strips was to reduce the
sediment washed off the land and into streams. Filter strips have few benefits to the farmer (access,
amenity, recreation); the farmer bears the cost of a reduction in crop area and, under the given
programme, 50% of the costs of establishment. The data for the analysis were collected using postal
questionnaires.
The sample of farmers was divided into twelve groups, each of which was offered a different annual
compensatory payment in return for the establishment of filter strips. Data were collected on the
willingness of farmers to accept the payment offered and, at the given level of payment, the area of
land they would be willing to place under the programme. 11Tobit analysis was carried out on the
data and the resultant equation was used to estimate the area of land that filter strips could be
established on for different levels of compensatory payment.
Hedonic pricing uses land prices to estimate the economic value of soil erosion. Sale prices or rental
charges for plots of land that experience different rates of soil erosion are assessed using regression
analysis. The results quantify the relationship between land prices and soil loss and so can be used
to infer the cost of erosion. Several such studies have been carried out in the US. For example,
11 The Tobit model is a statistical model proposed by James Tobin (1958) to describe the relationship between
a non-negative dependent variable Yi and an independent variable Xi.

48
Miranowski and Hammes (1984) examine the effects of both depth of topsoil and potential soil
erodibility on land prices in Iowa and were able to estimate costs of each of these factors. There
are however, a number of problems that arise in the valuation of soil erosion with hedonic pricing.
The use of land prices to estimate the cost of erosion requires data on land prices and a well-
developed market for agricultural land.
Neither of these conditions are met in most developing countries. Hedonic pricing assumes that
individuals take into account erosion-induced degradation in making decisions whether to purchase
or rent a piece of land. In many cases individuals are unaware of the extent of degradation due to
insufficient information or the masking effects of technology. Individuals may not even be
concerned with the quality of the land, especially when making purchases on the basis of
investment speculation or for reasons of personal security or status.
4.4 Productivity Loss Method
Soil degradation affects agricultural productivity directly. The productivity loss approach is one of
the methods used in valuing on-site costs by estimating the opportunity cost i.e. farm revenues
foregone due to soil loss or a reduction in the top soil depth. It relies on the impact of degradation
on crop yields. However, due to the unavailability of data, off-site costs are not captured.
Under this approach, the potential soil losses with respect to the type of soils in each region are
converted to actual soil losses by multiplying by the crop/vegetation management factor (C-Factor).
The 12potential soil losses are estimated based the Universal Soil Loss Equation (USLE) on bare
uncultivated soils. Table 4.1 below shows the potential soil losses on the types of soil in each
respective region of the country.
12 The potential soil losses are derived from Geographical Information Systems (GIS) imagery with
additional observations from the field. These estimates are based on 2005 estimates.

49
Table 4.1: Potential Soil Loss estimates on regional basis
Region Total land Area
(ha)
Potential soil loss
(ton/ha) Average
Ashanti 2,439,000 480-870 675
Brong Ahafo 3,956,000 260-530 395
Central 983,000 240-420 330
Eastern 1,932,000 380-620 500
Greater Accra 324,000 110-220 165
Northern 7,038,000 490-770 630
Upper East 884,000 140-240 190
Upper West 1,848,000 110-220 165
Volta 2,057,000 360-590 475
Western 2,392,000 540-770 655
Source: MoFA, 2010 & ISSER/DFID/World Bank (2005)
The following assumptions are made in order to estimate the cost of soil degradation using the
productivity loss approach:
(i) On-site cost of erosion damage is equivalent to the value of lost crop production valued at
market prices.
(ii) In the absence of total land use by groupings in the regions, emphasis is placed on land use
as a result of cropping activities i.e. soil erosion and crop production. The computation is
assumed for one cropping year.
(iii) Sub-divided land use under cropping into 13Cassava-Maize mix and leguminous crops
parametres.
13 Cassava-Maize mix includes areas under Cocoa less than 4 years.

50
The Actual soil loss (ASL) is estimated for each region using the expression;
ASLr = CLAir
TLAr × PSLr × CMFi (1.0)
where TLAr is the total land area of each region, PSLr is the potential soil loss in each region, CLAir
is the land area under crops in each region, CMFi represents the crop management factor for each
crop category, and r is the region.
Crop Yield Loss (QYL) per region, which is the shortfall in crop yield, is also estimated based on
the equation:
QYLr = MYL × ASLr (2.0)
where MYL = Marginal crop yield loss . The value of crop productivity lost (VCPLr) is then
obtained as a product of the total quantity of crop output lost due to soil loss and the market price
of each crop, which is the average wholesale price (WSP). This is also expressed as:
VCPLr = 14TQYLr × WSP (3.0)
Finally, the total value of crop productivity loss is computed by summing up all the crop
productivity loss per region. Thus,
Total Value of Crop Productivity lost (TVPL) = ∑ VCPLr
10
r=1
(4.0)
14 The total quantity of crop yield lost (TQYLr ) is equal to the Crop Productivity Loss (QYL) aggregated
over the total area under crop categories for each region i.e. TQYLr = QYLr x CLAr

51
4.5 Nutrient Replacement Cost Method
The replacement cost approach estimates the cost of additional inputs required to compensate for
the reduction in soil fertility as a result of soil degradation (erosion). These include labour inputs,
the increased application of fertilizers, among others. Thao, 2001 reported that loss of crop output
could serve as a proxy to the loss income to the farmer from soil erosion. Quansah (2001) identified
the two most common deficient nutrients as nitrogen and phosphorous particularly in the savannah
soils where the organic matter is very low.
Some of the variables and parametres used in the productivity approach are also used in the nutrient
replacement cost approach. Nevertheless, one key parametre used in this method is an estimate of
crop nutrient content in eroded soils, which is specific to each agro-ecological zone. Table 4.3
presents agro-ecological zone specific data used in this approach. The C-Factor is also used in the
computation of the actual soil loss specific to an agro-ecological zone. Thus,
ASLz = CLAz
TLAz × PSLz × CMFz (1.0)
where z = specific agro-ecological zones.

52
Table 4.2: Agro-ecological zone specific data
15Agro-
ecology
Total
land area
(ha)
Total land area
under food
crops excluding
rice and
legumes (ha)
Quantity of nutrients
eroded Potential soil
loss (ton/ha) N P K
Forests 9,803,000 1,676,190 0.0560 0.0274 0.0100 2,635
Transition 3,956,000 669,370 0.0360 0.0191 0.0085 395
Interior
Savannah 9,770,000 1,425,540 0.0084 0.0165 0.0072 985
Coastal
Savannah 324,000 10,060 0.0270 0.0180 0.0059 165
Source: MoFA, 2011
Nutrients lost from eroded soils are converted to the form in which it is available in commercial
fertilizer i.e. NPK fertilizer. The NPK compound fertilizer and the nutrients are in the form N, P2O5,
and KO2. The conversion from the form lost in eroded soils to the form in the commercial fertilizer
is accomplished by multiplying the content in the eroded soils by the given constants (i.e. 1.00,
2.29 and 1.20 for N, P and K, respectively) as;
Nutrient in fertilizer = Nutrient eroded from soil × constant
The three estimates are summed up to arrive at nutrients lost in the form of NPK, which is denoted
by (SNLz). The total quantity of NPK eroded from soils as contained in commercial fertilizer (TNLz)
is then computed based on the assumption that NPK is a 15-15-15 compound fertilizer and that
15 The Forest AEZ includes the WR, ER, AR, CR and VR, Transitional AEZ is BAR, Interior Savannah are
NR, UER, UWR, and Coastal Savannah is GAR.

53
1 ton of 15-15-15 fertilizer contains 0.4516 tons of NPK by composition. Thus, total quantity
of NPK eroded from soils as contained in commercial fertilizer (TNLz) can be expressed as:
TNLz =(𝑆𝑁𝐿𝑧 × 1)
0.45 (2.0)
The quantity of fertilizer required to replace an NPK 15-15-15 equivalent lost from eroded soils
(NRQZ) for each agro-ecological zone is then estimated as:
NRQz = CLAz × ASLz × TNLz (3.0)
Nutrient replacement cost (NRC) is estimated given the market price of a 15-15-15 NPK fertilizer
as the product of NRQz and the price per ton (P) of a 15-15-15 NPK fertilizer. Finally, this is
estimated for each zone and then aggregated across zones based on the expression:
NRCz = NRQz × P (4.0)
TNRC = ∑ NRCz
4
z=1
(5.0)
Bennett (1955), Pimentel et al. (1995) and Uri (2001) are among the leading authorities on the
estimation of both on-site (nutrient losses and drops in yield) and off-site soil erosion. Adhikari et
al., 2011; and Bertol et al., 2005 report that on-site costs can be calculated using the cost of nutrient
replacement, associating the physical quantity of erosion with nutrient losses (calcium, phosphorus,
magnesium, nitrogen and potassium, etc.) and calculating on the basis of the market prices for
16 Assumption here is that if 0.45 tons of NPK is contained in a ton of NPK 15-15-15, then how many tons
would be contained in SNLz tons/ha.

54
commercial fertilizers and the quantity necessary to replace these lost nutrients, in addition to the
application cost.
Hertzler et al. (1985) conducted a study on the cost of soil use, based on a generalized Leontief
function, split into two parts namely; nutrient losses and soil physical degradation. Estimates were
made using information on annual crop yield, initial soil depth, nutrient stocks, erosion rate, and
annual remaining nutrient stocks in the topsoil layer subject to erosion, and fertilizer prices.
Pimentel et al. (1995) and Uri (2001) also estimated the costs of erosion taking account of variables
over and above nutrient losses, such as the type of management and loss of yield and quality, as
well as the off-site costs, extrapolating their estimates to the entire US territory. These studies
however vary at different levels: local, district, regional or national.
4.6 Methodology: Strengths and Weaknesses
The main reason for using the productivity loss and nutrient replacement cost approaches is the
availability of data and other relevant information. These methods are able to produce general and
average estimates that can be used in macro-level economic analysis. The theoretical base is
relatively simple and user-friendly, and can be used by researchers and other middle-level managers
of public institutions.
The limitation of these methods however is that, estimations are primarily based on on-site effects
i.e. soil and productivity losses. van Baren and Oldeman (1998) note that there is no consensus
among researchers with regard to the effect of soil erosion on agricultural production and soil
productivity although most researchers agree that soil erosion is a serious problem. The challenge
of estimating the effect of the loss of a unit of soil on the yield of a crop arises from the fact that
there is no direct link between erosion and productivity (Perrens et al, 1984; Erenstein, 1999).

55
CHAPTER 5
RESULTS AND DISCUSSIONS
5.1 Introduction
This chapter presents the results and discussions on the estimation of agricultural soil degradation
on aggregate level for the years 2006, 2008, 2010 and 2012. The aggregated agricultural soil
degradation is sub-divided into two; the productivity losses and nutrient replacement cost as
indicated in the previous chapter.
The methods are fundamentally based on the effects of erosion-induced soil loss on crop output or
yield. In other words, what it costs in monetary value terms to replace nutrients lost as a result of
soil loss. The rationale behind the productivity loss method is that on-site soil loss resulting from
soil erosion can result to declining crop yields. The quantity of yield loss attributable to erosion
damage is then valued at market prices (i.e. the value of crop output lost due to the soil loss). In the
case of the nutrient replacement approach, the objective was to estimate how much it costs to
replace the nutrients lost from soil as a result of soil degradation or erosion. That is, estimating the
value of the quantity of fertilizer (NPK) required to replace the soil nutrients eroded to some extent.
Crosson (1997) however notes that impacts on the soil biota, which causes great harm to crop
production, cannot be offset by the usage of more inputs i.e. fertilizers.
5.2 Presentation of Results
The results are presented in tables for each year, which consists of both the estimated productivity
losses and nutrient replacement cost approaches.

56
5.2.1 Estimation of Agricultural Soil Degradation for the year, 200617
Table 5.1: Agriculture Productivity Loss (Estimates using Maize-Cassava mix and Legume Parameters) 2006
Region (s) Total Land
Area (ha)
Cropped Area
(ha)
Avg.
Potential
Soil Loss
(ton/ha)
C-Factor Actual Soil Loss
(ton/ha)
Marginal
Crop Yield
Loss
(ton/ha)
Crop
Productivity
Loss (ton/ha)
Total Crop
Productivity
Loss (ton)
Avg. Whole
sale price of
crops
(GH¢/ton)
Total Value of
Crop Productivity
Loss (mil GH¢)
Ashanti 2,439,000 505,922 675 0.0730 10.2211 0.0270 0.2755 139,360.83 194.50 27.11
Western 2,392,000 225,704 655 0.0730 4.5117 0.0270 0.1216 27,443.55 194.50 5.34
Central 983,000 244,595 330 0.0730 5.9942 0.0270 0.1615 39,512.74 194.50 7.69
Volta 2,057,000 154,460 475 0.0730 2.6037 0.0270 0.0702 10,838.60 194.50 2.11
Northern 7,038,000 589,113 630 0.2200 11.6015 0.0193 0.2239 131,907.20 590.60 77.90
Eastern 1,932,000 486,218 500 0.0730 9.1858 0.0270 0.2480 120,590.08 194.50 23.45
Greater Accra 324,000 9,879 165 0.0730 0.3673 0.0270 0.0099 97.96 194.50 0.02
Brong Ahafo 3,956,000 588,952 395 0.0730 4.2928 0.0270 0.1159 68,263.29 194.50 13.28
Upper West 1,848,000 401,749 165 0.3100 11.1198 0.0039 0.0430 17,257.50 768.20 13.26
Upper East 884,000 447,397 190 0.3100 29.8096 0.0039 0.1152 51,519.76 768.20 39.58
Total (current prices) 209.73
Source: Author’s calculation
17 Estimations are made with year 2006 as the base year. GDP Deflators; 2006 = 100, 2008 = 139.80, 2010 = 189.80, 2012 = 242.90. Upper east and west is leguminous based
so an average C-factor for legumes is used. Northern region is a maize-cassava-legume farming system (assume C-factor is 0.22). All other regions are maize cassava farming
system. Total cropped area includes 6% rice area on the assumption that 6% rice is rain fed and subject to soil erosion.
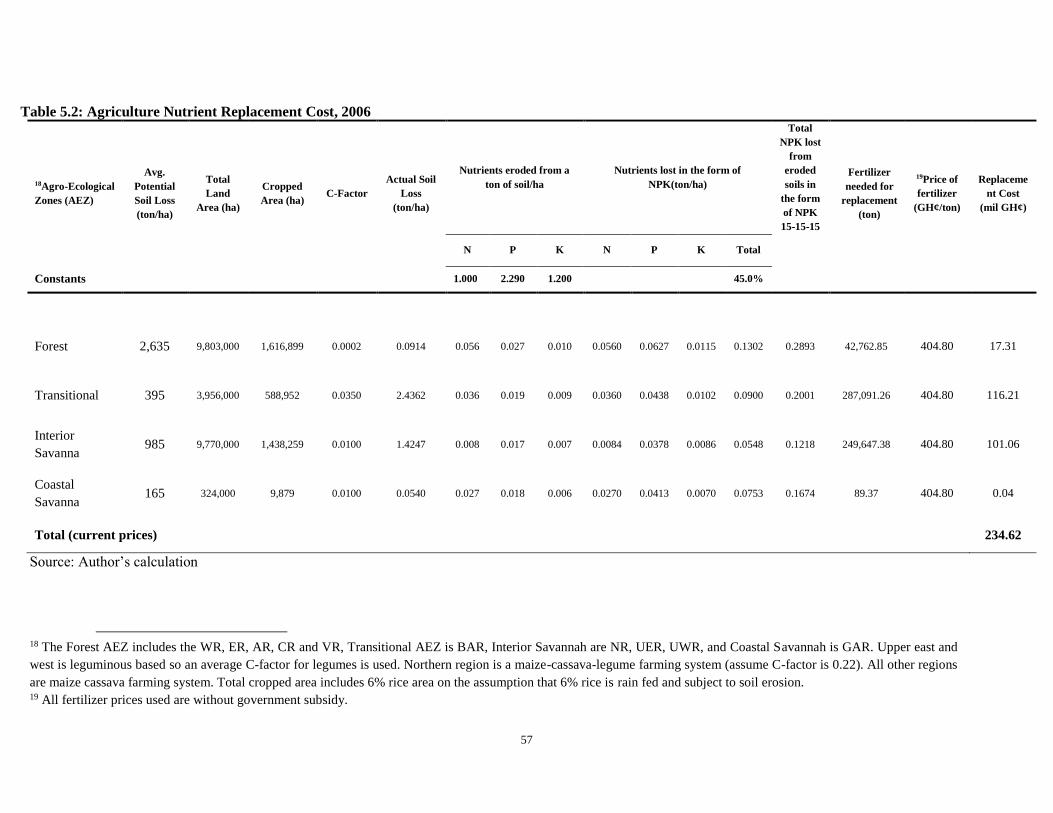
57
Table 5.2: Agriculture Nutrient Replacement Cost, 2006
18Agro-Ecological
Zones (AEZ)
Avg.
Potential
Soil Loss
(ton/ha)
Total
Land
Area (ha)
Cropped
Area (ha) C-Factor
Actual Soil
Loss
(ton/ha)
Nutrients eroded from a
ton of soil/ha
Nutrients lost in the form of
NPK(ton/ha)
Total
NPK lost
from
eroded
soils in
the form
of NPK
15-15-15
Fertilizer
needed for
replacement
(ton)
19Price of
fertilizer
(GH¢/ton)
Replaceme
nt Cost
(mil GH¢)
N P K N P K Total
Constants 1.000 2.290 1.200 45.0%
Forest 2,635 9,803,000 1,616,899 0.0002 0.0914 0.056 0.027 0.010 0.0560 0.0627 0.0115 0.1302 0.2893 42,762.85 404.80 17.31
Transitional 395 3,956,000 588,952 0.0350 2.4362 0.036 0.019 0.009 0.0360 0.0438 0.0102 0.0900 0.2001 287,091.26 404.80 116.21
Interior
Savanna 985 9,770,000 1,438,259 0.0100 1.4247 0.008 0.017 0.007 0.0084 0.0378 0.0086 0.0548 0.1218 249,647.38 404.80 101.06
Coastal
Savanna 165 324,000 9,879 0.0100 0.0540 0.027 0.018 0.006 0.0270 0.0413 0.0070 0.0753 0.1674 89.37 404.80 0.04
Total (current prices) 234.62
Source: Author’s calculation
18 The Forest AEZ includes the WR, ER, AR, CR and VR, Transitional AEZ is BAR, Interior Savannah are NR, UER, UWR, and Coastal Savannah is GAR. Upper east and
west is leguminous based so an average C-factor for legumes is used. Northern region is a maize-cassava-legume farming system (assume C-factor is 0.22). All other regions
are maize cassava farming system. Total cropped area includes 6% rice area on the assumption that 6% rice is rain fed and subject to soil erosion. 19 All fertilizer prices used are without government subsidy.
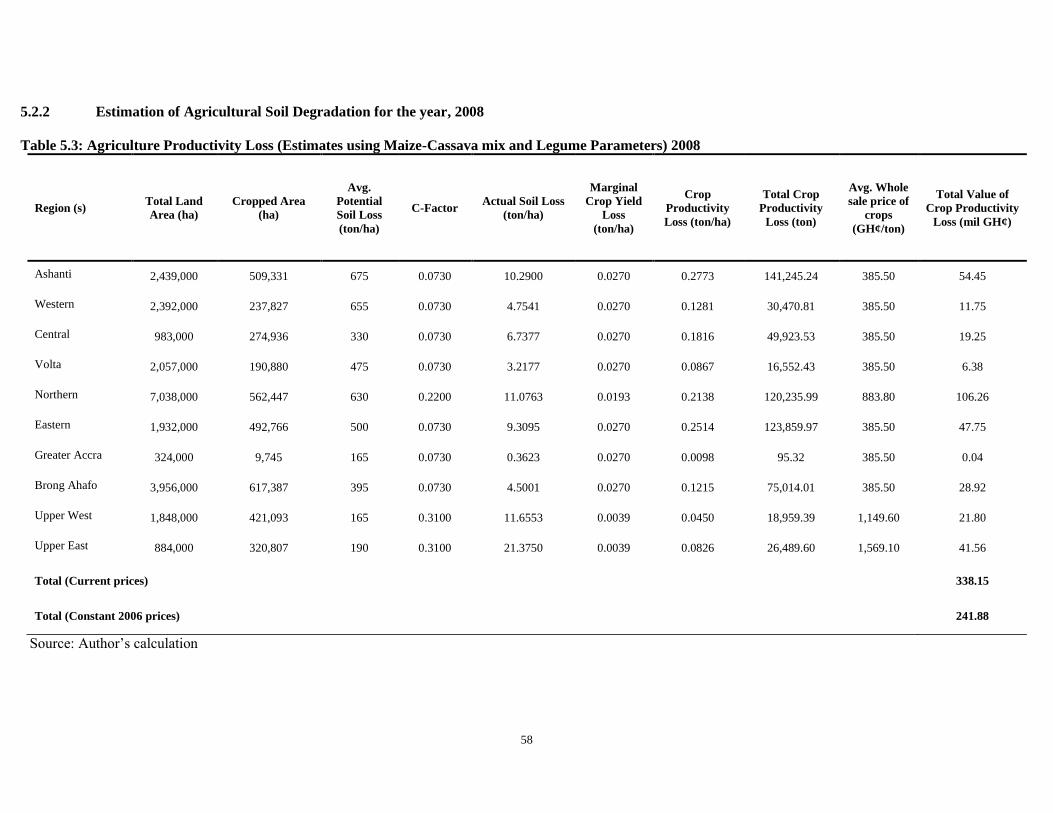
58
5.2.2 Estimation of Agricultural Soil Degradation for the year, 2008
Table 5.3: Agriculture Productivity Loss (Estimates using Maize-Cassava mix and Legume Parameters) 2008
Region (s) Total Land
Area (ha)
Cropped Area
(ha)
Avg.
Potential
Soil Loss
(ton/ha)
C-Factor Actual Soil Loss
(ton/ha)
Marginal
Crop Yield
Loss
(ton/ha)
Crop
Productivity
Loss (ton/ha)
Total Crop
Productivity
Loss (ton)
Avg. Whole
sale price of
crops
(GH¢/ton)
Total Value of
Crop Productivity
Loss (mil GH¢)
Ashanti 2,439,000 509,331 675 0.0730 10.2900 0.0270 0.2773 141,245.24 385.50 54.45
Western 2,392,000 237,827 655 0.0730 4.7541 0.0270 0.1281 30,470.81 385.50 11.75
Central 983,000 274,936 330 0.0730 6.7377 0.0270 0.1816 49,923.53 385.50 19.25
Volta 2,057,000 190,880 475 0.0730 3.2177 0.0270 0.0867 16,552.43 385.50 6.38
Northern 7,038,000 562,447 630 0.2200 11.0763 0.0193 0.2138 120,235.99 883.80 106.26
Eastern 1,932,000 492,766 500 0.0730 9.3095 0.0270 0.2514 123,859.97 385.50 47.75
Greater Accra 324,000 9,745 165 0.0730 0.3623 0.0270 0.0098 95.32 385.50 0.04
Brong Ahafo 3,956,000 617,387 395 0.0730 4.5001 0.0270 0.1215 75,014.01 385.50 28.92
Upper West 1,848,000 421,093 165 0.3100 11.6553 0.0039 0.0450 18,959.39 1,149.60 21.80
Upper East 884,000 320,807 190 0.3100 21.3750 0.0039 0.0826 26,489.60 1,569.10 41.56
Total (Current prices) 338.15
Total (Constant 2006 prices) 241.88
Source: Author’s calculation
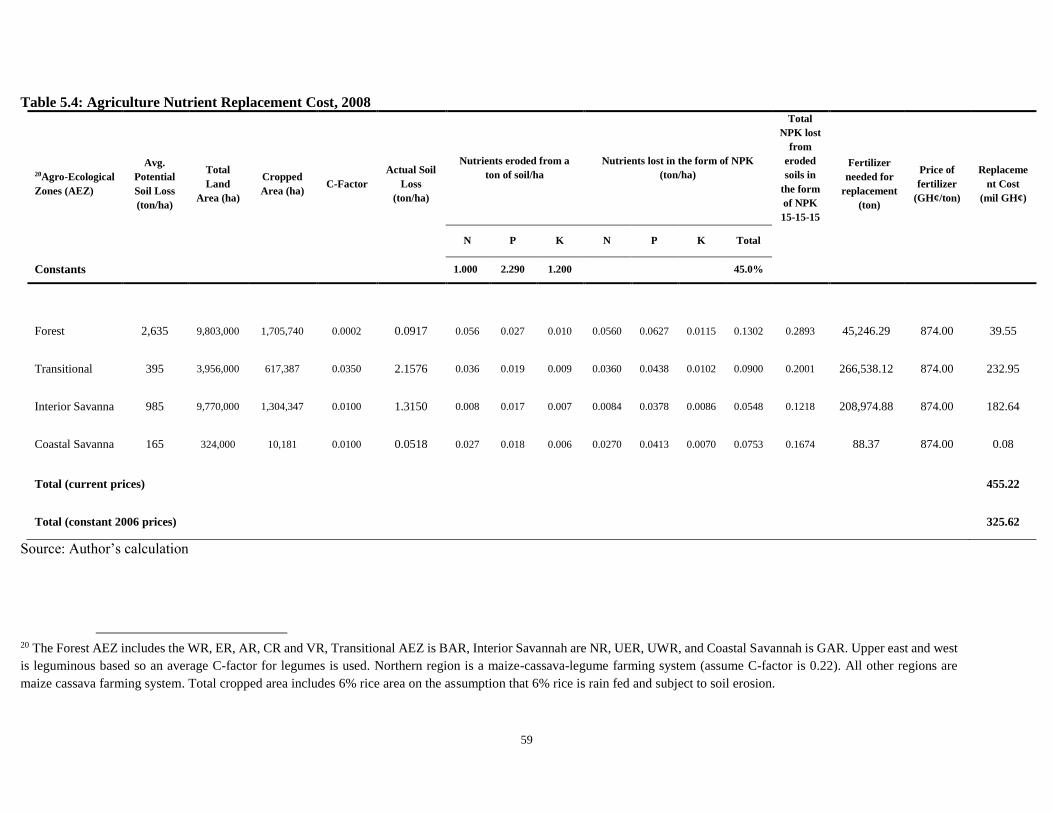
59
Table 5.4: Agriculture Nutrient Replacement Cost, 2008
20Agro-Ecological
Zones (AEZ)
Avg.
Potential
Soil Loss
(ton/ha)
Total
Land
Area (ha)
Cropped
Area (ha) C-Factor
Actual Soil
Loss
(ton/ha)
Nutrients eroded from a
ton of soil/ha
Nutrients lost in the form of NPK
(ton/ha)
Total
NPK lost
from
eroded
soils in
the form
of NPK
15-15-15
Fertilizer
needed for
replacement
(ton)
Price of
fertilizer
(GH¢/ton)
Replaceme
nt Cost
(mil GH¢)
N P K N P K Total
Constants 1.000 2.290 1.200 45.0%
Forest 2,635 9,803,000 1,705,740 0.0002 0.0917 0.056 0.027 0.010 0.0560 0.0627 0.0115 0.1302 0.2893 45,246.29 874.00 39.55
Transitional 395 3,956,000 617,387 0.0350 2.1576 0.036 0.019 0.009 0.0360 0.0438 0.0102 0.0900 0.2001 266,538.12 874.00 232.95
Interior Savanna 985 9,770,000 1,304,347 0.0100 1.3150 0.008 0.017 0.007 0.0084 0.0378 0.0086 0.0548 0.1218 208,974.88 874.00 182.64
Coastal Savanna 165 324,000 10,181 0.0100 0.0518 0.027 0.018 0.006 0.0270 0.0413 0.0070 0.0753 0.1674 88.37 874.00 0.08
Total (current prices) 455.22
Total (constant 2006 prices) 325.62
Source: Author’s calculation
20 The Forest AEZ includes the WR, ER, AR, CR and VR, Transitional AEZ is BAR, Interior Savannah are NR, UER, UWR, and Coastal Savannah is GAR. Upper east and west
is leguminous based so an average C-factor for legumes is used. Northern region is a maize-cassava-legume farming system (assume C-factor is 0.22). All other regions are
maize cassava farming system. Total cropped area includes 6% rice area on the assumption that 6% rice is rain fed and subject to soil erosion.

60
5.2.3 Estimation of Agricultural Soil Degradation for the year 2010
Table 5.5: Agriculture Productivity Loss (Estimates using Maize-Cassava mix and Legume Parameters) 2010
Region (s) Total Land
Area (ha)
Cropped Area
(ha)
Avg.
Potential
Soil Loss
(ton/ha)
C-Factor Actual Soil Loss
(ton/ha)
Marginal
Crop Yield
Loss
(ton/ha)
Crop
Productivity
Loss (ton/ha)
Total Crop
Productivity
Loss (ton)
Avg. Whole
sale price of
crops
(GH¢/ton)
Total Value of
Crop Productivity
Loss (mil GH¢)
Ashanti 2,439,000 476,005 675 0.0730 3.4878 0.0270 0.2592 123,366.33 413.70 51.04
Western 2,392,000 234,313 655 0.0730 12.8065 0.0270 0.1262 29,577.03 413.70 12.24
Central 983,000 259,841 330 0.0730 9.8927 0.0270 0.1716 44,592.05 413.70 18.45
Volta 2,057,000 206,902 475 0.0730 0.3945 0.0270 0.0940 19,447.79 413.70 8.05
Northern 7,038,000 650,306 630 0.2200 5.0811 0.0193 0.2472 160,733.65 1,195.80 192.21
Eastern 1,932,000 523,634 500 0.0730 13.0749 0.0270 0.2671 139,863.75 413.70 57.86
Greater Accra 324,000 10,611 165 0.0730 19.3517 0.0270 0.0107 113.02 413.70 0.05
Brong Ahafo 3,956,000 697,101 395 0.0730 3.4878 0.0270 0.1372 95,635.44 413.70 39.56
Upper West 1,848,000 472,384 165 0.3100 12.8065 0.0039 0.0505 23,859.36 1,569.10 37.44
Upper East 884,000 290,440 190 0.3100 9.8927 0.0039 0.0748 21,712.04 1,569.10 34.07
Total (Current prices) 450.95
Total (Constant 2006 prices) 237.59
Source: Author’s calculation
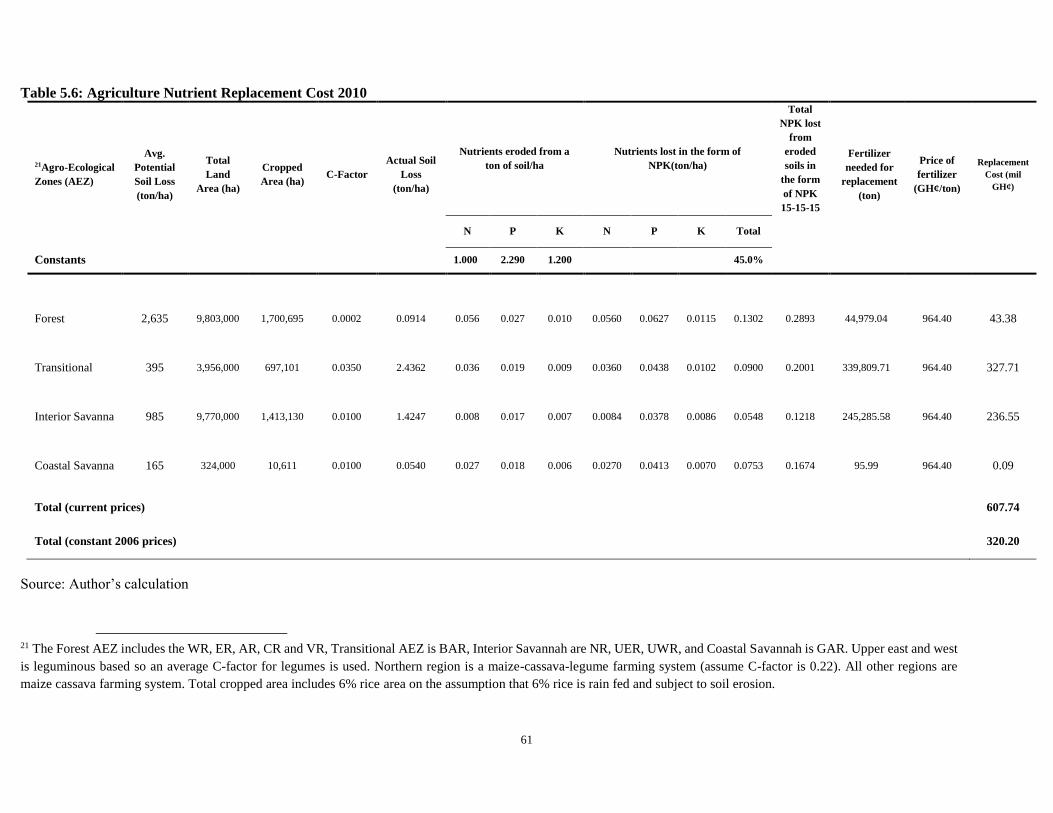
61
Table 5.6: Agriculture Nutrient Replacement Cost 2010
21Agro-Ecological
Zones (AEZ)
Avg.
Potential
Soil Loss
(ton/ha)
Total
Land
Area (ha)
Cropped
Area (ha) C-Factor
Actual Soil
Loss
(ton/ha)
Nutrients eroded from a
ton of soil/ha
Nutrients lost in the form of
NPK(ton/ha)
Total
NPK lost
from
eroded
soils in
the form
of NPK
15-15-15
Fertilizer
needed for
replacement
(ton)
Price of
fertilizer
(GH¢/ton)
Replacement
Cost (mil
GH¢)
N P K N P K Total
Constants 1.000 2.290 1.200 45.0%
Forest 2,635 9,803,000 1,700,695 0.0002 0.0914 0.056 0.027 0.010 0.0560 0.0627 0.0115 0.1302 0.2893 44,979.04 964.40 43.38
Transitional 395 3,956,000 697,101 0.0350 2.4362 0.036 0.019 0.009 0.0360 0.0438 0.0102 0.0900 0.2001 339,809.71 964.40 327.71
Interior Savanna 985 9,770,000 1,413,130 0.0100 1.4247 0.008 0.017 0.007 0.0084 0.0378 0.0086 0.0548 0.1218 245,285.58 964.40 236.55
Coastal Savanna 165 324,000 10,611 0.0100 0.0540 0.027 0.018 0.006 0.0270 0.0413 0.0070 0.0753 0.1674 95.99 964.40 0.09
Total (current prices) 607.74
Total (constant 2006 prices) 320.20
Source: Author’s calculation
21 The Forest AEZ includes the WR, ER, AR, CR and VR, Transitional AEZ is BAR, Interior Savannah are NR, UER, UWR, and Coastal Savannah is GAR. Upper east and west
is leguminous based so an average C-factor for legumes is used. Northern region is a maize-cassava-legume farming system (assume C-factor is 0.22). All other regions are
maize cassava farming system. Total cropped area includes 6% rice area on the assumption that 6% rice is rain fed and subject to soil erosion.

62
5.2.4 Estimation of Agricultural Soil Degradation for the year 2012
Table 5.7: Agriculture Productivity Loss (Estimates using Maize-Cassava mix and Legume Parameters) 2012
Region (s) Total Land
Area (ha)
Cropped Area
(ha)
Avg.
Potential
Soil Loss
(ton/ha)
C-Factor Actual Soil Loss
(ton/ha)
Marginal
Crop Yield
Loss
(ton/ha)
Crop
Productivity
Loss (ton/ha)
Total Crop
Productivity
Loss (ton)
Avg. Whole
sale price of
crops
(GH¢/ton)
Total Value of
Crop Productivity
Loss (mil GH¢)
Ashanti 2,439,000 486,286 675 0.0730 9.8244 0.0270 0.2648 128,752.93 740.53 95.35
Western 2,392,000 196,048 655 0.0730 3.9189 0.0270 0.1056 20,705.54 740.53 15.33
Central 983,000 250,431 330 0.0730 6.1372 0.0270 0.1654 41,420.78 740.53 30.67
Volta 2,057,000 191,777 475 0.0730 3.2328 0.0270 0.0871 16,708.37 740.53 12.37
Northern 7,038,000 754,989 630 0.2200 14.8681 0.0193 0.2870 216,646.92 2,503.60 542.40
Eastern 1,932,000 529,807 500 0.0730 10.0093 0.0270 0.2703 143,180.83 740.53 106.03
Greater Accra 324,000 10,300 165 0.0730 0.3829 0.0270 0.0103 106.49 740.53 0.08
Brong Ahafo 3,956,000 701,320 395 0.0730 5.1119 0.0270 0.1380 96,796.55 740.53 71.68
Upper West 1,848,000 459,453 165 0.3100 12.7170 0.0039 0.0491 22,570.99 3,186.30 71.92
Upper East 884,000 255,956 190 0.3100 17.0541 0.0039 0.0659 16,862.36 3,186.30 53.73
Total (Current prices) 999.56
Total (Constant 2006 prices) 411.51
Source: Author’s calculation

63
Table 5.8: Agriculture Nutrient Replacement Cost 2012
22Agro-Ecological
Zones (AEZ)
Avg.
Potential
Soil Loss
(ton/ha)
Total
Land
Area (ha)
Cropped
Area (ha) C-Factor
Actual Soil
Loss
(ton/ha)
Nutrients eroded from a
ton of soil/ha
Nutrients lost in the form of
NPK(ton/ha)
Total
NPK lost
from
eroded
soils in
the form
of NPK
15-15-15
Fertilizer
needed for
replacement
(ton)
Price of
fertilizer
(GH¢/ton)
Replacement
Cost (mil
GH¢)
N P K N P K Total
Constants 1.000 2.290 1.200 45.0%
Forest 2,635 9,803,000 1,654,349 0.0002 0.0889 0.056 0.027 0.010 0.0560 0.0627 0.0115 0.1302 0.2893 42,560.98 864.40 36.79
Transitional 395 3,956,000 701,320 0.0350 2.4509 0.036 0.019 0.009 0.0360 0.0438 0.0102 0.0900 0.2001 343,935.35 864.40 297.30
Interior Savanna 985 9,770,000 1,470,398 0.0100 1.4824 0.008 0.017 0.007 0.0084 0.0378 0.0086 0.0548 0.1218 265,569.14 864.40 229.56
Coastal Savanna 165 324,000 10,300 0.0100 0.0525 0.027 0.018 0.006 0.0270 0.0413 0.0070 0.0753 0.1674 90.44 864.40 0.08
Total (current prices) 563.72
Total (constant 2006 prices) 232.08
Source: Author’s calculation
22 The Forest AEZ includes the WR, ER, AR, CR and VR, Transitional AEZ is BAR, Interior Savannah are NR, UER, UWR, and Coastal Savannah is GAR. Upper east and
west is leguminous based so an average C-factor for legumes is used. Northern region is a maize-cassava-legume farming system (assume C-factor is 0.22). All other regions
are maize cassava farming system. Total cropped area includes 6% rice area on the assumption that 6% rice is rain fed and subject to soil erosion.

64
5.3 Summary and discussion of results
Table 5.9: Annual Estimates of the Cost of Productivity Loss and Nutrient Replacement
Productivity loss Nutrients replacement
Year (s) Current prices
(mil GH¢)
Constant 2006
prices (mil GH¢)
Current prices
(mil GH¢)
Constant 2006
prices (mil GH¢)
2006 209.73 209.73 234.62 234.62
2008 338.15 241.88 455.22 325.62
2010 450.95 237.59 607.74 320.20
2012 999.56 411.51 563.72 232.08
Table 5.10: Annual Cost of Agricultural Soil Degradation
Year (s)
Current
prices
(mil GH¢)
Constant
2006
prices (mil
GH¢)
Real
AgGDP
(mil GH¢)
Real cost as
a % of
AgGDP
Real GDP
(mil GH¢)
Real Cost
as a % of
Real GDP
2006 444.35 444.35 5,415.00 8.21 17,809.70 2.49
2008 793.37 567.50 5,716.00 9.93 20,343.90 2.79
2010 1,058.69 557.79 6,453.00 8.64 23,220.00 2.40
2012 1,563.28 643.59 6,657.00 9.67 28,825.00 2.23
The results in Table 5.10 show that between the year 2006 and 2008, the cost of agricultural soil degradation
increased from 444.35 to 567.50 million Ghana Cedis. This represents a 27.71% increase. The cost estimate
for 2012 (GH¢ 643.59 million) was the largest even though the year recorded the lowest as a percentage of
real GDP i.e. 2.3%. This can probably be explained by the huge average growth (i.e. about 11.5%) in Gross
Domestic Product over the period. The results also showed that agricultural soil degradation is pronounced in
the Northern region with respect to productivity losses for all the periods i.e. 2006, 2008, 2010 and 2012.

65
These figures represent very huge losses to the economy, especially the agricultural sector. The real cost of
soil degradation over the periods considered represent close to 10% of the total contribution of the sector to
national output. Perhaps, soil degradation is one of the factors that have eroded the gains of the sector in terms
of its contribution to GDP since the year 2006. In all, the estimates of this prove to be consistent with the
results of ISSER/DFID/World Bank, 2005 that estimated that the loss in annual GDP growth in Ghana due to
agricultural soil erosion and poor land management in crop production is 1.1–2.4 %.
5.4 Economic consequences of agricultural soil degradation
The loss in agricultural productivity has several indirect effects on the rest of the economy. The agricultural
sector’s demand for intermediates except fertilizers and pesticides decreases in relative significance, holding
back production in sectors producing intermediates as well. These reductions generate a decrease in income
that partially reduces private consumption and investments. Reduced supply of agricultural commodities due
to loss of productivity also increases the prices of these commodities.
Real GDP growth rate for 2008, 2010 and 2012 were 14.23%, 14.14% and 24.14% respectively. This puts the
average real GDP growth rate at approximately 17.5%, and the average Cost of Agricultural Soil Degradation
in constant 2006 prices at approximately 13.8% over the period. This presupposes that the rate of growth in
GDP would be higher on average in a low degradation scenario than it is for these periods.
5.5 Key policy interventions and recommendations
Sustainable Land Management (SLM) practices have broadly been used on a global scale to address and
mitigate the impacts of soil erosion. Sustainable Land Management is the adoption of land use systems that,
through appropriate management practices, enables land users to maximize the economic and social benefits
from the land while maintaining or enhancing the ecological support functions of the land resources (FAO,
2009).

66
In the area of agriculture, SLM includes the maintenance over time of soil productivity. This requires the
combination of soil fertility treatment including the application of mineral and organic fertilizers with soil and
water conservation measures (implementation of agronomic, soil management and physical measures, such as
contour ridging, terracing, tied ridges or providing ground cover through mulching, use of plants and leaving
crop residues).
SLM prioritizes different elements of this combination depending on the terrain, ecosystem, climate and land
use that determine the potential forms of degradation. It will always encompass all elements of farming; small
and large livestock, commercial and subsistence crops and agroforestry that impact on the ecosystem. Ghana
is currently implementing the Sustainable Land Management Programme for mitigating land degradation,
enhancing agricultural biodiversity and reducing poverty. It is thus essential that the programme is
implemented in a way that will cause the nation, particularly areas (the northern part of the country) that are
prone to degradation to reap the optimum benefits of the programme.
Some specific policy interventions and strategies that can address the issue of agricultural land degradation in
the country among others include:
i) Development of a long-term land conservation plan. These long-term plans need to be fashioned to
suit the exact needs and requirements of each region, and should be guided by three key principles;
improving land use, obtaining the participation of the land users and developing the necessary
institutional capacities and support.
ii) Review of policies that affect the economics of land use, and where necessary fine-tuning of these
policies to encourage productive and sustainable land use rather than destructive and unsustainable
agricultural practices.
iii) Creation of fiscal savings that provide opportunities to compensate farmers, who are often extremely
poor by relaxing subsidies on agricultural inputs and materials.

67
iv) Establishment of effective monitoring and evaluating systems that assesses and enforces regulations
on activities that result in negative environmental externalities at the expense of the welfare of society.
v) Increase investment and research in the development of technologies for sustainable agriculture. Soil
as a resource is semi non-renewable and it is thus essential to pursue strategies that ensure
sustainability.

68
CHAPTER 6
CONCLUSION AND WAY FORWARD
6.1 Conclusion
The magnitude and extent of agricultural soil degradation in Ghana is increasing on the average
with reference to the results and findings presented in the previous chapter. The agricultural sector
plays a very crucial role in Ghana’s economy, contributing substantially to output i.e. GDP,
employment and poverty reduction particularly among the rural population of the country. It is
therefore imperative that policies and strategies driving the sector address these problems to ensure
that gains made by the sector are not undermined by these negative environmental impacts.
This study has presented an estimated economic cost of agricultural soil degradation from 2006,
2008, 2010 and 2012. The study adopted the agricultural productivity loss and nutrient replacement
cost approaches in the estimation. Regional data i.e. total cropped area, total land area, potential
soil loss of agro-ecological zones, among others were used to estimate the cost of soil degradation.
The results indicate the steady in soil degradation in the agricultural sector over the periods
considered in the study. The cost of soil degradation is estimated at an average rate of 2.5% of real
GDP, which is consistent with the findings of similar studies. The estimation focused primarily on
the on-site effects of land degradation i.e. soil erosion, analysing the trade-offs between the costs
and gains forgone i.e. the opportunity cost.
6.2 Way forward
The cost of soil degradation also has implications for net farmer-income levels and the impact it
could have on the economy in terms of poverty reduction especially among the rural poor and the
northern part of the country where agricultural soil degradation is most severe. The inability of the
methodology used in the study to incorporate other off-site effects of soil erosion or degradation
might presuppose that the results are underestimated, and as such may not reflect the actual situation
69
on the ground in most of the regions. Notwithstanding this limitation, the findings of the study have
serious implications for agriculture in Ghana and make a compelling case for decision-makers and
other relevant stakeholders to adopt proactive measures to address the issue of soil degradation in
the agricultural sector.
It is hoped that the findings of the study will among others; raise awareness and inform decision-
makers and other stakeholders of the need to formulate policies and strategies that will promote
sustainable agriculture in Ghana for the well-being of the society and the environment.

70
ANNEXES
Annex 1: Major Environmental Problems in Ghana
Reg
ion
s/ K
ey E
nv
iron
men
tal
Issu
es
Was
te d
isp
osa
l &
man
agem
ent
Wat
er p
oll
uti
on
So
il E
rosi
on
Bu
sh f
ires
Air
Po
llu
tio
n
Def
ore
stat
ion
San
d &
Sto
ne
Win
nin
g
Bad
far
min
g f
acil
itie
s
Ille
gal
log
gin
g a
ctiv
itie
s
Inad
equ
ate
San
itar
y f
acil
itie
s
Ille
gal
Min
ing
Lan
d d
egra
dat
ion
Ch
arco
al P
rod
uct
ion
Cli
mat
e C
han
ge
Flo
od
ing
Inad
equ
ate
Wat
er S
up
ply
Po
or
dra
inag
e sy
stem
s
No
ise
Po
llu
tio
n/N
uis
ance
Bio
div
ersi
ty l
oss
Des
tru
ctio
n o
f W
ild
life
Ov
erg
razi
ng
Inv
asiv
e A
qu
atic
wee
ds
Des
tru
ctio
n o
f E
cosy
stem
s
Lan
dsl
ides
Qu
arry
ing
(V
ibra
tion
s)
Sea
Ero
sion
Set
tlem
ent
Ero
sio
n
Des
erti
fica
tio
n
Po
or
San
itat
ion
Po
or
toil
et f
acil
itie
s
Lo
ss o
f S
oil
fer
tili
ty
En
cro
ach
men
t o
n E
co-t
ou
rism
site
s
Sil
tati
on
Ashanti 17 21 12 13 12 20 12 15 11 3 12 12 9 5 5 8 8 3 2 0 1 0 0 0 0 0 0 0 7 7 0 0 0
Eastern 12 13 8 9 9 14 6 7 9 1 7 8 5 3 8 2 4 5 3 0 4 1 0 1 0 0 0 0 2 2 1 0 1
Volta 11 10 5 9 6 8 8 6 4 5 3 4 4 4 4 0 0 3 2 2 3 1 0 0 0 1 0 0 0 1 1 0 1
Greater
Accra 2 3 1 0 1 1 2 0 0 0 0 1 0 0 2 0 0 1 0 0 0 0 0 0 0 0 0 0 0 0 0 0 1
Western 7 6 3 1 5 4 2 0 3 1 4 4 1 1 1 0 0 0 0 1 0 1 1 0 0 0 1 0 2 1 0 1 0
Northern 12 8 3 9 4 11 8 8 2 5 1 5 9 2 1 0 0 1 0 1 9 0 0 0 0 0 0 0 0 0 0 0 1
Upper East 2 2 3 4 0 4 3 2 1 0 2 3 2 0 2 0 0 0 0 1 0 0 0 0 0 0 0 1 0 0 0 0 1
Upper West 0 0 2 4 2 3 3 1 2 0 0 3 5 2 1 0 0 0 1 0 3 0 0 0 0 0 0 0 0 0 0 0 0
Brong
Ahafo 9 6 3 10 6 5 3 7 9 0 2 6 6 2 1 0 0 2 0 3 0 0 0 0 0 0 0 0 2 0 0 0 0
Central 5 8 5 2 6 8 6 5 6 1 2 5 4 3 3 0 1 1 2 0 0 0 1 0 1 0 0 0 0 0 0 0 1
77 77 45 61 51 78 53 51 47 16 33 51 45 22 28 10 13 16 10 8 20 3 2 1 1 1 1 1 13 11 2 1 6
Source: Author’s analysis from SEA Reports of District Medium-Term Development Plans 2010-2013

71
Annex 2: Environmental Problems in Ghana
No. Nature of concern Causes Effects Indicators
1 Land degradation
Traditional farming methods
Bush fires
Clearing of watersheds
Sand and stone winning
Harvesting of firewood
Loss of top soil
Loss of biodiversity
Loss of medical plants
Siltation of rivers
Salination of soil
Area affected by erosion
Area affected by
salinization
Area of land
contamination
Area of water logging
2 Coastal erosion
Rising sea level
Sand wining on beaches
Harbor construction
Erosion of coast
Loss of spawning
% land loss to erosion
No of sand sites on beach
3 Pollution of water bodies
Mining activities
Indiscriminate waste disposal
Farming along river banks
Indiscriminate defecation
Damage to aquatic life
Poor water quality
Toxic water sources
Increase BOD in rivers
% loss in aquatic life
% faecal coliform in rivers
Use of agricultural
pesticide
4 Deforestation
Timber exploitation
Fuel wood extraction
Shifting cultivation
Bushfires
Loss of biodiversity
Drying of streams
Soil erosion
% loss of fauna, flora
% loss of forest land/year
Number of bushfire/year
Annual allowance Cut
5 Poor waste management
Human activities
Mining activities
Industrial activities
Agricultural activities
Increased soil toxicity
Poor water quality
Visual intrusion
Increase in diseases
Emerging diseases
Volume of types of waste
No of waste treatment
plants

72
No. Nature of concern Causes Effects Indicators
6 Risk from chemical use
Use of chemicals in fishing
Use of chemicals in hunting
Agrochemical/pesticides use
Industrial use of chemicals
Spillage from mining activities
Polluted water bodies
Polluted air
Increase crop toxicity
Death related to pesticides
Increase pesticides use
Level of pesticide in crops
Increase in pesticide
related disease
Chemical poisoning
7 Indoor air pollution
Use of charcoal and fuel wood
Use of insecticides
Use of mosquito coils
Smoking cigarettes
Poor air quality
Increase chest problems
Increase in coughs
Emission of CO2
Respiratory infections
Expenditure on air
pollution
8 Outdoor air pollution
Vehicular pollution
Industrial pollution
Dust from road construction
Release of methane
Stench from waste
Health problems increase
Poor air quality
Loss of flora and fauna
Emission of Nitrogen
oxide
Emission of CO2
Emission of Sulphur oxide
Air quality
Emission of GHG
9 Desertification
Climate change
Deforestation
Poor farming practices
Drying of local streams
Loss of livelihood
Erosion
Loss of vegetation cover
Increase in vegetation loss
Decrease in food
production
Loss of soil moisture
% loss of surface water
10 Large scale development
Mining activities
Factories near rivers
Building on waterways
Loss of arable land
Waste generation
Flooding in cities
Pollution levels of air,
water
Loss of aquatic life
Houses flooded annually
Source: Adapted from the SEA of GPRS, 2003 and Sustainable Development Indicators for Ghana

73
REFERENCES
Adama, A.I. (2003). The Effect of Different Tillage Practices on Soil Erosion, Water Conservation
and Yield of Maize in the Semi-Deciduous Forest Zone of Ghana. Unpublished M.Sc. Thesis.
Department of Crop and Soil Sciences, KNUST, Kumasi, Ghana
Adhikari, B.; Nadella, K. 2011. Ecological economics of soil erosion: a review of the current state
of knowledge. Annals of the New York Academy of Sciences 1219: 134-152.
Akyea, A.O. (2009). Effect of Different Land Preparation Methods on Erosion, Growth and Yield
of Cassava. Unpublished M.Sc. Thesis. Department of Crop and Soil Sciences, KNUST,
Kumasi, Ghana.
Alfsen K.M., T. Bye, S. Glomsrod, and H. Wiig. 1997. Soil Degradation and Economic
Development in Ghana. Environment and Development Economics 2: 119-143.
Andrews, S.S., Karlen, D.L., Mitchell, J.P., 2002. A comparison of soil quality indexing methods
for vegetable production systems in Northern California. Agriculture, Ecosystems &
Environment 90, 25– 45.
Asuming-Brempong, S., Botchie, G., Seini W. (2003). Socio Economic Analysis and the Roles of
Agriculture in Developing Countries. Country Case Study Ghana. FAO roles of Agriculture
Project, ISSER, University of Ghana, Legon.
Benneh, G., Agyepong, G.T. and Allotey, J.A. 1990. Land degradation in Ghana. Food Production
and Rural Development Division. Commonwealth Secretariat, Marlborough House. Pall Mall.
London.
Bennett, H.H. 1955. Elements of soil conservation. 2nd Ed. McGraw-Hill, New York, NY, USA.
Benson, V.W., Rice, O.W., Dyke, P.T., Williams, J.R. & Jones, C.A. (1989) Conservation impacts
on crop productivity for the life of the soil. Journal of Soil & Water Conservation (Nov-Dec)
601-604.
Bertol, I.; Cogo, N.P.; Schick, J.; Gudagnin, J.C.; Amaral, A.J. 2007. Financial aspects of nutrient
losses by water erosion in different soil management systems. Revista Brasileira de Ciência
do Solo 31: 133-142
Boardman, J., 1998. An average soil erosion rate for Europe: myth or reality? Journal of Soil and
Water Conservation 53, 46– 50.

74
Bonsu, M. and Quansah, C. (1992). The Importance of Soil Conservation for Agricultural and
Economic Development of Ghana. In Proceedings of the 12th and 13th Annual General
Meetings of the Soil Science Society of Ghana, Accra, Ghana. pp. 77-80.
Brady, N. C., and R. R. Weil. 1999. Soil erosion and its control. In the nature and properties of
soils. 12th Edition, pp. 680. Upper Saddle River, NJ: Prentice Hall Inc.
Clark, E.H. II 1985. The off-site costs of soil erosion. Journal of Soil and Water Conservation 40:
19-22.
Convery, F., and K. Tutu. 1990. Evaluating the Costs of Environmental Degradation: Ghana –
Applications of economics in the environmental action planning process in Africa. Dublin,
Ireland: University College of Dublin, Environmental Institute.
Crosson, P. 2007. Soil quality and agricultural development. p. 2911-2932. In: Evenson, R.;
Pingali, P., eds. Handbook of agricultural economics, v.3. Agricultural development: farmers,
farm production and farm markets. North-Holland, Amsterdam, Netherlands.
Cruz, W., Francisco, H.A. and Conway, Z.T. 1988. "The On-Site and Downstream Costs of Soil
Erosion in the Magat and Pantabangan Watersheds." Journal of Philippine Development
15(26, 1): 85-111.
Day, J.C., Hughes, D.W. & Butcher, W.R. (1992) Soil, water and crop management alternatives in
rainfed agriculture in the Sahel: an economic analysis. Agricultural Economics 7 262-287.
den Biggelaar, C., Lal, R., Wiebe, K. & Breneman, V. (2004a). The global impact of soil erosion
on productivity: I: Absolute and relative erosion-induced yield losses. In: Sparks, D. L. (Ed.)
Advances in Agronomy, pp. 1-48. Academic Press.
den Biggelaar, C., Lal, R., Wiebe, K., Eswaran, H., Breneman, V. & Reich, P. (2004b). The global
impact of soil erosion on productivity: II: Effects on crop yields and production over time. In:
Sparks, D. L. (Ed.) Advances in Agronomy, pp. 49-95. Academic Press.
Destombes, J., (1999). Nutrition and Economic Destitution in Northern Ghana, 1930 – 1959. A
Historical Perspective on Nutritional Economics.
Diao, X., & Sarpong, D. (2007). Cost implications of agricultural land degradation in Ghana: an
economy wide, multimarket model assessment. Retrieved from
http://pdf.usaid.gov/pdf_docs/pnads122.pdf

75
Dickson, K.B. and Benneh, G. 1988. A new geography of Ghana. Longman Group UK Limited.
Longman House, Burnt Mill, Harlow, Essex, England.
Douglas, M.G. 1994. Sustainable Use of Agricultural Soils. A Review of the Prerequisites for
Success or Failure. Development and Environment Reports No. 11, Group for Development
and Environment, Institute for Geography, University of Berne, Switzerland.
EEA, 2000. Down to earth: soil degradation and sustainable development in Europe. Environmental
Issues Series, vol. 16. European Environment Agency, Copenhagen, p. 32.
EPA (2002). National Programme to Combat Drought and Desertification. Accra.
FAO/UNDP/UNEP. 1994. Land Degradation in South Asia: Its Severity, Causes and Effects upon
the People. (World Soil Resources Report #78.) FAO, Rome.
Folly, A. (1997). Land Use Planning to Minimize Soil Erosion – A Case Study from the Upper East
Region in Ghana. Ph.D. thesis, Institute of Geography, University of Copenhagen.
http://www.omafra.gov.on.ca/english/engineer/facts/12-051.htm (Assessed on: 14th July, 2014)
ISSER/DFID/WB (2005). Economic Assessment of the Sustainability of Growth Dependent upon
Renewable Natural Resources, Ghana.
Lal, R. 2006. Managing soils for feeding a global population of 10 billion. Journal of the Science
of Food and Agriculture 86: 2273-2284.
Magrath, W. and Arens, P. 1989. The Costs of Soil Erosion on Java: A Natural Resource
Accounting Approach. Environment Department Working Paper No. 18. The World Bank,
Washington DC.
Mikesell F. R. 1992. Economic Development and the Environment: A comparison of Sustainable
Development with Conventional Development Economics. London: Mansell Publishing.
Miranowski, J.A. & Hammes, B.D. (1984). Implicit prices of soil characteristics for farm land in
Iowa. American Journal of Agricultural Economics (Dec) 745-749.
Muchena FN; Onduru DD; Gachini, G. N., and Jager, A. (2005). Turning the tides of soil
degradation in Africa: capturing the reality and exploring opportunities. Land Use Policy. 22:
23 – 31

76
Oldeman, L., R. Hakkeling, and W. Sombroek. 1990. “World map of the status of soil degradation,
an explanatory note.” International Soil Reference and Information Center, Wageningen. The
Netherlands and the United Nations Environmental Programme, Nairobi, Kenya.
Pimentel, D. 2000. Soil erosion and the threat to food security and the environment. Ecosystem
Health 6:221–226.
Pimentel, D.; Marklein, A.; Toth, M.A.; Karpoff, M.; Paul, G.S.; McCormack, R.; Kyriazis, J.;
Krueger, T. Food versus biofuels: Environmental and economic costs. Hum. Ecol. 2009, 37,
1–12.
Purvis, A., Hoehn, J.P., Sorenson, V.L. & Pierce, F.J. (1989) Farmers' response to a filter strip
program: results from a contingent valuation survey. Journal of Soil & Water Conservation
(Sept-Oct) 501-504.
Quansah, C. (1996) Soil, water and nutrient management needs for sustainable crop production.
Proceedings of DSE International Seminar on Tools for Analysis and Evaluation for
sustainable Land use in Rural Development. pp 38-46 DSE, Zscortan, Germany.
Quansah, C. (2000). Country Case Studies: Ghana. In: FAO (ed.), Integrated Soil Management for
Sustainable Agriculture and Food Security- Case Studies from 4 Countries in West Africa
(Burkina Faso, Ghana, Nigeria, and Senegal). FAO Regional Office for Africa, Accra, Ghana.
Quansah, C. (2001). Integrated Soil Management for Sustainable Agriculture and Food Security.
Country case study: Ghana. FAO Regional Office for Africa.
Quansah, C., Safo, E. Y., Ampontuah, E. O. and Amankwaah, A. S. (2000). Soil Fertility Erosion
and the Associated Cost of NPK Removal under Different Soil and Residue Management in
Ghana. Ghana Journal of Agriculture Science, 33(1): 33-42.
Richards, P. D., Myers, R. J., Swinton, S. M., & Walker, R. T. (2012). Exchange rates, soybean
supply response, and deforestation in South America. Global Environmental Change, 22(2),
454-462.
Roberts N (1994).The global environmental future. In: Roberts N (Ed) The changing global
environment. Blackwell, Oxford, pp 3–21.
Scherr, S.J. 1999. Soil Degradation: A Threat to Developing-Country Food Security by 2020?
International Food Policy Research Institute, Washington, DC.

77
Sparovek, G.; De Maria, I.C. 2003. Multiperspective analysis of erosion tolerance. Scientia
Agricola 60: 409-416.
Telles, T. S., Carmela, S., Dechen, F., Gustavo, L., Souza, A. De, & Guimarães, M. D. F. (2013).
Point of view, (June), 209–216.
Turner II, B.L., Hyden, G., Kates, R. (Eds.), 1993. Population Growth and Agricultural Change in
Africa. University Press of Florida, Gainesville.
UN (1997). Environmental degradation, glossary of environmental statistics, Studies in methods,
Series F, Number, 67.
Uri, N.D. 2001. The environmental implications of soil erosion in the United States. Environmental
Monitoring and Assessment 66: 293-312.
Wiebe, K. (2003.). Linking Land Quality, Agricultural Productivity, and Food Security, (823).
World Bank, ISSER, DFID. (2005). Natural Resource Management and Growth Sustainability.
Africa Region. Washington D.C: World Bank.