the economic effects of war and peace - world … · mena quarterly economic brief . the economic...
TRANSCRIPT

MENA QUARTERLY ECONOMIC BRIEF
THE ECONOMIC EFFECTS OF
WAR AND PEACE
Issue 6 January 2016
WORLD BANK MIDDLE EAST AND NORTH AFRICA REGION
103013P
ublic
Dis
clos
ure
Aut
horiz
edP
ublic
Dis
clos
ure
Aut
horiz
edP
ublic
Dis
clos
ure
Aut
horiz
edP
ublic
Dis
clos
ure
Aut
horiz
ed

-
WORLD BANK MIDDLE EAST AND NORTH AFRICA REGION
MENA QUARTERLY ECONOMIC BRIEF
THE ECONOMIC EFFECTS OF
WAR AND PEACE

© 2016 International Bank for Reconstruction and Development /The World Bank 1818 H Street NW, Washington DC 20433 Telephone: 202-473-1000; Internet: www.worldbank.org
Some rights reserved
1 2 3 4 18 17 16
This work is a product of the staff of The World Bank with external contributions. The findings, interpretations, and conclusions expressed in this work do not necessarily reflect the views of The World Bank, its Board of Executive Directors, or the governments they represent. The World Bank does not guarantee the accuracy of the data included in this work. The boundaries, colors, denominations, and other information shown on any map in this work do not imply any judgment on the part of The World Bank concerning the legal status of any territory or the endorsement or acceptance of such boundaries.
Nothing herein shall constitute or be considered to be a limitation upon or waiver of the privileges and immunities of The World Bank, all of which are specifically reserved.
Rights and Permissions
This work is available under the Creative Commons Attribution 3.0 IGO license (CC BY 3.0 IGO) http://creativecommons.org/licenses/by/3.0/igo. Under the Creative Commons Attribution license, you are free to copy, distribute, transmit, and adapt this work, including for commercial purposes, under the following conditions:
Attribution—Please cite the work as follows: Shanta Devarajan, Lili Mottaghi. 2016 “The Economic Effects of War
and Peace” Middle East and North Africa Quarterly Economic Brief, (January), World Bank, Washington, DC.
Doi: 10.1596/978-1-4648-0822-7 License: Creative Commons Attribution CC BY 3.0 License: Creative Commons
Attribution CC BY 3.0 IGO
Translations—If you create a translation of this work, please add the following disclaimer along with the attribution: This translation was not created by The World Bank and should not be considered an official World Bank translation. The World Bank shall not be liable for any content or error in this translation.
Adaptations—If you create an adaptation of this work, please add the following disclaimer along with the attribution: This is an adaptation of an original work by The World Bank. Responsibility for the views and opinions expressed in the adaptation rests solely with the author or authors of the adaptation and are not endorsed by The World Bank.
Third-party content—The World Bank does not necessarily own each component of the content contained within the work. The World Bank therefore does not warrant that the use of any third-party-owned individual component or part contained in the work will not infringe on the rights of those third parties. The risk of claims resulting from such infringement rests solely with you. If you wish to re-use a component of the work, it is your responsibility to determine whether permission is needed for that re-use and to obtain permission from the copyright owner. Examples of components can include, but are not limited to, tables, figures, or images.
All queries on rights and licenses should be addressed to the Publishing and Knowledge Division, The World Bank, 1818 H Street NW, Washington, DC 20433, USA; fax: 202-522-2625; e-mail: [email protected].
ISBN (electronic): 978-1-4648-0822-7
DOI: 10.1596/978-1-4648-0822-7
Cover photo: ©iStock.
The cutoff date for the data used in this report was January 19, 2016.

WORLD BANK MIDDLE EAST AND NORTH AFRICA REGION
MENA QUARTERLY ECONOMIC BRIEF
THE ECONOMIC EFFECTS OF
WAR AND PEACE
ACKNOWLEDGEMENTS
The MENA Quarterly Economic Brief is a product of the Chief Economist’s Office
of the Middle East and North Africa (MENA) Region of the World Bank. It
supplements the World Bank’s semi-annual MENA Economic Monitor with a real-
time review, using high-frequency data, of selected countries or issues in the
MENA region.
The report was prepared by Lili Mottaghi, under the guidance of Shanta
Devarajan. Elena Ianchovichina, Hideki Matsunaga, and Youssouf Kiendrebeogo
provided inputs and Sahar Sajjad Hussain provided country data. We thank
Radwan Shaban, Elena Ianchovichina, and Hideki Matsunaga for their comments
on the earlier version of the report. Isabelle Chaal-Dabi provided excellent
administrative support.


CONTENTS
RECENT ECONOMIC DEVELOPMENTS AND PROSPECTS 1
Global economy 1
MENA economies 3
THE ECONOMIC EFFECTS OF WAR 9
Damages to Physical Capital 10
Damages to Human Capital 12
Forced Displacement Crises 15
Living Conditions of Refugees and IDPs 18
THE ECONOMIC EFFECTS OF PEACE 19
The Democracy Dividend 20
ANNEX 24
REFERENCES 28
BOX
Box 1. Public expenditure reforms in MENA countries 7
FIGURES
Figure 1. Global economy 1
Figure 2. Volatility in oil prices 2
Figure 3. MENA economic outlook 3
Figure 4. Tourist arrivals in North Africa 5
Figure 5. Status of education 13
Figure 6. Estimate of refugees and IDPs (Thousands) 15
Figure 7. Yemen IDPs crisis 17
Figure 8. Syrian refugees living condition in Lebanon and Jordan 18
Figure 9. Democracy trends 22
Figure 10. Growth effect of permanent transitions 23
TABLES
Table 1. Macroeconomic indicators 8
Table 2. Syria estimated affected population 14
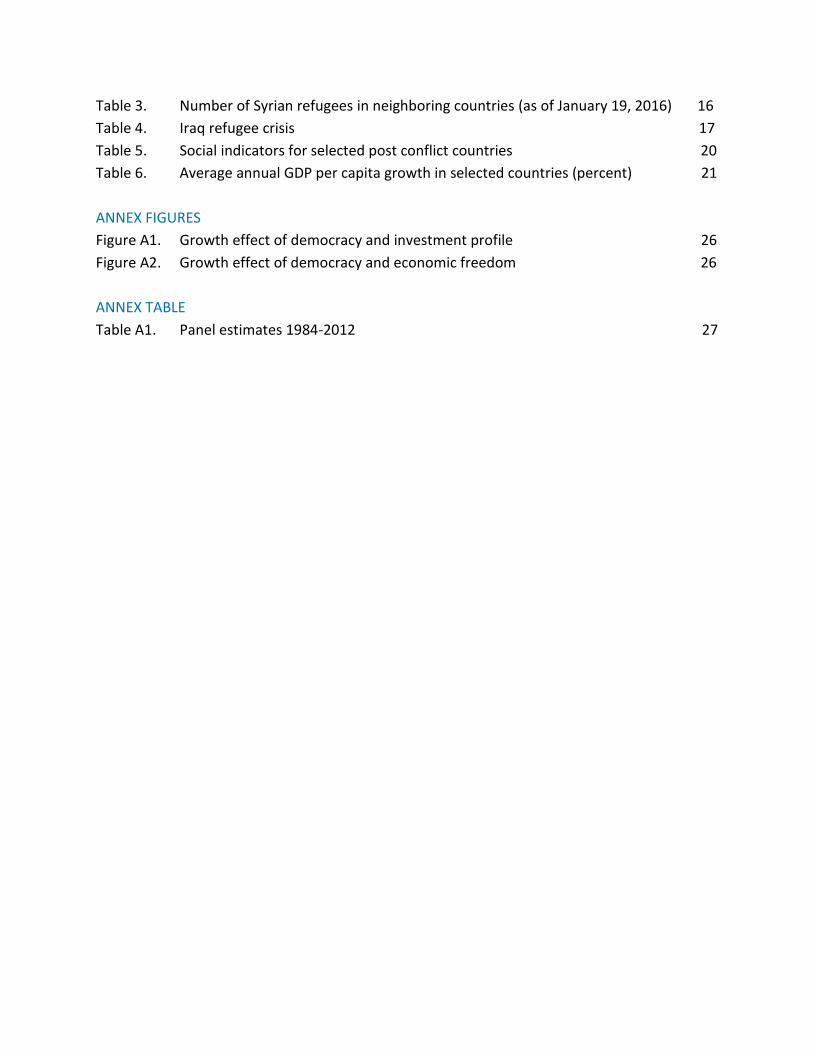
Table 3. Number of Syrian refugees in neighboring countries (as of January 19, 2016) 16
Table 4. Iraq refugee crisis 17
Table 5. Social indicators for selected post conflict countries 20
Table 6. Average annual GDP per capita growth in selected countries (percent) 21
ANNEX FIGURES
Figure A1. Growth effect of democracy and investment profile 26
Figure A2. Growth effect of democracy and economic freedom 26
ANNEX TABLE
Table A1. Panel estimates 1984-2012 27
ABBREVIATIONS
CIFP Country Indicators for Foreign Policy
ESCWA United Nations Economic and Social Commission for Western Asia
EIA US Energy Information Administration
GCC Gulf Cooperation Council
GDP Gross Domestic Product
GDP PC Gross Domestic Product Per Capita
GNP
IFRC
Gross National Product
International Federation of Red Cross and Red Crescent Societies
ICRG International Country Risk Guide
IDPs Internally Displaced Persons
IEA
IOM
International Energy Agency
International Organization for Migration
ILO International Labor Organization
IMF International Monetary Fund
MDGs Millennium Development Goals
MENA Middle East and North Africa
NGOs Non-Governmental Organizations
NIOC National Iranian Oil Company
OCHA United Nations Office for the Coordination of Humanitarian Affairs
p/b Per Barrel
SCPR Syrian Center for Policy Research
UN
UNDP
United Nations
United Nations Development Program
UNHCR United Nations Refugee Agency
UNICEF United Nations Children's Fund
UNOCHA United Nations Office for the Coordination of Humanitarian Affairs
UNRWA United Nations Relief and Works Agency
UNWTO United Nations World Tourism Organization
USD
VAT
United States Dollar
Value Added Tax
WEO World Economic Outlook
WFP World Food Programme

MENA QUARTERLY ECONOMIC BRIEF | ISSUE 6 | JANUARY 2016 1
RECENT ECONOMIC DEVELOPMENTS AND PROSPECTS
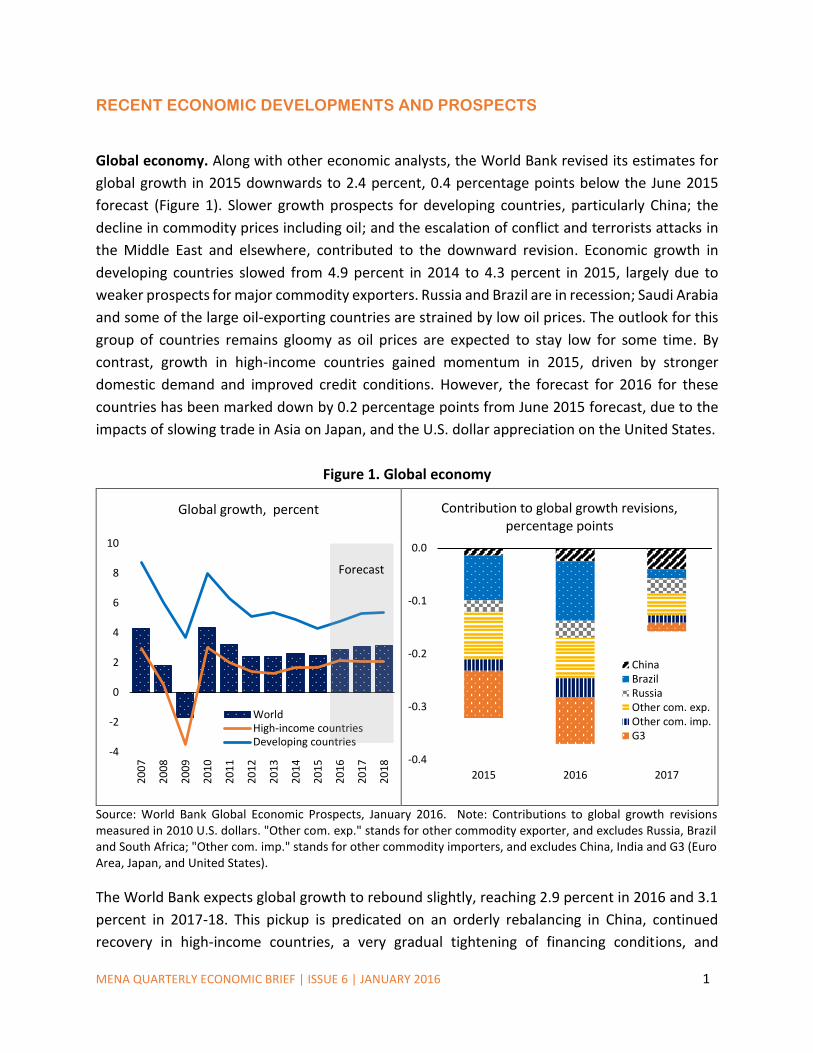
Global economy. Along with other economic analysts, the World Bank revised its estimates for
global growth in 2015 downwards to 2.4 percent, 0.4 percentage points below the June 2015
forecast (Figure 1). Slower growth prospects for developing countries, particularly China; the
decline in commodity prices including oil; and the escalation of conflict and terrorists attacks in
the Middle East and elsewhere, contributed to the downward revision. Economic growth in
developing countries slowed from 4.9 percent in 2014 to 4.3 percent in 2015, largely due to
weaker prospects for major commodity exporters. Russia and Brazil are in recession; Saudi Arabia
and some of the large oil-exporting countries are strained by low oil prices. The outlook for this
group of countries remains gloomy as oil prices are expected to stay low for some time. By
contrast, growth in high-income countries gained momentum in 2015, driven by stronger
domestic demand and improved credit conditions. However, the forecast for 2016 for these
countries has been marked down by 0.2 percentage points from June 2015 forecast, due to the
impacts of slowing trade in Asia on Japan, and the U.S. dollar appreciation on the United States.
Figure 1. Global economy
Source: World Bank Global Economic Prospects, January 2016. Note: Contributions to global growth revisions measured in 2010 U.S. dollars. "Other com. exp." stands for other commodity exporter, and excludes Russia, Brazil and South Africa; "Other com. imp." stands for other commodity importers, and excludes China, India and G3 (Euro Area, Japan, and United States).
The World Bank expects global growth to rebound slightly, reaching 2.9 percent in 2016 and 3.1
percent in 2017-18. This pickup is predicated on an orderly rebalancing in China, continued
recovery in high-income countries, a very gradual tightening of financing conditions, and
Global growth, percent
Contribution to global growth revisions, percentage points
-4
-2
0
2
4
6
8
10
20
07
20
08
20
09
20
10
20
11
20
12
20
13
20
14
20
15
20
16
20
17
20
18
WorldHigh-income countriesDeveloping countries
Forecast
-0.4
-0.3
-0.2
-0.1
0.0
2015 2016 2017
ChinaBrazilRussiaOther com. exp.Other com. imp.G3
MENA QUARTERLY ECONOMIC BRIEF | ISSUE 6 | JANUARY 2016 2
stabilization of commodity prices. A slowdown in activity in major emerging and developing
economies, expectations about the future trajectory of U.S. interest rates’ slowing capital flows
globally, and lower-than-expected commodity prices are major risks to this outlook.
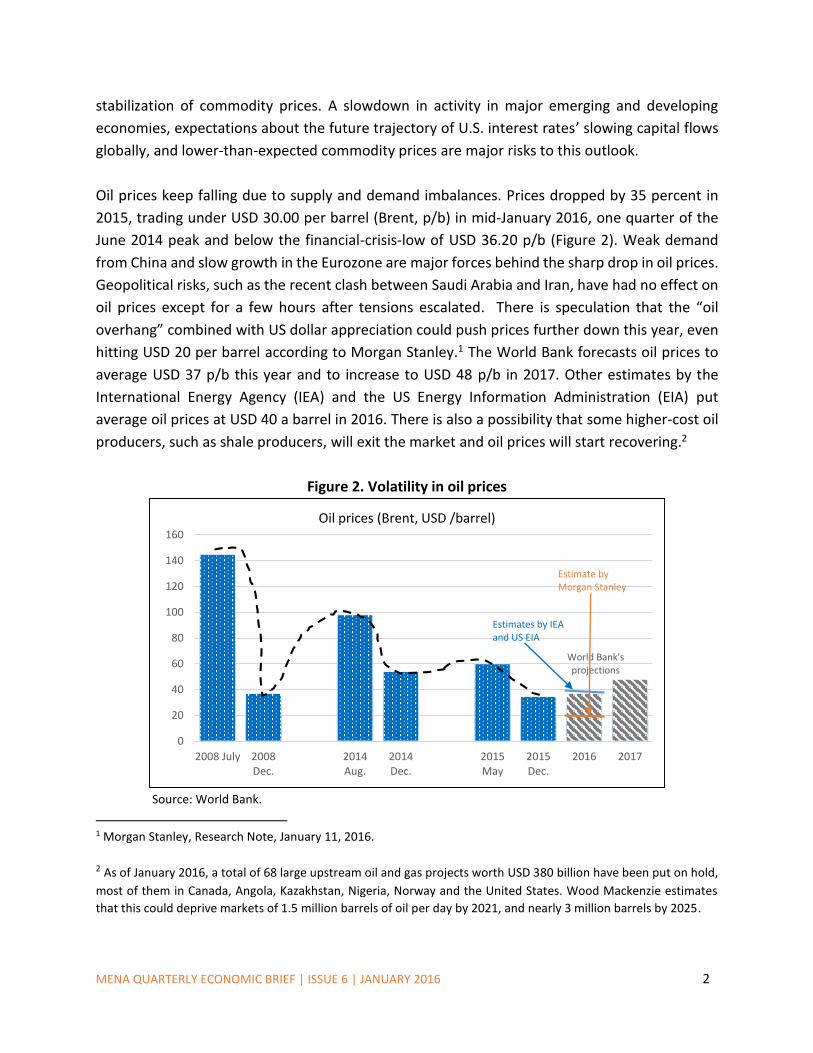
Oil prices keep falling due to supply and demand imbalances. Prices dropped by 35 percent in
2015, trading under USD 30.00 per barrel (Brent, p/b) in mid-January 2016, one quarter of the
June 2014 peak and below the financial-crisis-low of USD 36.20 p/b (Figure 2). Weak demand
from China and slow growth in the Eurozone are major forces behind the sharp drop in oil prices.
Geopolitical risks, such as the recent clash between Saudi Arabia and Iran, have had no effect on
oil prices except for a few hours after tensions escalated. There is speculation that the “oil
overhang” combined with US dollar appreciation could push prices further down this year, even
hitting USD 20 per barrel according to Morgan Stanley.1 The World Bank forecasts oil prices to
average USD 37 p/b this year and to increase to USD 48 p/b in 2017. Other estimates by the
International Energy Agency (IEA) and the US Energy Information Administration (EIA) put
average oil prices at USD 40 a barrel in 2016. There is also a possibility that some higher-cost oil
producers, such as shale producers, will exit the market and oil prices will start recovering.2
Figure 2. Volatility in oil prices
Source: World Bank.
1 Morgan Stanley, Research Note, January 11, 2016.
2 As of January 2016, a total of 68 large upstream oil and gas projects worth USD 380 billion have been put on hold,
most of them in Canada, Angola, Kazakhstan, Nigeria, Norway and the United States. Wood Mackenzie estimates
that this could deprive markets of 1.5 million barrels of oil per day by 2021, and nearly 3 million barrels by 2025.
0
20
40
60
80
100
120
140
160
2008 July 2008Dec.
2014Aug.
2014Dec.
2015May
2015Dec.
2016 2017
World Bank's projections
Oil prices (Brent, USD /barrel)
Estimates by IEA and US EIA
Estimate by Morgan Stanley
MENA QUARTERLY ECONOMIC BRIEF | ISSUE 6 | JANUARY 2016 3
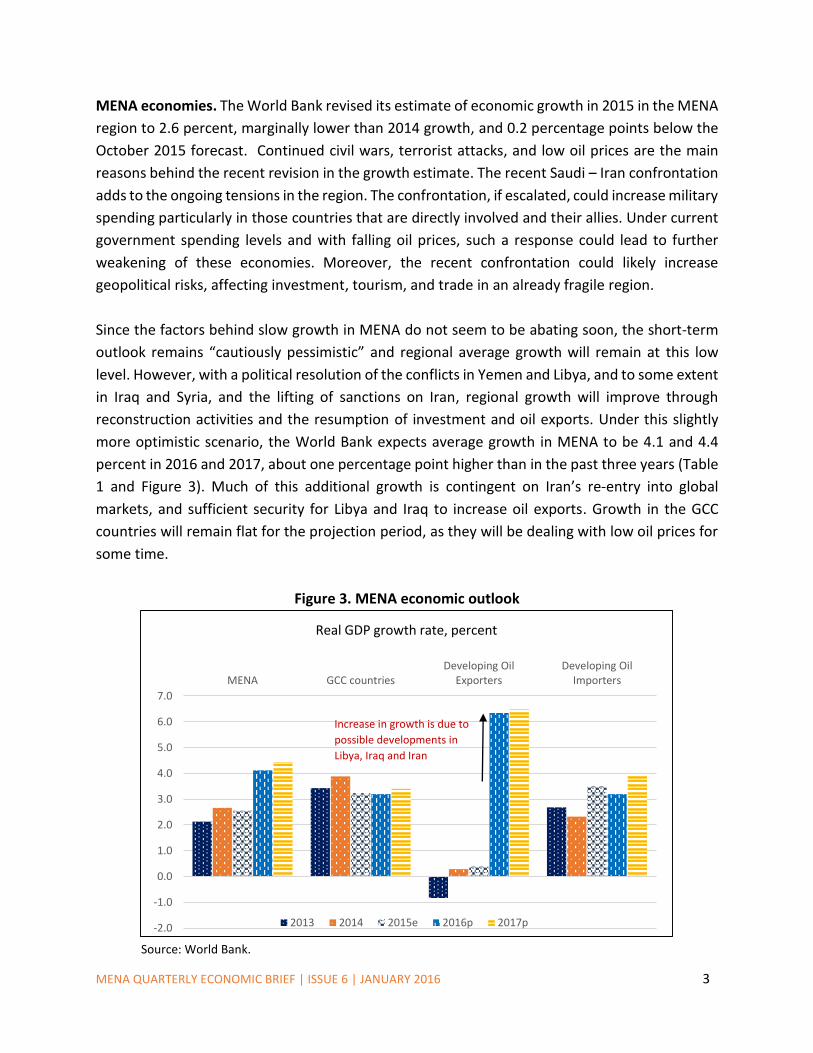
MENA economies. The World Bank revised its estimate of economic growth in 2015 in the MENA
region to 2.6 percent, marginally lower than 2014 growth, and 0.2 percentage points below the
October 2015 forecast. Continued civil wars, terrorist attacks, and low oil prices are the main
reasons behind the recent revision in the growth estimate. The recent Saudi – Iran confrontation
adds to the ongoing tensions in the region. The confrontation, if escalated, could increase military
spending particularly in those countries that are directly involved and their allies. Under current
government spending levels and with falling oil prices, such a response could lead to further
weakening of these economies. Moreover, the recent confrontation could likely increase
geopolitical risks, affecting investment, tourism, and trade in an already fragile region.
Since the factors behind slow growth in MENA do not seem to be abating soon, the short-term
outlook remains “cautiously pessimistic” and regional average growth will remain at this low
level. However, with a political resolution of the conflicts in Yemen and Libya, and to some extent
in Iraq and Syria, and the lifting of sanctions on Iran, regional growth will improve through
reconstruction activities and the resumption of investment and oil exports. Under this slightly
more optimistic scenario, the World Bank expects average growth in MENA to be 4.1 and 4.4
percent in 2016 and 2017, about one percentage point higher than in the past three years (Table
1 and Figure 3). Much of this additional growth is contingent on Iran’s re-entry into global
markets, and sufficient security for Libya and Iraq to increase oil exports. Growth in the GCC
countries will remain flat for the projection period, as they will be dealing with low oil prices for
some time.
Figure 3. MENA economic outlook
Source: World Bank.
-2.0
-1.0
0.0
1.0
2.0
3.0
4.0
5.0
6.0
7.0
MENA GCC countriesDeveloping Oil
ExportersDeveloping Oil
Importers
Real GDP growth rate, percent
2013 2014 2015e 2016p 2017p
Increase in growth is due to
possible developments in
Libya, Iraq and Iran
MENA QUARTERLY ECONOMIC BRIEF | ISSUE 6 | JANUARY 2016 4
MENA’s oil importers have not been able to take full advantage of low oil prices because they are
facing either the spillover effects of the civil wars and conflicts in the region or the insecurity
caused by terrorist attacks (or both). Jordan and Lebanon who, along with Turkey3, are bearing
the global responsibility of hosting Syrian refugees, are facing tremendous fiscal pressures (see
next section). Jordan hosts more than 630,000 registered Syrian refugees. In Lebanon, refugees
account for one-quarter of the population. Unemployment rates in Jordan increased to 12.5
percent in the first half of 2015 compared to 11.4 percent during the same period in 20144.
Increased insecurity and uncertainty have lowered foreign and domestic investment in both
countries. In Jordan, investment as a share of GDP declined to an estimated 27.4 percent in 2015
from its peak of 28.1 percent in 2013. In Lebanon, the main growth-generating sectors—tourism,
real estate, and construction—have taken a big hit. These factors are expected to keep growth
between 2.5 - 3.8 percent in 2016 and 2017 for both countries, well below their potential.
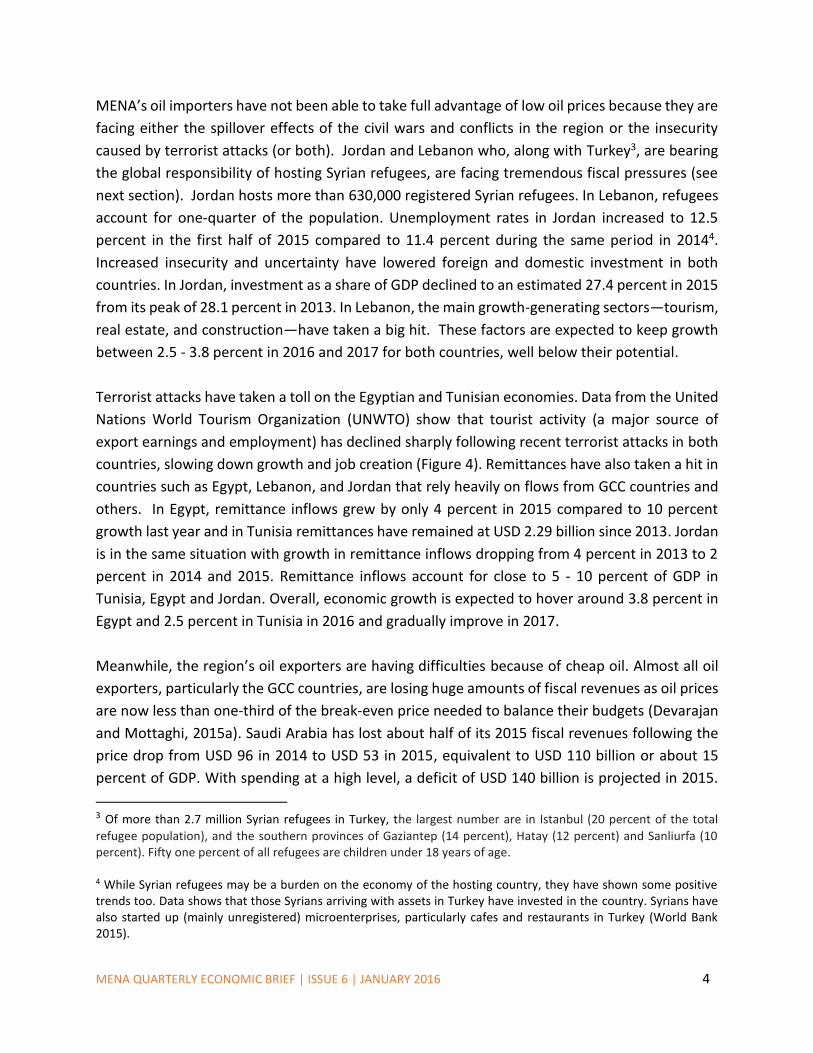
Terrorist attacks have taken a toll on the Egyptian and Tunisian economies. Data from the United
Nations World Tourism Organization (UNWTO) show that tourist activity (a major source of
export earnings and employment) has declined sharply following recent terrorist attacks in both
countries, slowing down growth and job creation (Figure 4). Remittances have also taken a hit in
countries such as Egypt, Lebanon, and Jordan that rely heavily on flows from GCC countries and
others. In Egypt, remittance inflows grew by only 4 percent in 2015 compared to 10 percent
growth last year and in Tunisia remittances have remained at USD 2.29 billion since 2013. Jordan
is in the same situation with growth in remittance inflows dropping from 4 percent in 2013 to 2
percent in 2014 and 2015. Remittance inflows account for close to 5 - 10 percent of GDP in
Tunisia, Egypt and Jordan. Overall, economic growth is expected to hover around 3.8 percent in
Egypt and 2.5 percent in Tunisia in 2016 and gradually improve in 2017.
Meanwhile, the region’s oil exporters are having difficulties because of cheap oil. Almost all oil
exporters, particularly the GCC countries, are losing huge amounts of fiscal revenues as oil prices
are now less than one-third of the break-even price needed to balance their budgets (Devarajan
and Mottaghi, 2015a). Saudi Arabia has lost about half of its 2015 fiscal revenues following the
price drop from USD 96 in 2014 to USD 53 in 2015, equivalent to USD 110 billion or about 15
percent of GDP. With spending at a high level, a deficit of USD 140 billion is projected in 2015.
3 Of more than 2.7 million Syrian refugees in Turkey, the largest number are in Istanbul (20 percent of the total
refugee population), and the southern provinces of Gaziantep (14 percent), Hatay (12 percent) and Sanliurfa (10 percent). Fifty one percent of all refugees are children under 18 years of age. 4 While Syrian refugees may be a burden on the economy of the hosting country, they have shown some positive trends too. Data shows that those Syrians arriving with assets in Turkey have invested in the country. Syrians have also started up (mainly unregistered) microenterprises, particularly cafes and restaurants in Turkey (World Bank 2015).
MENA QUARTERLY ECONOMIC BRIEF | ISSUE 6 | JANUARY 2016 5
Public debt is estimated to grow considerably reaching 20 percent of GDP in Saudi Arabia for
2017, ten times its level of 2.2 percent of GDP in 2013. Foreign reserves are estimated to have
dropped by USD 96 billion in 2015 and to drop even more next year.
Figure 4. Tourist arrivals in North Africa
Source: United Nations World Tourism Organization (UNWTO).
If prices remain at around USD 30-35 p/b this year, these countries will lose compared to their
budgeted revenues. Saudi Arabia will lose another USD 55 billion, about one fourth of its fiscal
revenues in 2016. Iraq is estimated to lose more than a total of USD 40 billion in 2015 and 2016.
Some of these countries have been eyeing fuel subsidy reform to bring their spending under
control (Box 1). Nevertheless, government spending remains high as large parts of the population
work for the government and receive multiple benefits. In Saudi Arabia, for example, the pubic-
sector wage bill reached an unprecedented 18 percent of GDP in 2015, due to two extra months
of bonus salaries; this figure is expected to come down in 2016.
The richest oil exporters in the region, Saudi Arabia, Qatar, Kuwait and UAE, have large reserves
that will enable them to run deficits over the coming years, although not far beyond that. The
World Bank estimates that at current levels of spending, and an oil price of USD 40 per barrel,
Saudi Arabia will exhaust its reserves by the end of the decade. At this level of spending and
without any policy changes, GCC and other oil exporters face budgetary deficits reaching 9.4
percent of GDP in 2015 (Table 1).
-20
-15
-10
-5
0
5
10
15
14Q1 14Q2 14Q3 14Q4 15Q1 15Q2 15-Aug 2015 YTD
Percentage change in tourist arrivals over previous period
MENA QUARTERLY ECONOMIC BRIEF | ISSUE 6 | JANUARY 2016 6
For 2016 and 17, there may be some improvements in the budgetary situation given their policies
to reduce subsidies and cut spending (Box 1). However, while fiscal tightening could help these
countries cope with the impact of low oil prices, it may be a drag on real GDP growth next year.
Four of the developing oil exporters are mired in civil war or major conflict. Growth in these
countries--Syria, Yemen, Libya and Iraq—is not expected to rebound soon, unless there is a peace
settlement (Table 1). Furthermore, falling oil prices have severely hit these economies and all
are running high fiscal deficits. Libya stands out with a fiscal deficit of over 55.2 percent of GDP.
Civil war has badly damaged the Syrian economy. Official data are not available, but estimates
from the Syrian Center for Policy Research (SCPR) puts the fiscal deficit at 40.5 percent in 2014
with public debt growing to an unprecedented 147 percent of GDP in the fourth quarter of 2014.
Iraq, too, is facing high fiscal deficits. The drop in oil prices together with the high cost of fighting
ISIS have resulted in a fiscal deficit of 14.5 percent of GDP in 2015. Growth is estimated to have
remained below 1 percent in 2015. Given the ongoing violence and conflict, the economic
outlook for both countries remains bleak. The fiscal situation will remain fragile in both countries
due to weak oil prices and rising humanitarian and security expenses, together with the forced
displacement crisis (see next section).
The political situation in Libya is fragile and economic activity weak. There are signs that a peace
agreement between the two rival parliaments in Libya could be reached in the next few months.
This would give a boost to Libyan oil exports, as two stalled ports that accounted for almost 50
percent of the country’s crude oil exports could resume operations. While benefitting the Libyan
economy (see Table 1), the increase in oil exports will likely push international oil prices further
down. Libya has the potential to produce up to 1.8 million barrels of oil per day but its output has
dropped to one third after the conflict.
The situation in Yemen remains extremely fragile. Despite a ceasefire announced in early
December 2015 for a short period, civil war has led to an almost complete halt in oil and gas
production in a country that relies almost exclusively on oil export revenues. The economy has
shrunk by a quarter and lack of basic services have further exacerbated human suffering. Fiscal
and external positions have worsened and public debt is estimated to have reached 74 percent
of GDP in 2015, 20 percentage points above last year. Inflation doubled, reaching 21 percent in
2015. International reserves reached a record low of USD 3 billion in 2015 and are estimated to
drop to USD 2.2 billion in 2016.
MENA QUARTERLY ECONOMIC BRIEF | ISSUE 6 | JANUARY 2016 7
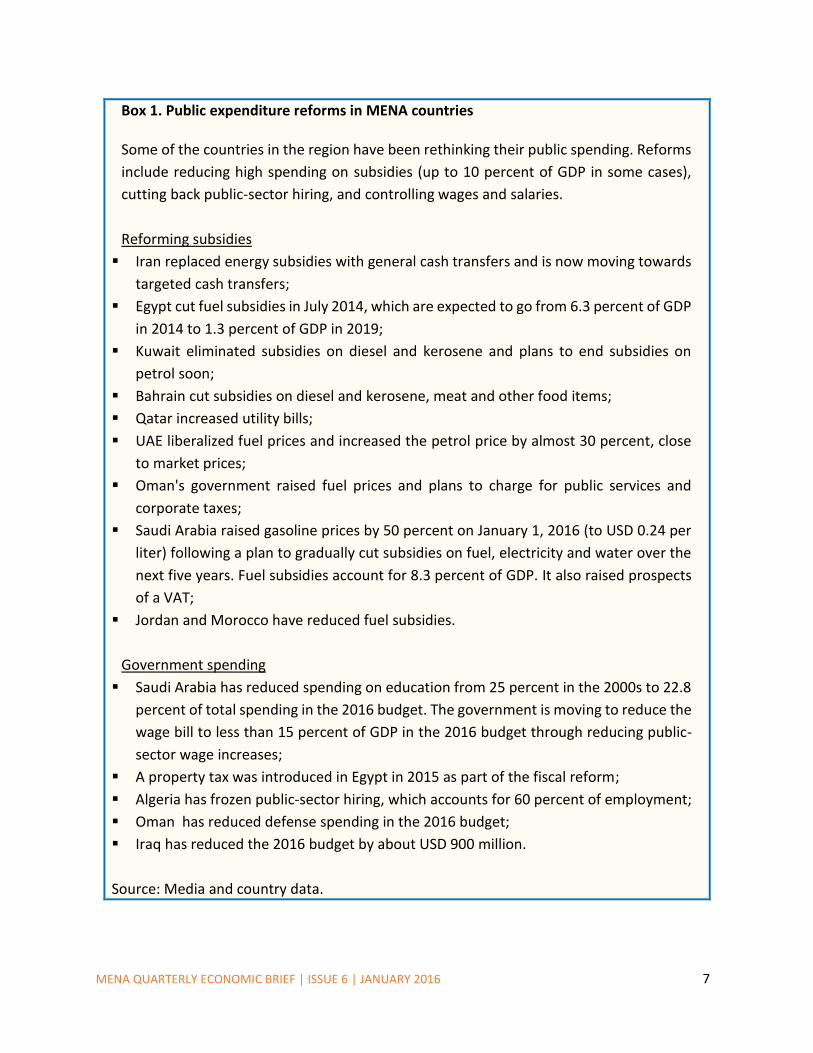
Box 1. Public expenditure reforms in MENA countries Some of the countries in the region have been rethinking their public spending. Reforms
include reducing high spending on subsidies (up to 10 percent of GDP in some cases),
cutting back public-sector hiring, and controlling wages and salaries.
Reforming subsidies
Iran replaced energy subsidies with general cash transfers and is now moving towards
targeted cash transfers;
Egypt cut fuel subsidies in July 2014, which are expected to go from 6.3 percent of GDP
in 2014 to 1.3 percent of GDP in 2019;
Kuwait eliminated subsidies on diesel and kerosene and plans to end subsidies on
petrol soon;
Bahrain cut subsidies on diesel and kerosene, meat and other food items;
Qatar increased utility bills;
UAE liberalized fuel prices and increased the petrol price by almost 30 percent, close
to market prices;
Oman's government raised fuel prices and plans to charge for public services and
corporate taxes;
Saudi Arabia raised gasoline prices by 50 percent on January 1, 2016 (to USD 0.24 per
liter) following a plan to gradually cut subsidies on fuel, electricity and water over the
next five years. Fuel subsidies account for 8.3 percent of GDP. It also raised prospects
of a VAT;
Jordan and Morocco have reduced fuel subsidies.
Government spending
Saudi Arabia has reduced spending on education from 25 percent in the 2000s to 22.8
percent of total spending in the 2016 budget. The government is moving to reduce the
wage bill to less than 15 percent of GDP in the 2016 budget through reducing public-
sector wage increases;
A property tax was introduced in Egypt in 2015 as part of the fiscal reform;
Algeria has frozen public-sector hiring, which accounts for 60 percent of employment;
Oman has reduced defense spending in the 2016 budget;
Iraq has reduced the 2016 budget by about USD 900 million.
Source: Media and country data.
MENA QUARTERLY ECONOMIC BRIEF | ISSUE 6 | JANUARY 2016 8
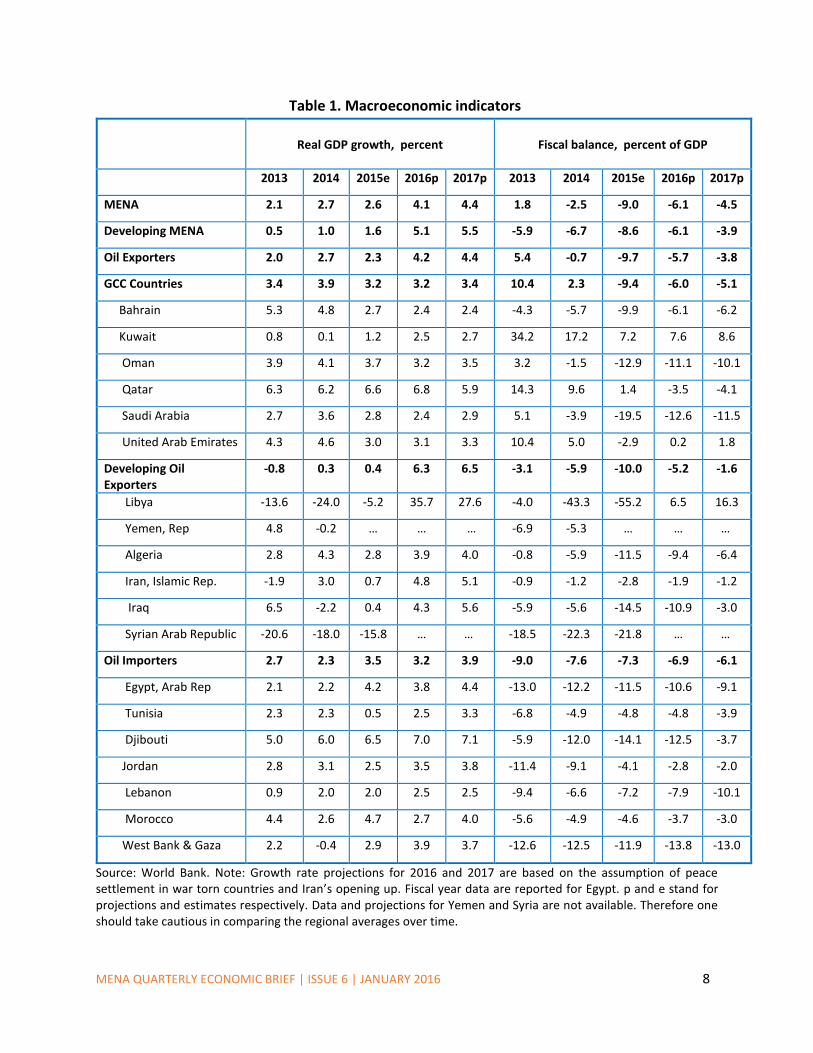
Table 1. Macroeconomic indicators
Real GDP growth, percent
Fiscal balance, percent of GDP
2013 2014 2015e 2016p 2017p 2013 2014 2015e 2016p 2017p
MENA 2.1 2.7 2.6 4.1 4.4 1.8 -2.5 -9.0 -6.1 -4.5
Developing MENA 0.5 1.0 1.6 5.1 5.5 -5.9 -6.7 -8.6 -6.1 -3.9
Oil Exporters 2.0 2.7 2.3 4.2 4.4 5.4 -0.7 -9.7 -5.7 -3.8
GCC Countries 3.4 3.9 3.2 3.2 3.4 10.4 2.3 -9.4 -6.0 -5.1
Bahrain 5.3 4.8 2.7 2.4 2.4 -4.3 -5.7 -9.9 -6.1 -6.2
Kuwait 0.8 0.1 1.2 2.5 2.7 34.2 17.2 7.2 7.6 8.6
Oman 3.9 4.1 3.7 3.2 3.5 3.2 -1.5 -12.9 -11.1 -10.1
Qatar 6.3 6.2 6.6 6.8 5.9 14.3 9.6 1.4 -3.5 -4.1
Saudi Arabia 2.7 3.6 2.8 2.4 2.9 5.1 -3.9 -19.5 -12.6 -11.5
United Arab Emirates 4.3 4.6 3.0 3.1 3.3 10.4 5.0 -2.9 0.2 1.8
Developing Oil Exporters
-0.8 0.3 0.4 6.3 6.5 -3.1 -5.9 -10.0 -5.2 -1.6
Libya -13.6 -24.0 -5.2 35.7 27.6 -4.0 -43.3 -55.2 6.5 16.3
Yemen, Rep 4.8 -0.2 … … … -6.9 -5.3 … … …
Algeria 2.8 4.3 2.8 3.9 4.0 -0.8 -5.9 -11.5 -9.4 -6.4
Iran, Islamic Rep. -1.9 3.0 0.7 4.8 5.1 -0.9 -1.2 -2.8 -1.9 -1.2
Iraq 6.5 -2.2 0.4 4.3 5.6 -5.9 -5.6 -14.5 -10.9 -3.0
Syrian Arab Republic -20.6 -18.0 -15.8 … … -18.5 -22.3 -21.8 … …
Oil Importers 2.7 2.3 3.5 3.2 3.9 -9.0 -7.6 -7.3 -6.9 -6.1
Egypt, Arab Rep 2.1 2.2 4.2 3.8 4.4 -13.0 -12.2 -11.5 -10.6 -9.1
Tunisia 2.3 2.3 0.5 2.5 3.3 -6.8 -4.9 -4.8 -4.8 -3.9
Djibouti 5.0 6.0 6.5 7.0 7.1 -5.9 -12.0 -14.1 -12.5 -3.7
Jordan 2.8 3.1 2.5 3.5 3.8 -11.4 -9.1 -4.1 -2.8 -2.0
Lebanon 0.9 2.0 2.0 2.5 2.5 -9.4 -6.6 -7.2 -7.9 -10.1
Morocco 4.4 2.6 4.7 2.7 4.0 -5.6 -4.9 -4.6 -3.7 -3.0
West Bank & Gaza 2.2 -0.4 2.9 3.9 3.7 -12.6 -12.5 -11.9 -13.8 -13.0
Source: World Bank. Note: Growth rate projections for 2016 and 2017 are based on the assumption of peace settlement in war torn countries and Iran’s opening up. Fiscal year data are reported for Egypt. p and e stand for projections and estimates respectively. Data and projections for Yemen and Syria are not available. Therefore one should take cautious in comparing the regional averages over time.
MENA QUARTERLY ECONOMIC BRIEF | ISSUE 6 | JANUARY 2016 9
THE ECONOMIC EFFECTS OF WAR
As noted in the previous section, the recent poor performance of several MENA economies, and
their dim prospects for the future, are partly driven by the civil wars that have created death,
destruction and significant growth shortfalls in both conflict countries and their neighbors. In
this section, we examine the different ways in which civil wars affect the economies of the region,
including the important channel of forced displacement, which has become a crisis. In the next
section, we explore how economic fortunes will turn around if there is peace.
A study by Collier (1999) found that, during civil war, countries tended to grow around 2.2
percentage points more slowly than during peace. After a typical civil war of seven years, incomes
would be about 15 percent lower than had the war not happened, implying a 30 percent increase
in the incidence of absolute poverty. The cumulative loss of income during the war would be
equal to around 60 percent of a year’s GDP. Hoeffler and Reynal-Querol (2003) show that a five-
year civil war reduces the average annual growth rate by more than two percentage points and
increases the infant mortality rate by about two percent annually. In another study, Stewart,
Huang and Wang (2001) found that for a sample of 14 civil-war countries, the average growth
rate of GNP per capita was -3.3 percent. Furthermore, they found that 15 out of 16 war countries
experienced a fall in per capita income, 13 out of 17 countries experienced a drop in food
production, and external debt as a percentage of GDP increased in all surveyed war countries.
Trade patterns changed in 12 out of 18 countries and export growth declined.
These global estimates appear to be playing out in the MENA region as well. Five years of civil
war in Syria and the escalating conflict with ISIS in Iraq after 2014 have imposed a high cost in
terms of lost output. Using a multi-country general-equilibrium model, Ianchovichina and Ivanos
(2014) quantified the costs of war in Syria and spillovers to Turkey, Lebanon, Jordan, Iraq, and
Egypt. The findings show that war in Syria and spillovers to the neighboring five countries have
cost close to USD 35 billion in output, measured in 2007 prices, equivalent to Syria’s GDP in
2007.5 Those countries most affected by the war, Syria and Iraq, have borne the brunt of the
direct economic costs. In addition, they have lost out on the benefits from more formal
economic integration with their neighbors. According to Ianchovichina and Ivanos’ simulations,
Syria and Iraq have seen per capita income in constant terms decline by 23 percent and 28
percent relative to the levels that could have been achieved had the war not broken out. The
5 This still does not factor in the fiscal costs of delivering basic services to refugees in the countries that have received
them, nor does it take into consideration the cost of putting-up infrastructure to support them. These costs could be substantial for Lebanon, Jordan, and Turkey, the three countries that have taken the most refugees (see next section). The future costs arising from the large numbers of deaths and of replenishing depleted physical and human capital are also likely to be sizable, especially in Syria.
MENA QUARTERLY ECONOMIC BRIEF | ISSUE 6 | JANUARY 2016 10
costs directly attributed to the war are 14 and 16 percent reduction in per capita GDP for Syria
and Iraq, respectively. The trade embargo on Syria has been a major factor behind the direct
costs, followed by the decline in the size and skills of its labor force due to the loss of life and
exodus of refugees, the destruction of infrastructure and the increase in the cost of doing
business in conflict zones.
The Syrian war has affected the standard of living of neighbors, with per capita average incomes
lower by an estimated 1.1 percent in Lebanon and 1.5 percent in Turkey, Egypt, and Jordan,
relative to the levels that could have achieved had the war been avoided. For Egypt, Jordan, and
Turkey, the opportunity costs of foregone trade integration are larger than the direct costs. In
Lebanon only, real GDP growth is estimated to have dropped by 2.9 percentage points each year
during 2012-14. This has pushed more than 170,000 Lebanese into poverty and doubled the
unemployment rate to above 20 percent, most of them unskilled youth (World Bank, 2013).
In Syria, almost every economic sector has been hurt, but property-ownership has been
particularly badly hit as demand for land has declined steeply, reflecting the huge numbers of
refugees leaving the country. By contrast, in Lebanon and Turkey, land and business owners may
have benefited but workers have lost because the arrival of Syrian refugees has increased local
demand for goods and services, raising prices, and augmented the labor supply, lowering wages.
Damage to Physical Capital
In addition to the lost output from trade interruption and movement of factors of production,
civil wars directly damage the stock of physical capital in a country. Damages to infrastructure
facilities in war countries such as Syria, Iraq, Libya and Yemen are, however, difficult to assess
because access to the damaged sites, data and information are limited when the conflict is
ongoing, and the situation is changing frequently. The difficulty also lies in the fact that depending
on estimation methodologies and assumptions applied, divergent results can be produced. Two
methods commonly used are: (i) calculations based on various economic models for estimating
the effect of damage to the capital stock; (ii) aggregation of data and information related to the
actual damage of infrastructure or architectural structure on the ground.
There are various estimates for the damages caused by war in Syria, Yemen, Iraq and Libya
applying economic models and utilizing available statistics. The Syria Center for Policy Research
estimated the capital stock damage at USD 72 billion in Syria between 2011 to the end of 2014.
A separate study estimates Libya’s infrastructure needs to be USD 200 billion over the next ten
years.
MENA QUARTERLY ECONOMIC BRIEF | ISSUE 6 | JANUARY 2016 11
In several locations in Syria, Yemen and Iraq, the World Bank has been trying to assess the
damage to infrastructure through aggregation of data and information related to the actual
damage, using different types of data sources such as satellite imagery, social media, existing
public information, and partner humanitarian agencies’ data.
As for Syria, a preliminary assessment in six cities--Aleppo, Dar'a, Hama, Homs, Idlib, and Latakia-
-over seven sectors -- housing, health, education, energy, water and sanitation, transport and
agriculture--was undertaken for the damage caused up to the end of 2014. The total damage
for the six cities is estimated to range between USD 3.6 - 4.5 billion. Aleppo is the most affected
city accounting for roughly 40 percent of the estimated damage. Latakia is the least affected city,
although it is subject to the increased pressure on infrastructure and services from the increase
in Internally Displaced Persons (IDPs) in the city. This assessment reveals that the damage to
housing is by far the largest, accounting for more than 65 percent of the total damage.
As for Yemen, the World Bank is currently undertaking a similar assessment with the
collaboration of UN agencies, the European Union, the Islamic Development Bank, and country
authorities. The conflict started to spread across much of Yemen after March 2015. The
preliminary estimates, based on data as of October 31, 2015, show the damage in four cities--
Sana’a, Aden, Taiz and Zinjibar-- over six sectors – education, energy, health, housing, transport,
and water and sanitation-- to be in the range of USD 4.0 – 5.0 billion. The most affected sector
is housing and serious damage can be observed in health facilities. For Iraq, the World Bank
conducted a rapid damage assessment for four cities liberated from ISIS over four key sectors
such as water and sanitation, transport, public buildings and municipal services, and housing.
Total damage for the sectors is estimated in the range of USD 362.5 – 443 million.
Such damage assessments portray the difficult situation of the people who are remaining or
trapped in the conflict areas. As for Syria, the World Bank assessment shows that the health
sector is in dire condition due to damaged infrastructure, shortage of supplies, and lack of health
professionals. About one-third of the 780 health facilities in the cities of Aleppo, Dar'a, Hama,
Homs, Idlib, and Latakia, ranging from hospitals to pharmacies, have been damaged. Among the
six cities, Aleppo suffered the most damage, accounting for 48.4 percent of the total damage
assessed for medical facilities. The total cost of the infrastructure damage to the health sector,
for all six cities, is estimated to be between USD 203 and 248 million by the end of 2014. During
2015, more attacks on medical facilities were reported. The latest information by the World
Health Organization (WHO) and International Federation of Red Cross and Red Crescent Societies
(IFRC) reveals that more than 50 percent of hospitals are either completely destroyed or partially
functioning due to the destruction. Not only has infrastructure been severely damaged, but the
MENA QUARTERLY ECONOMIC BRIEF | ISSUE 6 | JANUARY 2016 12
labor force has shrunk as medical professionals fled in the wake of the conflict, resulting in a
shortage while medical needs are increasing as a direct result of the conflict.
As for the education sector in Syria, the World Bank assessment reveals that there were 1,417
institutions ranging from Pre-Kindergarten to Universities in six cities and 14.8 percent of them,
mainly primary and secondary schools, have suffered some kind of damage. The total cost to the
infrastructure element of the education sector, for all six cities, is estimated to be between USD
101 and 123 million up to the end of 2014. Since there were more than 16,000 elementary
schools and secondary schools all over Syria, nation-wide damage is estimated to be substantial.
Another study conducted by the UN shows that in addition to more than 20 percent of schools
moderately to totally damaged, another problem of education facilities is that 18 percent of the
schools are occupied by IDPs and not functioning as schools any longer.
The estimate of UN ESCWA projects a slightly different picture in terms of the sectoral
composition of damage since they have analyzed all related sectors as well. Building and
construction suffered the most damage, representing 32 percent, followed by the manufacturing
sector, 18 percent, and service sectors, 9 percent.
For Syria, most of the damage assessments, including that undertaken by the World Bank, were
conducted up to the end of 2014 and not much systematic assessment was made during 2015,
although more damages were reported in 2015 compared with previous years. The damage to
infrastructure heightened during 2015 and public services have seen further deterioration.
According to a report by a UN agency, in June, July and August of 2015 alone, health facilities
were attacked more than 70 times, preventing many patients from gaining access to these
centers. The situation has deteriorated further by the ongoing fuel and electricity shortages.
About two-thirds of the population obtained water from medium- to high-risk sources. A water
treatment plant in Aleppo was severely damaged by the air raids on November 26, 2015, cutting
water supply to 1.4 million people who remain around Aleppo.
Damage to Human Capital
As for the humanitarian needs in countries in conflict, UN agencies undertake assessments and
call on the international community to support the crises, identifying various needs in multiple
sectors such as protection, water and sanitation, health, food, education, shelter, etc. According
to the UN assessment, for Syria there are about 13.5 million people in need of humanitarian
assistance, with 8.7 million in acute need while about 4.5 million are located in the areas hard to
reach (Table 2). The UN agencies estimate the cost to meet that humanitarian need to be around
USD 3.18 billion. For Yemen, people in need is estimated to be as many as 21.1 million – 86
percent of population--requiring assistance in multiple sectors, with an estimated cost of the
MENA QUARTERLY ECONOMIC BRIEF | ISSUE 6 | JANUARY 2016 13
humanitarian assistance of USD 1.6 billion for 2015. For Libya, the total number of people in
need of humanitarian assistance is 2.44 million and the latest appeal is for USD 166 million. As
for Iraq, the UN estimates 8.2 million people are in need and the humanitarian assistance would
cost USD 704 million.
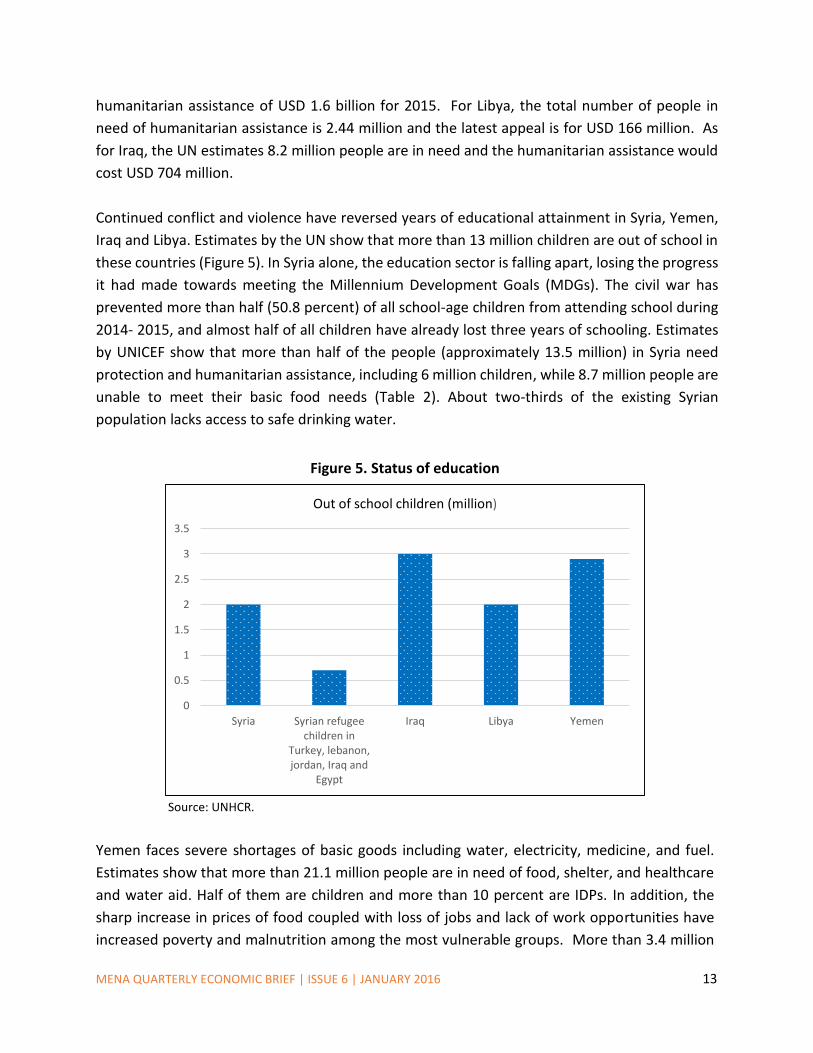
Continued conflict and violence have reversed years of educational attainment in Syria, Yemen,
Iraq and Libya. Estimates by the UN show that more than 13 million children are out of school in
these countries (Figure 5). In Syria alone, the education sector is falling apart, losing the progress
it had made towards meeting the Millennium Development Goals (MDGs). The civil war has
prevented more than half (50.8 percent) of all school-age children from attending school during
2014- 2015, and almost half of all children have already lost three years of schooling. Estimates
by UNICEF show that more than half of the people (approximately 13.5 million) in Syria need
protection and humanitarian assistance, including 6 million children, while 8.7 million people are
unable to meet their basic food needs (Table 2). About two-thirds of the existing Syrian
population lacks access to safe drinking water.
Figure 5. Status of education
Source: UNHCR.
Yemen faces severe shortages of basic goods including water, electricity, medicine, and fuel.
Estimates show that more than 21.1 million people are in need of food, shelter, and healthcare
and water aid. Half of them are children and more than 10 percent are IDPs. In addition, the
sharp increase in prices of food coupled with loss of jobs and lack of work opportunities have
increased poverty and malnutrition among the most vulnerable groups. More than 3.4 million
0
0.5
1
1.5
2
2.5
3
3.5
Syria Syrian refugeechildren in
Turkey, lebanon,jordan, Iraq and
Egypt
Iraq Libya Yemen
Out of school children (million)
MENA QUARTERLY ECONOMIC BRIEF | ISSUE 6 | JANUARY 2016 14
children are out of school, equivalent to 47 percent of the total of Yemen’s school-aged children,
as the majority of schools are closed or occupied by displaced people, making it difficult for
classes to continue. In those governorates where schools are functioning, student registration
and attendance is low (between 30-70 percent) due to security problems. For example, in the
governorate of Raymah and some districts in Hajjah, a number of schools (more than 10) remain
closed due to lack of teachers.
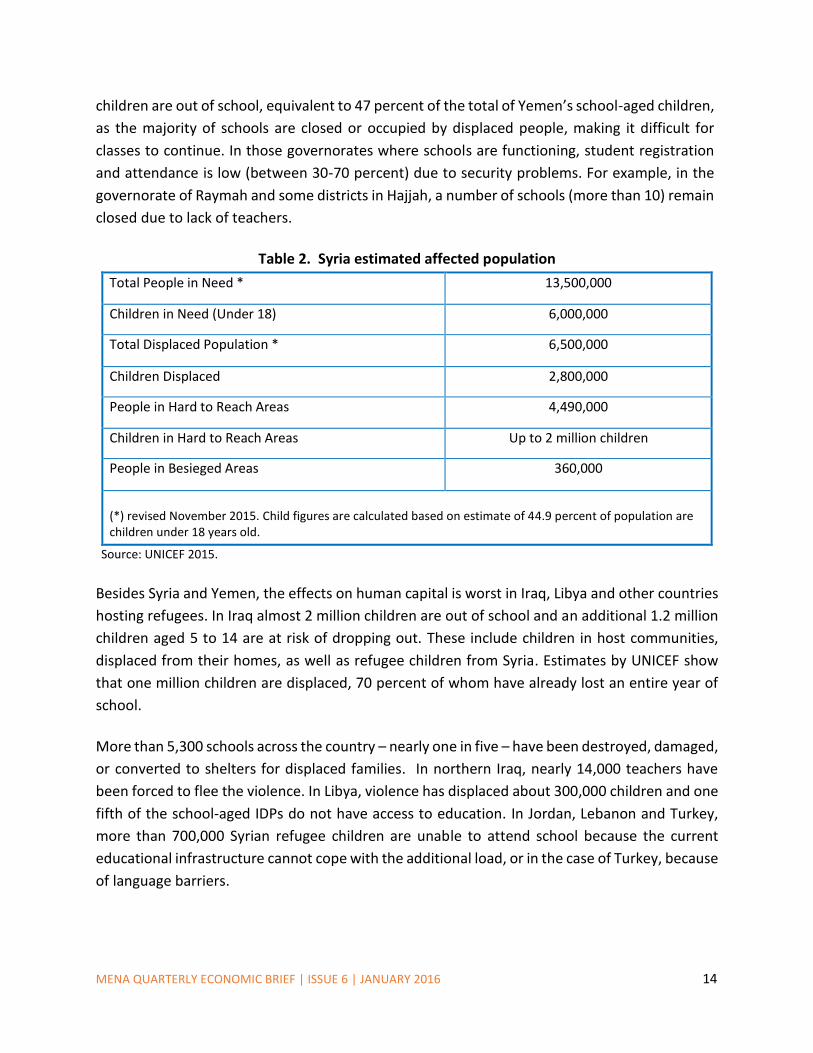
Table 2. Syria estimated affected population
Source: UNICEF 2015.
Besides Syria and Yemen, the effects on human capital is worst in Iraq, Libya and other countries
hosting refugees. In Iraq almost 2 million children are out of school and an additional 1.2 million
children aged 5 to 14 are at risk of dropping out. These include children in host communities,
displaced from their homes, as well as refugee children from Syria. Estimates by UNICEF show
that one million children are displaced, 70 percent of whom have already lost an entire year of
school.
More than 5,300 schools across the country – nearly one in five – have been destroyed, damaged,
or converted to shelters for displaced families. In northern Iraq, nearly 14,000 teachers have
been forced to flee the violence. In Libya, violence has displaced about 300,000 children and one
fifth of the school-aged IDPs do not have access to education. In Jordan, Lebanon and Turkey,
more than 700,000 Syrian refugee children are unable to attend school because the current
educational infrastructure cannot cope with the additional load, or in the case of Turkey, because
of language barriers.
Total People in Need * 13,500,000
Children in Need (Under 18) 6,000,000
Total Displaced Population * 6,500,000
Children Displaced 2,800,000
People in Hard to Reach Areas 4,490,000
Children in Hard to Reach Areas Up to 2 million children
People in Besieged Areas 360,000
(*) revised November 2015. Child figures are calculated based on estimate of 44.9 percent of population are children under 18 years old.
MENA QUARTERLY ECONOMIC BRIEF | ISSUE 6 | JANUARY 2016 15
Forced Displacement Crises
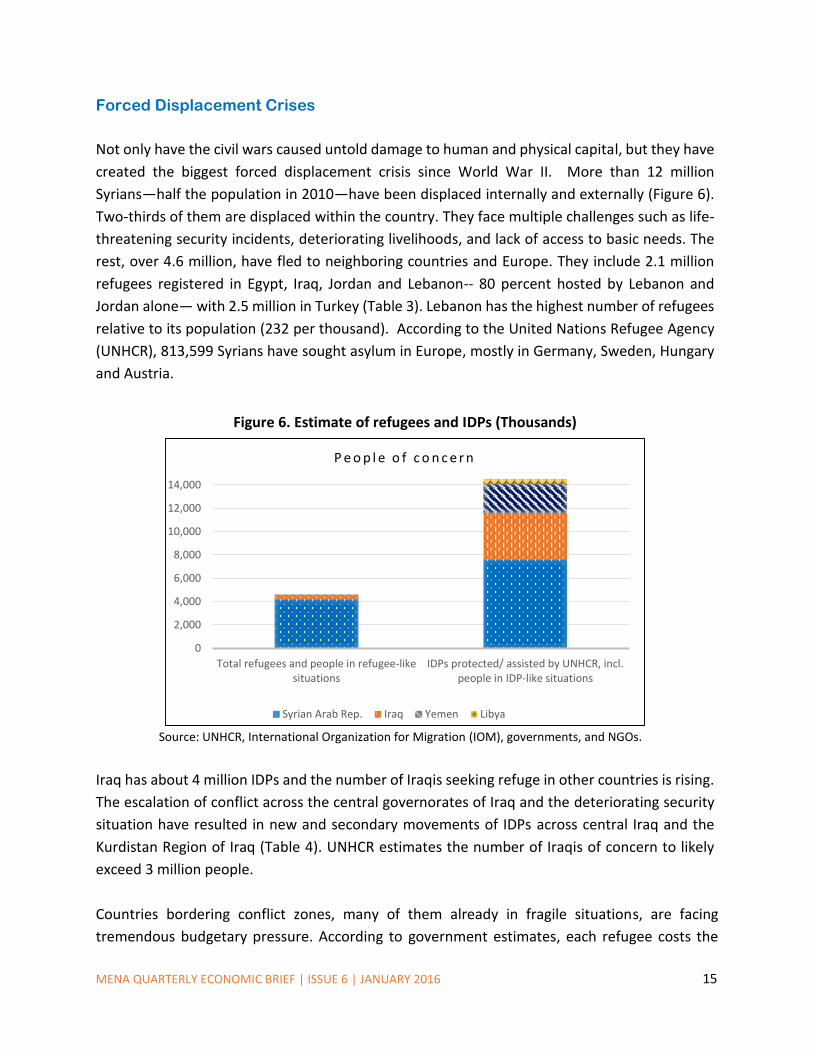
Not only have the civil wars caused untold damage to human and physical capital, but they have
created the biggest forced displacement crisis since World War II. More than 12 million
Syrians—half the population in 2010—have been displaced internally and externally (Figure 6).
Two-thirds of them are displaced within the country. They face multiple challenges such as life-
threatening security incidents, deteriorating livelihoods, and lack of access to basic needs. The
rest, over 4.6 million, have fled to neighboring countries and Europe. They include 2.1 million
refugees registered in Egypt, Iraq, Jordan and Lebanon-- 80 percent hosted by Lebanon and
Jordan alone— with 2.5 million in Turkey (Table 3). Lebanon has the highest number of refugees
relative to its population (232 per thousand). According to the United Nations Refugee Agency
(UNHCR), 813,599 Syrians have sought asylum in Europe, mostly in Germany, Sweden, Hungary
and Austria.
Figure 6. Estimate of refugees and IDPs (Thousands)
Source: UNHCR, International Organization for Migration (IOM), governments, and NGOs.
Iraq has about 4 million IDPs and the number of Iraqis seeking refuge in other countries is rising.
The escalation of conflict across the central governorates of Iraq and the deteriorating security
situation have resulted in new and secondary movements of IDPs across central Iraq and the
Kurdistan Region of Iraq (Table 4). UNHCR estimates the number of Iraqis of concern to likely
exceed 3 million people.
Countries bordering conflict zones, many of them already in fragile situations, are facing
tremendous budgetary pressure. According to government estimates, each refugee costs the
0
2,000
4,000
6,000
8,000
10,000
12,000
14,000
Total refugees and people in refugee-likesituations
IDPs protected/ assisted by UNHCR, incl.people in IDP-like situations
Tho
usa
nd
s
P e o p l e o f c o n c e r n
Syrian Arab Rep. Iraq Yemen Libya
MENA QUARTERLY ECONOMIC BRIEF | ISSUE 6 | JANUARY 2016 16
Jordanian government USD 3,750 (2,500 dinars) to host per year.6 The influx of more than
630,000 Syrian refugees is thus estimated to have cost Jordan over USD 2.5 billion a year. This
amounts to 6 percent of GDP and one-fourth of government’s annual revenues. Under this
situation, government debt is accumulating fast-- estimated at 90 percent of GDP in 2015.
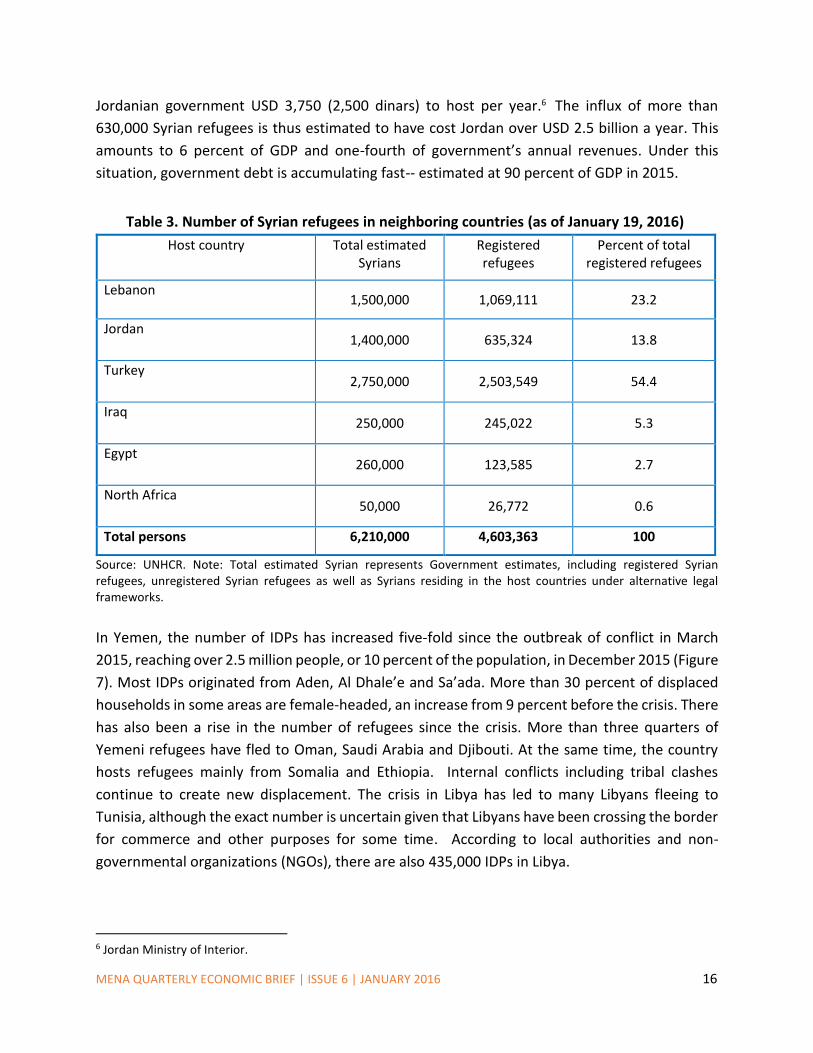
Table 3. Number of Syrian refugees in neighboring countries (as of January 19, 2016)
Host country Total estimated Syrians
Registered refugees
Percent of total registered refugees
Lebanon 1,500,000 1,069,111 23.2
Jordan 1,400,000 635,324 13.8
Turkey 2,750,000 2,503,549 54.4
Iraq 250,000 245,022 5.3
Egypt 260,000 123,585 2.7
North Africa 50,000 26,772 0.6
Total persons 6,210,000 4,603,363 100
Source: UNHCR. Note: Total estimated Syrian represents Government estimates, including registered Syrian refugees, unregistered Syrian refugees as well as Syrians residing in the host countries under alternative legal frameworks.
In Yemen, the number of IDPs has increased five-fold since the outbreak of conflict in March
2015, reaching over 2.5 million people, or 10 percent of the population, in December 2015 (Figure
7). Most IDPs originated from Aden, Al Dhale’e and Sa’ada. More than 30 percent of displaced
households in some areas are female-headed, an increase from 9 percent before the crisis. There
has also been a rise in the number of refugees since the crisis. More than three quarters of
Yemeni refugees have fled to Oman, Saudi Arabia and Djibouti. At the same time, the country
hosts refugees mainly from Somalia and Ethiopia. Internal conflicts including tribal clashes
continue to create new displacement. The crisis in Libya has led to many Libyans fleeing to
Tunisia, although the exact number is uncertain given that Libyans have been crossing the border
for commerce and other purposes for some time. According to local authorities and non-
governmental organizations (NGOs), there are also 435,000 IDPs in Libya.
6 Jordan Ministry of Interior.
MENA QUARTERLY ECONOMIC BRIEF | ISSUE 6 | JANUARY 2016 17
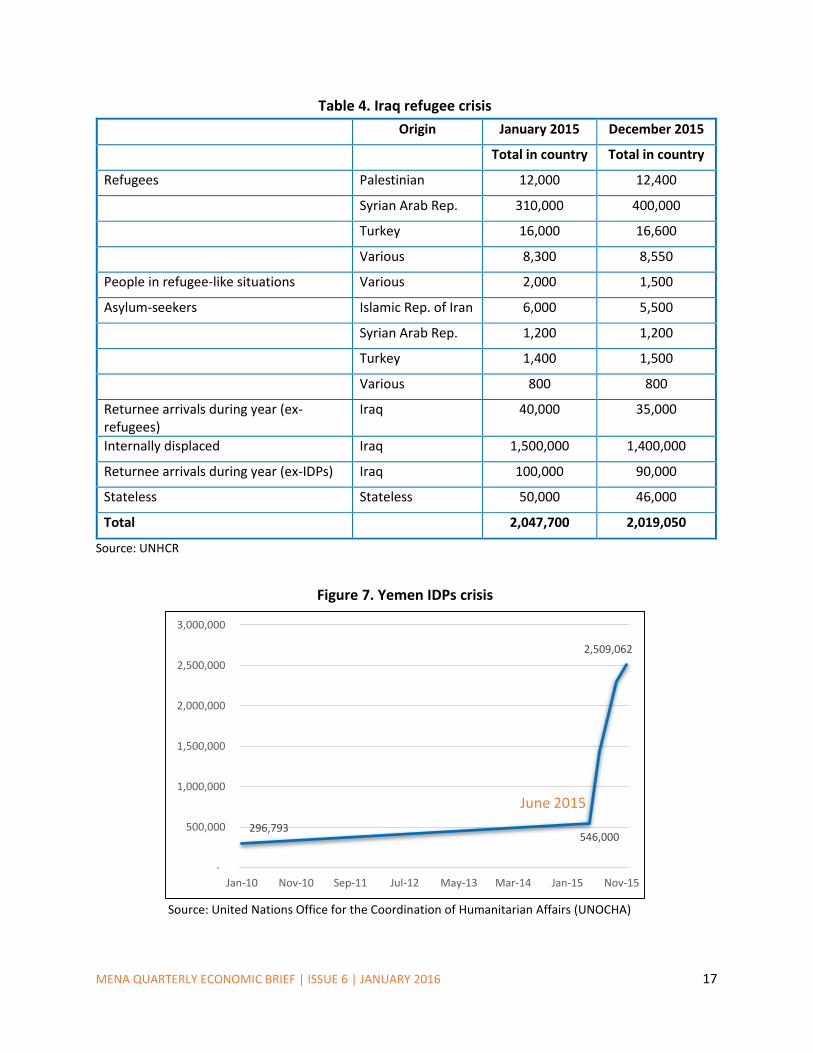
Table 4. Iraq refugee crisis
Origin January 2015 December 2015
Total in country Total in country
Refugees Palestinian 12,000 12,400
Syrian Arab Rep. 310,000 400,000
Turkey 16,000 16,600
Various 8,300 8,550
People in refugee-like situations Various 2,000 1,500
Asylum-seekers Islamic Rep. of Iran 6,000 5,500
Syrian Arab Rep. 1,200 1,200
Turkey 1,400 1,500
Various 800 800
Returnee arrivals during year (ex-refugees)
Iraq 40,000 35,000
Internally displaced Iraq 1,500,000 1,400,000
Returnee arrivals during year (ex-IDPs) Iraq 100,000 90,000
Stateless Stateless 50,000 46,000
Total 2,047,700 2,019,050
Source: UNHCR
Figure 7. Yemen IDPs crisis
Source: United Nations Office for the Coordination of Humanitarian Affairs (UNOCHA)
296,793 546,000
2,509,062
-
500,000
1,000,000
1,500,000
2,000,000
2,500,000
3,000,000
Jan-10 Nov-10 Sep-11 Jul-12 May-13 Mar-14 Jan-15 Nov-15
June 2015
MENA QUARTERLY ECONOMIC BRIEF | ISSUE 6 | JANUARY 2016 18
Living Condition of Refugees and IDPs
Data from UNHCR show that half of Syrian refugees are of working age between 18-64 years (with
half of them being female), and were economically active in Syria prior to the crisis. Children
under 17 constitute about 47 percent of the refugees. Unemployment rates are high, particularly
among women, at 68 percent. As for the rest, with difficulties in obtaining work permits in host
countries, many work in the informal sector with no protection. A recent survey by the
International Labor Organization (ILO) shows that about 92 percent of Syrian refugees in Lebanon
have no work contract and more than half of them work on a seasonal, weekly or daily basis at
low wages.
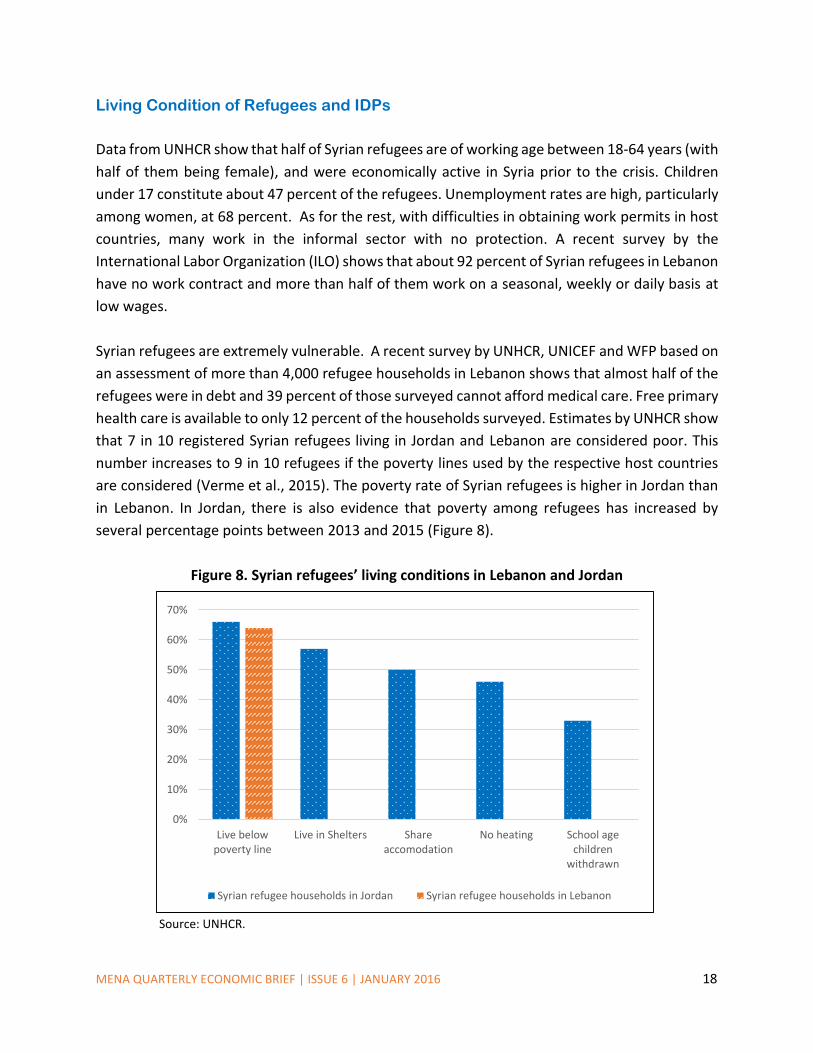
Syrian refugees are extremely vulnerable. A recent survey by UNHCR, UNICEF and WFP based on
an assessment of more than 4,000 refugee households in Lebanon shows that almost half of the
refugees were in debt and 39 percent of those surveyed cannot afford medical care. Free primary
health care is available to only 12 percent of the households surveyed. Estimates by UNHCR show
that 7 in 10 registered Syrian refugees living in Jordan and Lebanon are considered poor. This
number increases to 9 in 10 refugees if the poverty lines used by the respective host countries
are considered (Verme et al., 2015). The poverty rate of Syrian refugees is higher in Jordan than
in Lebanon. In Jordan, there is also evidence that poverty among refugees has increased by
several percentage points between 2013 and 2015 (Figure 8).
Figure 8. Syrian refugees’ living conditions in Lebanon and Jordan
Source: UNHCR.
0%
10%
20%
30%
40%
50%
60%
70%
Live belowpoverty line
Live in Shelters Shareaccomodation
No heating School agechildren
withdrawn
Syrian refugee households in Jordan Syrian refugee households in Lebanon

MENA QUARTERLY ECONOMIC BRIEF | ISSUE 6 | JANUARY 2016 19
Yemen faces a growing poverty crisis. Before the war, more than half the population lived in
extreme poverty (below USD 1.90 a day) and more than half of the youth were unemployed.
These numbers have been increasing since the war and more than 20 million people -- 82 percent
of Yemenis--are now considered poor. These include more than 15 million without access to
health facilities and medical care. With people fleeing their homes and no formal camps,
displaced people are sheltered in 260 schools, preventing access to education for 13,000
children. According to OCHA, an additional 1.8 million children have lost the possibility of
receiving an education, with more than 3,500 schools closed across the country. This is in addition
to an estimated 1.6 million children with no access to schools before March. Since the escalation
of violence, more than 537,000 children (one-eighth of all children under the age of five) are
estimated to be at risk of severe malnutrition. These challenges are exacerbated by rising prices
that have already reduced access to food and safe water, basic public services and livelihood
opportunities (see section on damages to human capital).
THE ECONOMIC EFFECTS OF PEACE
Can the economic damage from the civil wars be reversed? An end to the conflicts in MENA will
improve macroeconomic indicators through restoring security, increasing investment, and the
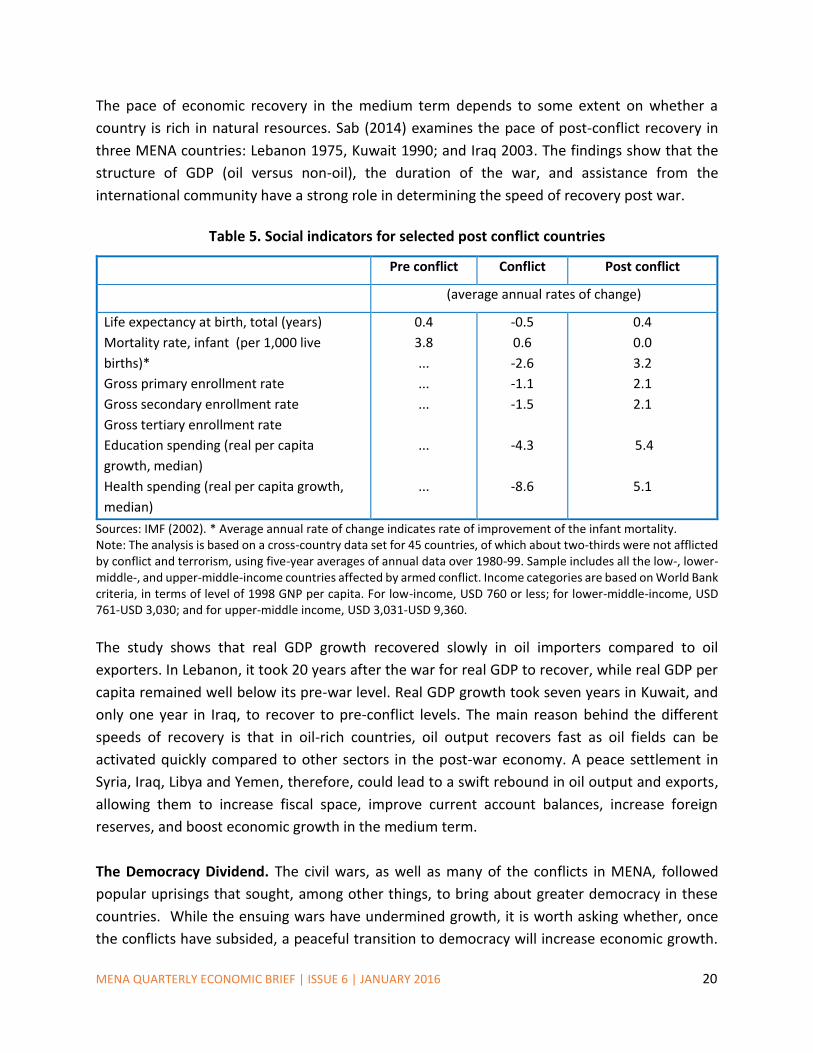
commencement of reconstruction activity. Social indicators will also improve with growth as well
as by the shifting of public resources from military expenses to education and health (Table 5).
But the pace and pattern of economic recovery in the short term is typically not smooth, as post-
conflict countries inherit a weak economy, damaged physical, human and social capital,
widespread poverty and high unemployment, particularly among youth. Evidence suggests that,
while in some post-war countries economic recovery and the growth dividend happened
immediately, in other cases it took longer (Table 6). For example, ten years after the end of the
conflict, per-capita income in Uganda had not regained its level of the early 1970s.
Collier (1999) finds some evidence of a “war overhang” effect: some countries continue to have
low growth after the war. This is because physical and human capital are severely destroyed and
some skills become scarce as people of working-age flee war and violence or are displaced
internally. Moreover, the transition from war to peace is likely to remain fragile and in some
instances reversible. Estimates show that there is a 39 percent probability that a peace
settlement will collapse within the first five years, and a 32 percent probability that it will collapse
in the next five years (Collier and Hoeffler, 2004). Angola, Burundi, the Democratic Republic of
the Congo, Indonesia, Liberia, Rwanda, Sierra Leone and Sri Lanka, among others, have all
experienced renewed violence after the conflicting parties signed peace agreements.
MENA QUARTERLY ECONOMIC BRIEF | ISSUE 6 | JANUARY 2016 20
The pace of economic recovery in the medium term depends to some extent on whether a
country is rich in natural resources. Sab (2014) examines the pace of post-conflict recovery in
three MENA countries: Lebanon 1975, Kuwait 1990; and Iraq 2003. The findings show that the
structure of GDP (oil versus non-oil), the duration of the war, and assistance from the
international community have a strong role in determining the speed of recovery post war.
Table 5. Social indicators for selected post conflict countries
Pre conflict Conflict Post conflict
(average annual rates of change)
Life expectancy at birth, total (years)
Mortality rate, infant (per 1,000 live
births)*
Gross primary enrollment rate
Gross secondary enrollment rate
Gross tertiary enrollment rate
Education spending (real per capita
growth, median)
Health spending (real per capita growth,
median)
0.4
3.8
...
...
...
...
...
-0.5
0.6
-2.6
-1.1
-1.5
-4.3
-8.6
0.4
0.0
3.2
2.1
2.1
5.4
5.1
Sources: IMF (2002). * Average annual rate of change indicates rate of improvement of the infant mortality. Note: The analysis is based on a cross-country data set for 45 countries, of which about two-thirds were not afflicted by conflict and terrorism, using five-year averages of annual data over 1980-99. Sample includes all the low-, lower-middle-, and upper-middle-income countries affected by armed conflict. Income categories are based on World Bank criteria, in terms of level of 1998 GNP per capita. For low-income, USD 760 or less; for lower-middle-income, USD 761-USD 3,030; and for upper-middle income, USD 3,031-USD 9,360.
The study shows that real GDP growth recovered slowly in oil importers compared to oil
exporters. In Lebanon, it took 20 years after the war for real GDP to recover, while real GDP per
capita remained well below its pre-war level. Real GDP growth took seven years in Kuwait, and
only one year in Iraq, to recover to pre-conflict levels. The main reason behind the different
speeds of recovery is that in oil-rich countries, oil output recovers fast as oil fields can be
activated quickly compared to other sectors in the post-war economy. A peace settlement in
Syria, Iraq, Libya and Yemen, therefore, could lead to a swift rebound in oil output and exports,
allowing them to increase fiscal space, improve current account balances, increase foreign
reserves, and boost economic growth in the medium term.
The Democracy Dividend. The civil wars, as well as many of the conflicts in MENA, followed
popular uprisings that sought, among other things, to bring about greater democracy in these
countries. While the ensuing wars have undermined growth, it is worth asking whether, once
the conflicts have subsided, a peaceful transition to democracy will increase economic growth.
MENA QUARTERLY ECONOMIC BRIEF | ISSUE 6 | JANUARY 2016 21
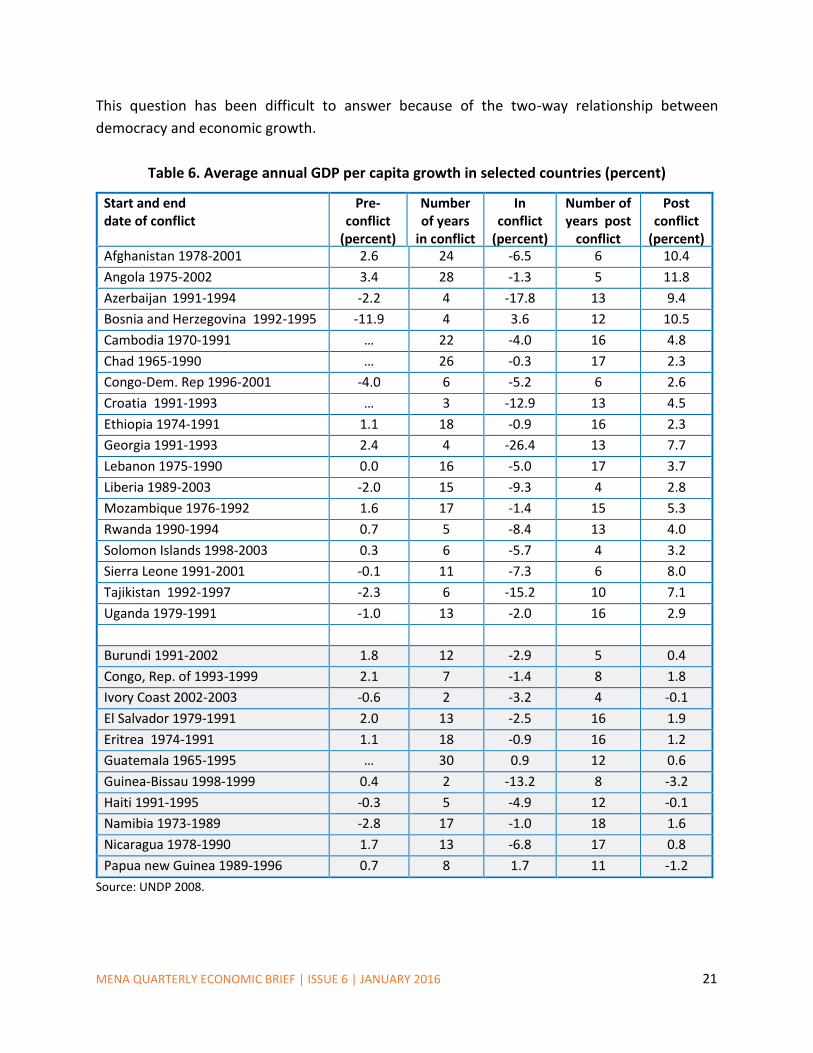
This question has been difficult to answer because of the two-way relationship between
democracy and economic growth.
Table 6. Average annual GDP per capita growth in selected countries (percent)
Start and end date of conflict
Pre-conflict
(percent)
Number of years
in conflict
In conflict
(percent)
Number of years post
conflict
Post conflict
(percent) Afghanistan 1978-2001 2.6 24 -6.5 6 10.4
Angola 1975-2002 3.4 28 -1.3 5 11.8
Azerbaijan 1991-1994 -2.2 4 -17.8 13 9.4
Bosnia and Herzegovina 1992-1995 -11.9 4 3.6 12 10.5
Cambodia 1970-1991 … 22 -4.0 16 4.8
Chad 1965-1990 … 26 -0.3 17 2.3
Congo-Dem. Rep 1996-2001 -4.0 6 -5.2 6 2.6
Croatia 1991-1993 … 3 -12.9 13 4.5
Ethiopia 1974-1991 1.1 18 -0.9 16 2.3
Georgia 1991-1993 2.4 4 -26.4 13 7.7
Lebanon 1975-1990 0.0 16 -5.0 17 3.7
Liberia 1989-2003 -2.0 15 -9.3 4 2.8
Mozambique 1976-1992 1.6 17 -1.4 15 5.3
Rwanda 1990-1994 0.7 5 -8.4 13 4.0
Solomon Islands 1998-2003 0.3 6 -5.7 4 3.2
Sierra Leone 1991-2001 -0.1 11 -7.3 6 8.0
Tajikistan 1992-1997 -2.3 6 -15.2 10 7.1
Uganda 1979-1991 -1.0 13 -2.0 16 2.9
Burundi 1991-2002 1.8 12 -2.9 5 0.4
Congo, Rep. of 1993-1999 2.1 7 -1.4 8 1.8
Ivory Coast 2002-2003 -0.6 2 -3.2 4 -0.1
El Salvador 1979-1991 2.0 13 -2.5 16 1.9
Eritrea 1974-1991 1.1 18 -0.9 16 1.2
Guatemala 1965-1995 … 30 0.9 12 0.6
Guinea-Bissau 1998-1999 0.4 2 -13.2 8 -3.2
Haiti 1991-1995 -0.3 5 -4.9 12 -0.1
Namibia 1973-1989 -2.8 17 -1.0 18 1.6
Nicaragua 1978-1990 1.7 13 -6.8 17 0.8
Papua new Guinea 1989-1996 0.7 8 1.7 11 -1.2
Source: UNDP 2008.
MENA QUARTERLY ECONOMIC BRIEF | ISSUE 6 | JANUARY 2016 22
However, some recent and robust evidence shows convincingly that, in the long run, economic
growth tends to improve significantly following a transition from non-democracy to democracy.
Using a global sample, Acemoglu et al., (2015) show that democratizations increase GDP per
capita by encouraging investment, schooling, economic reforms, public-good provision, and
reducing social unrest. Their results suggest that by switching from non-democracy to
democracy, the average country achieves about 20 percent higher level of GDP per capita in the
long run, roughly defined as about 30 years.
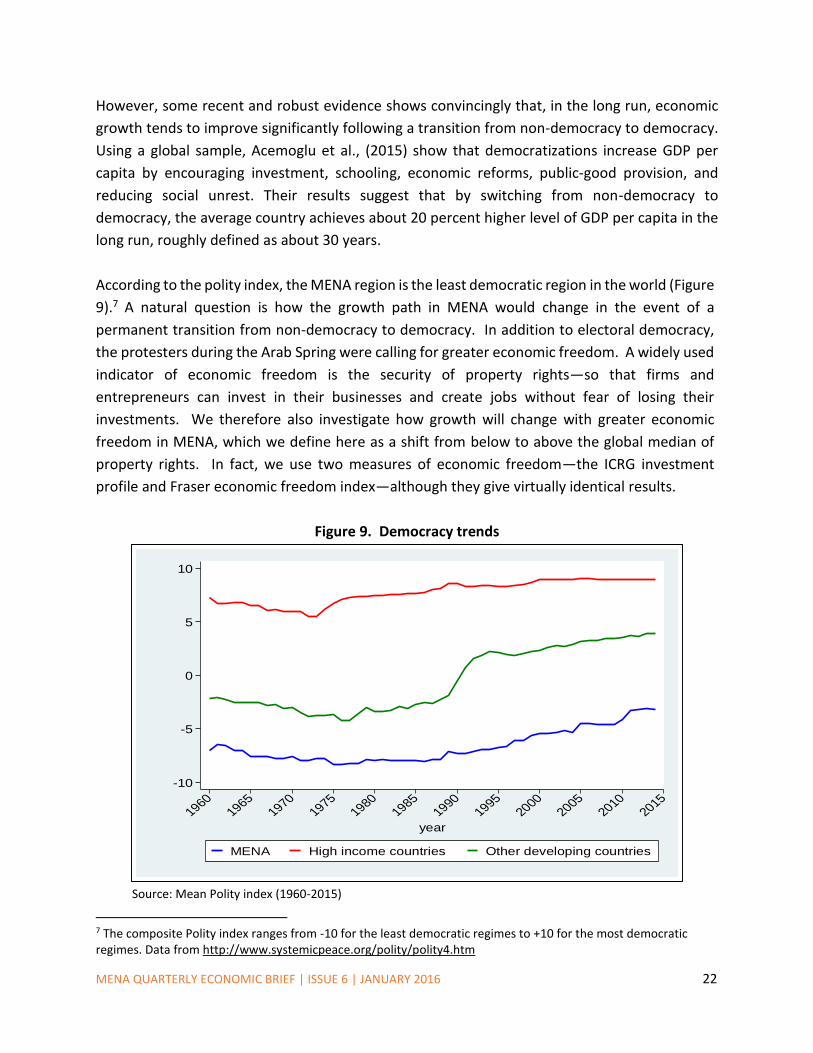
According to the polity index, the MENA region is the least democratic region in the world (Figure
9).7 A natural question is how the growth path in MENA would change in the event of a
permanent transition from non-democracy to democracy. In addition to electoral democracy,
the protesters during the Arab Spring were calling for greater economic freedom. A widely used
indicator of economic freedom is the security of property rights—so that firms and
entrepreneurs can invest in their businesses and create jobs without fear of losing their
investments. We therefore also investigate how growth will change with greater economic
freedom in MENA, which we define here as a shift from below to above the global median of
property rights. In fact, we use two measures of economic freedom—the ICRG investment
profile and Fraser economic freedom index—although they give virtually identical results.
Figure 9. Democracy trends
Source: Mean Polity index (1960-2015)
7 The composite Polity index ranges from -10 for the least democratic regimes to +10 for the most democratic regimes. Data from http://www.systemicpeace.org/polity/polity4.htm
-10
-5
0
5
10
me
an p
olity
ind
ex
19601965
19701975
19801985
19901995
20002005
20102015
year
MENA High income countries Other developing countries
MENA QUARTERLY ECONOMIC BRIEF | ISSUE 6 | JANUARY 2016 23
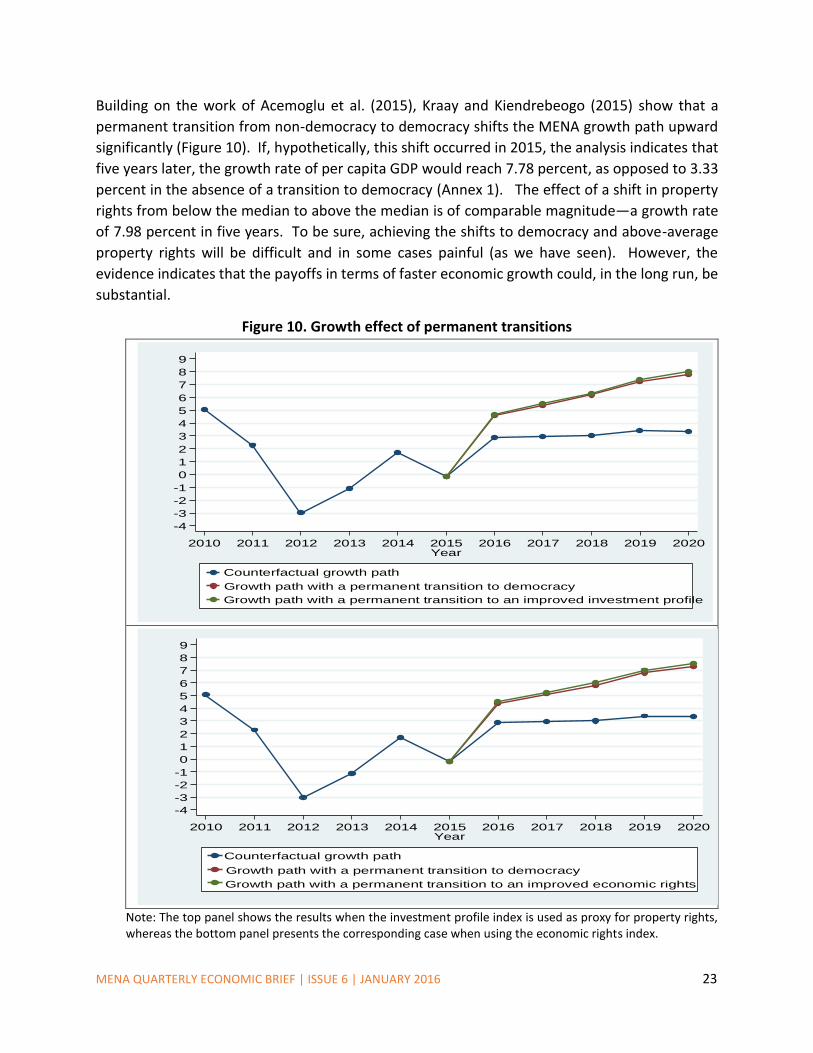
Building on the work of Acemoglu et al. (2015), Kraay and Kiendrebeogo (2015) show that a
permanent transition from non-democracy to democracy shifts the MENA growth path upward
significantly (Figure 10). If, hypothetically, this shift occurred in 2015, the analysis indicates that
five years later, the growth rate of per capita GDP would reach 7.78 percent, as opposed to 3.33
percent in the absence of a transition to democracy (Annex 1). The effect of a shift in property
rights from below the median to above the median is of comparable magnitude—a growth rate
of 7.98 percent in five years. To be sure, achieving the shifts to democracy and above-average
property rights will be difficult and in some cases painful (as we have seen). However, the
evidence indicates that the payoffs in terms of faster economic growth could, in the long run, be
substantial.
Figure 10. Growth effect of permanent transitions
Note: The top panel shows the results when the investment profile index is used as proxy for property rights, whereas the bottom panel presents the corresponding case when using the economic rights index.
-4
-3
-2
-1
0
1
2
3
4
5
6
7
8
9
Gro
wth
pro
ject
ion
(%)
2010 2011 2012 2013 2014 2015 2016 2017 2018 2019 2020Year
Counterfactual growth path
Growth path with a permanent transition to democracy
Growth path with a permanent transition to an improved investment profile
-4
-3
-2
-1
0
1
2
3
4
5
6
7
8
9
Gro
wth
pro
ject
ion
(%)
2010 2011 2012 2013 2014 2015 2016 2017 2018 2019 2020Year
Counterfactual growth path
Growth path with a permanent transition to democracy
Growth path with a permanent transition to an improved economic rights
MENA QUARTERLY ECONOMIC BRIEF | ISSUE 6 | JANUARY 2016 24
ANNEX
Democracy, property rights and growth in MENA
This note estimates the effects of a transition to democracy and an improvement in property
rights on economic growth in the MENA region. Democracy is measured using a dummy variable
defined by Acemoglu et al. (2015). Property rights are captured using two alternative indexes:
the ICRG investment profile index and the Fraser economic freedom index. The empirical
approach consists of “augmenting” the baseline specification reported in table 2 in Acemoglu et
al. (2015) with an indicator of property rights. Acemoglu et al. (2015) regressed GDP per capita
(log) on a democracy dummy, controlling for lagged GDP per capita, and full sets of country and
year fixed effects. The estimations here are based on samples of 130 and 142 countries,
respectively, when the ICRG investment profile and Fraser economic freedom indexes are used.
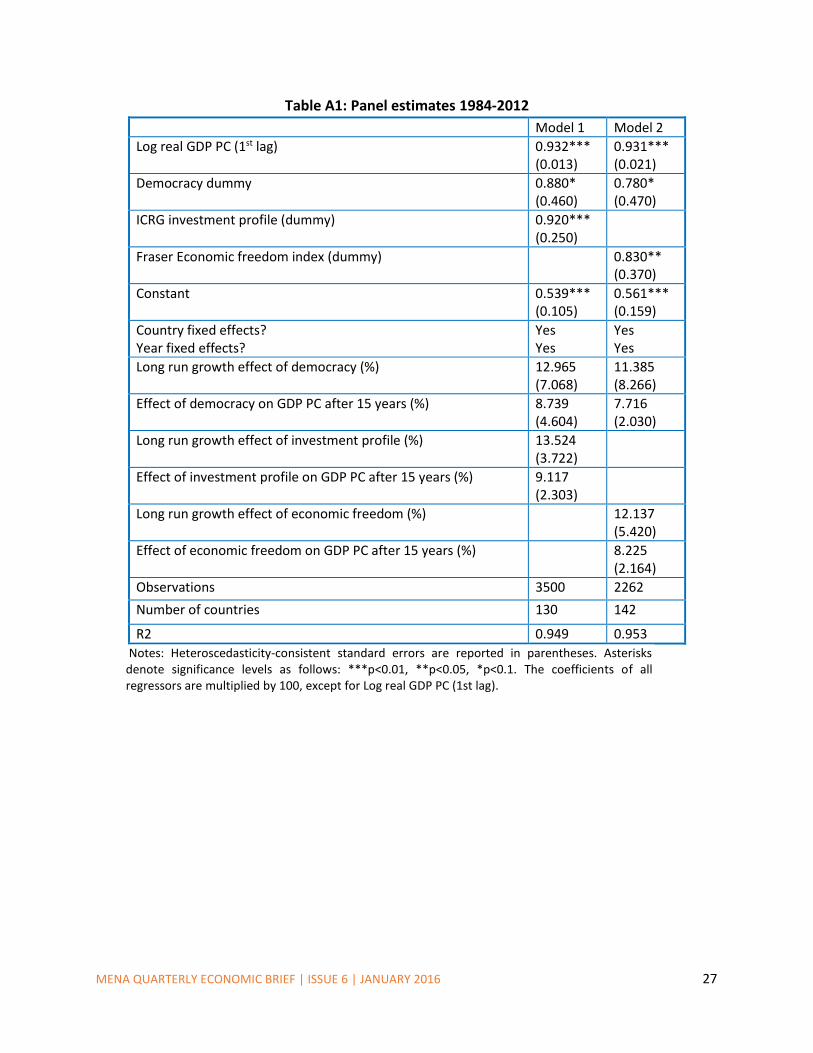
The period covered is from 1984 to 2012. The results are reported in Table A1.
As might be expected, GDP per capita is persistent over time, with coefficients of 0.932
(s.e.=0.013) and 0.931 (s.e.= 0.021) on the first lag of Log GDP per capita. The positive and
significant coefficients of 0.880 (s.e.=0.460) and 0.780 (s.e.=0.470) on the democracy dummy
suggests that countries with democratic regimes tend to have higher GDP per capita, at a given
level property rights. These coefficients imply that a permanent transition from non-democracy
to democracy is associated with increases in GDP per capita by 1.69 percent (s.e.=0.89) and 1.50
percent (s.e.=0.90), after one year. In the long-run such a permanent transition results in
increases in GDP per capita by 12.96 percent (s.e.=7.06) and 11.38 percent (s.e.=8.26). In their
baseline specification, Acemoglu et al. (2015) found a long-run growth effect of democracy of
35.59 percent, suggesting that their democracy dummy might be picking up the growth effect of
property rights. Another likely reason for these differences in the growth effect of democracy is
that Acemoglu et al. (2015) were able to exploit wider within country variation in democracy
over the period 1960-2010.
Property rights are positively associated with GDP per capita as well, regardless of the nature of
the regime (democracy or not) in place. A permanent improvement (from below to above global
median) in property rights is associated with increases in GDP per capita by 1.76 percent
(s.e.=0.46) for ICRG Investment profile and 1.60 percent (s.e.=0.70) for Fraser Economic Freedom
Index, one year after. The long-run growth effect of such improvements in property rights are
13.52 percent (s.e.=3.72) and 12.13 percent (s.e.=5.42), respectively for ICRG Investment profile
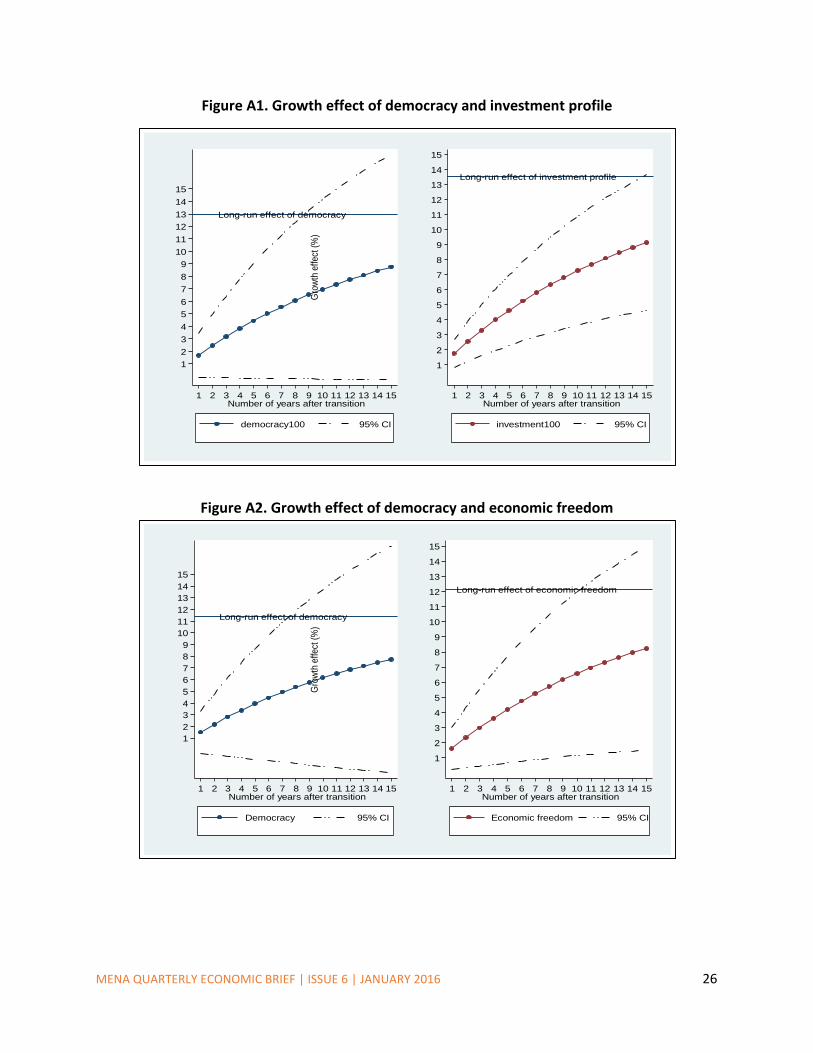
and Fraser Economic Freedom Index. Figures A1 and A2 plot the cumulative growth effects of
democracy and property rights as well as the corresponding long-run growth effects over the first
15 years following the initial transitions. As shown, the growth-promoting effects of democracy
and property rights are sustained over time, though at decreasing magnitudes.
MENA QUARTERLY ECONOMIC BRIEF | ISSUE 6 | JANUARY 2016 25
In the regressions, all MENA countries, except for Israel and Malta, are assumed to be non-
democratic and below the global median of the investment profile and economic rights
indicators. Therefore, the underlying question is what would be the MENA growth path in the
event of permanent transitions: (i) from non-democracy to democracy and (ii) from below to
above the global median of property rights? MENA growth rates are calculated in two steps using
data on Real GDP per capita from the IMF 2015 WEO database, where data are available from
1980 to 2020.8 First, country-level annual growth rates are calculated and second the MENA
average annual growth rates are calculated as the regional weighted average of country-level
growth rates, the weight being Real GDP per capita. Assuming that the MENA region experiences
permanent transitions (i) or (ii) in 2015, the associated growth paths are plotted in Figure 10. The
top panel shows the results when the investment profile index is used as proxy for property
rights, whereas bottom panel presents the corresponding case when using the economic rights
index.
A significant upward shift is associated with a permanent transition from below to above the
global median of the investment profile index. An improvement in the investment profile moving
MENA from below to above the global median generates additional percentage points of growth,
resulting in a growth rate of 7.98 percent in 2020 rather than the actual 3.33 percent. These
results suggest that the growth effect of a permanent improvement in property rights is slightly
higher than that of a permanent transition to democracy, though both effects are positive and
economically substantial. The results are very similar when the economic freedom index is used
as a proxy for property rights.
8 http://www.imf.org/external/pubs/ft/weo/2015/02/weodata/index.aspx.
MENA QUARTERLY ECONOMIC BRIEF | ISSUE 6 | JANUARY 2016 26
Figure A1. Growth effect of democracy and investment profile
Figure A2. Growth effect of democracy and economic freedom
Long-run effect of democracy
1
2
3
4
5
6
7
8
9
10
11
12
13
14
15
Gro
wth
effe
ct (
%)
1 2 3 4 5 6 7 8 9 10 11 12 13 14 15Number of years after transition
democracy100 95% CI
Long-run effect of investment profile
1
2
3
4
5
6
7
8
9
10
11
12
13
14
15
Gro
wth
effe
ct (
%)
1 2 3 4 5 6 7 8 9 10 11 12 13 14 15Number of years after transition
investment100 95% CI
Long-run effect of democracy
1
2
3
4
5
6
7
8
9
10
11
12
13
14
15
Gro
wth
effect
(%
)
1 2 3 4 5 6 7 8 9 10 11 12 13 14 15Number of years after transition
Democracy 95% CI
Long-run effect of economic freedom
1
2
3
4
5
6
7
8
9
10
11
12
13
14
15
Gro
wth
effect
(%
)
1 2 3 4 5 6 7 8 9 10 11 12 13 14 15Number of years after transition
Economic freedom 95% CI
MENA QUARTERLY ECONOMIC BRIEF | ISSUE 6 | JANUARY 2016 27
Table A1: Panel estimates 1984-2012
Model 1 Model 2
Log real GDP PC (1st lag) 0.932*** (0.013)
0.931*** (0.021)
Democracy dummy 0.880* (0.460)
0.780* (0.470)
ICRG investment profile (dummy) 0.920*** (0.250)
Fraser Economic freedom index (dummy)
0.830** (0.370)
Constant 0.539*** (0.105)
0.561*** (0.159)
Country fixed effects? Year fixed effects?
Yes Yes
Yes Yes
Long run growth effect of democracy (%)
12.965 (7.068)
11.385 (8.266)
Effect of democracy on GDP PC after 15 years (%) 8.739 (4.604)
7.716 (2.030)
Long run growth effect of investment profile (%)
13.524 (3.722)
Effect of investment profile on GDP PC after 15 years (%) 9.117 (2.303)
Long run growth effect of economic freedom (%) 12.137 (5.420)
Effect of economic freedom on GDP PC after 15 years (%) 8.225 (2.164)
Observations 3500 2262
Number of countries 130 142
R2 0.949 0.953
Notes: Heteroscedasticity-consistent standard errors are reported in parentheses. Asterisks denote significance levels as follows: ***p<0.01, **p<0.05, *p<0.1. The coefficients of all regressors are multiplied by 100, except for Log real GDP PC (1st lag).
MENA QUARTERLY ECONOMIC BRIEF | ISSUE 6 | JANUARY 2016 28
REFERENCES
Acemoglu, D., Naidu, S., Restrepo, P. and Robinson, J.A. (2015) "Democracy Does Cause Growth", NBER Working Paper No. 20004 (http://economics.mit.edu/files/10554) (updated version). Blomberg, B., and Hess, G., and Orphanides, A. (2004) “The Macroeconomic Consequences of Terrorism”, CESifo Working Paper Series No. 1151; Claremont McKenna College Economics Working Paper No. 2004-04 (Available at SSRN: http://ssrn.com/abstract=525982). Collier, P. and Hoeffler, A. (2004) “Greed and Grievance in Civil War”, Oxford Economic Papers, Volume 56, Issue 4, 563-595. Collier, P. (2006) “Post-Conflict Economic Recovery”, A paper for the International Peace Academy, Oxford University, Department of Economics, Revised April. Devarajan, S. and Mottaghi, L. (2014) “Corrosive Subsidies”, MENA Economic Monitor, Washington, DC: World Bank, October. Devarajan, S. and Mottaghi, L. (2015a) “Plunging oil prices”, MENA Quarterly Economic Brief, Washington, DC: World Bank, January. Devarajan, S. and Mottaghi, L. (2015b) “Economic Implications of Lifting Sanctions on Iran”, MENA Quarterly Economic Brief” Washington, DC: World Bank, July. Enders, W., Sandler, T. and Praise, G. (1992) “An Econometric Analysis of the Impact of Terrorism and Tourism “, Kyklos, 45:4, 531-54. Gupta, S., Clements, B., Bhattacharya, R. and Chakravarti, S. (2002) “Fiscal Consequences of Armed Conflict and Terrorism in Low- and Middle-Income Countries”, IMF Working Paper No. 02/142, Washington DC. Hoeffler, A. and Reynal-Querol, M., (2003) “Measuring the Costs of Conflicts” in http://www.conflictrecovery.org/bin/2003 Ianchovichina, E. and Ivanic, M. (2014) “Economic effects of the Syrian war and the spread of the Islamic State on the Levant”, Policy Research Working Paper No. 6771, Washington, DC: World Bank Kraay, A. and Kiendrebeogo, Y. (2015) “Democracy, Property Rights and Growth in MENA”, mimeo.
Mottaghi, L. (2015) “MENA Economies Hit by Conflicts, Civil Wars and Lower Oil Prices”, Quick Notes #51, MENA Knowledge and Learning, Washington, DC: World Bank, October.
MENA QUARTERLY ECONOMIC BRIEF | ISSUE 6 | JANUARY 2016 29
Sab, R. (2014) “Economic Impact of Selected Conflicts in the Middle East: What Can We Learn from the Past?”, IMF working paper WP/14/100, Washington DC. Stewart, F., Huang, C., and Wang, M. (2001) “Internal Wars in Developing Countries: An Empirical Overview of Economic and Social Consequences”, in F. Stewart and V. Fitzgerald, eds., War and Underdevelopment: Volume 1, The Economic and Social Consequences of Conflict: Oxford University Press, 67-103. Syrian Center for Policy Research (2015) “Syria, Alienation and Violence: Impact of Syria Crisis Report“, UNDP, UNRWA, March. United Nations Development Program (2008) “Post-Conflict Economic Recovery: Enabling Local Ingenuity”, Bureau for Crisis Prevention and Recovery. Verme, P. et al. (2015) “The Welfare of Syrian Refugees: Evidence from Lebanon and Jordan”, World Bank and the UN Refugee Agency (UNHCR). World Bank (2013) “Lebanon Economic and Social Impact Assessment of the Syrian Conflict”, Washington, DC: World Bank, September. World Bank (2015) “Turkey’s Responses to the Syrian refugee crisis”, Washington, DC: World Bank, December. World Bank (2016) “Global Economic Prospects: Spillovers amid Weak growth”, Washington, DC: World Bank, January.


WORLD BANK MIDDLE EAST AND NORTH AFRICA REGION
MENA QUARTERLY ECONOMIC BRIEF, Issue 6, January 2016
THE ECONOMIC EFFECTS OF WAR AND PEACE
http://www.worldbank.org/en/region/mena/publication/mena-quarterly-economic-brief
WORLD BANK GROUP