the economic impact of physicians in oregon economic impact of physicians in oregon 3 executive...
TRANSCRIPT

The Economic Impact of
Physicians in Oregon
State Report PUBLISHED: March 2014
PREPARED FOR: PREPARED BY: The American Medical Association IMS Health Chicago, IL 1725 Duke Street
Suite 510 Alexandria, VA 22314
Table of Contents
Executive Summary ................................................................................. 3
Economic Impact Analyses ......................................................................... 6
Data Sources ....................................................................................... 9
Economic Impact for Oregon .................................................................... 10
Output .............................................................................................. 10
Jobs ................................................................................................. 10
Wages and Benefits ........................................................................... 11
Taxes ............................................................................................... 11
Broad Specialty .................................................................................. 12
10 Specialties .................................................................................... 13
Comparator Industry Analysis ................................................................... 14
Appendix. Methodological Overview ........................................................... 16
The Economic Impact of Physicians in Oregon
3
Executive Summary
Physicians are trusted leaders in the health care system, providing care to patients
across a variety of settings and within a multitude of specialties and subspecialties.
Through the care provided to their patients, physicians can have a positive and
lasting impact on the health of their patients and the health of the community as a
whole. However, the breadth of a physician’s impact reaches far beyond just the
provision of patient care. This can be observed by community and state economic
benefits (e.g., job creation, purchase of goods/services, and public program support
via tax revenues).
This report focuses on physicians (both doctors of medicine (MDs) and doctors of
osteopathy (DOs)) who are primarily engaged in patient care activities (as compared
to those who focus on research or teaching, for example). Physicians work in a wide
range of practice types/sizes. A 2012 American Medical Association survey of
physicians found that 53.2% of physicians were self-employed. While 60.1% worked
in practices that were wholly-owned by physicians, less than a quarter (23.4%)
worked in practices that were at least partly owned by a hospital and another 5.6%
were directly employed by a hospital.1 These figures, in particular, have increased
from a 2007/2008 AMA survey which found 16.3% were either directly employed by
a hospital or were employed in a hospital-owned practice. Keeping this range in
mind, this report focuses on all patient care physicians, regardless of whether they
are office- or hospital-based.2
1 Kane CK and Emmons DW. New Data On Physician Practice Arrangements: Private Practice Remains Strong
Despite Shifts Toward Hospital Employment. American Medical Association 2013. Accessed at: http://www.ama-assn.org/resources/doc/health-policy/prp-physician-practice-arrangements.pdf
2 Note that economic impact reports published by the AMA in 2011 included only office-based physicians.

The Economic Impact of Physicians in Oregon
4
Given the changing health care environment, it is paramount to quantify the
economic impact physicians have on society. This report provides key data which
may be used by policymakers, legislators and thought leaders in medicine to
demonstrate how patient care physicians critically support local economies and
enable jobs, growth, and prosperity in addition to ensuring the health of the
community.
This report provides estimates of the total economic impact of patient care
physicians on Oregon’s economy, measuring four vital economic barometers:
• Output,
• Jobs,
• Wages and benefits, and
• State and local tax revenue.
Total economic impact = direct + indirect economic impacts. The direct impact is
the value of the four vital economic barometers that are produced from physicians
while indirect
In addition, this report examines the economic impact across three broad specialty
groups (i.e., primary care, non-surgical and surgical) as well as 10 specialties
selected based on data availability (i.e., anesthesiology, cardiology, family medicine,
general surgery, internal medicine, obstetrics/gynecology, orthopaedic surgery,
otolaryngology, pediatrics and urology).
impact includes the same barometers which are generated by the
industries that are supported by physicians.
3
Physician economic impact varies across states and is dependent upon the number
of physicians in each state as well as other factors, such as the general economy and
the health care environment in particular.
Additionally, this report provides the
economic impact of select comparator industries, in order to allow for an assessment
of the economic impact of patient care physicians relative to these select industries.
3 Section II of the Appendix explains how the 10 specialties were selected.
The Economic Impact of Physicians in Oregon
5
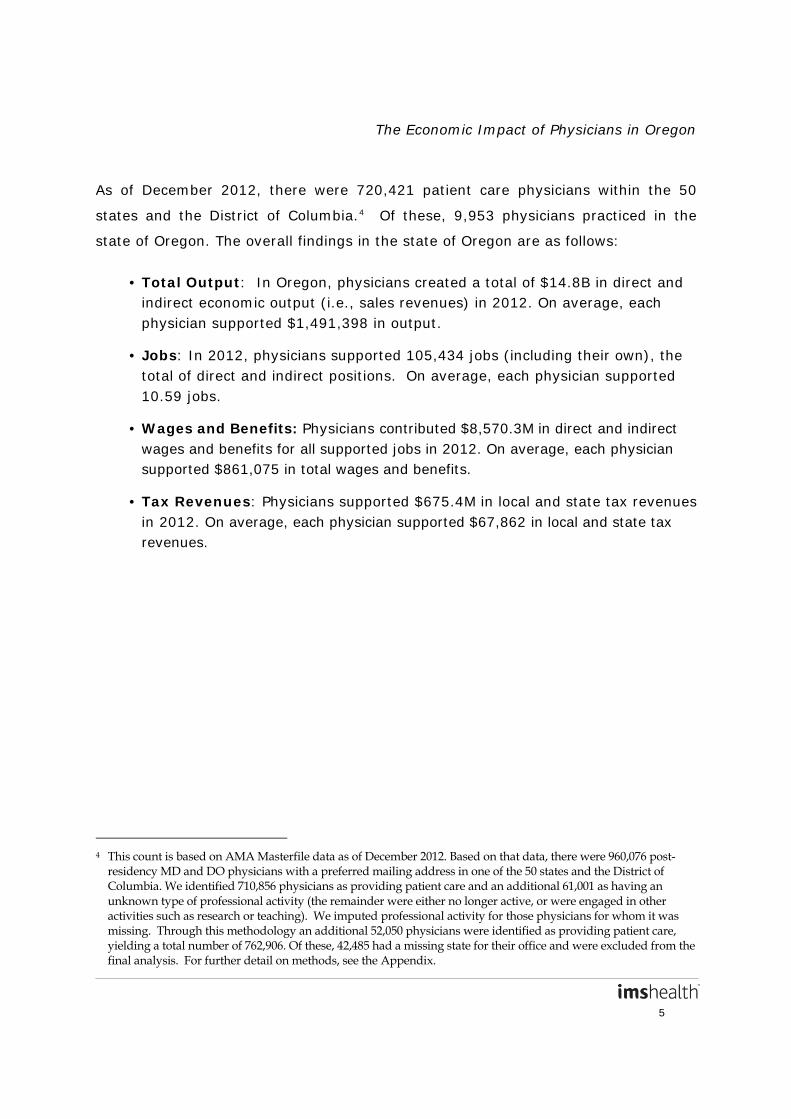
As of December 2012, there were 720,421 patient care physicians within the 50
states and the District of Columbia.4
• Total Output: In Oregon, physicians created a total of $14.8B in direct and indirect economic output (i.e., sales revenues) in 2012. On average, each physician supported $1,491,398 in output.
Of these, 9,953 physicians practiced in the
state of Oregon. The overall findings in the state of Oregon are as follows:
• Jobs: In 2012, physicians supported 105,434 jobs (including their own), the total of direct and indirect positions. On average, each physician supported 10.59 jobs.
• Wages and Benefits: Physicians contributed $8,570.3M in direct and indirect wages and benefits for all supported jobs in 2012. On average, each physician supported $861,075 in total wages and benefits.
• Tax Revenues: Physicians supported $675.4M in local and state tax revenues in 2012. On average, each physician supported $67,862 in local and state tax revenues.
4 This count is based on AMA Masterfile data as of December 2012. Based on that data, there were 960,076 post-
residency MD and DO physicians with a preferred mailing address in one of the 50 states and the District of Columbia. We identified 710,856 physicians as providing patient care and an additional 61,001 as having an unknown type of professional activity (the remainder were either no longer active, or were engaged in other activities such as research or teaching). We imputed professional activity for those physicians for whom it was missing. Through this methodology an additional 52,050 physicians were identified as providing patient care, yielding a total number of 762,906. Of these, 42,485 had a missing state for their office and were excluded from the final analysis. For further detail on methods, see the Appendix.
The Economic Impact of Physicians in Oregon
6
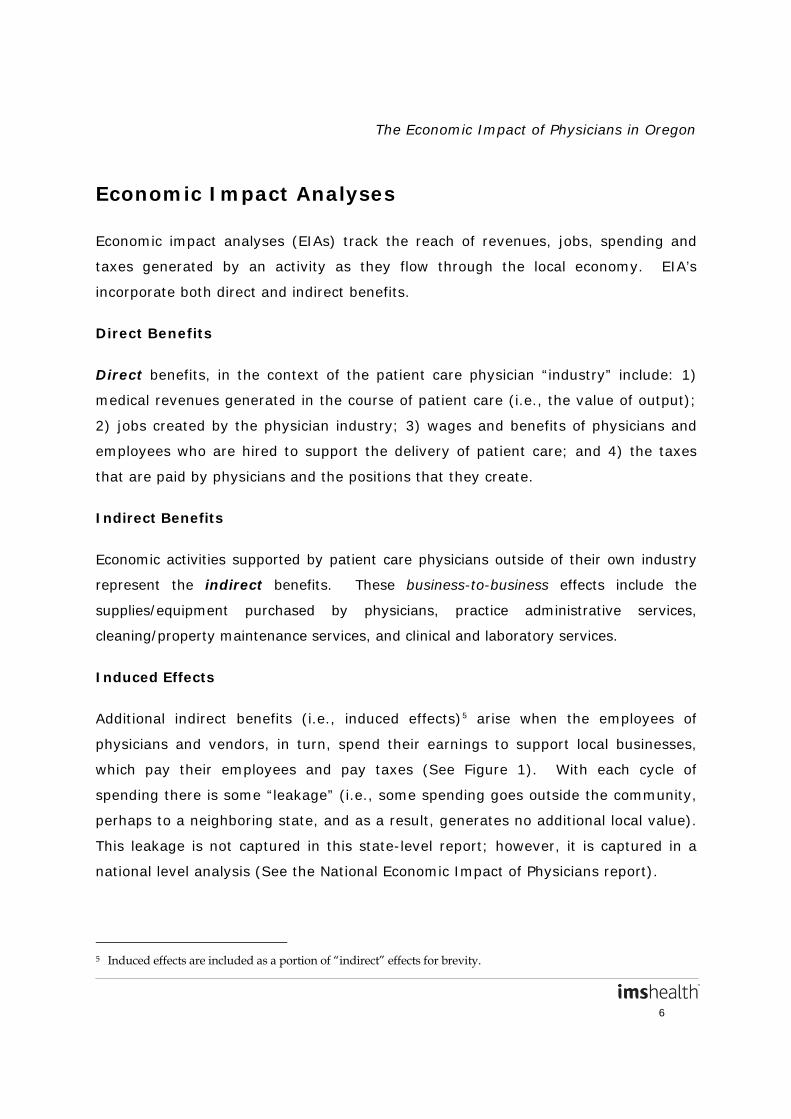
Economic Impact Analyses
Economic impact analyses (EIAs) track the reach of revenues, jobs, spending and
taxes generated by an activity as they flow through the local economy. EIA’s
incorporate both direct and indirect benefits.
Direct Benefits
Direct benefits, in the context of the patient care physician “industry” include: 1)
medical revenues generated in the course of patient care (i.e., the value of output);
2) jobs created by the physician industry; 3) wages and benefits of physicians and
employees who are hired to support the delivery of patient care; and 4) the taxes
that are paid by physicians and the positions that they create.
Indirect Benefits
Economic activities supported by patient care physicians outside of their own industry
represent the indirect benefits. These business-to-business effects include the
supplies/equipment purchased by physicians, practice administrative services,
cleaning/property maintenance services, and clinical and laboratory services.
Induced Effects
Additional indirect benefits (i.e., induced effects)5
arise when the employees of
physicians and vendors, in turn, spend their earnings to support local businesses,
which pay their employees and pay taxes (See Figure 1). With each cycle of
spending there is some “leakage” (i.e., some spending goes outside the community,
perhaps to a neighboring state, and as a result, generates no additional local value).
This leakage is not captured in this state-level report; however, it is captured in a
national level analysis (See the National Economic Impact of Physicians report).
5 Induced effects are included as a portion of “indirect” effects for brevity.
The Economic Impact of Physicians in Oregon
7
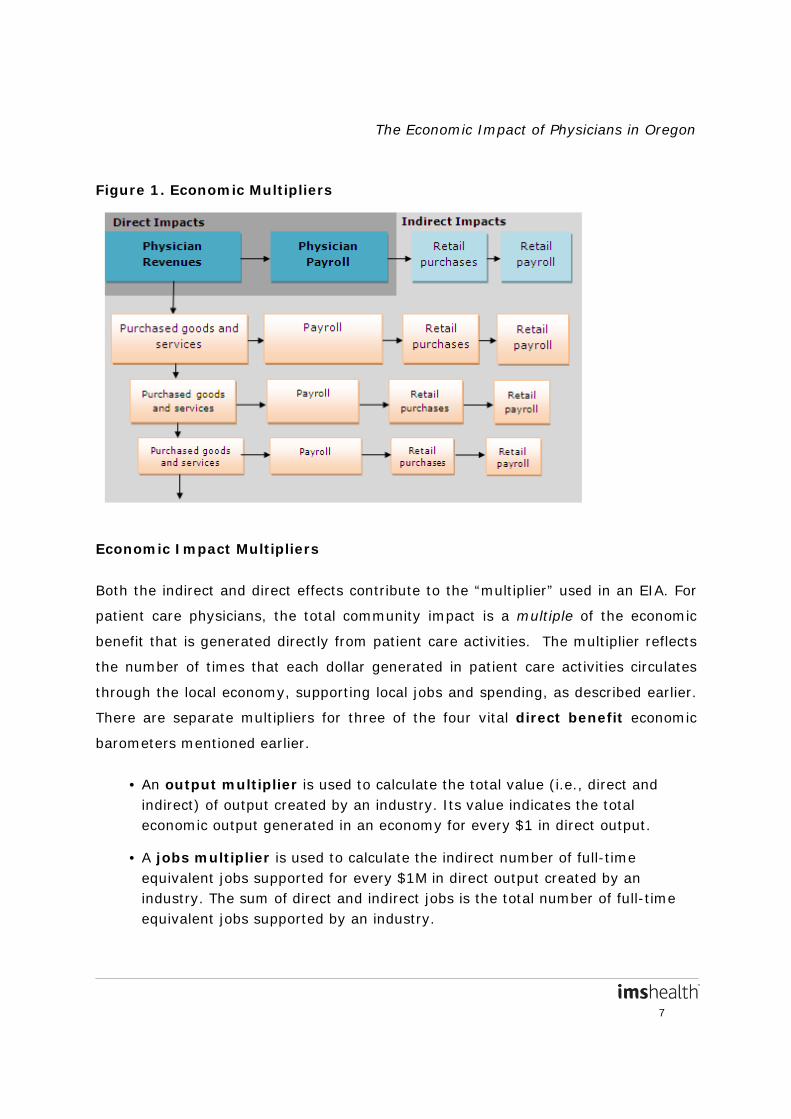
Figure 1. Economic Multipliers
Economic Impact Multipliers
Both the indirect and direct effects contribute to the “multiplier” used in an EIA. For
patient care physicians, the total community impact is a multiple of the economic
benefit that is generated directly from patient care activities. The multiplier reflects
the number of times that each dollar generated in patient care activities circulates
through the local economy, supporting local jobs and spending, as described earlier.
There are separate multipliers for three of the four vital direct benefit economic
barometers mentioned earlier.
• An output multiplier is used to calculate the total value (i.e., direct and indirect) of output created by an industry. Its value indicates the total economic output generated in an economy for every $1 in direct output.
• A jobs multiplier is used to calculate the indirect number of full-time equivalent jobs supported for every $1M in direct output created by an industry. The sum of direct and indirect jobs is the total number of full-time equivalent jobs supported by an industry.

The Economic Impact of Physicians in Oregon
8
• A wages and benefits multiplier is used to calculate the indirect wages and benefits supported for every $1 in direct output. The sum of direct and indirect wages and benefits is the total wages and benefits supported by an industry.
Multipliers are specific to geographic areas and particular industries and their values
can vary widely. Multipliers are larger when a dollar earned by a business (e.g., a
physician practice) is spent in the community, supporting jobs and other local
businesses (who pay their employees, who in turn buy more goods and services,
etc.). Multipliers are smaller when business revenues are spent (leak) outside the
community or are spent on goods or services that support fewer local jobs.
In general, multipliers for small community areas will be smaller compared to larger
areas as establishments in smaller areas must often look outside of their immediate
communities to find inputs. As health care is often considered to be ‘local’, health
care multipliers tend to be higher than those for many other industries as physicians
and their staff tend to live in the community and their services support the local
community.
The multipliers for Oregon are as follows:
• Output multiplier: 1.867, indicating an additional $0.87 of indirect output is generated for every $1 in direct output (See the Appendix for a discussion of the observed changes in output multipliers from 2010 to 2011).
• Jobs multiplier: 7.455, indicating an additional 7.46 indirect full time jobs are supported for every $1M in direct output.
• Wages and benefits multiplier: 0.301, indicating an additional $0.30 of indirect wages and benefits is generated for every $1 in direct output.
The Economic Impact of Physicians in Oregon
9
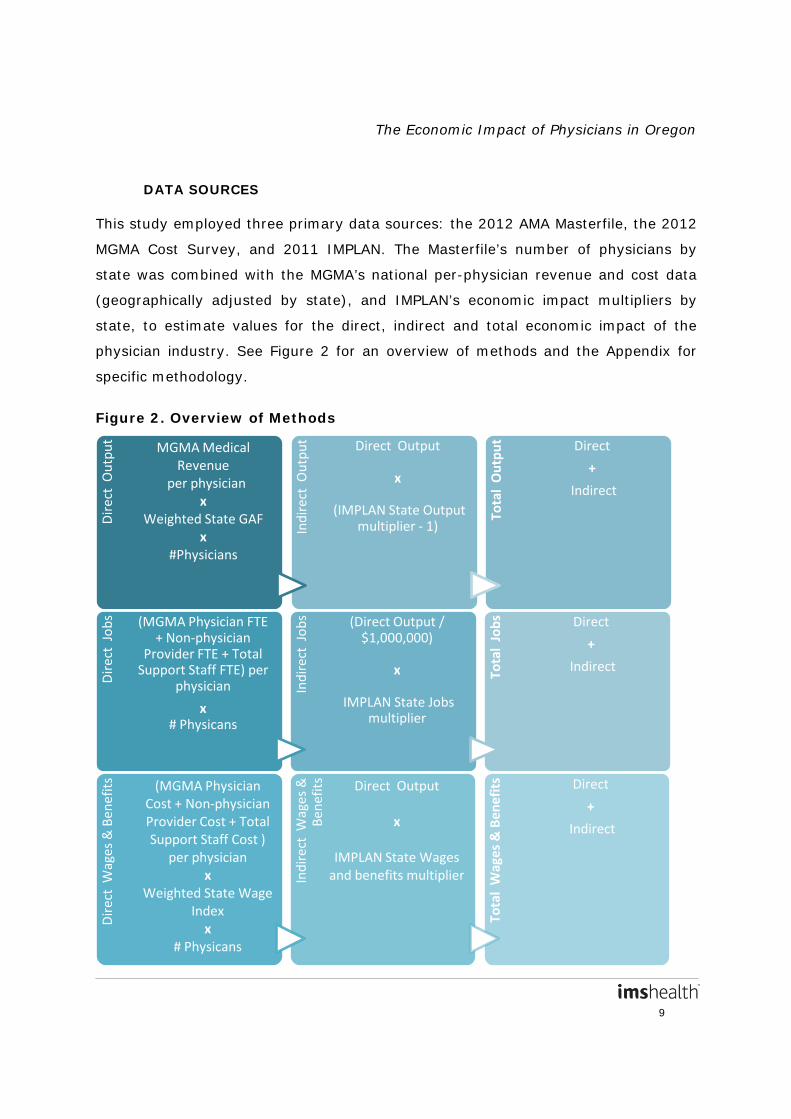
DATA SOURCES
This study employed three primary data sources: the 2012 AMA Masterfile, the 2012
MGMA Cost Survey, and 2011 IMPLAN. The Masterfile’s number of physicians by
state was combined with the MGMA’s national per-physician revenue and cost data
(geographically adjusted by state), and IMPLAN’s economic impact multipliers by
state, to estimate values for the direct, indirect and total economic impact of the
physician industry. See Figure 2 for an overview of methods and the Appendix for
specific methodology.
Figure 2. Overview of Methods
Dir
ect
Out
put MGMA Medical
Revenue per physician
x Weighted State GAF
x #Physicians
Indi
rect
Out
put Direct Output
x
(IMPLAN State Output multiplier - 1)
Tota
l O
utpu
t Direct
+
Indirect
Dir
ect
Jobs
(MGMA Physician FTE + Non-physician
Provider FTE + Total Support Staff FTE) per
physician
x # Physicans
Indi
rect
Job
s (Direct Output / $1,000,000)
x
IMPLAN State Jobs multiplier
Tota
l Jo
bs
Direct
+
Indirect
Dir
ect
Wag
es &
Ben
efits
(MGMA Physician Cost + Non-physician Provider Cost + Total Support Staff Cost )
per physician x
Weighted State Wage Index
x # Physicans
Indi
rect
Wag
es &
Be
nefit
s Direct Output
x
IMPLAN State Wages and benefits multiplier
Tota
l W
ages
& B
enef
its Direct
+
Indirect

The Economic Impact of Physicians in Oregon
10
Economic Impact for Oregon
Table 1 provides a snapshot of the economic impact of Oregon patient care
physicians. Direct and indirect economic benefits for each measure contribute to the
overall benefit. Total output, jobs, and wages and benefits are also presented by
broad physician specialty (Table 2), as well as for 10 specialties (Table 3).
Table 1: Total Output, Jobs, Wages & Benefits, and State and Local Taxes
Supported by Physicians in Oregon, 2012
Economic Measure Total Per Physician
Number of Physicians 9,953 -
Output $14.8 billion $1,491,398
Jobs 105,434 10.59
Wages & Benefits $8,570.3 million $861,075
State and Local Taxes $675.4 million $67,862
OUTPUT
Physicians generated $7,950.6M in direct output (See the Appendix for a discussion
of the observed changes in medical revenue from 2009 to 2012).The total output of
patient care physicians sums the direct and indirect output generated by the
industry. Physicians generated $14.8B in total output, or an average of $1,491,398
per physician.
JOBS
A total of 9,953 patient care physicians were practicing in Oregon as of December
2012. The number of jobs directly created by patient care physicians (including the
number of physicians themselves) in the state was 46,160. The total number of jobs
supported by patient care physicians in Oregon was 105,434; the average physician
supported 10.59 jobs in the economy, including his or her own.

The Economic Impact of Physicians in Oregon
11
WAGES AND BENEFITS
Compensation, i.e., the wages and benefits that are paid to local residents, is also
an important measure of an industry’s value to the local economy.6
TAXES
The value of
direct wages and benefits in Oregon includes compensation paid to physicians and
non-physician staff who are on payroll. This direct amount of wages and benefits
totaled to $6,179.7M in the state in 2012. The total amount of wages and benefits
supported by patient care physicians in Oregon was $8,570.3M (including the
indirect wages and benefits supported by the industry), or an average of $861,075
per physician.
The total tax contribution is computed by summing taxation on employee income,
proprietor income, indirect business interactions, households, and corporations. Tax
revenues are included from the patient care physician industry (direct) and from
other affected industries (indirect). These are the “total” tax revenues supported by
the industry.
The state and local taxes incorporated in this study include:
• Social Security taxes: the state portions of Social Security taxes, both the employee and employer paid portions;
• Personal taxes: state and local income taxes, gift and estate taxes, motor vehicles taxes/fees, fishing/hunting and other license fees, property taxes, personal property taxes, and other fines/fees or donations;
• Business taxes: corporate profits and dividends taxes; and
6 For ease of reading, “wages and benefits” is used to mean salaries and wages plus other forms of compensation
paid to employees, e.g., benefits, for the remainder of this report. Values include wages and benefits to all support staff, non-physician practitioners and physicians.
The Economic Impact of Physicians in Oregon
12
• Indirect business taxes: property taxes, sales taxes, motor vehicle licensing, severance taxes, non-tax payments (e.g., rents and royalties, special assessments, fines, settlements and donations), and other taxes (including business licenses, documentary and stamp taxes).7
The aggregate local and state taxes generated by patient care physicians in 2012
totaled $675.4M, or an average of $67,862 per physician.
BROAD SPECIALTY
Due to likely variation between specialties, we examined economic impacts across
three broad specialty groups (primary care, non-surgical and surgical) (Table 2).
There were 3,862 physicians classified under the broad specialty of primary care
(representing 38.8% of all patient care physicians), 3,404 physicians classified under
non-surgical (representing 34.2%), and 2,687 physicians classified under surgical
(representing 27.0%).
In each state, non-surgical specialties generated the highest output, jobs, and wages
and benefits. This was partly due to physicians in that broad specialty group having
the highest direct and total revenue and wages and benefits on a per physician
basis. While primary care physicians supported slightly more direct jobs (4.89) on a
per-physician basis (slightly higher than non-surgical physicians (4.58)), non-
surgical physicians generated the highest total jobs due to more indirect jobs
supported by higher non-surgical output. In some states, higher total jobs for non-
surgical specialties was also related to a larger number of non-surgical specialists
relative to primary care physicians. In Oregon, total output across broad specialties
ranged from $3,834.9M for primary care to $6,282.7M for non-surgical. Total jobs
ranged from 30,565 for surgical to 40,670 for non-surgical. Total wages and benefits
ranged from $2,438.3M for primary care to $3,674.8M for non-surgical.
7 Olsen DC. Using Social Accounts to Estimate Tax Impacts. MIG, Inc. Available through IMPLAN.com. (Paper
originally given at the Mid-Continent Regional Science Association Meetings in Minneapolis, MN; June 11, 1999.)

The Economic Impact of Physicians in Oregon
13
Table 2: Total Economic Impact of Physicians in Oregon, by Broad Specialty
Broad Specialty Number of Physicians
Output
($ in millions)
Jobs Wages & Benefits
($ in millions) Primary care 3,862 $3,834.9 34,199 $2,438.3 Non-surgical 3,404 $6,282.7 40,670 $3,674.8
Surgical 2,687 $4,726.3 30,565 $2,457.2 Total 9,953 $14,843.9 105,434 $8,570.3
10 SPECIALTIES
Lastly, we examined the economic impacts for 10 specialties (Table 3). In Oregon,
the number of patient care physicians ranged from a low of 155 for urology to a high
of 1,854 for internal medicine.
In general, state-level economic impacts were lowest among urologists and
otolaryngologists, and highest among family practice and internal medicine
specialists. One driver of this phenomenon is specialty size. Those specialties often
had the fewest and greatest numbers of physicians, respectively. In Oregon, total
output across the 10 specialties ranged from $279.0M for otolaryngology to
$2,091.1M for internal medicine. Total jobs ranged from 1,959 for urology to 17,757
for family medicine. Total wages and benefits ranged from $149.0M for urology to
$1,206.0M for internal medicine.
Table 3: Total Economic Impact of Physicians in Oregon, for 10 Select
Specialties
Specific Specialty Number of Physicians
Output
($ in millions)
Jobs Wages & Benefits
($ in millions) Anesthesiology 670 $1,020.8 5,805 $662.3
Cardiology 260 $524.1 3,492 $305.4 Family medicine 1,725 $1,953.6 17,757 $1,147.1 General surgery 480 $616.6 4,272 $387.3
Internal medicine 1,854 $2,091.1 17,377 $1,206.0 Obstetrics/Gynecology 643 $989.4 7,274 $516.7 Orthopaedic surgery 419 $921.4 6,314 $526.3
Otolaryngology 160 $279.0 2,010 $158.4 Pediatrics 751 $941.5 7,565 $483.5 Urology 155 $280.3 1,959 $149.0

The Economic Impact of Physicians in Oregon
14
Comparator Industry Analysis
To help frame the relative economic impact of patient care physicians, we also
assessed the economic impacts of other industries both within and outside the health
care industry:
1. Higher education (junior college, university, and professional schools),
2. Nursing home and residential care facilities,
4. Legal services, and
5. Home health.
IMPLAN was instrumental as it provides 2011 output, jobs, and wages and benefits
data and multipliers for the following industries: Private junior colleges, colleges,
universities, and professional schools (IMPLAN industry code 392), Nursing and
residential care facilities (398), Legal services (367), and Home health care services
(395).
Table 4: Comparator Industry Total Economic Impacts in Oregon
Industry Output
($ in millions)
Jobs Wages & Benefits
($ in millions) Physicians $14,843.9 105,434 $8,570.3
Higher Education $2,355.0 26,560 $847.8 Nursing Home/ Residential
Care Facilities $4,838.9 66,009 $2,061.0
Legal Services $4,517.9 37,334 $1,554.0 Home Health $542.5 7,620 $256.3

The Economic Impact of Physicians in Oregon
15
OUTPUT
Physicians generated a greater total output than the higher education, nursing
home, legal and home health industries in each state. The only exception was
the legal industry within the District of Columbia, with a total output of $15.2B
compared to $5.6B for physicians. In Oregon, physicians supported $14,843.9M
in total output. Across comparator industries, total output ranged from $542.5M
for home health to $4,838.9M for nursing homes.
JOBS
In most states, physicians supported more jobs than the higher education, nursing
home, legal or home health industries. In the District of Columbia, the number of
jobs supported by the legal industry was the highest, while in a few states, the
number of jobs supported by the nursing home industry was the highest. In Oregon,
physicians supported 105,434 total jobs. Across comparator industries, total jobs
ranged from 7,620 for home health to 66,009 for nursing homes.
WAGES AND BENEFITS
Physicians supported higher total wages and benefits for all comparator industries
across the states, with one exception; the legal industry in the District of Columbia.
This suggests that physicians compensate their employees well, who in turn are able
to purchase services from other industries in the state, and therefore stimulate their
state economy. In Oregon, physicians supported $8,570.3M in wages and benefits.
Across comparator industries, total wages and benefits ranged from $256.3M for
home health to $2,061.0M for nursing homes.

The Economic Impact of Physicians in Oregon
16
Appendix. Methodological Overview
Three primary data sources were employed in this study: the 2012 AMA Masterfile,
the 2012 MGMA Cost Survey, and 2011 IMPLAN. The Masterfile’s number of
physicians was combined with the MGMA’s per-physician revenue and cost data and
IMPLAN’s economic impact multipliers to estimate values for the direct, indirect and
total economic impact of the physician industry.
The AMA Masterfile contains current and historical data on all physicians, including
members and non-members of the AMA, and graduates of foreign medical schools
who are in the U.S. and meet educational standards for recognition as physicians. It
includes information on geographic location, as well as physician characteristics such
as specialty and major professional activity. Masterfile data as of December
2012 was used for this analysis.
AMA Masterfile
The MGMA’s Cost Survey report provides national data on the financial
characteristics of physician practices including total medical revenue and total
payroll costs per full-time physician equivalent. Data are provided for a number of
common specialties, as well as by three broad specialty types (primary care, surgical
and non-surgical specialties). Data are provided for 2012. The data provides
information to evaluate different aspects of medical practice performance and to
help make policy decisions about medical practice operations. The Cost Survey
represents data from more than 2,000 MGMA member medical groups representing
more than 46,000 providers and is the largest provider population of any cost survey
in the United States.
MGMA’s Cost Survey
The Economic Impact of Physicians in Oregon
17
IMPLAN
IMPLAN (IMpact analysis for PLANning) is the input-output economic impact
modeling system developed by the Minnesota Implan Group. IMPLAN is used to
create models of economies allowing for in-depth examinations of economic impacts.
The 2011 IMPLAN system estimates output, employment, and labor income
multipliers for each industry, at the state and national level, as well as total tax
revenues (state and local) generated using a Social Accounting System. Data are
taken from a number of sources including the Bureau of Labor Statistics (BLS), the
Bureau of Economic Analyses (BEA) and the U.S. Census Bureau.
I. 2012 AMA Masterfile
The AMA Physician Masterfile was used to estimate the number of post-residency
physicians who provide patient care in each state, in aggregate and by specialty.
Each record within the Masterfile corresponds to one physician.
Patient care physicians
As of December 2012, 960,076 physicians (excluding residents) had a preferred
mailing address in one of the 50 states/DC.
The Masterfile categorizes physicians by major professional activity (MPA), a variable
based on physician-provided data on present employment and type of practice. In
order to arrive at our final sample for analysis, we first limited the Masterfile data to
710,856 (74.0%) physicians whose MPA is the provision of patient care.8
8 Note that the prior national and state reports, on “The Economic Impact of Office-Based Physicians” in 2009, and
last updated April 2011, focused only on office-based and locum tenens physicians.
These
physicians are the population of interest, inclusive of both office- and hospital-based
physicians as well as locum tenens physicians. Another 61,001 (6.4%) were
identified as “not classified” because the AMA had not received any recent
information as to their type of practice and present employment.

The Economic Impact of Physicians in Oregon
18
Table A-1: 2012 AMA Masterfile Physicians by MPA Description
MPA N % Hospital Based Full-Time Physician Staff 86,607 9.0%
Office-Based Practice 622,840 64.9% Locum Tenens 1,409 0.1% Administration 14,004 1.5%
Inactive 146,113 15.2% Medical Teaching 9,868 1.0%
Not Classified 61,001 6.4% Other 4,690 0.5%
Research 13,544 1.4% Total 960,076 100.0%
For the 61,001 (6.4%) physicians who did not provide any responses indicating
whether or not they provide patient care on a regular basis, we imputed the
physician’s MPA/the provision of patient care. We assume that a portion of these
unclassified physicians provide patient care on a regular basis. Therefore, we would
underestimate the portion of physicians providing patient care on a regular basis if
we were to exclude all unclassified physicians, and we would overestimate the
portion of physicians providing patient care on a regular basis if we include all of
them. We estimated a binary logit model using GLM parameterization to model the
likelihood of providing patient care (as a binary outcome, either providing or not
providing patient care).
After examining the variable response distribution between physicians providing
patient care, not providing patient care and unclassified, we decided on a final set of
independent variables for inclusion and examined co-linearity between potential
variables. Our final model included the following categorical variables: 1) age group,
2) gender, 3) physician is or is not board certified, 4) MD or DO, 5) CBSA level of the
preferred address (i.e. Metropolitan or Micropolitan), 6) physician does or does not
have an NPI number, 7) physician does or does not have a DEA number, 8) primary
specialty, 9) physician is or is not an International Medical Graduate and 10) state of
the preferred address is or is not the same as the state of the office, in addition to
the following interaction terms: 11) age (continuous) * broad specialty, and 12)
gender * broad specialty. The resulting model had a c statistic of 0.915. For the
The Economic Impact of Physicians in Oregon
19
output of the model, we specified the creation of a dataset which includes an
assigned probability to each physician of whether that physician provides patient
care based on his/her available data for the independent variables used in the
model. Based on the observed ratio of patient care to non-patient care among
physicians with non-missing MPA (79.1 to 20.9), we used this event rate as the
predicted probability threshold and categorized physicians with a probability of
greater or equal to .791 as providing patient care and physicians with a probability
of less than .791 as not providing patient care.
Of the 61,001 physicians with unclassified MPA, 52,050 (85.3%) were imputed as
providing patient care, yielding a total number of 762,906 physicians providing
patient care. Non-missing state of office location was required for this analysis, as
the state is the location of the economic activity. Our final sample consisted of
720,421 physicians with a non-missing state for their office location.
Region
Physicians were classified by state. The AMA Masterfile includes information on office
location and preferred professional mailing address, which could be either home or
office. Should a physician have an office in one state and reside in another, the office
location variable was used because, as stated above, the office is the location of the
economic activity.
Specialty
The Masterfile contains physician-reported data on a physician’s primary specialty.
Using this, physicians were mapped to three broad specialty types (primary care,
non-surgical and surgical specialties). Physicians with missing primary specialty
within a state were prorated to the three broad specialties in proportion to the
number of physicians known to be in those broad specialties in that state.
The Economic Impact of Physicians in Oregon
20
Additionally, we examined economic impacts for 10 specialties for which MGMA data
were available (See Section II of this Appendix):
1) Anesthesiology
2) Cardiology
3) Family medicine
4) General surgery
5) Internal medicine
6) Obstetrics/Gynecology
7) Orthopaedic surgery
8) Otolaryngology
9) Pediatrics
10) Urology
II. 2012 MGMA Cost Survey
MGMA provides physician data at the national level. Reports may be obtained at
either the single specialty or the multispecialty level. MGMA data was used to
estimate per-physician output (revenue), jobs, and wages and benefits for 2012, by
specialty. Only data for single specialty physicians were included in this analysis.
Data are provided for overall practices as well as by legal ownership of a practice
(physician owned, hospital/integrated delivery system (IDS) owned or other). There
were observed differences in medical revenue between physician-owned and
hospital-owned practices, related to accounting differences. For hospital-owned
practices, medical revenue in the MGMA Cost Survey is underreported, as some
practice revenue is accounted for as hospital revenue, particularly that for ancillary
services. Therefore, we calculated a weighted average of medical revenue
considering both physician-owned and imputed hospital-owned revenue (See the
Variables section for more details). Because MGMA data are provided at the national
level, output and wages and benefits were geographically adjusted to specific states.

The Economic Impact of Physicians in Oregon
21
MGMA Specialties
Practices that respond to the MGMA survey record the specialties of their member
physicians. Those specialties are then mapped to 110 specialty categories.
Specialties that do not fall into the 110 categories are listed as “Other single
specialty.” However, no specific data are provided for this Other category, as the
specialties included may be heterogeneous (combined data may not be meaningful).
At the single specialty level, more granular reports may be obtained for 34 individual
specialties (data at the individual specialty level are only reported where 10 or more
practices of a specialty provide a survey response). Data on single specialties are
also reported into 3 broader groupings: primary care, non-surgical and surgical
specialties (See Table A-2 for available single specialties and the single specialties
that fall under the 3 broader groups). The “Other single specialty” does not feed into
any of these 3 groups.
Because physician specialty was used to link MGMA data with AMA data, specialty
categories were cross-walked between the two datasets. While the Masterfile data
offer flexibility in the creation of aggregate specialties from its 200+ specialty
categories, MGMA data software offers limited options with set definitions. MGMA
specialties, therefore, were the limiting factor in our specialty-to-specialty match-up
across files.
In this analysis, we used the high-level categorization of the three broad specialty
categories: primary care, non-surgical and surgical specialties. This is a
classification scheme defined by MGMA. We mapped AMA specialties to the three
broad specialties following MGMA definitions. Table A-2 shows which specialties
MGMA included in the three broad categories, as well as the AMA primary specialties
we allocated to each of the three in order to best match the MGMA definitions.

The Economic Impact of Physicians in Oregon
22
Table A-2: AMA Masterfile and MGMA Specialties, by Broad Specialty
MGMA AMA Primary care
Family Medicine: Sports Medicine Adolescent Medicine (Family Medicine) Family Medicine: Urgent care Adolescent Medicine (Internal Medicine) Family Medicine: with Obstetrics Adolescent Medicine (Pediatrics) Family Medicine: without Obstetrics Family Medicine Geriatrics General Practice Internal Medicine: General Geriatric Medicine (Family Medicine) Internal Medicine: Pediatrics Geriatric Medicine (Internal Medicine) Pediatrics: Adolescent Medicine Hospice & Palliative Medicine (Family Medicine) Pediatrics: General Hospice & Palliative Medicine (Internal Medicine)
Adolescent Medicine (Family Medicine) Adolescent Medicine (Internal Medicine)
Non-surgical Allergy/Immunology Advanced Heart Failure And Transplant Cardiology
(Internal Medicine) Cardiology: Electrophysiology Clinical & Laboratory Immunology (Pediatrics) Cardiology: Invasive Clinical And Laboratory Immunology (Internal Medicine) Cardiology: Invasive/Interventional Critical Care Medicine (Internal Medicine) Cardiology: Noninvasive Hematology (Internal Medicine) Critical Care: Intensivist Sleep Medicine (Internal Medicine) Dentistry Sleep Medicine (Otolaryngology) Dermatology Sleep Medicine (Pediatrics) Emergency Medicine Sports Medicine (Emergency Medicine) Endocrinology/Metabolism Transplant Hepatology (Internal Medicine) Gastroenterology Abdominal Radiology Gastroenterology: Hepatology Addiction Psychiatry Genetics Allergy Hematology/Oncology Allergy And Immunology Hematology/Oncology: Oncology (only) Anatomic Pathology Infectious Disease Anatomic/Clinical Pathology Internal Medicine: Hospitalist Blood Banking/Transfusion Medicine Nephrology Cardiothoracic Radiology Neurology Cardiovascular Disease OB/GYN: Maternal and Fetal Medicine Chemical Pathology OB/GYN: Reproductive Endocrinology Child & Adolescent Psychiatry Occupational Medicine Child Neurology Orthopedics: Nonsurgical Clinical Biochemical Genetics Pathology: Anatomic Clinical Cardiac Electrophysiology Pathology: Anatomic and Clinical Clinical Cytogenetics Pathology: Clinical Clinical Genetics Pediatrics: Allergy/Immunology Clinical Laboratory Immunology (Allergy & Immunology) Pediatrics: Cardiology Clinical Molecular Genetics Pediatrics: Child Development Clinical Neurophysiology Pediatrics: Clinical and Lab Immunology Clinical Pathology Pediatrics: Critical Care Intensivist Cytopathology Pediatrics: Emergency Medicine Dermatology Pediatrics: Endocrinology Dermatopathology (Pathology)

The Economic Impact of Physicians in Oregon
23
Pediatrics: Gastroenterology Diabetes Pediatrics: Genetics Diagnostic Radiology Pediatrics: Hematology/Oncology Emergency Medical Services Pediatrics: Hospitalist Emergency Medicine Pediatrics: Infectious Disease Endocrinology, Diabetes & Metabolism Pediatrics: Neonatal Medicine Epilepsy (Neurology) Pediatrics: Nephrology Forensic Psychiatry Pediatrics: Neurology Gastroenterology Pediatrics: Pulmonology Geriatric Psychiatry Pediatrics: Rheumatology Hematology (Pathology) Physiatry (Physical Medicine and Rehabilitation) Hematology/Oncology Podiatry: General Hepatology Psychiatry: Child and Adolescent Hospitalist Psychiatry: Forensic Immunology Psychiatry: General Infectious Disease Psychiatry: Geriatric Interventional Cardiology Pulmonary Medicine: General Maternal And Fetal Medicine Pulmonary Medicine: Critical Care Medical Biochemical Genetics Radiation Oncology Medical Genetics Radiology: Diagnostic-Invasive Medical Oncology Radiology: Diagnostic-Noninvasive Medical Toxicology (Emergency Medicine) Radiology: Nuclear Medicine Medical Toxicology (Pediatrics) Rheumatology Molecular Genetic Pathology (Medical Genetics) Sleep Medicine Molecular Genetic Pathology (Pathology And Medical
Genetics) Musculoskeletal Oncology Musculoskeletal Radiology Neonatal-Perinatal Medicine Nephrology Neurodevelopmental Disabilities (Pediatrics) Neurodevelopmental Disabilities (Psychiatry & Neurology Neurology Neurology/Diagnostic Radiology/Neuroradiology Neuromuscular Medicine (Neurology) Neuromuscular Medicine (Physical Medicine &
Rehabilitation) Neuropathology Neuropsychiatry Neuroradiology Nuclear Cardiology Nuclear Radiology Nutrition Occupational Medicine Osteopathic Manipulative Medicine Pain Management Pain Medicine Pediatric Allergy Pediatric Cardiology Pediatric Critical Care Medicine Pediatric Dermatology

The Economic Impact of Physicians in Oregon
24
Pediatric Emergency Med (Emergency Med) Pediatric Emergency Medicine (Pediatrics) Pediatric Endocrinology Pediatric Gastroenterology Pediatric Hematology-Oncology Pediatric Infectious Disease Pediatric Pathology Pediatric Pulmonology Pediatric Radiology Pediatric Rehabilitation Medicine Pediatric Rheumatology Pediatric Transplant Hepatology Physical Medicine And Rehabilitation Procedural Dermatology Psychiatry Psychiatry/Neurology Psychoanalysis Psychosomatic Medicine Pulmonary & Critical Care Medicine Pulmonary Disease Radiation Oncology Radiology Reproductive Endocrinology And Infertility Rheumatology Selective Pathology Sleep Medicine Sleep Medicine (Psychiatry & Neurology) Undersea & Hyperbaric Medicine (Emergency Medicine) Vascular And Interventional Radiology Vascular Neurology Critical Care Medicine (Emergency Medicine) Hospice & Palliative Medicine (Emergency Medicine) Hospice & Palliative Medicine (Physical Medicine &
Rehabilitation) Hospice & Palliative Medicine (Psychiatry & Neurology) Hospice & Palliative Medicine (Radiology) Pain Medicine (Neurology) Pain Medicine (Physical Medicine & Rehabilitation) Pain Medicine (Psychiatry) Spinal Cord Injury Medicine Sports Medicine (Physical Medicine & Rehabilitation) Endovascular Surgical Neuroradiology (Neurology) Endovascular Surgical Neuroradiology (Radiology) Pediatric Nephrology Child Abuse Pediatrics Emergency Medicine/Family Medicine Family Medicine/Preventive Medicine Internal Med/Emergency Med/Critical Care Med Internal Med/Phys Med And Rehabilitation Internal Med/Psychiatry

The Economic Impact of Physicians in Oregon
25
Internal Medicine/Dermatology Internal Medicine/Emergency Medicine Internal Medicine/Medical Genetics Internal Medicine/Neurology Internal Medicine/Preventive Medicine Medical Toxicology (Preventive Medicine) Pediatrics/Dermatology Pediatrics/Medical Genetics Pediatrics/Physical Medicine And Rehabilitation Psychiatry/Family Medicine Undersea & Hyperbaric Medicine (Preventive Medicine) Addiction Medicine Aerospace Medicine Clinical Pharmacology Legal Medicine Medical Management Medical Microbiology Nuclear Medicine Pediatrics/Emergency Medicine Pediatrics/Psychiatry/Child & Adolescent Psychiatry Pharmaceutical Medicine Phlebology Vascular Medicine Developmental-Behavioral Pediatrics Epidemiology Hospice & Palliative Medicine Palliative Medicine General Preventive Medicine Public Health And General Preventive Medicine Forensic Pathology
Surgical Anesthesiology Critical Care Medicine (Anesthesiology) Anesthesiology: Pain Management Critical Care Medicine (Obstetrics & Gynecology) Anesthesiology: Pediatric Foot And Ankle Orthopaedics Dermatology: Mohs Surgery Hand Surgery (Orthopaedics) OB/GYN: Gynecology (Only) Hospice & Palliative Medicine (Anesthesiology) OB/GYN: Gynecological Oncology Hospice & Palliative Medicine (Obstetrics &
Gynecology) Obstetrics/Gynecology: General Hospice & Palliative Medicine (Surgery) Ophthalmology Orthopaedic Trauma Ophthalmology: Pediatric Pain Medicine (Anesthesiology) Ophthalmology: Retina Pediatric Orthopaedics Orthopedic Surgery: General Sports Medicine (Orthopaedic Surgery) Orthopedic Surgery: Foot and Ankle Abdominal Surgery Orthopedic Surgery: Hand Adult Cardiothoracic Anesthesiology
(Anesthesiology) Orthopedic Surgery: Hip and Joint Adult Reconstructive Orthopaedics Orthopedic Surgery: Oncology Anesthesiology Orthopedic Surgery: Pediatric Colon And Rectal Surgery Orthopedic Surgery: Spine Complex General Surgical Oncology (Surgery)

The Economic Impact of Physicians in Oregon
26
Orthopedic Surgery: Sports Medicine Congenital Cardiac Surgery (Thoracic Surgery) Orthopedic Surgery: Trauma Cosmetic Surgery Otorhinolaryngology Craniofacial Surgery Otorhinolaryngology: Pediatric Dermatologic Surgery Podiatry: Surgical Foot and Ankle Endovascular Surgical Neuroradiology (Neurological
Surgery) Podiatry: Surgical Forefoot only Facial Plastic Surgery Surgery: Cardiovascular Female Pelvic Medicine And Reconstructive Surgery
(Obstetrics & Gynecology Surgery: Cardiovascular Pediatric General Surgery Surgery: Colon and Rectal Gynecological Oncology Surgery: Endovascular (Primary) Gynecology Surgery: General Hand Surgery Surgery: Neurological Hand Surgery (Plastic Surgery) Surgery: Oncology Hand Surgery (Surgery) Surgery: Oral Head And Neck Surgery Surgery: Pediatric Neurological Surgery Surgery: Plastic and Reconstruction Obstetric Anesthesiology (Anesthesiology) Surgery: Plastic and Reconstruction - Hand Obstetrics Surgery: Plastic and Reconstruction - Pediatric Obstetrics & Gynecology Surgery: Thoracic (Primary) Ophthalmic Plastic And Reconstructive Surgery
(Ophthalmology) Surgery: Transplant Ophthalmology Surgery: Trauma Oral & Maxillofacial Surgery Surgery: Trauma - Burn Orthopaedic Surgery Surgery: Vascular (Primary) Orthopaedic Surgery Of The Spine Urology Otolaryngology Urology: Pediatric Pediatric Anesthesiology (Anesthesiology) Pediatric Cardiothoracic Surgery Pediatric Ophthalmology Pediatric Otolaryngology Pediatric Surgery (Neurology) Pediatric Surgery (Surgery) Pediatric Urology Plastic Surgery Plastic Surgery Within The Head & Neck Plastic Surgery Within The Head & Neck
(Otolaryngology) Plastic Surgery Within The Head & Neck (Plastic
Surgery) Proctology Surgical Critical Care (Surgery) Surgical Oncology Thoracic Surgery Transplant Surgery Traumatic Surgery Urology Vascular Surgery Neurotology (Otolaryngology)
The Economic Impact of Physicians in Oregon
27
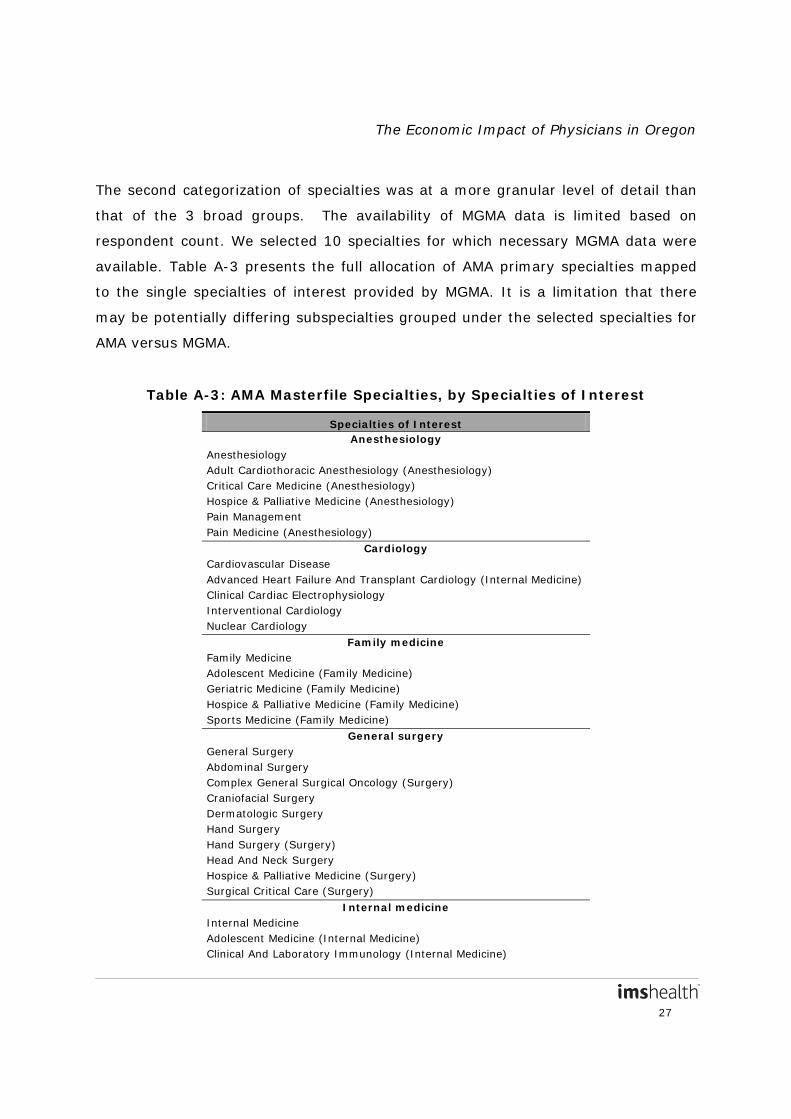
The second categorization of specialties was at a more granular level of detail than
that of the 3 broad groups. The availability of MGMA data is limited based on
respondent count. We selected 10 specialties for which necessary MGMA data were
available. Table A-3 presents the full allocation of AMA primary specialties mapped
to the single specialties of interest provided by MGMA. It is a limitation that there
may be potentially differing subspecialties grouped under the selected specialties for
AMA versus MGMA.
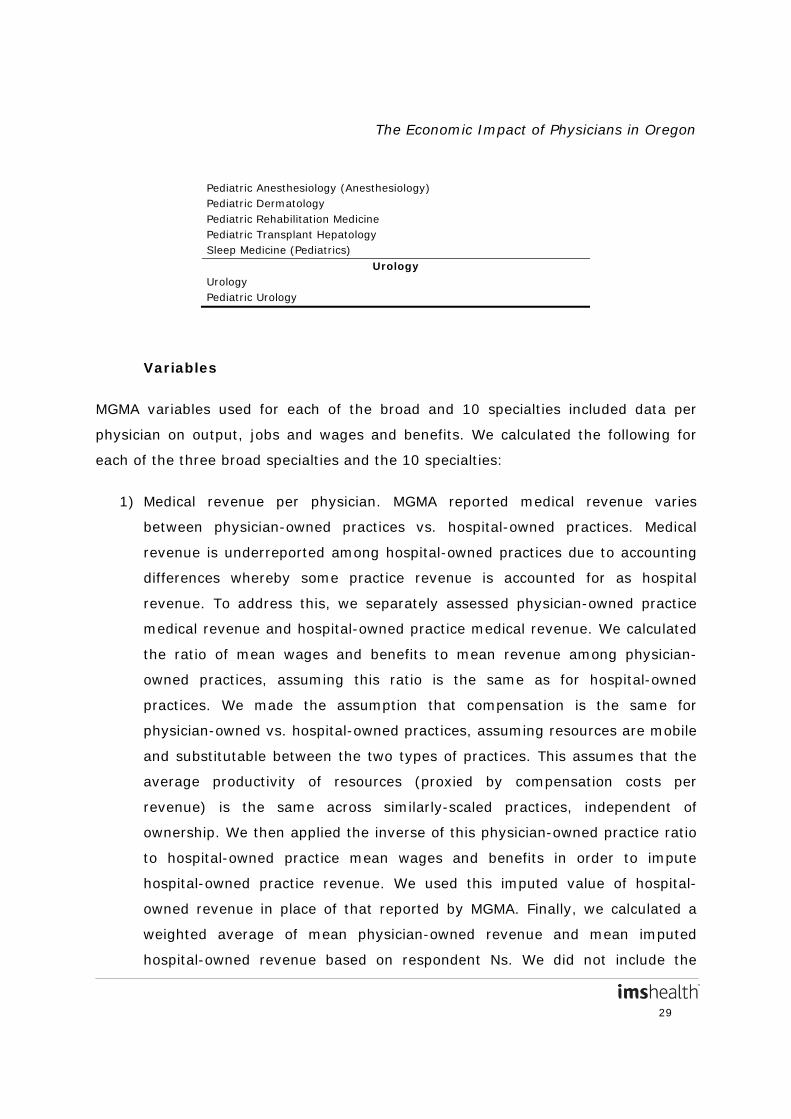
Table A-3: AMA Masterfile Specialties, by Specialties of Interest
Specialties of Interest Anesthesiology
Anesthesiology Adult Cardiothoracic Anesthesiology (Anesthesiology) Critical Care Medicine (Anesthesiology) Hospice & Palliative Medicine (Anesthesiology) Pain Management Pain Medicine (Anesthesiology)
Cardiology Cardiovascular Disease Advanced Heart Failure And Transplant Cardiology (Internal Medicine) Clinical Cardiac Electrophysiology Interventional Cardiology Nuclear Cardiology
Family medicine Family Medicine Adolescent Medicine (Family Medicine) Geriatric Medicine (Family Medicine) Hospice & Palliative Medicine (Family Medicine) Sports Medicine (Family Medicine)
General surgery General Surgery Abdominal Surgery Complex General Surgical Oncology (Surgery) Craniofacial Surgery Dermatologic Surgery Hand Surgery Hand Surgery (Surgery) Head And Neck Surgery Hospice & Palliative Medicine (Surgery) Surgical Critical Care (Surgery)
Internal medicine Internal Medicine Adolescent Medicine (Internal Medicine) Clinical And Laboratory Immunology (Internal Medicine)

The Economic Impact of Physicians in Oregon
28
Critical Care Medicine (Internal Medicine) Diabetes Geriatric Medicine (Internal Medicine) Hematology (Internal Medicine) Hepatology Hospice & Palliative Medicine (Internal Medicine) Medical Oncology Nutrition Sleep Medicine (Internal Medicine) Sports Medicine (Internal Medicine) Transplant Hepatology (Internal Medicine)
Obstetrics/Gynecology Obstetrics & Gynecology Critical Care Medicine (Obstetrics & Gynecology) Female Pelvic Medicine And Reconstructive Surgery (Obstetrics & Gynecology) Gynecology Hospice & Palliative Medicine (Obstetrics & Gynecology) Obstetric Anesthesiology (Anesthesiology) Obstetrics Gynecological Oncology Maternal And Fetal Medicine Reproductive Endocrinology And Infertility
Orthopaedic Surgery Orthopaedic Surgery Adult Reconstructive Orthopaedics Foot And Ankle Orthopaedics Hand Surgery (Orthopaedics) Musculoskeletal Oncology Orthopaedic Surgery Of The Spine Orthopaedic Trauma Osteopathic Manipulative Medicine Pediatric Orthopaedics Sports Medicine (Orthopaedic Surgery)
Otolaryngology Otolaryngology Neurotology (Otolaryngology) Pediatric Otolaryngology Plastic Surgery Within The Head & Neck (Otolaryngology) Sleep Medicine (Otolaryngology)
Pediatrics Pediatrics Adolescent Medicine (Pediatrics) Child Abuse Pediatrics Developmental-Behavioral Pediatrics Hospice & Palliative Medicine (Pediatrics) Internal Medicine/Pediatrics Medical Toxicology (Pediatrics) Neonatal-Perinatal Medicine Neurodevelopmental Disabilities (Pediatrics)
The Economic Impact of Physicians in Oregon
29
Pediatric Anesthesiology (Anesthesiology) Pediatric Dermatology Pediatric Rehabilitation Medicine Pediatric Transplant Hepatology Sleep Medicine (Pediatrics)
Urology Urology Pediatric Urology
Variables
MGMA variables used for each of the broad and 10 specialties included data per
physician on output, jobs and wages and benefits. We calculated the following for
each of the three broad specialties and the 10 specialties:
1) Medical revenue per physician. MGMA reported medical revenue varies
between physician-owned practices vs. hospital-owned practices. Medical
revenue is underreported among hospital-owned practices due to accounting
differences whereby some practice revenue is accounted for as hospital
revenue. To address this, we separately assessed physician-owned practice
medical revenue and hospital-owned practice medical revenue. We calculated
the ratio of mean wages and benefits to mean revenue among physician-
owned practices, assuming this ratio is the same as for hospital-owned
practices. We made the assumption that compensation is the same for
physician-owned vs. hospital-owned practices, assuming resources are mobile
and substitutable between the two types of practices. This assumes that the
average productivity of resources (proxied by compensation costs per
revenue) is the same across similarly-scaled practices, independent of
ownership. We then applied the inverse of this physician-owned practice ratio
to hospital-owned practice mean wages and benefits in order to impute
hospital-owned practice revenue. We used this imputed value of hospital-
owned revenue in place of that reported by MGMA. Finally, we calculated a
weighted average of mean physician-owned revenue and mean imputed
hospital-owned revenue based on respondent Ns. We did not include the
The Economic Impact of Physicians in Oregon
30
value of non-medical revenue which was reported for a minority of practices
in the MGMA cost survey, and which was minimal compared to medical
revenue (approximately 1% when adjusting for non-reported zeros). Because
practice revenues vary according to geographic variation in price levels and
costs of services, we calculated estimates at the national level and adjusted
medical revenue using local medical wage and price indices. Revenues were
adjusted using weighted-state values for Medicare’s 2012 Geographic
Adjustment Factor (GAF). The mean medical revenue in a state was
calculated as the national weighted mean for medical revenue x the weighted
state Medicare GAF.
2) Total jobs per physician (sum of mean physician, non-physician provider and
support staff FTEs). For the non-physician and support staff categories, MGMA
reports means that are calculated based only on respondents that have staff
in that category. The N shown for each mean reflects that. In particular, there
was a much lower N for non-physician provider FTEs relative to support staff
FTEs, as most reporting practices did not employ non-physician provider staff.
For these two categories, we calculated adjusted mean jobs (inclusive of
practices with no staff in that category) using the reported N for physician
costs as the total N. The reported N for physician costs was slightly higher
than the reported N for support staff FTEs. This adjustment lowered the mean
non-physician provider FTEs, and slightly lowered the mean support staff
FTEs.
3) Total wages and benefits per physician (sum of mean physician, non-
physician provider and support staff cost). As with jobs, the mean non-
physician provider costs and mean support staff costs per physician that are
provided by MGMA are based only on respondents that have staff in that
category. We calculated adjusted mean costs for these two categories in a
similar fashion as we did adjusted mean FTEs. This adjustment lowered the
mean non-physician provider cost and slightly lowered the mean support staff
The Economic Impact of Physicians in Oregon
31
cost. Because wages and benefits spending varies by local wage levels, the
mean per-physician wages and benefits in a state was calculated as the
national mean for wages and benefits x the weighted state wage index.
All needed data points were available with the exception of mean non-physician
provider cost data for physician-owned internal medicine, general surgery and
otolaryngology practices, and for hospital-owned urology and otolaryngology
practices. These data points were not reported (fewer than 10 practices provided a
response, respectively), but were necessary to calculate imputed hospital-owned
revenue. In these instances, we used the adjusted non-physician provider cost for
the relevant broad specialty as a proxy.
MGMA Geographic Limitation
Physician practice revenues and wages and benefits vary according to geographic
variation in price levels and costs of services. However, the MGMA cost survey does
not provide data at the state level; therefore, we calculated specialty-specific
estimates at the national level and geographically adjusted revenue and wages and
benefits.
Medicare uses three Geographic Practice Cost Indices (GPCIs), physician work (PW),
practice expense (PE) and malpractice (MP), weighted at approximately 48%, 47%
and 4%, respectively in 2012, to arrive at the GAF to adjust payments to physicians.
Medicare calculates the three GPCIs for payment areas known as Medicare localities.
Each physician payment locality is assigned an index value, which equals the area’s
estimated input cost divided by the average input cost nationally. The locality-level
GAF is calculated as the weighted average of the three county-level GPCIs, where
the weights are the percentage of relative value units (RVUs) nationally made up by
The Economic Impact of Physicians in Oregon
32
the PW, PE, and MP RVUs. For calendar year (CY) 2012, the GAF is calculated as
follows: 9
GAF
L = (GPCIPW,L x 0.48266) + (GPCIPE,L x 0.47439) + (GPCIMP,L
There are 89 Medicare payment localities which are defined by state boundaries
(e.g., Wisconsin), metropolitan statistical areas (MSAs) (e.g., Metropolitan St. Louis,
MO), portions of an MSA (e.g., Manhattan), or rest-of-state areas that exclude
metropolitan areas (e.g., Rest of Missouri).
x 0.04295)
10
Practice revenues were adjusted using weighted-state values for Medicare’s 2012
GAF. Because CMS uses county-level RVUs to scale county-level estimates to the 89
locality level, we calculated a weighted state-level GAF by first weighting the county-
level GPCIs by their respective county-level RVUs. The RVUs capture total intensity
of services offered by physicians in given areas and therefore are closely correlated
with revenues in an area. We then calculated state-level GAF based on the state-
level GPCI per the equation described above.
To promote transparency, Medicare
provides the county-level GPCI file that they used to develop the final CY2012 GPCIs
and GAF.
Because wages and benefits varies by geographic region we adjusted national level
MGMA wages and benefits spending by a state-level wage index incorporating both
physician wages and clinical and administrative office staff wages. Medicare provides
relevant county-level data in a county-level GPCI file which they used to develop the
final CY2012 GPCIs and GAF. The data are based on the most recent census data
for physicians and relates directly to physicians and their practice expenses while
other wage indices are based only on acute inpatient care/hospital costs. In order to
9 Geographic Adjustment of Medicare Payments to Physicians: Evaluation of IOM Recommendations. Available at:
http://www.cms.gov/Medicare/Medicare-Fee-for-Service-Payment/PhysicianFeeSched/Downloads/Geographic_Adjustment_of_Medicare_Physician_Payments_July2012.pdf
10 Revisions to the Sixth Update of the Geographic Practice Cost Index: Final Report. Available at: http://www.cms.gov/Medicare/Medicare-Fee-for-Service-Payment/PhysicianFeeSched/Downloads/CY2012_Revisions_to_the_6th_GPCI_Update-Final_Report.pdf
The Economic Impact of Physicians in Oregon
33
calculate a wage index incorporating both physician and non-physician
compensation, we combined two components used to calculate the GAF: the
physician work (PW) GPCI, used to adjust for geographic differences in physician
wages, and the Employee Wage Index, used to adjust for geographic differences in
wages of clinical and administrative office staff. We first aggregated the PW GPCI to
the state level using the PW RVU as weights, and then aggregated the Employee
Wage Index to the state level using the practice expense (PE) RVUs as weights. We
then combined these two indices into a single wage index using their respective
national cost shares. The 2012 national cost share weight for physician
compensation is 0.48266 while the weight for non-physician compensation is
0.19153, per the Medicare Economic Index (MEI). Therefore the relative weight for
physician compensation (for the state-level PW index) is 0.71591
(0.48266/(0.48266+0.19153)) and for non-physician compensation (for the state-
level Employee Wage Index) is 0.28409 (0.19153/(0.48266+0.19153)). We applied
these weights of 0.71591 and 0.28409, respectively, to combine the state-level PW
index and the Employee Wage Index into a state-level total wage index.
MGMA Data Limitations
Limitations of the MGMA data include: 1) bias towards larger practices that are
MGMA members, 2) differences by practice ownership (physician vs. hospital-
owned), and 3) availability only at the national level.
We cannot adjust for the possible data bias towards larger practices that are MGMA
members. However, we attempted to minimize this bias by including data for all
practices with fewer than three physicians instead of relying on MGMA’s default
setting which only provides data for practices with three or more physicians.
We noted declining trends in MGMA data for mean medical revenue per physician
between 2009 and 2012 for the broad specialties. The steepest decline was for
surgical (-30.3%), followed by non-surgical (-9.1%) and then primary care (-5.2%).
This decline may be related to the underreporting of revenue by hospital-owned

The Economic Impact of Physicians in Oregon
34
practices as explained earlier, and that hospital-owned practices have increased as a
share of total practices in the MGMA data over the 2009 to 2012 period. As explained
earlier, we corrected for this underreporting by imputing the mean per physician
revenue in hospital-owned practices and using these imputed values rather than the
means given by MGMA.
Geographic adjustment was used to address the limitation that MGMA data are only
available at the national level.
III. 2011 IMPLAN
IMPLAN data contain industry-based output, employment, and labor income,
multipliers, as well as tax data by state and at the national level.
Multipliers
Multipliers are specific to a state and to a particular industry. State-level and
national 2011 multipliers for “Offices of physicians, dentists, and other health
practitioners” (IMPLAN industry code 394) were used. Upon creation of each model’s
geographies, the software calculates multipliers for output, employment (based on
millions of dollars of output) and labor income (based on dollars of output). Type
SAM (Social Accounting Matrix) output multipliers were used to apply to direct
revenue. Type SAM multipliers consider the direct, indirect and induced effects
where the induced effect is based on information in the Social Account Matrix. Type
SAM multipliers tell us how a specific industry responds to an impact on itself (i.e.,
rounds of indirect and induced purchasing that occur in that industry). Indirect and
induced effect multipliers were used to calculate total jobs and total wages and
benefits. A jobs multiplier (the sum of indirect and induced effect employment
multipliers) was applied to direct revenue in millions of dollars, in order to calculate
indirect and induced jobs per million dollars of output. A wages and benefits
multiplier (the sum of indirect and induced effect labor income multipliers) was

The Economic Impact of Physicians in Oregon
35
applied to direct revenue, in order to calculate indirect and induced wages and
benefits per dollar of output.
We noted a 6.9% decrease in the national output multiplier from 2010 to 2011. A
majority of the service sector multipliers in IMPLAN experienced a decline in their
values between 2010 and 2011, and 260 of the 440 sectors in the U.S. economy saw
a decline in their output multiplier during this period. The average change in the
multipliers of the gaining sectors was 2.7% and of the declining multipliers was
2.7%. The biggest outliers were for Home Health Care (-9.4%), Medical and
diagnostic labs and outpatient and other ambulatory care services sectors (-17.9%),
followed by Offices of physicians, dentists, and other health practitioners (-6.9%).
All state values in the model are forced to sum to U.S. control totals, so a change at
the national level will be reflected in all states. This issue holds for the other service
sectors as well. Therefore, the overall change in the average output multiplier for the
U.S. declined by more than 1% during this period. The observed decreases in
health-related national multipliers are consistent with the slowdown in the growth of
healthcare spending, and could also be further related to the after-effects of the
recession (lower spending in general and greater leakages). A recent study found
that healthcare spending, as a share of GDP, dropped in 2012. While there were
signs of modest improvement to the economy, GDP grew faster than health care
spending, causing the health spending share of the economy to fall slightly—from
17.3% to 17.2%.11
11 Martin, et al, “National Health Spending in 2012: Rate of Health Spending Growth Remained Low for the Fourth
Consecutive Year.” Health Affairs;2014;33:67-77.

The Economic Impact of Physicians in Oregon
36
Tax Analyses
Patient care physicians also generate tax revenues at the local and state levels.
IMPLAN software also estimates the impact of economic activity on state and local
tax revenues, including income, sales, and property taxes. Tax impacts were
estimated at the state and national levels using a contribution analysis, where
existing total direct output provides the initial effects of the analysis.12
The total tax contribution is computed by summing taxation on employee income,
proprietor income, indirect business interactions, households, and corporations. Tax
revenues are included from physician practices and from other affected industries
(indirect); i.e., these are the “total” tax revenues supported by the industry.
Tax
calculations were based on 2011 IMPLAN modeling presented in 2011 dollars, using
calculated 2012 direct output.
The state and local taxes incorporated in this study include:
• Social Security taxes: the state portions of Social Security taxes, both the employee and employer-paid portions;
• Personal taxes: state and local income taxes, gift and estate taxes, motor vehicle taxes/fees, fishing/hunting and other license fees, property taxes, personal property taxes, and other fines/fees or donations;
• Business taxes: corporate profits and dividends taxes; and
• Indirect business taxes: property taxes, sales taxes, motor vehicle licensing, severance taxes, non-tax payments (e.g. rents and royalties, special assessments, fines, settlements and donations), and other taxes (including business licensing, documentary and stamp taxes).
While patient care physicians also generate federal tax revenue, the federal tax
revenue is beyond the scope of this analysis.
12 Estimating the Contribution of a Current Industry Using IMPLAN. MIG, Inc. Available through IMPLAN.com.

The Economic Impact of Physicians in Oregon
37
IV. Data Analysis
The data from the three source datasets were combined and the following measures
were calculated by state:
1) Direct impacts of physicians (state-level total medical output, total jobs and
total wages and benefits per physician from MGMA x counts from the
Masterfile)
2) Indirect impacts of physicians
a. Calculated direct output x (IMPLAN output multiplier – 1)
b. (Calculated direct output/$1,000,000) x IMPLAN jobs multiplier
c. Calculated direct output x IMPLAN wages and benefits multiplier
3) Total impacts of physicians (direct and indirect impacts summed for
output, jobs and wages and benefits);
4) Tax revenues obtained from physicians.
At the state level, direct, indirect and total impacts were calculated in aggregate (as
the sum of primary care, non-surgical and surgical broad specialties) as well as for
the 10 specialties. Direct impacts by state (sum of primary care, non-surgical and
surgical broad specialties) were aggregated to the national level, and then national
IMPLAN multipliers were applied to calculate national total impacts. Tax revenues
were also calculated at the national and state levels.