the economic impact of the port of jacksonville 2013 economic... · the economic impact of the port...
TRANSCRIPT

The Economic Impact of the Port of Jacksonville
2013
Martin Associates 941 Wheatland Ave, Site 203
Lancaster, PA 17603 www.martinassoc.net
August 7, 2014

Martin Associates:
800 Plus Port Studies Since 1986
Market analysis/cargo flow analysis
Competitive transportation cost/logistics analysis
Economic impact assessment of port projects: Cargo
Recreational (marinas)
Cruise
Shipyards
Industrial/Real Estate Development
Airports
Distribution Center Development
2

Martin Associates:
800 Plus Port Studies Since 1986
Strategic planning
Development of targeted marketing opportunities
Financial feasibility assessment
Identification of funding sources: Bond justification
Grant application process
Development of public/private partnerships
3

Martin Associates’ Experience:
Marine Cargo Impact
• Port of Jacksonville - Economic Impact Studies: 2004, 2009, 2014
• Other Florida Ports: – Miami
– Port Everglades
– Tampa
– Palm Beach
– Port Canaveral
– Port Manatee
– Panama City
– Florida State-Wide Impacts
• Atlantic Coast Ports: – North Carolina State Ports
– Virginia Port Authority
– Baltimore
– Diamond State Port Corp.
– Philadelphia
– South Jersey Port Corp.
– Boston
4
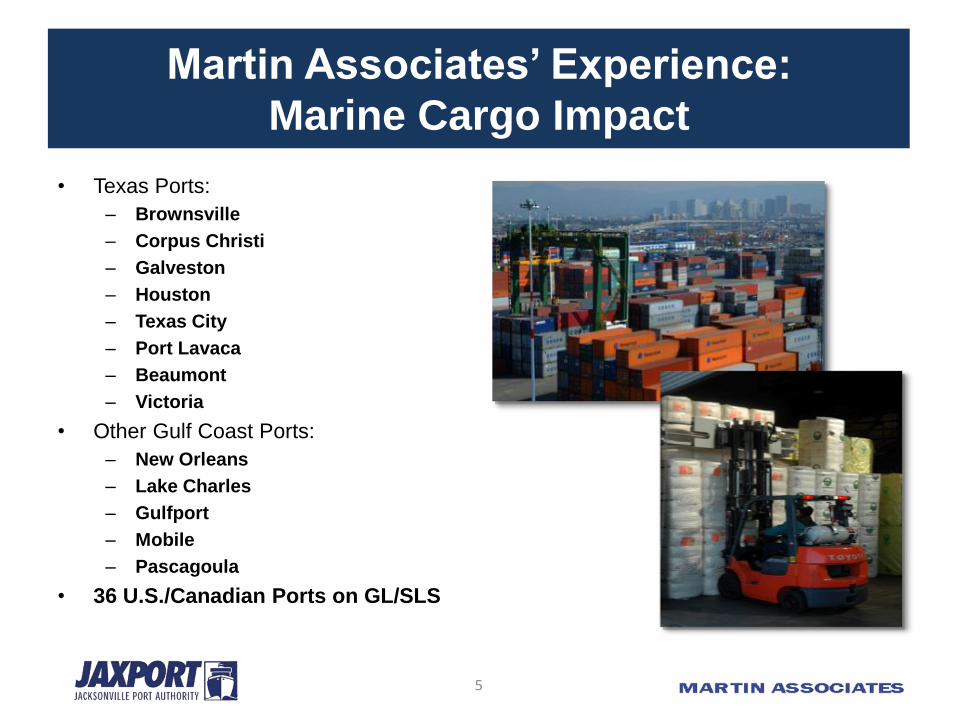
Martin Associates’ Experience:
Marine Cargo Impact
• Texas Ports:
– Brownsville
– Corpus Christi
– Galveston
– Houston
– Texas City
– Port Lavaca
– Beaumont
– Victoria
• Other Gulf Coast Ports:
– New Orleans
– Lake Charles
– Gulfport
– Mobile
– Pascagoula
• 36 U.S./Canadian Ports on GL/SLS
5

Martin Associates’ Experience:
Marine Cargo Impact
• Washington State Ports:
– Seattle
– Tacoma
– Longview
– Kalama
– Grays Harbor
– Vancouver
– Olympia
– Bellingham
– Everett
• California Ports:
– San Diego
– Los Angeles
– Long Beach
– Sacramento
– Hueneme
– Oakland
– San Francisco
• Portland, OR
6

Marine Cargo Economic Impact Studies
• Economic Impact of all US Ports for AAPA
• Economic Impact of Hurricanes Katrina and Ike
• Economic Impact of Container Operations at all US Ports – World Shipping Council
• Economic Impact of West Coast Container Operations – PMA, 2000, 2007 and currently
• State of Florida Economic Impacts of Florida Seaports- 2007, 2009, 2012
• Economic Impacts of Texas Seaports -2012
• Economic Impact of West Coast Shutdown, 2002, currently
• Economic Impact of Section 201 Steel Import Quotas
• Economic Impact of Channel Deepening for numerous ports and USACE
• Economic impact studies have been reviewed and used by Federal Reserve Board, International Trade Commission, US Council of Economic Advisors, U.S. Department of Transportation, Transport Canada
7
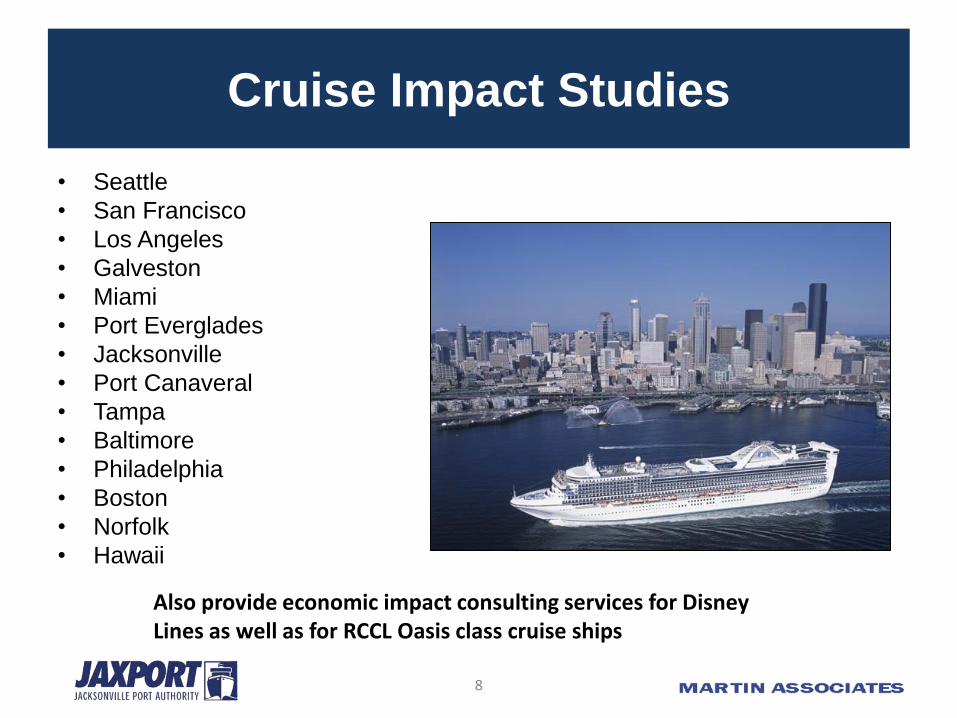
Cruise Impact Studies
• Seattle
• San Francisco
• Los Angeles
• Galveston
• Miami
• Port Everglades
• Jacksonville
• Port Canaveral
• Tampa
• Baltimore
• Philadelphia
• Boston
• Norfolk
• Hawaii
Also provide economic impact consulting services for Disney Lines as well as for RCCL Oasis class cruise ships
8

Airport Impact Studies
• Sea-Tac
• Bellingham International
• Portland International
• Oakland International
• San Francisco International
• Miami International
• Hartsfield Atlanta International
• Washington Dulles/National
• Baltimore-Washington
• Nashville International
• Kahalui International
• Denver International
• Harrisburg International
• Van Nuys
• State-wide aviation impact for Maryland
9

• Seattle
• Bellingham
• Longview
• Los Angeles
• Boston
• Vancouver, WA
• Olympia
• San Francisco
• Tampa
• Port Canaveral
• Oakland
• Portland
Impact Studies of Commercial Real
Estate Tenants of Port Authorities
10

Marina Impacts Studies
• Seattle
• Olympia
• Los Angeles
• San Francisco
• Everett, WA
• Bellingham, WA
• Tacoma
• Port Canaveral
11

Commercial Fishing Impact Studies
• Seattle
• Los Angeles
• Bellingham
• San Francisco
• Boston
• Port Lavaca, TX
• New Bedford, MA
• Gloucester, MA
• Brownsville, TX
12

Shipyard Impact Studies
• San Francisco
• Seattle
• Mobile
• Tampa
• Philadelphia
• Norfolk
• Galveston
• Brownsville
• Portland, OR
13

Martin Associates
• Ports:
- Wilmington, DE
- Port of Baltimore
- Port of Philadelphia
- Port of Galveston
- Port of Lake Charles
- Port of San Diego
- Port Everglades
- Hawaii
Development of Public/Private Partnerships: • Terminal Operators:
– Hutchison Port Holdings
– Ports America
– SSA
– Ceres Terminals
– Yusen Terminals
• Infrastructure Investment Groups:
– ING/Carlyle
– Och Ziff Group
– Fortress Investments
– Mid Ocean
– Highstar Capital
– Bank of Montreal
– Goldman Sachs
14

Why Conduct Economic Impact Studies?
• Community - Public awareness
• City/County - Payment in lieu of taxes
• Legislature - Funding requests
• Commissioners - Project justification
• Directors - Allocation of resources
• Planners - Comparison of projects
• Government Officials – Policy implications
– Navigational projects
– Port closures
15

Study Purposes
• Measure the baseline economic impacts of cargo activity at the Port of Jacksonville:
– JAXPORT
– Private marine terminals
• Develop Port-specific impact models:
– Sensitivity analysis
– Terminal/tenant impact analysis
– New carriers
– Comparison of alternative uses for port land
– Channel deepening/maintenance
– Justification of terminal and infrastructure investment
16

Key Characteristics of the
Martin Associates’ Approach
• Induced and indirect impacts are tailored to reflect
Jacksonville/Northeast Florida economy
• Induced impacts:
– Based on Consumer Expenditure Survey for Northeast Florida
– Local re-spending multiplier derived from Bureau of Economic
Analysis for Northeast Florida
– Convert local purchases by direct employees into induced jobs
• Indirect impacts based on local purchases by direct firms and
converted into indirect impacts using BEA RIMS II
• Allocation to local jurisdictions is based on survey data for residency
of direct employees, as well as location of employment
17

Comparison with Other Approaches
• The Martin Associates’ approach is based on a 100%
confidential survey of all Port Tenants and Service
Providers - defensibility is key:
– Other methods such as the IMPLAN and REMI
models are based on extrapolation of samples of
survey data, and “forced “ into standardized
input-output modes
– Sample sizes used for a REMI/IMPLAN fall into the
range from 15-30% coverage – reducing
defensibility of results accordingly
18
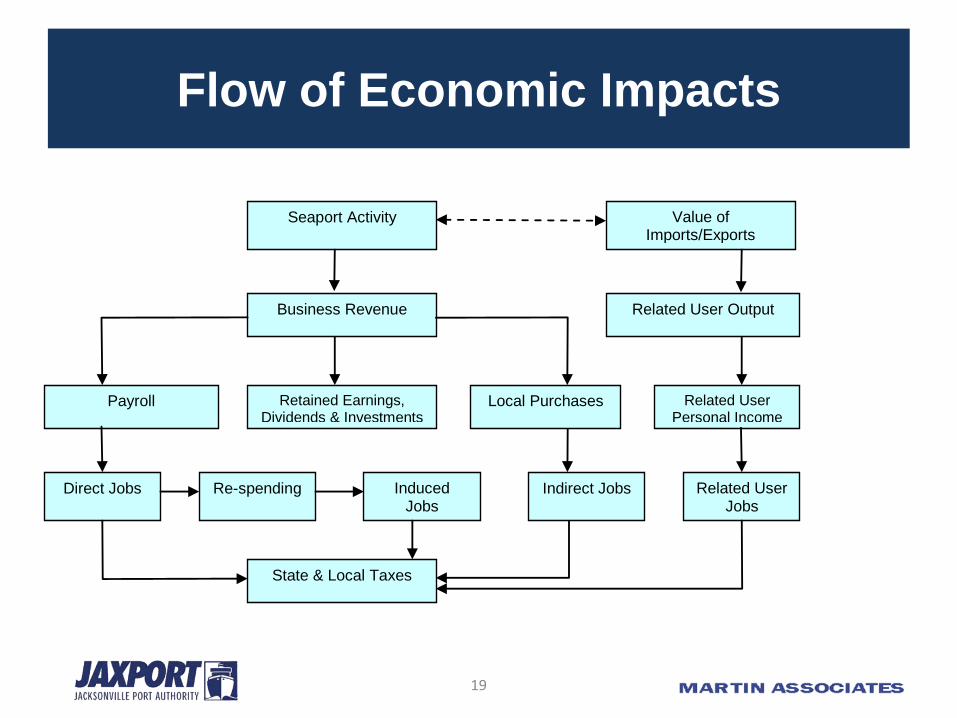
Flow of Economic Impacts
Seaport Activity
Business Revenue
Payroll Retained Earnings, Dividends & Investments
Local Purchases
Indirect Jobs Direct Jobs
State & Local Taxes
Re-spending Induced Jobs
Related User Jobs
Related User Personal Income
Related User Output
Value of Imports/Exports
19

Flow of Economic Impacts
INDIRECT: Goods/Services
M&R
Equipment
Utilities
Fuel
Insurance
Purchases by
Firms
DIRECT IMPACTS Terminal Operators, Forwarders,
Longshoremen, Warehousing,
Terminal Construction, Gov’t,
Trucking, Rail, Tenants,
Purchases by
Employees
INDUCED: Food Shelter Transportation Medical Retail Apparel
Pilots
Tugs
Agents
Chandlers
Surveyors
Vessel Repairs
20
Methodology
• 472 firms identified and surveyed:
– Terminals/tenants
– Service providers
• Formulation of direct impact models from interviews
• Development of Jacksonville-specific induced model
• Development of indirect models for Northeast Florida
– Survey based expenditures
– Bureau of Economic Analysis, RIMSII
21

Economic Impacts 2013
•Direct Jobs: 9,667
• Induced Jobs: 10,100
• Indirect Jobs: 4,573
24,340 jobs generated by Port activity
• $2.3 billion direct business revenue received by firms providing services to cargo and vessels $2.3 billion of business revenue
• $499.3 million direct wage and salary income - $51,656 average salary
• $1.1 billion re-spending and local consumption
• $220.2 indirect income
$1.8 billion personal income and local consumption
• Generated by activity at the marine terminals $168.9 million of state and local
taxes
22

Sphere of Influence of Cargo Activity at
the Port of Jacksonville, 2013
• $26.9 billion total economic value – $2.3 billion of direct business revenue
– $1.1 billion of direct, induced, indirect income and consumption
– $23.4 billion related economic output to the State
• 132,599 jobs related to the cargo activity – 24,340 direct, induced and indirect jobs
– 108,260 related user jobs
• $727.0 million of state and local taxes – $168.9 million direct, induced and indirect taxes
– $558.1 million paid from related activity
23

Majority of the Impacts Supported by
JAXPORT Facilities
PUBLIC PRIVATE TOTAL
TERMINALS TERMINALS
JOBS
DIRECT 6,911 2,756 9,667
INDUCED 7,217 2,883 10,100
INDIRECT 3,490 1,082 4,573
TOTAL 17,618 6,721 24,340
PERSONAL INCOME (1,000)
DIRECT $356,738 $142,597 $499,335
RE-SPENDING/CONSUMPTION $797,203 $318,661 $1,115,864
INDIRECT $167,757 $52,393 $220,150
TOTAL $1,321,699 $513,650 $1,835,349
BUSINESS REVENUE (1,000) $1,808,527 $509,767 $2,318,294
LOCAL PURCHASES (1,000) $403,216 $103,692 $506,907
STATE & LOCAL TAXES (1,000) $121,596 $47,256 $168,852
RELATED USER IMPACTS
RELATED JOBS 87,051 21,209 108,260
RELATED INCOME (1,000) $5,078,153 $988,669 $6,066,822
RELATED OUTPUT (1,000) $19,555,190 $3,869,657 $23,424,847
RELATED STATE AND LOCAL TAXES (1,000) $467,190 $90,958 $558,148
24

Distribution of 9,667 Direct Jobs by
Category
DIRECT
JOBS
SURFACE TRANSPORTATION
RAIL 507
TRUCK 3,679
MARITIME SERVICES
TERMINAL EMPLOYEES/LONGSHOREMEN 2,272
TOWING 85
PILOTS 31
STEAMSHIP LINES AND AGENTS 78
SURVEYORS/CHANDLERS/MISC. MARITIME SERVICES 303
FORWARDERS 363
WAREHOUSING 703
GOVERNMENT 341
MARINE CONSTRUCTION/ SHIPYARDS 899
BARGE/BUNKERS 252
PORT AUTHORITY 153
TOTAL 9,667
25

Containers Account for 46% of 9,667
Direct Jobs
DIRECT JOBS
CONTAINERS 4,495
STEEL 21
AUTOS 1,060
PAPER/PULP/LUMBER 188
REEFER BREAK BULK 74
OTHER BREAK BULK 46
DRY BULK 739
LIQUID BULK 1,333
NOT ALLOCATED 1,710
TOTALS 9,667
26

Distribution of $168.9 Million Annual Tax
Impact
$84.2 $84.7
State Taxes Local Taxes
27

Changes Since 2008 – Cargo Activity
• Tonnage declined by 4.4 million tons, but containerized cargo
increased by 1.3 million tons
– 28% increase in tonnage
– 35% increase in actual container moves
2013 2008 CHANGE
CONTAINERS 6,076 4,742 1,335
STEEL 91 51 40
AUTOS 1,296 1,366 -70
PAPER/PULP/LUMBER 742 670 72
REEFER BREAK BULK 50 134 -84
OTHER BREAK BULK 47 98 -51
DRY BULK 3,883 6,139 -2,256
LIQUID BULK 5,781 9,144 -3,362
TOTAL 17,967 22,344 -4,377
1,000 Tons
28

All-Water Asian Cargo Was the Key Force
Driving the Growth in Containerized Cargo
0.00
0.20
0.40
0.60
0.80
1.00
1.20
1.40
19
94
19
95
19
96
19
97
19
98
19
99
20
00
20
01
20
02
20
03
20
04
20
05
20
06
20
07
20
08
20
09
20
10
20
11
20
12
20
13
Mill
ion
Me
tric
To
ns
SOUTH FLORIDA JACKSONVILLE, FL
US Bureau of the Census, USA Trade On-Line
Asian Containerized Cargo
Opening of
MOL/TraPac
29

Other Notable Changes
• Container market has become
more diversified
• Rail share of containerized cargo
doubled
• Geographic scope of liquid bulk
distribution has increased
• Fuel base of local utilities has
changed
• Increased share of auto exports
• Recession has had impact on bulk
cargoes, particularly cement and
aggregates
• Increased propensity to save has
resulted in a smaller income
multiplier in 2013
0%
10%
20%
30%
40%
50%
60%
70%
80%
90%
100%
19
94
19
95
19
96
19
97
19
98
19
99
20
00
20
01
20
02
20
03
20
04
20
05
20
06
20
07
20
08
20
09
20
10
20
11
20
12
Puerto Rico South America Europe
Australia/NZ Asia Mexico
Container Trading
Partners with JAXPORT
30

Changes Since 2008
•Container moves
•2008:345,000 container moves
•2013:468,000 container moves
1.3 million ton growth in containers
•702 direct
•1,255 induced
•174 indirect 2,131 new jobs
•$521.5 million of additional direct business revenue $521.5 million
revenue growth
•State and local tax increase $40.2 million tax
increase
31

Changes in Economic Impacts
• Direct, induced and indirect jobs grew by 2,131 jobs, 9.5% growth during
recession – Duval County experienced a 2.7% decline in jobs
– JAXPORT was responsible for 80% of growth in total jobs
– Direct jobs grew by 702 jobs, 578 direct job growth at JAXPORT facilities
• Direct personal income grew by $102.8 million; average salary increased
from $44,231 in 2008 to $51,656 in 2013
• Direct business revenue grew by $521.5 million; JAXPORT facilities
accounted for 90% of this growth
• State and local taxes grew by $40.2 million
• Total economic value to the State grew from $19.0 billion to $26.9 billion,
largely due to growth in containerized cargo
• Related jobs grew from 42,647 to 108,260 jobs, due to container growth and
changing composition of containerized cargo – import tonnage more than
doubled
32

Jobs Generated by Containerized Cargo
Grew by 57%
2013 2008 CHANGE
CONTAINERS 4,495 2,861 1,634
STEEL 21 20 2
AUTOS 1,060 1,489 -429
PAPER/PULP/LUMBER 188 412 -224
REEFER BREAK BULK 74 77 -3
OTHER BREAK BULK 46 148 -102
DRY BULK 739 705 34
LIQUID BULK 1,333 1,195 139
NOT ALLOCATED 1,710 2,059 -349
TOTALS 9,667 8,965 702
Direct Jobs by Commodity
33
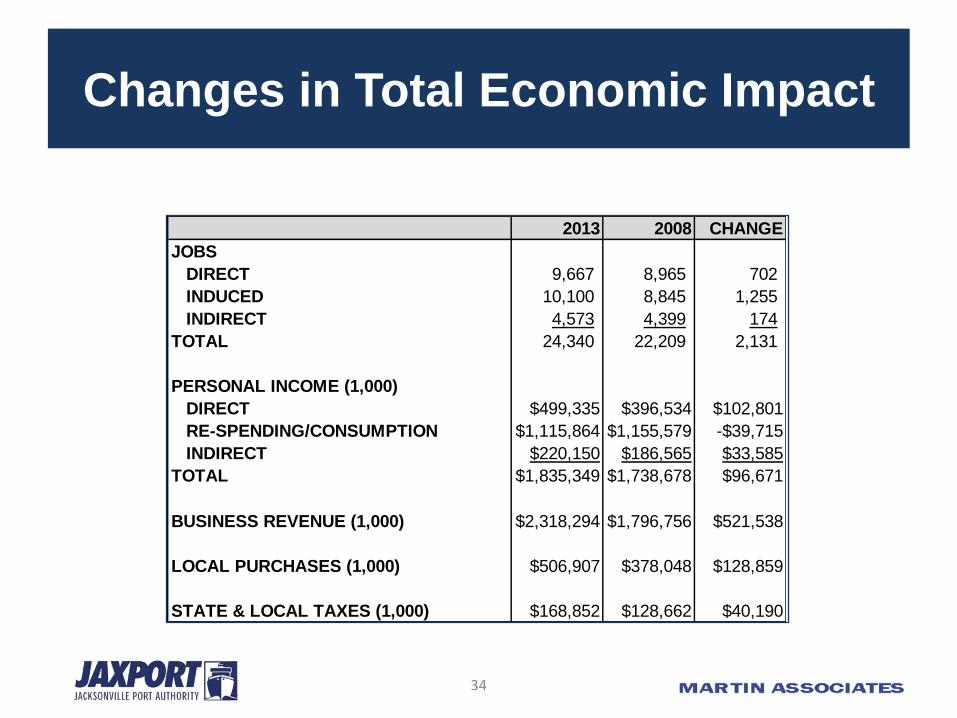
Changes in Total Economic Impact
2013 2008 CHANGE
JOBS
DIRECT 9,667 8,965 702
INDUCED 10,100 8,845 1,255
INDIRECT 4,573 4,399 174
TOTAL 24,340 22,209 2,131
PERSONAL INCOME (1,000)
DIRECT $499,335 $396,534 $102,801
RE-SPENDING/CONSUMPTION $1,115,864 $1,155,579 -$39,715
INDIRECT $220,150 $186,565 $33,585
TOTAL $1,835,349 $1,738,678 $96,671
BUSINESS REVENUE (1,000) $2,318,294 $1,796,756 $521,538
LOCAL PURCHASES (1,000) $506,907 $378,048 $128,859
STATE & LOCAL TAXES (1,000) $168,852 $128,662 $40,190
34
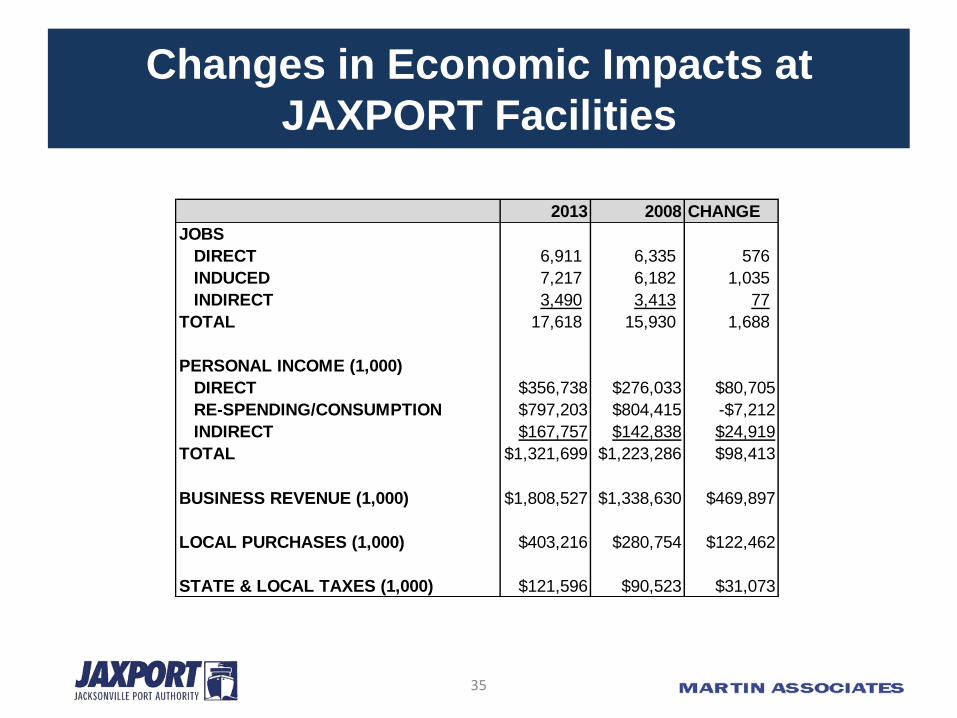
Changes in Economic Impacts at
JAXPORT Facilities
2013 2008 CHANGE
JOBS
DIRECT 6,911 6,335 576
INDUCED 7,217 6,182 1,035
INDIRECT 3,490 3,413 77
TOTAL 17,618 15,930 1,688
PERSONAL INCOME (1,000)
DIRECT $356,738 $276,033 $80,705
RE-SPENDING/CONSUMPTION $797,203 $804,415 -$7,212
INDIRECT $167,757 $142,838 $24,919
TOTAL $1,321,699 $1,223,286 $98,413
BUSINESS REVENUE (1,000) $1,808,527 $1,338,630 $469,897
LOCAL PURCHASES (1,000) $403,216 $280,754 $122,462
STATE & LOCAL TAXES (1,000) $121,596 $90,523 $31,073
35
Conclusion
• Investment in port infrastructure at
JAXPORT has resulted in:
– Significant job growth during a recessionary
period despite a 2.7% decline in County
employment
– Diversification of cargo markets that yield high
paying jobs
– Demonstrated return to state and local
government in terms of taxes
36
Conclusion
Given this demonstrated importance of the
cargo activity at the Port of Jacksonville, it is
critical that the Port continue to invest in
infrastructure projects that return job growth
to the region and tax revenue to the State of
Florida and the local communities.
37

OPPORTUNITY COST OF NOT DEEPENING
THE ST. JOHNS RIVER – AN UPDATE
38

Container Forecasts for JAXPORT
• Baseline- relationships with GDP and
Container throughput:
– Puerto Rico: Low and High growth – Flat
– Latin America/Caribbean: Low growth - 2%
CAGR; High growth - 4% CAGR
– Asian: Low growth - 3%; High growth - 6%
through 2020, 4.5% 2021-2025, 3% 2025 and
thereafter
39
Container Projections for JAXPORT
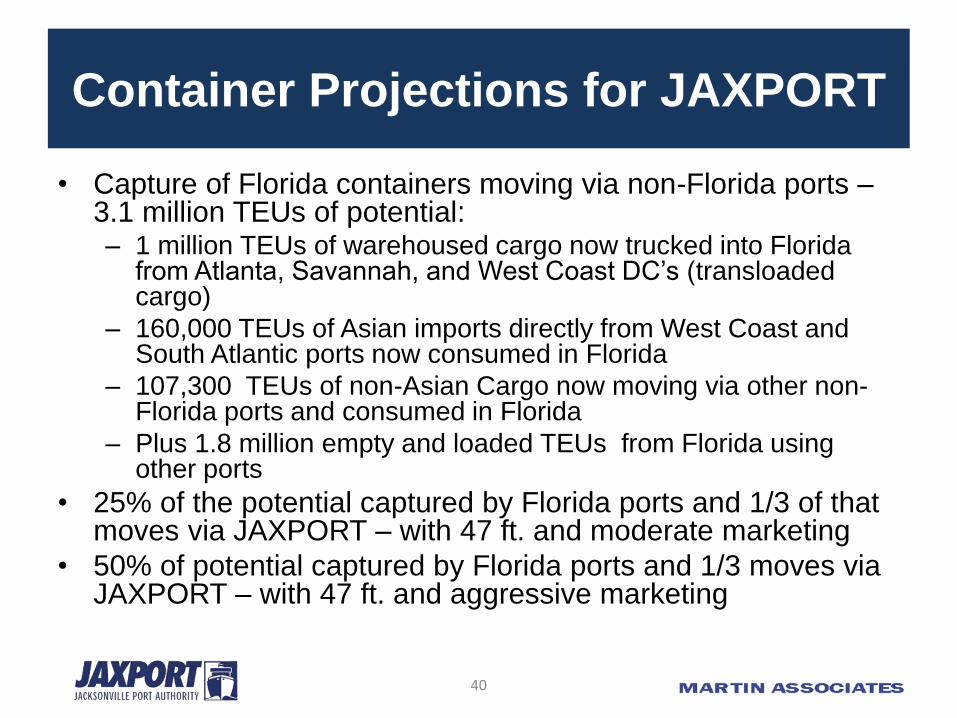
• Capture of Florida containers moving via non-Florida ports – 3.1 million TEUs of potential: – 1 million TEUs of warehoused cargo now trucked into Florida
from Atlanta, Savannah, and West Coast DC’s (transloaded cargo)
– 160,000 TEUs of Asian imports directly from West Coast and South Atlantic ports now consumed in Florida
– 107,300 TEUs of non-Asian Cargo now moving via other non-Florida ports and consumed in Florida
– Plus 1.8 million empty and loaded TEUs from Florida using other ports
• 25% of the potential captured by Florida ports and 1/3 of that moves via JAXPORT – with 47 ft. and moderate marketing
• 50% of potential captured by Florida ports and 1/3 moves via JAXPORT – with 47 ft. and aggressive marketing
40

Container Projections for JAXPORT
• With 47 ft. of water and development of
ICTF, JAXPORT has potential to capture
25% share of TEUs moving intermodally
via other South Atlantic ports - about
126,000 TEUs
• Without 47 ft. of water, JAXPORT will be
handicapped to compete for this
intermodal market
41
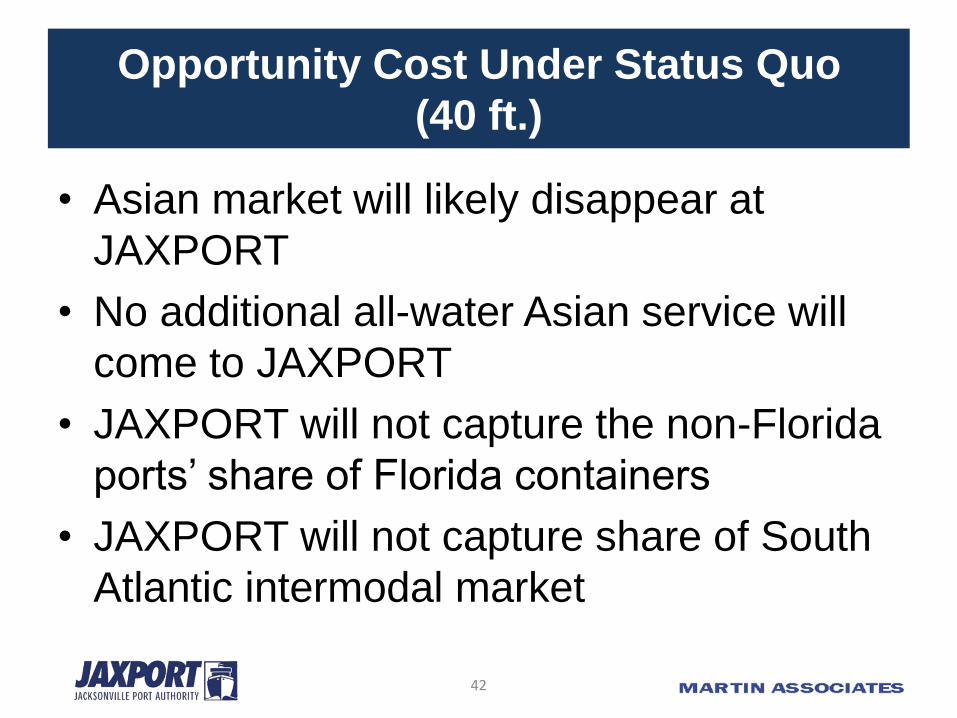
Opportunity Cost Under Status Quo
(40 ft.)
• Asian market will likely disappear at
JAXPORT
• No additional all-water Asian service will
come to JAXPORT
• JAXPORT will not capture the non-Florida
ports’ share of Florida containers
• JAXPORT will not capture share of South
Atlantic intermodal market
42

Key Assumptions in New Model
• 2025
– 25% increase in ILA productivity over base
– Intermodal share grows to 20%
– Vessel load factor grows by 25%
• 2030 and 2035
– 50% increase in ILA productivity over base
– Intermodal share grows to 25%
– Vessel load factor doubles
43
Summary of Opportunity Costs
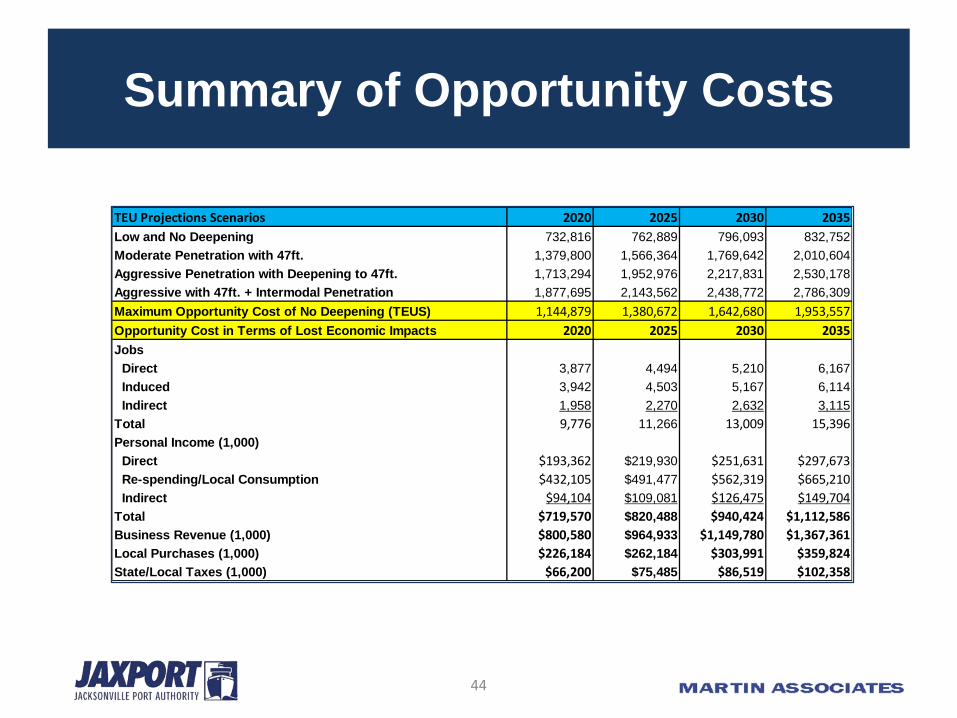
TEU Projections Scenarios 2020 2025 2030 2035
Low and No Deepening 732,816 762,889 796,093 832,752
Moderate Penetration with 47ft. 1,379,800 1,566,364 1,769,642 2,010,604
Aggressive Penetration with Deepening to 47ft. 1,713,294 1,952,976 2,217,831 2,530,178
Aggressive with 47ft. + Intermodal Penetration 1,877,695 2,143,562 2,438,772 2,786,309
Maximum Opportunity Cost of No Deepening (TEUS) 1,144,879 1,380,672 1,642,680 1,953,557
Opportunity Cost in Terms of Lost Economic Impacts 2020 2025 2030 2035
Jobs
Direct 3,877 4,494 5,210 6,167
Induced 3,942 4,503 5,167 6,114
Indirect 1,958 2,270 2,632 3,115
Total 9,776 11,266 13,009 15,396
Personal Income (1,000)
Direct $193,362 $219,930 $251,631 $297,673
Re-spending/Local Consumption $432,105 $491,477 $562,319 $665,210
Indirect $94,104 $109,081 $126,475 $149,704
Total $719,570 $820,488 $940,424 $1,112,586
Business Revenue (1,000) $800,580 $964,933 $1,149,780 $1,367,361
Local Purchases (1,000) $226,184 $262,184 $303,991 $359,824
State/Local Taxes (1,000) $66,200 $75,485 $86,519 $102,358
44

Present Value of Opportunity Cost of
State/Local Taxes
• Cost of Project – $684 million
• Present value of foregone state and local
tax revenue through 2035
– $785.7 million @ 5% discount rate
– $918.1 million @ 3.75% discount rate
45

Opportunity Cost of Not Deepening to
Minimum 47 ft.
• Loss of first inbound port call: – Distribution center development
– Discretionary regional market penetration
– Compete with off-shore transshipment centers
– Manufacturing complex development
• Loss of last outbound port call: – Ability to handle heavy weight exports
– Attract export manufacturing companies by providing longer cut-off times
• Loss of opportunity for development of import distribution centers/logistics centers and light manufacturing
46

Significant Growth in Distribution Centers in Gulf and
Atlantic Port Ranges Has Driven and Accompanied
Growth in All-Water Services
Top 25 Retailers 26-50 Retailers
Source: Chain Store Guide, National Retail Federation
47
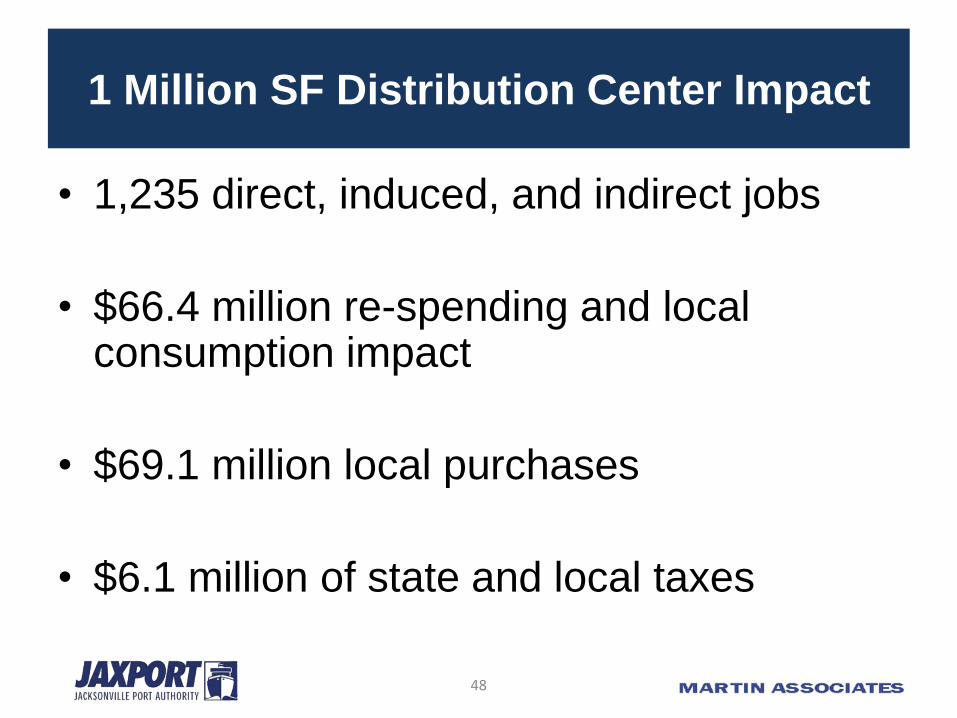
1 Million SF Distribution Center Impact
• 1,235 direct, induced, and indirect jobs
• $66.4 million re-spending and local consumption impact
• $69.1 million local purchases
• $6.1 million of state and local taxes
48
THANK YOU!
49