the economic impact of the university of new mexico … · the economic impact of the university of...
TRANSCRIPT

THE ECONOMIC IMPACT OF THE UNIVERSITY OF NEW MEXICOON THE STATE OF NEW MEXICO
UNIVERSITY OF NEW MEXICO
BUREAU OF BUSINESS AND
ECONOMIC RESEARCH
Prepared for Vice President Judy Jones
Office of Institutional Advancement University of New Mexico
January 2004

THE ECONOMIC IMPACT OF THE UNIVERSITY OF NEW MEXICO ON
THE STATE OF NEW MEXICO
January 2004
UNIVERSITY OF NEW MEXICO
BUREAU OF BUSINESS AND ECONOMIC RESEARCH

Acknowledgements There were many departments at UNM and many people who helped provide the data, insight and wisdom necessary to complete this project. Critical financial information and much appreciated patience were provided by Associate VP for Business & Finance And University Controller Bill Britton, Associate University Controller Ava Lovell, UNM Hospital Executive Director of Financial Planning & Analysis Jeff O’Malley. Miranda Eastham at the Office of Alumni Relations was responsible for all of the alumni data. Ryan Deller and Bob Fondino at the Health Sciences Center were relied upon every step of the way to understand HSC operations and finances. Gerry Bradley and Michelle Doran at the New Mexico Department of Labor provided all of the wage data. Many thanks go to Lisa Kuuttila and Peter Rachor at Science and Technology Corporation, Amy Marks at the UNM Foundation, Mark Chisholm at the Office of Institutional Research, and Jep Choat and Lois Griesbaum in the Registrar’s Office. This report could not have been done without the help of Lee Reynis, Director, Larry Waldman, Chief Economist, and Tony Sylvester, Research Scientist, at BBER. Norton Francis Bureau of Business and Economic Research University of New Mexico

UNM Bureau of Business and Economic Research
Executive Summary The University of New Mexico (UNM) is a major economic player in New Mexico and through its operations and its alumni has a significant impact on the state’s economy. • In FY 03 UNM operations including the main campus, the branch campuses, the
Health Sciences Center (HSC) and UNM Hospitals accounted for $1.2 billion in expenditures and 19,439 full and part-time jobs. Total salaries and benefits were $647.3 million. Non-personnel expenditures totaled $591.6 million.
• Forty percent of UNM’s expenditure was supported by out-of-state revenue sources. • Including $35.4 million estimated spending by non-resident students, these outside
dollars supported $528.6 million in UNM spending on goods and services, an estimated 73% of which ($384.5 million) stayed in state as direct purchases from New Mexico businesses.
• In FY 03, these outside dollars also directly supported 5,864 full-time equivalent jobs
at UNM and $243.6 million of UNM’s payroll. • All this additional spending in New Mexico had indirect and induced effects,
generating an estimated $256.8 million in additional economic output, $82.7 million in additional salaries and 3,499 in additional full-time equivalent jobs.
• The total economic impact of the out-of-state dollars UNM brought into the state in
FY 03 amounts to $641.3 million in total output, $326.3 million in salaries, and 9,363 full-time equivalent jobs. A total of $1.67 was generated in the New Mexican economy for every dollar UNM spent here that was supported by out-of-state revenue.
UNM’s primary mission is education and the University through its main and branch campus, its extended university, and its Health Sciences Center conferred 4,156 degrees in 2002-2003. • Records from the Alumni Office indicate that over 62,000 of UNM alumni – roughly
60% of all alumni on file (with graduates going back to 1923) – lived in New Mexico in 2003. Of those in New Mexico, over 54,000 -- 87% -- are currently working or show up in Department of Labor records as having worked during the last 7 years.
• UNM graduates typically enjoy higher annual wages than the average New Mexican,
with the median annual earnings in 2002 for UNM alumni working year round 67% higher than the median for all year-round New Mexico workers -- $40,714 versus $24,334.
UNM Bureau of Business and Economic Research
• Regardless of degree, UNM alumni typically enjoy faster earnings growth than is typical for the New Mexico wage-earning population as a whole.
• While UNM male graduates do extremely well, with median earnings more than
double the median earnings for all New Mexicans, a UNM education is helping women narrow the wage gap. UNM women earn 74% of what UNM men earn in New Mexico, while all New Mexico women wage workers earn 71%.
• Engineers have critical roles to play in New Mexico economic development efforts.
Of interest, 55% of those receiving a Bachelor’s in Engineering over the past 10 years are still in the state. While it is too early to tell whether they will remain in the state, the retention rate for engineers has increased with each graduating class since academic year 1993 and was 82% for the latest class (2001-02).
• Teachers with an undergraduate degree from the College of Education are leaving the
state, for a variety of reasons, in high numbers, with only 49% of those graduating in the past 10 years still in the state. The retention rate falls from 60% of teachers who graduated in 1992-93 to 43% for those graduating in 1995-96. While it is too early to tell whether they will remain in the state, according to Alumni Office records, 50% of teachers from the class of 2000-01 and 54% of the class of 2001-02 are in New Mexico.
• A national nursing shortage has made the training of additional nurses a priority in
New Mexico. Overall, the retention rate for those graduating from UNM undergraduate nursing program during the past 10 years is 59%. While it is too early to tell whether they will remain in the state, 66% and 83% respectively of the class of 2000-01 and 2001-02 are still in the state.
Technology commercialization is carried out by the Science and Technology Corporation (STC), which has been in existence since 1995. • STC files an average of 44 disclosures of patents and is issued an average of 14
patents per year. • In addition to 36 licensing arrangements signed since 1996, STC has helped 11 start-
ups and has equity in 7 companies. • Despite its short history amongst peer university technology commercialization
entities, STC is competitive in number of disclosures and patents issued and number of start-ups.
UNM Bureau of Business and Economic Research
Table of Contents Introduction ........................................................................................................1 Total Economic Impact of UNM Operations on New Mexico ..........1 Summary of Findings ......................................................................................1 Methodology .....................................................................................................2 Inputs ................................................................................................................4 Revenue........................................................................................................4 Expenditures ................................................................................................5 Employment.................................................................................................8 Impact ...............................................................................................................9 Employment and Salary Impact...................................................................9 Output Impacts.............................................................................................9 Conclusion ......................................................................................................10 Analysis of UNM Alumni Residing in New Mexico ............................12 Methodology ...................................................................................................12 Wage Data..................................................................................................12 Alumni Data...............................................................................................13 Comparing UNM to New Mexico .................................................................13 UNM by Degree.........................................................................................17 Alumni Retention.......................................................................................19 Engineers, Nurses and Teachers..........................................................20 Conclusion ......................................................................................................20 UNM’s Technology Commercialization .................................................22 Appendix A – Revenue Distribution by Site......................................................25 Appendix B – Average Wages For UNM Alumni .............................................26 Appendix C – Bibliography ................................................................................27 Appendix D - Comparison of Previous Studies .................................................28 2000 UNM Impact Study and Current Study ..................................................28 2003 Health Sciences Center Study and the Current Study.............................29

Introduction The University of New Mexico Office of Institutional Advancement commissioned the UNM Bureau of Business and Economic Research (BBER) to conduct a study of the economic impact of the University of New Mexico (UNM) on the economy of New Mexico for Fiscal Year 2003. This report contains the results of the study and outlines the data and methods used to arrive at these results. This report is composed of three parts that help illustrate the total impact of UNM on the state. The first part is a traditional economic analysis that shows how the dollars that flow to UNM from out-of-state support direct spending on salaries, benefits, goods and services and generate additional economic activity in New Mexico. For every dollar spent by UNM in New Mexico there are indirect and induced effects that spread through the state’s economy. UNM’s expenditures on goods and services create indirect effects as the firms supplying goods and services to UNM buy from other firms and put people to work filling the orders. The salaries that UNM and UNM vendors pay their employees are spent in the community, creating additional demand for goods and services, resulting in more demand, more orders, more people working, and more income -- thus creating induced effects which ripple through the economy. The second part of this report is a workforce-development analysis. Using alumni data from UNM’s Office of Alumni Relations and matching it with data from the New Mexico Department of Labor, BBER has created a picture of UNM students after graduating from UNM. The analysis looks at the graduates of particular programs who are still in the state and their total earnings if working for New Mexico businesses. This is a benchmark analysis that can be used in future years to assess performance and develop policy. However, the analysis also provides some insights into UNM’s role in educating and training New Mexico’s work-force and a better understanding of the value of a UNM education in terms of an individual’s future earnings potential. The final part of this report is an overview of the Science and Technology Corporation (STC), the entity that handles technology transfer for UNM. This section includes STC’s track record as well as comparisons with peer institutions.
Total Economic Impact of UNM Operations on New Mexico
Summary of Findings In State Fiscal Year 2003, the University of New Mexico, which includes the Main campus and the branch colleges, the Health Sciences Center and the UNM Hospitals, spent a combined total of $1.2 billion and provided 19,439 full and part-time jobs. The mean salary at UNM was $38,900 compared to the New Mexico average of $23,800.1 Thus the jobs UNM directly creates are among the better paying jobs in New Mexico and generate a significant amount of tax revenue to pay for vital government services. State and local tax revenue directly attributable to UNM is estimated to be $62.4 million, $23.1 million of which is the result of the increased
1 Source: US Bureau of Economic Analysis
UNM Bureau of Business and Economic Research 2
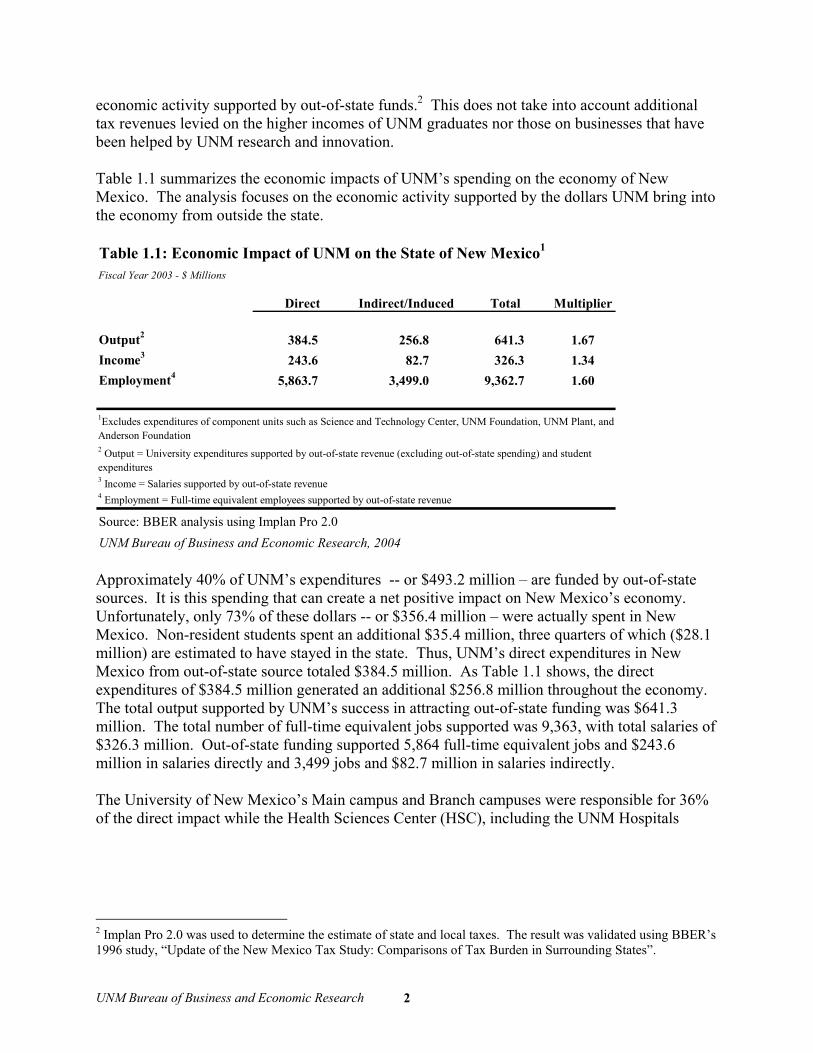
economic activity supported by out-of-state funds.2 This does not take into account additional tax revenues levied on the higher incomes of UNM graduates nor those on businesses that have been helped by UNM research and innovation. Table 1.1 summarizes the economic impacts of UNM’s spending on the economy of New Mexico. The analysis focuses on the economic activity supported by the dollars UNM bring into the economy from outside the state.
Approximately 40% of UNM’s expenditures -- or $493.2 million – are funded by out-of-state sources. It is this spending that can create a net positive impact on New Mexico’s economy. Unfortunately, only 73% of these dollars -- or $356.4 million – were actually spent in New Mexico. Non-resident students spent an additional $35.4 million, three quarters of which ($28.1 million) are estimated to have stayed in the state. Thus, UNM’s direct expenditures in New Mexico from out-of-state source totaled $384.5 million. As Table 1.1 shows, the direct expenditures of $384.5 million generated an additional $256.8 million throughout the economy. The total output supported by UNM’s success in attracting out-of-state funding was $641.3 million. The total number of full-time equivalent jobs supported was 9,363, with total salaries of $326.3 million. Out-of-state funding supported 5,864 full-time equivalent jobs and $243.6 million in salaries directly and 3,499 jobs and $82.7 million in salaries indirectly. The University of New Mexico’s Main campus and Branch campuses were responsible for 36% of the direct impact while the Health Sciences Center (HSC), including the UNM Hospitals
2 Implan Pro 2.0 was used to determine the estimate of state and local taxes. The result was validated using BBER’s 1996 study, “Update of the New Mexico Tax Study: Comparisons of Tax Burden in Surrounding States”.
Fiscal Year 2003 - $ Millions
Multiplier
Output2 384.5 256.8 641.3 1.67Income3 243.6 82.7 326.3 1.34Employment4 5,863.7 3,499.0 9,362.7 1.60
Source: BBER analysis using Implan Pro 2.0UNM Bureau of Business and Economic Research, 2004
Table 1.1: Economic Impact of UNM on the State of New Mexico1
Indirect/InducedDirect Total
4 Employment = Full-time equivalent employees supported by out-of-state revenue
2 Output = University expenditures supported by out-of-state revenue (excluding out-of-state spending) and student expenditures3 Income = Salaries supported by out-of-state revenue
1Excludes expenditures of component units such as Science and Technology Center, UNM Foundation, UNM Plant, and Anderson Foundation

UNM Bureau of Business and Economic Research 3
(UNMHs), accounted for the remaining 64%.3 This is the case even though Main and Branch comprised 45% of UNM’s total expenditure. HSC’s disproportionate share of the impact can be partly attributed to the fact that HSC receives a larger portion of their revenue from out-of-state sources, primarily the federal government, than do the Main and Branch campuses. An additional reason is that employee salaries, most of which is spent locally, represent a greater share of total expenditure at HSC than at the Main and Branch campuses.
Methodology What would New Mexico be like if there were no University of New Mexico? This is the central question that a static economic impact analysis attempts to answer. UNM is a major economic player in the state of New Mexico. It is the state’s largest post-secondary institution, public or private, and one of the largest employers. UNM’s impact is spread out across the state through its branch campuses and the dispersion of its alumni. The university is intimately connected to all levels of government and has numerous liaisons and interactions with the private sector. While UNM impacts New Mexico in countless ways, this analysis is only concerned with the total impact of expenditures and employment and where those dollars go. There are three rounds of impacts that create the total economic impact: direct, indirect and induced. The direct impact is the initial spending by UNM on goods, services, and compensation. The indirect impact is the economic activity generated by the spending of UNM’s suppliers on goods, services and compensation. Finally, the induced impact comes from the economic activity generated by the employees of UNM and its suppliers spending their wages on goods and services. This is what is called the multiplier effect since initial economic transactions—UNM making purchases and hiring people—generate additional economic activity. The ratio of the total economic impact to the direct economic impact is the multiplier and it will vary depending on whether one is looking at output, employment or salaries. For this study, the classification of expenditures by detailed industry, the in-state share of expenditures and the estimation of economic impacts on output, salaries and employment were determined using Implan Pro 2.0.4 Implan Pro 2.0 is a regional economic modeling and impact analysis application that works with a proprietary New Mexico input-output database. Implan Pro 2.0 calculates how much of any given expenditure stays in-state and traces the economic impact on New Mexico industries. Implan Pro 2.0 is widely used in performing economic impact analyses. BBER has validated Implan Pro 2.0 results for New Mexico in other studies, where both Implan and BBER’s FOR-UNM model have been used to estimate economic impacts. This study only considers expenditures that are supported by out-of-state revenues. This method assumes that domestic share of UNM’s revenue, i.e. the share that is derived from sources within New Mexico, would flow to some other activity if UNM did not exist and still yield an economic impact. UNM’s impact is derived from its ability to attract revenues from outside of New 3 The direct spending of the component units of UNM—University Physician Associates, The University of New Mexico Foundation, Inc., The Robert O. Anderson Schools of Management Foundation, The Science & Technology Corporation @ UNM, University of New Mexico Lobo Club, Lobo Energy, Inc., The University of New Mexico Alumni Association—are not included in this analysis. However, donations and payments for the services that result in revenues to UNM are included. 4 Minnesota IMPLAN Group, Inc., IMPLAN System (data and software), 1725 Tower Drive West, Suite 140, Stillwater, MN 55082 www.implan.com

UNM Bureau of Business and Economic Research 4
Mexico which would otherwise stay outside of New Mexico. This outside money includes federal grants and contracts as well as private industry and foundation support which UNM is able to attract by being a premier research institution. The first step in the data collection process was to calculate how much of UNM’s annual revenue was derived from outside sources. This analysis uses state fiscal year 2003, which went from July 1, 2002, to June 30, 2003, as the reference period. Using the UNM Controller’s data on revenues combined with other data from the UNM Foundation, the Health Sciences Center and UNM Housing Services, BBER was able to calculate the share of revenue that support UNM’s mission originating outside of New Mexico. Student expenditure data were also collected based on the number of non-resident students, how many lived on-campus, and how many attended UNM full-time. BBER calculated student expenditure using data from and consultation with Housing Services, the Registrar, and Financial Aid.
Inputs
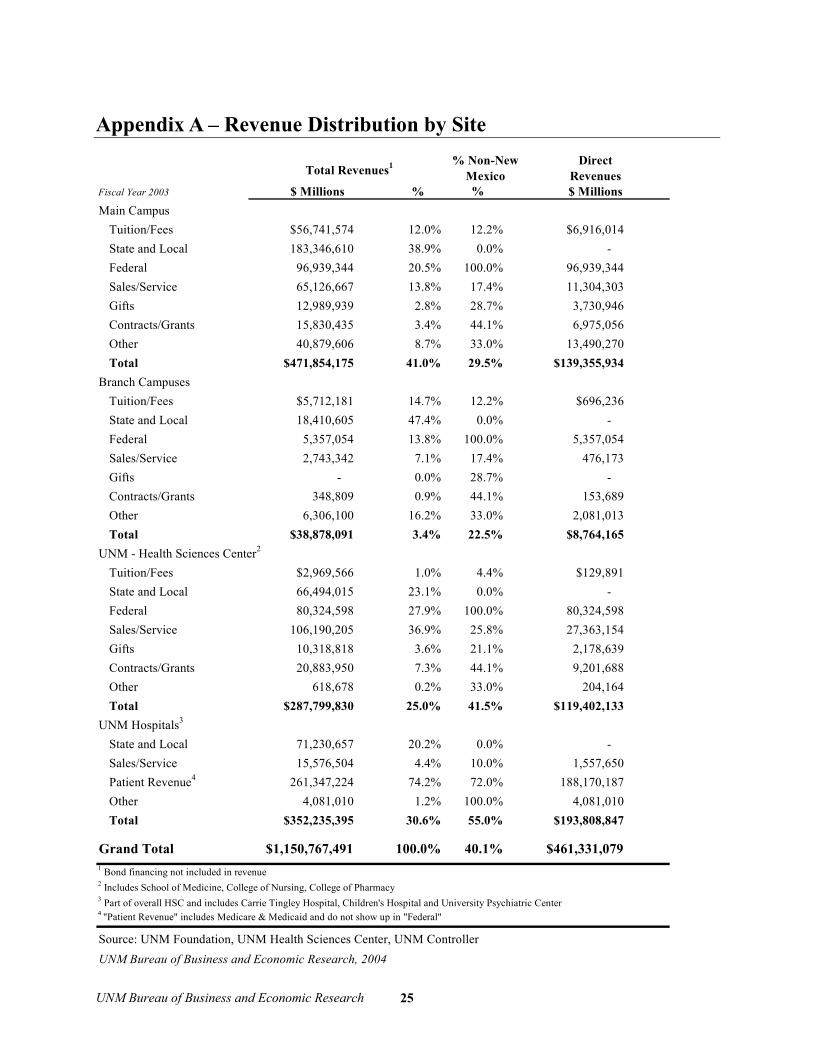
Revenue Table 1.2 displays all revenue sources and amounts for the entire University. State and local appropriations (including contracts and grants) make up the bulk of UNM’s revenue with patient revenue from the UNM Hospitals making up the next biggest share. Following the export-base methodology, State and Local sources are considered to have a zero impact on the state since it is assumed they would be spent elsewhere in the state if they did not go to the university. Federal sources are counted as entirely out-of-state. Even though New Mexicans pay federal taxes, federal money is spent in the national marketplace and so this revenue would likely not be spent in New Mexico without the presence of UNM. Patient revenue going to the UNM Hospitals is largely made up of Medicare and Medicaid sources which are federal programs (there is an adjustment made for the state’s portion of Medicaid). The number of non-resident full-time students determined the out-of-state share of tuition and fees. There was no attempt to determine if the resident students would have gone out-of-state if UNM did not exist. A complete table of revenue distribution by site is included in the appendix.

UNM Bureau of Business and Economic Research 5
Expenditures There are several categories of expenditure used in this analysis. UNM spent over $1.2 billion in FY03, more than half on salaries and benefits (Table 1.3). There was also significant spending on capital equipment and construction projects. These latter amounts have been averaged over multiple years to mitigate the impact of one-time projects. The bulk of the non-compensation expenditure was for operational activities, which include maintenance and other activities that support UNM’s mission.
Table 1.2: Summary of Revenue SourcesFiscal Year 2003
Tuition/Fees 65.4$ 5.69 11.8 7.7$ State and Local 339.5 29.50 - - Federal 182.6 15.87 100.0 182.6 Sales/Service 189.6 16.48 21.5 40.7 Gifts 23.3 2.03 25.4 5.9 Contracts/Grants 37.1 3.22 44.1 16.3 Patient Revenue2 261.3 22.71 72.0 188.2 Other 51.9 4.51 38.3 19.9
Total 1,150.8$ 100.00 40.1 461.3$
1 Bond financing not included in revenue2 "Patient Revenue" includes Medicare & Medicaid and do not show up in "Federal"
Source: UNM Foundation, UNM Health Sciences Center, UNM ControllerUNM Bureau of Business and Economic Research, 2004
%$ Millions $ Millions
% Non-New Mexico Source
Direct RevenuesTotal Revenues1
%

UNM Bureau of Business and Economic Research 6
As discussed, only expenditures supported by out-of-state revenue are considered. This makes a big difference in the site-by-site expenditures. As can be seen in Table 1.4, the Main campus accounts for nearly half of all spending. Since the site only receives 30% of its revenue from outside the state, its impact is diminished relative to the other sites. UNM Hospitals receives 55% of its revenue from outside, mostly due to federal health payments, and so the real impact is relatively greater. Table 1.4 shows the supported expenditures by site. Where Main campus made up 42% of the total expenditure, it only accounts for 31% of the supported expenditure due to the lower out-of-state adjustment. Overall, 40% of UNM’s expenditures are supported by out-of-state revenue.
Table 1.3: ExpendituresFiscal Year 2003 - $ Millions
Compensation 237.4$ 18.5$ 212.1$ 179.3$ 647.3$ Faculty 75.3 8.2 90.8 - 174.3 Staff 104.1 8.5 65.0 169.1 346.7 Student Employment 41.9 0.8 40.1 - 82.8 Benefits3 16.0 1.0 16.2 10.2 43.5
Expenditures 287.7 11.9 118.9 173.1 591.6 Construction4 44.2 2.6 4.2 9.5 60.5 Capital Equipment4 16.8 1.0 7.9 11.2 36.9 Operational 226.7 8.3 106.8 152.4 494.2
Total 525.1$ 30.4$ 331.0$ 352.5$ 1,238.9$
1 Includes School of Medicine, College of Nursing, College of Pharmacy2 Part of overall HSC and includes Carrie Tingley Hospital, Children's Hospital and University Psychiatric Center3 Benefits includes health insurance and fringe benefits4 Construction and capital equipment expenditures shown here have been averaged over two years (three years for UNM Hospitals)
Source: UNM Health Sciences Center, UNM ControllerUNM Bureau of Business and Economic Research, 2004
Main Campus
Total ExpendituresUNM Hospitals2Health Sciences
Center1Branch
Campuses

UNM Bureau of Business and Economic Research 7
Accounting for the amount of UNM expenditures that “leaked” out of the state was the final adjustment of the supported expenditure. This is, the amount that goes to purchase goods and services from other states or internationally. New Mexico has a fairly small manufacturing industry relative to the rest of the country and so UNM cannot purchase all of its required machinery and equipment in the state and must go on the broader markets to make those purchases. Almost half of all non-salary expenditures are leaked in this way. Salary expenditures, which are included in Table 1.5, are mostly spent in New Mexico.
Fiscal Year 2003 - $ Millions
Out-of-State Percentage
Main Campus 525.1$ 29.5% 155.1$ Branch Campuses 30.4 22.5% 6.8 Health Sciences Center1 331.0 41.5% 137.3 UNM Hospitals2 352.5 55.0% 193.9
Total 1,238.9$ 493.2$
1 Includes School of Medicine, College of Nursing, College of Pharmacy
Source: BBER analysisUNM Bureau of Business and Economic Research, 2004
Total Expenditure
Table 1.4: Expenditure Supported by Out-of-State Revenue
Supported Expenditure
2 Part of overall HSC and includes Carrie Tingley Hospital, Children's Hospital and University Psychiatric Center
UNM Bureau of Business and Economic Research 8
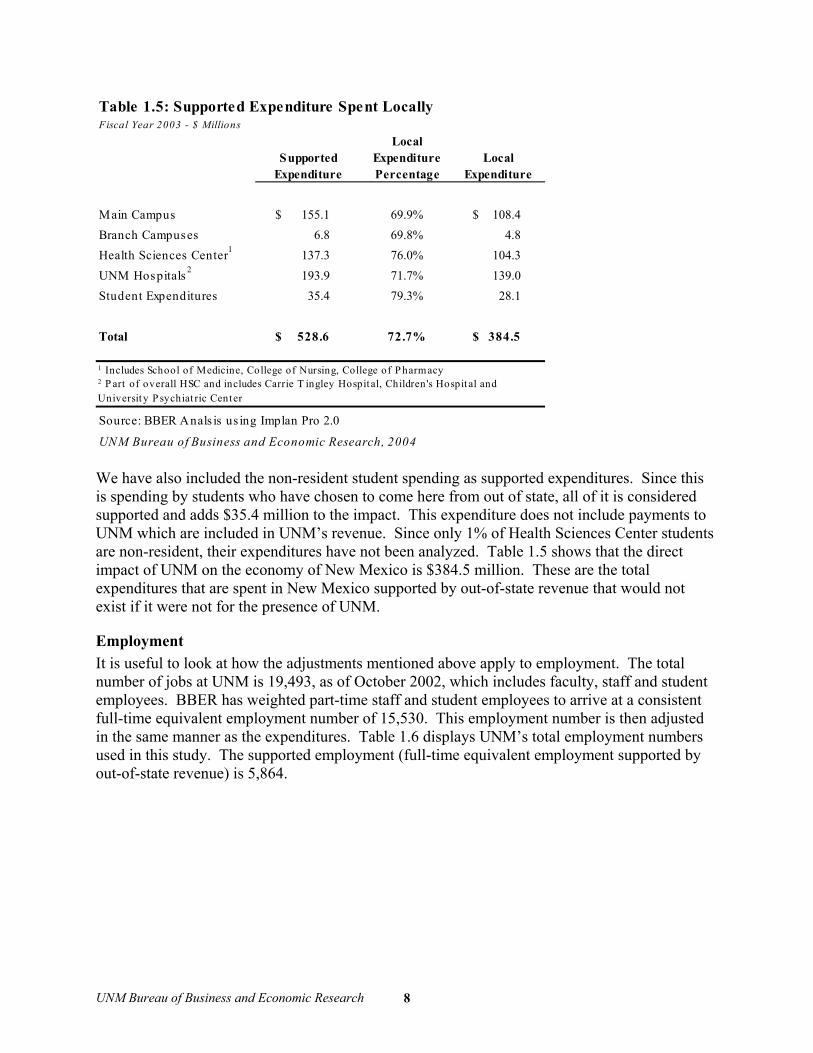
We have also included the non-resident student spending as supported expenditures. Since this is spending by students who have chosen to come here from out of state, all of it is considered supported and adds $35.4 million to the impact. This expenditure does not include payments to UNM which are included in UNM’s revenue. Since only 1% of Health Sciences Center students are non-resident, their expenditures have not been analyzed. Table 1.5 shows that the direct impact of UNM on the economy of New Mexico is $384.5 million. These are the total expenditures that are spent in New Mexico supported by out-of-state revenue that would not exist if it were not for the presence of UNM.
Employment It is useful to look at how the adjustments mentioned above apply to employment. The total number of jobs at UNM is 19,493, as of October 2002, which includes faculty, staff and student employees. BBER has weighted part-time staff and student employees to arrive at a consistent full-time equivalent employment number of 15,530. This employment number is then adjusted in the same manner as the expenditures. Table 1.6 displays UNM’s total employment numbers used in this study. The supported employment (full-time equivalent employment supported by out-of-state revenue) is 5,864.
Fiscal Year 2003 - $ MillionsLocal
Expenditure Percentage
Main Campus 155.1$ 69.9% 108.4$ Branch Campuses 6.8 69.8% 4.8 Health Sciences Center1 137.3 76.0% 104.3 UNM Hospitals 2 193.9 71.7% 139.0 Student Expenditures 35.4 79.3% 28.1
Total 528.6$ 72.7% 384.5$
1 Includes School of Medicine, College of Nursing, College of P harmacy
Source: BBER Anals is us ing Implan Pro 2.0
UNM Bureau of Business and Economic Research, 2004
Supported Expenditure
Table 1.5: Supported Expenditure Spent Locally
Local Expenditure
2 P art of overall HSC and includes Carrie T ingley Hospital, Children's Hospit al and University P sychiat ric Center

UNM Bureau of Business and Economic Research 9
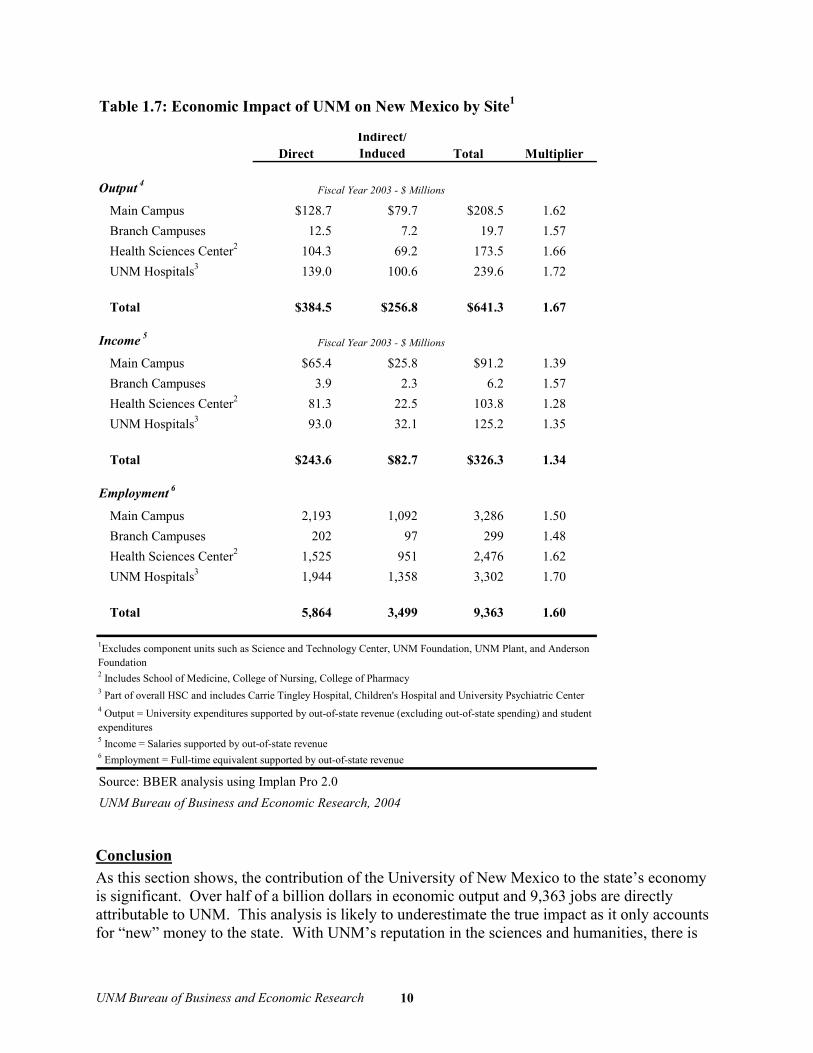
Impact Following the methodology outlined previously, it was determined that during FY2003, out-of-state revenue supported UNM spending of $384.5 million in New Mexico. These expenditures had a direct economic impact on the state’s economy through employment and purchase of goods and services, and additional impacts through further indirect and induced rounds of spending. Table 1.7 presents these impacts by site.
Employment and Salary Impact Funds originating from outside of New Mexico directly supported 5,864 full-time equivalent jobs and $243.6 million in salaries at UNM for FY2003. Indirect and induced impacts generated an additional 3,499 jobs and $82.7 million in salaries. The total economic impact divided by the direct impact yields an employment multiplier of 1.60 and a salary multiplier of 1.34.
Output Impacts The $384.5 million in direct output supported by out-of-state funds led to an additional $256.8 million in indirect/induced economic activity. Thus, by attracting the funds necessary to support the $384.5 million in expenditures, UNM generated a total of $641.3 million in economic activity for the state of New Mexico, resulting in an output multiplier of 1.67.
Table 1.6: Employment by SiteAs of October 2002
Faculty Staff1 Students1Total
Employment%
SupportedSupported
Employment
Main Campus 1,606 3,880 1,941 7,426 29.5% 2,193 Branch Campuses 464 301 132 896 22.5% 202 Health Sciences Center2,3 1,538 1,667 471 3,676 41.5% 1,525 UNM Hospitals4 - 3,533 - 3,533 55.0% 1,944
Total 3,608 8,013 5,086 15,530 5,864
1 Part-time staff and students weighted by 0.5 to arrive at full-time equivalents2 Includes School of Medicine, College of Nursing, College of Pharmacy3 HSC students includes medical residents4 Part of overall HSC and includes Carrie Tingley Hospital, Children's Hospital and University Psychiatric Center
Source: UNM Office of Institutional ResearchUNM Bureau of Business and Economic Research, 2004
UNM Bureau of Business and Economic Research 10
Conclusion As this section shows, the contribution of the University of New Mexico to the state’s economy is significant. Over half of a billion dollars in economic output and 9,363 jobs are directly attributable to UNM. This analysis is likely to underestimate the true impact as it only accounts for “new” money to the state. With UNM’s reputation in the sciences and humanities, there is
DirectIndirect/Induced Total Multiplier
Output 4
Main Campus $128.7 $79.7 $208.5 1.62Branch Campuses 12.5 7.2 19.7 1.57Health Sciences Center2 104.3 69.2 173.5 1.66UNM Hospitals3 139.0 100.6 239.6 1.72
Total $384.5 $256.8 $641.3 1.67
Income 5
Main Campus $65.4 $25.8 $91.2 1.39Branch Campuses 3.9 2.3 6.2 1.57Health Sciences Center2 81.3 22.5 103.8 1.28UNM Hospitals3 93.0 32.1 125.2 1.35
Total $243.6 $82.7 $326.3 1.34
Employment 6
Main Campus 2,193 1,092 3,286 1.50Branch Campuses 202 97 299 1.48Health Sciences Center2 1,525 951 2,476 1.62UNM Hospitals3 1,944 1,358 3,302 1.70
Total 5,864 3,499 9,363 1.60
2 Includes School of Medicine, College of Nursing, College of Pharmacy
Source: BBER analysis using Implan Pro 2.0UNM Bureau of Business and Economic Research, 2004
6 Employment = Full-time equivalent supported by out-of-state revenue
1Excludes component units such as Science and Technology Center, UNM Foundation, UNM Plant, and Anderson Foundation
Table 1.7: Economic Impact of UNM on New Mexico by Site1
5 Income = Salaries supported by out-of-state revenue
4 Output = University expenditures supported by out-of-state revenue (excluding out-of-state spending) and student expenditures
Fiscal Year 2003 - $ Millions
Fiscal Year 2003 - $ Millions
3 Part of overall HSC and includes Carrie Tingley Hospital, Children's Hospital and University Psychiatric Center

UNM Bureau of Business and Economic Research 11
argument that many students that would otherwise have gone out of state for education have chosen to stay at UNM. A more compelling analysis would determine how many of the resident students stayed in New Mexico when they had the opportunity and resources to go out of state. Further underestimating the impact are the expenditures of visitors to UNM whether they are parents of students, non-resident alumni or the attendees of the many conferences and events UNM sponsors.5 All of these visitors spend money in the New Mexico economy—money that would not have come to New Mexico had it not been for UNM. So even though UNM’s direct impact of $641.3 million makes UNM an engine for economic activity in New Mexico, the true impact of UNM is potentially greater.
5 The information that would enable BBER to calculate the economic impacts of visitors is not collected or maintained. In a 2000 impact study for UNM, BBER made various efforts to collect this information but the data was insufficient to provide meaningful results.

UNM Bureau of Business and Economic Research 12
Analysis of UNM Alumni Residing in New Mexico UNM also impacts New Mexico by developing a highly skilled, educated workforce. This impact is demonstrated by the retention of graduates as well as the higher median wages of UNM alumni. Using alumni data of those alumni still living in New Mexico, retention rates for different degrees and majors were measured to provide a benchmark of the workforce development impact. Adding wage record data to the alumni data creates a picture of the added value of a UNM education and the results are significant for UNM and its students and alumni. In 2002, the median wage of a UNM alumnus was 67% higher than the average New Mexican’s median wage. Similar results were found when applied to males and females and to different age groups.
Methodology The New Mexico Department of Labor (NMDOL) assisted BBER by providing wage records for individuals in New Mexico from 1996 to 2002. These datasets consist of over 8 million quarterly wage records per year and are used to compile aggregate statistics on the New Mexico economy and labor market. Matching these data with a dataset of alumni received from the UNM Office of Alumni Relations, BBER compiled an extremely rich dataset that is used here to compare UNM alumni to all New Mexican workers. Divisions based on gender, age and year-round status (see below for descriptions of these terms as used here).
Wage Data The NMDOL data contain wage information by quarter for all New Mexican workers. The data are derived from quarterly wage reports New Mexico employers file with the NMDOL. Self-employment, farm and unearned income are not included in the data or in the results. Due to the scope of this project, the data were aggregated by employee to create a set of annual wages and number of quarters worked. Some of the tables refer to “Year-round” workers. These are defined as workers who had wages in each quarter of a particular year. Part-time workers and workers with multiple jobs are included in these numbers. Table 2.1 shows the percentage of year-round workers for alumni and for New Mexico as a whole. Whether this results in under- or over-estimation is unclear as the inclusion of part-time workers would tend to underestimate the aggregate wages while the opposite is likely true for multiple job workers. Most of the following tables are presented with statistics for three time periods: 1997, 2000, and 2002. The time periods were chosen to show the data at different times in recent history. This is important in determining not just the differences in median annual wages but also how alumni fare over time compared to all New Mexican workers. The following analysis also uses medians rather than averages, although some tables are reproduced in Appendix B with averages. Medians are more meaningful descriptors of wage distributions since a relatively few high-wage records can distort an average calculation. A median is the midpoint in a distribution where 50% of the numbers are of lesser value and 50% of greater value.

UNM Bureau of Business and Economic Research 13
Alumni Data The UNM Office of Alumni Relations contributed a data set of all those UNM alumni who currently reside in New Mexico. Information on class year, degree, and some demographic data is included in the dataset. There were over 62,000 alumni identified as living in NM in 2003 or roughly 60% of all alumni.6 These alumni include graduates as far back as 1923 and are grouped according to class, degree and major. Of these, over 54,000, or 87%, are working or have worked in New Mexico in the last seven years and 26,000, or 42%, worked in each of the last seven years. Working inside the home, unemployment, education and self-employment are reasons why some alumni who are residents do not show up in the wage data.
Comparing UNM to New Mexico Figure 2.1 shows that the median wage is higher for Alumni than for New Mexicans in general, according to the relevant wage records. In 1997, the median is 50% higher while in 2002 the difference is 67%, suggesting that alumni experience higher wage growth rates than average. When making comparisons with average New Mexico workers, education attainment overall is important to keep in mind. A high percentage of New Mexicans—22%—have less than a high school education, drastically dampening the overall median wage.7 The NMDOL has no variable to control for educational attainment.
6 The total number of “mailable” alumni-those alumni who have a valid address-is 110,114 according to the UNM Office of Alumni Relations. 7 U.S. Department of Census, Decennial Census 2000.
Table 2.1: Pe rce nt Ye ar-round Worke rs in N e w M e xico1 9 9 7 2 0 0 0 2 0 0 2
UNM A lu mn i 75% 79% 76%NM 58% 59% 57%
No te: Year-ro u n d is d efin ed as wo rkers wh o h ad wag es in each q u arter
So u rce: UNM Office o f A lu mn i Relatio n s , NM Dep t o f Lab o r
UN M Bu rea u o f Bu sin ess a n d Eco n o mic Resea rch , 2 0 0 4

UNM Bureau of Business and Economic Research 14
Another way to see the added value of a UNM degree is to compare percentage of employment with percentage of wages. Table 2.2 shows that in every year, alumni enjoy more than their share of income suggesting higher incomes are a benefit of post-secondary education.
How a university degree boosts wages for men compared to women is particularly germane since more women than men are enrolling in colleges nationally and at UNM. According to Table 2.3, there is an advantage for women but it is not nearly as great as it is for men. For female alumni, the median wage is 50% more than the median for all New Mexicans and 76% higher than for all female New Mexicans. For men, the respective numbers are 103% higher for all New Mexicans and 69% for all male New Mexicans. Male alumni earn nearly $50,000, more than double the median annual wage of all New Mexicans in 2002. Another interesting question is whether a degree helps close the gender gap in wages between women and men. The ratio of women’s median annual wages to that of men is 73.9 for UNM alumni and 71.9 for all New Mexico workers. So even though a degree seems to help boost male wages more than female wages, the gap between men and women is narrower for UNM alumni.
Figure 2.1: Median Annual Wage, Year-round Employees
0
10000
20000
30000
40000
50000
UNM Alumni New Mexico
$ 20
02
1997 2000 2002
Source: NM Dept of Labor and UNM Office of Alumni RelationsUNM Bureau of Business and Economic Research, 2004
Table 2.2: Pe rce nt of Employme nt ve rsus Pe rce nt of Wage s1 9 9 7 2 0 0 0 2 0 0 2
UNM Alumni% o f To tal NM Emp lo y men t 5.5% 5.5% 5.4%% o f To tal NM W ag es 7.5% 8.2% 8.4%
No te: all figu res are in 2002 do llars and includ e o n ly y ear-ro u n d wo rkers
So u rce: UNM Office o f A lu mn i Relatio n s , NM Dep t o f Lab o r
UN M Bu rea u o f Bu sin ess a n d Eco n o mic Resea rch , 2 0 0 4

UNM Bureau of Business and Economic Research 15
Table 2.4 looks at the median annual wages by age cohort for UNM alumni and all New Mexican workers. In virtually all cases, the median annual wage for UNM alumni is higher than that for the same age group of all New Mexican workers. This suggests that UNM alumni have both higher annual wages and faster growing wages as the median annual wage for alumni is just above that of all New Mexican workers for the age group 25-34 and significantly higher for the age group 55-64.
In New Mexico, the largest sectors of employment are health care and education, which combined make up 23% of the workforce in 2002. The educational sector has among the highest wages in the state and it heads the list of industries where UNM alumni find themselves, with 34% of the alumni who could be identified with an industry in 2002. Fifteen percent of alumni were in professional services and 14% in health care and social assistance. The median wages
Table 2.3: M e dian Annual Wage s by Ge nde r1997 2000 2002
UNM Alumni 34,355$ 37,564$ 40,714$ Female 31,106 33,707 36,583 M ale 40,906 45,500 49,460
New Mexicans 22,971$ 23,852$ 24,334$ Female 19,448 20,108 20,736 M ale 27,371 28,547 29,270
Note: all figures are in 2002 do llars and include on ly year-round workers
Source: UNM Office o f A lumni Relations , NM Dept o f Labor
UNM Bureau o f Business and Economic Research , 2004
Table 2.4: M edian Annual Wages by Age1997 2000 2002
UNM Alumni 34,355$ 37,564$ 40,714$ Age in Years
< 25 9,411 11,574 15,920 25-34 29,128 31,093 33,398 35-44 38,838 40,805 42,985 45-54 41,963 44,112 46,356 55-64 40,734 43,417 45,714 65+ 17,733 17,199 25,710
New Mexicans 22,971$ 23,852$ 24,334$ Age in Years
< 25 10,908 11,251 11,534 25-34 21,800 22,856 23,550 35-44 27,615 28,065 28,710 45-54 30,503 31,546 31,994 55-64 26,826 28,422 29,389 65+ 12,352 13,400 14,566
Note: all figures are in 2002 dollars and include only year-round workers
Source: UNM Office of A lumni Relations , NM Dept of Labor
UNM Bureau of Business and Economic Research, 2004

UNM Bureau of Business and Economic Research 16
for alumni are much greater than the medians for all New Mexican workers in these industries. Between 1997 and 2002, manufacturing rose to being one of the top five industries employing UNM alumni, although it accounted for only 3.9% of the jobs. (In 1997, Manufacturing was the seventh largest sector by employment of UNM alumni). The significantly higher wages for UNM alumni in these industries suggests that alumni are in positions of greater responsibility. Having a college degree appears to expand the opportunities for advancement in many industries.
Table 2.5: Top Five Industries in Employment
UNM AlumniEducation services 36,795$ 33.9 Professional, scientific, and technical services 59,250 15.0 Health care and social assistance 40,947 13.8 Public administration 44,064 7.7 Manufacturing 65,476 3.9
New MexicoHealth care and social assistance 22,205$ 12.1 Education services 30,491 11.4 Accommodation and food services 10,899 8.5 Retail trade 19,286 8.2 Public administration 30,906 7.2
UNM AlumniEducation services 33,760$ 30.0 Health care and social assistance 35,735 16.1 Professional, scientific, and technical services 50,479 13.2 Public administration 39,222 7.1 Retail trade 22,483 4.4
New MexicoEducation services 27,779$ 11.7 Health care and social assistance 22,785 11.3 Retail trade 18,393 9.0 Accommodation and food services 10,460 8.1 Public administration 28,362 7.2
Notes:All figures are in 2002 dollars and include only Year-round workersThis data will not compare with official NM DOL Data for the following reasons:
Data are made up only of employees who had wages in each quarter of the respective yearData define industry as the primary industry in which an employee worked and so leave out multiple jobs.
Source: UNM Office of Alumni Relations, NM Dept of LaborUNM Bureau of Business and Economic Research, 2004
% of Workers
Median Wage % of Workers
2002
1997
Median Wage

UNM Bureau of Business and Economic Research 17
UNM by Degree Having established that for all groups having a UNM degree is related to higher wages, the next question to consider is what type of degree yields the most benefit. The professional degrees—M.D., M.B.A., and J.D. degrees—all exhibit much higher wages than academic degrees—BA or BS, MA or MS, PhD—but not necessarily better growth (Table 2.6). The degree with the highest compound annual growth rate is the MBA, followed by the BA and the MS. Lawyers, doctors and PhDs all have growth rates less than all UNM alumni, though higher than the growth rate for all New Mexican workers. References here to degrees indicate the last degree an alumnus residing in New Mexico received from UNM. Several thousand alumni have received multiple degrees: 10,274 received two degrees and 1,092 received three degrees. The bulk of these are alumni who earned a bachelor’s degree and went on to obtain either a master’s or a doctorate. The last column on Table 2.6 refers to the compound annual growth rate from 1997 to 2002. These medians are for all alumni residing in New Mexico who hold the degree regardless of how long they have held it.
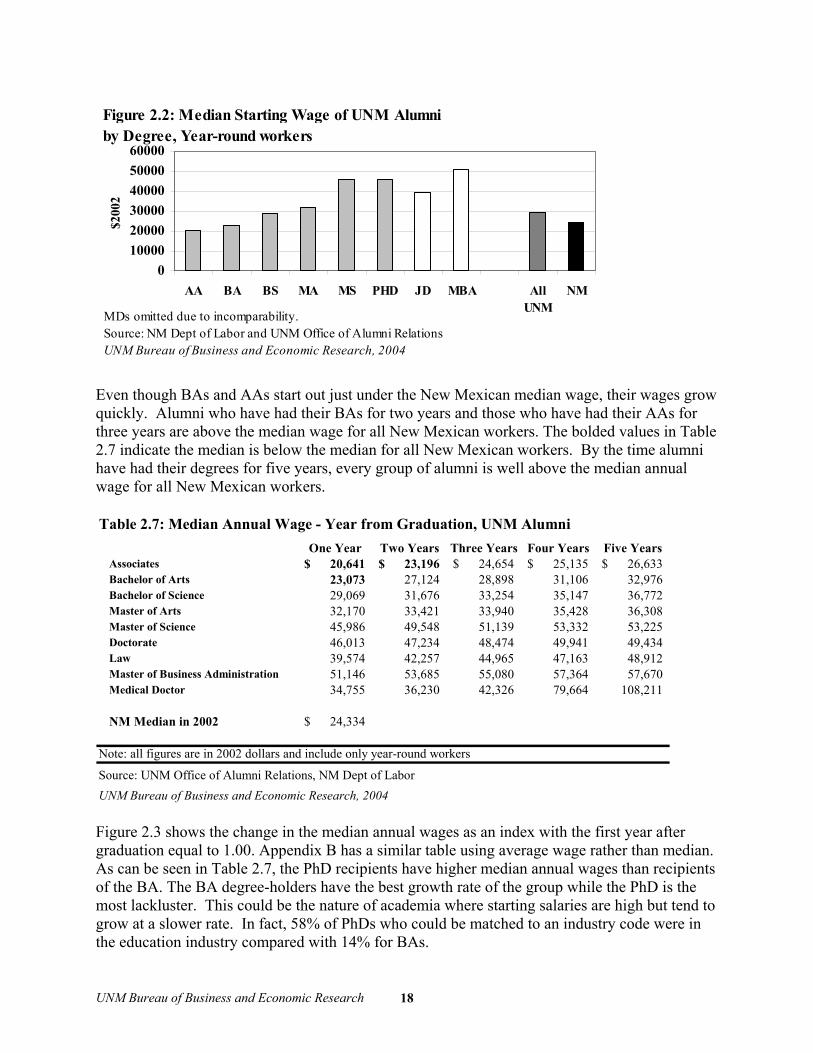
Figure 2.2 shows the median starting wage for different academic and professional degrees. Appendix B has a similar table using average wage rather than median. The starting wage is determined by the year of wage data following the date of degree. There is no accommodation made for the time during the year the degree was received. The median starting wage for UNM alumni is in most cases above the median NM wage. The Associates degree (AA) starts just under the median at $20,641 while the starting wage for an MBA is almost $50,000. Figure 2.2 depicts each degree median starting wage. MDs have been omitted from this analysis since the extent of their post-graduation training makes comparison difficult. This chart is only for those workers who have at least four quarters of wage income in each of the designated years.
Table 2.6: M edian Annual Wage by Degree , UNM Alumni1997 2000 2002 CAG%
Associates $ 24,692 $ 27,065 $ 28,649 3.0%Bache lor of Arts 28,415 32,041 35,140 4.3%Bache lor of S cience 33,534 37,092 40,121 3.7%Master of Arts 36,212 38,840 41,732 2.9%Master of S cience 48,352 53,654 59,719 4.3%Doctorate 49,935 52,323 54,583 1.8%Law 56,001 60,898 62,308 2.2%Master of Business Administration 52,578 59,563 65,614 4.5%Medical Doctor 112,486 123,411 127,471 2.5%
UNM Median 34,355$ 37,564$ 40,714$ 3.5%NM Median 22,971 23,852 24,334 1.2%
Source: UNM Office of A lumni Relations , NM Dept of Labor
UNM Bureau of Business and Economic Research, 2004
Note: all figures are in 2002 dollars and include only year-round workers ; CA G - compount annual growth
UNM Bureau of Business and Economic Research 18
Even though BAs and AAs start out just under the New Mexican median wage, their wages grow quickly. Alumni who have had their BAs for two years and those who have had their AAs for three years are above the median wage for all New Mexican workers. The bolded values in Table 2.7 indicate the median is below the median for all New Mexican workers. By the time alumni have had their degrees for five years, every group of alumni is well above the median annual wage for all New Mexican workers.
Figure 2.3 shows the change in the median annual wages as an index with the first year after graduation equal to 1.00. Appendix B has a similar table using average wage rather than median. As can be seen in Table 2.7, the PhD recipients have higher median annual wages than recipients of the BA. The BA degree-holders have the best growth rate of the group while the PhD is the most lackluster. This could be the nature of academia where starting salaries are high but tend to grow at a slower rate. In fact, 58% of PhDs who could be matched to an industry code were in the education industry compared with 14% for BAs.
Figure 2.2: Median Starting Wage of UNM Alumni by Degree, Year-round workers
0100002000030000400005000060000
AA BA BS MA MS PHD JD MBA AllUNM
NM
$200
2
MDs omitted due to incomparability.Source: NM Dept of Labor and UNM Office of Alumni RelationsUNM Bureau of Business and Economic Research, 2004
Table 2.7: Median Annual Wage - Year from Graduation, UNM AlumniOne Year Two Years Three Years Four Years Five Years
Associates 20,641$ 23,196$ 24,654$ 25,135$ 26,633$ Bachelor of Arts 23,073 27,124 28,898 31,106 32,976 Bachelor of Science 29,069 31,676 33,254 35,147 36,772 Master of Arts 32,170 33,421 33,940 35,428 36,308 Master of Science 45,986 49,548 51,139 53,332 53,225 Doctorate 46,013 47,234 48,474 49,941 49,434 Law 39,574 42,257 44,965 47,163 48,912 Master of Business Administration 51,146 53,685 55,080 57,364 57,670 Medical Doctor 34,755 36,230 42,326 79,664 108,211
NM Median in 2002 24,334$
Note: all figures are in 2002 dollars and include only year-round workers
Source: UNM Office of Alumni Relations, NM Dept of LaborUNM Bureau of Business and Economic Research, 2004

UNM Bureau of Business and Economic Research 19
Alumni Retention One of the most important things to consider when assessing a university’s impact is how many of the students who graduate stay in the state. The investment in an education yields little direct local economic impact if the graduate then moves out of state, although there are certainly other potential benefits to UNM and New Mexico from alumni who leave the state. Table 2.8 shows the retention rates for different degrees. The degree is the final degree the individual earned at UNM. The data are the percentage of degrees conferred in a particular year who have been identified by the UNM Office of Alumni Relations as residing in the state.
There is a pattern of departure apparent in the data for the Bachelor’s and the Master’s degrees. In 2003, only 43%, or 1,070, of the 2,487 graduates earning Bachelor’s degrees in 1993 remain in New Mexico. This reflects a drop-off from 73% of the class of 2002 who are still in New Mexico. This pattern is also evident and more dramatic for alumni with a Master’s degree (which includes the MBA). The latest Master’s recipients are mostly still in New Mexico but
Figure 2.3: Growth In Median Wage - UNM Alumni, Academic Year-round workers
1.0
1.1
1.2
1.3
1.4
1.5
1 2 3 4 5Year from Graduation
Yea
r 1
= 1
AA BA BS MA MS PHD
Source: NM Dept of Labor and UNM Office of Alumni RelationsUNM Bureau of Business and Economic Research, 2004
Year of Graduation Bachelors Mas ters Doctorate Profes s ional92-93 43% 46% 37% 56%93-94 42% 48% 35% 49%94-95 44% 44% 34% 53%95-96 46% 45% 24% 58%96-97 48% 47% 54% 45%97-98 47% 52% 34% 61%98-99 53% 52% 37% 64%99-00 56% 58% 39% 56%00-01 61% 52% 36% 67%01-02 73% 72% 39% 58%
Note: "M as ters " includes M BA degrees
Source: UNM Office of A lumni Relations , UNM Regis trar
UNM Bureau of Business and Economic Research, 2004
Table 2.8: Percentage of Graduates Living in New M exico as of 2002

UNM Bureau of Business and Economic Research 20
only half of those who graduated in 2000-2001 remain. The doctorate has the lowest rate of retention reflecting perhaps the national characteristics of the academic market. Doctors, lawyers and other professional degree recipients are the most likely to still be in New Mexico. There are several ways to interpret this pattern. One is that students have reasonable short-term job outlooks but after a few years, they look outside the state for opportunities. Another possible interpretation is that the state is doing a much better job retaining recent graduates and that the latest graduates have had better prospects in-state than the earlier graduates and hence more have stayed in NM. These competing interpretations suggest that the current data are insufficient to reach a definitive conclusion as to why the percent of UNM alumni that stay in state is increasing with recent graduates. Using these figures as a benchmark for future study will shed more light on the patterns.
Engineers, Nurses and Teachers Table 2.9 presents the retention of select undergraduate degrees that are important to the economic development of New Mexico. Investment in the education of engineers, teachers and nurses creates a positive economic climate and a healthy, educated workforce. The success of this investment is measured by how many UNM alumni in these fields stay in New Mexico upon graduation. The percentages shown in Table 2.9 are for graduates still living in New Mexico and not necessarily employed in the state.
Engineers have critical roles to play in New Mexico economic development efforts. Of interest, 55% of those receiving a Bachelor’s in Engineering over the past 10 years are still in the state. While it is too early to tell whether they will remain in the state, the retention rate for engineers has increased with each graduating class since academic year 1993 and was 82% for the latest class (2001-02). Teachers with an undergraduate degree from the College of Education are leaving the state, for a variety of reasons, in high numbers, with only 49% of those graduating in the past 10 years still in the state. The retention rate falls from 60% of teachers who graduated in 1992-93 to 43% for
Year of Graduation Eng ineering Education Nurs ing9 2 -9 3 39% 60% 61%9 3 -9 4 41% 52% 62%9 4 -9 5 43% 48% 61%9 5 -9 6 51% 43% 36%9 6 -9 7 53% 46% 73%9 7 -9 8 58% 47% 53%9 8 -9 9 59% 45% 71%9 9 -0 0 62% 49% 50%0 0 -0 1 76% 50% 66%0 1 -0 2 82% 54% 83%
So u rce : UNM Office o f A lu mn i Rela tio n s , UNM Reg is trar
UN M Bu rea u o f Bu sin ess a n d Eco n o mic Resea rch , 2 0 0 4
Table 2.9: Pe rce ntage of Graduate s Living in N e w M e xico as of 2002 - Se le ct Unde rgraduate D e gre e s

UNM Bureau of Business and Economic Research 21
those graduating in 1995-96. While it is too early to tell whether they will remain in the state, according to Alumni Office records, 50% of teachers from the class of 2000-01 and 54% of the class of 2001-02 are in New Mexico. A national nursing shortage has made the training of additional nurses a priority in New Mexico. Overall, the retention rate for those graduating from UNM undergraduate nursing program during the past 10 years is 59%. While it is too early to tell whether they will remain in the state, 66% and 83% respectively of the class of 2000-01 and 2001-02 are still in the state.
Conclusion It is clear from these tables and charts that UNM alumni typically do much better than the average New Mexican in terms of median wages. The degree determines the size of the difference. Professional degrees like the MBA, JD, and MD tend to have much higher starting wages than do academic degrees but do not necessarily exhibit higher growth rates from that starting point. Finally, there are noticeable patterns of retention for Bachelor and Master degree holders but there needs to be more research to reach conclusions. Since economic development depends on retention of UNM graduates, this question is important to answer. This study serves as a benchmark and future studies should give a clearer picture of the retention patterns.

UNM Bureau of Business and Economic Research 22
UNM’s Technology Commercialization In 1995, UNM created a subsidiary that streamlines the commercialization of technology and ideas that originate out of UNM’s primary role as a research institution. The Science and Technology Corporation (STC) is the vehicle for moving products and processes from the inventors at UNM to the marketplace. STC does this by managing the patent process from disclosure to issue, marketing the technology to industry both in and out of New Mexico and licensing or spinning-off the technology to generate income for the inventor and UNM. Averaging 14 patents issued per year, STC has helped disseminate the knowledge of UNM faculty, staff and students. As of FY03, STC is responsible for eleven start-up companies over the years and has equity in seven companies. Table 3.1 shows STC’s history.
Table 3.2 shows the rankings of peer institutions and UNM’s STC with regard to age, income, expenditure and staff. UNM started STC in 1995 making it the youngest technology transfer entity amongst peer institutions. The University of Utah is the oldest dating back to 1968. In terms of research expenditure, UNM spent $156.6 million on research activity in FY2001, just over 70% of the average of $218.1 million and one-fourth the amount the University of Washington spends on research activity. Given the age and the size of research expenditures, STC has done remarkably well in licensing, start-ups, patents and other metrics used to compare technology transfer institutions. Table 3.3 shows how UNM (through STC) ranks amongst its peers in FY2001. UNM is 4th in terms of start-ups, 8th in terms of disclosures and 9th in terms of issued patents. In other words, with a smaller level of research expenditure and a steeper learning curve, UNM is right in the middle of the rankings in terms of commercialization activity.
Table 3.1: STC Activity since 1996
1996 1997 1998 1999 2000 2001 2002 2003 Total
Disclosures 33 45 45 47 35 54 49 46 44 354New U.S . patent applications filed 23 37 38 53 45 23 44 22 36 285
Issued patents 7 16 13 15 15 16 12 21 14 115Option agreements /licenses s igned 2 7 3 3 3 5 4 9 5 36Start-up companies licensed based on UNM technology 0 0 1 2 3 3 1 1 1 11Equity acquis itions in companies (first time) 0 0 1 0 2 2 1 1 1 7
Source: UNM Science and Technology Corporation
UNM Bureau of Business and Economic Research, 2004
Average

UNM Bureau of Business and Economic Research 23
Table 3.2: UNM' STC Compared To Peers - Age, Expenditures, Staff and Incom
School
Age of Tech Transfer
Entity
University Research
Expenditures$Millions
Staff of Tech
transfer Entity
Tech Transfer IncomeRank
University of Washington (Seattle) 1983 622.1 19 1University of Colorado (Boulder) 1993 367.7 3 5University of Arizona (Tucson) 1988 367.1 9 7University of Texas (Austin) 1988 321.6 9 5University of Iowa (Iowa City) 1975 255.3 9 3University of Missouri (Columbia) 1987 245.1 10 4University of Utah (Salt Lake City) 1968 242.3 20 4University of Virginia (Charlottesville) 1977 224.7 13 2University of Kansas (Lawrence) 1994 224.0 5 7University of Tennessee (Knoxville) 1983 182.0 10 6University of New Mexico (STC) 1995 156.6 10.5 11University of Kentucky (Lexington) 1984 108.9 4 6University of South Carolina (Columbia) n.a. 106.4 17 8University of Oklahoma (Norman) 1984 93.1 8 10University of Arkansas (Fayetteville) 1990 76.5 9 9University of Oregon (Eugene) 1992 66.4 4 8University of Nebraska (Lincoln) 1992 48.3 6 11
Average 1986 218.1 10
Source: Association of University Technology Managers, 2003UNM Bureau of Business and Economic Research, 2004

UNM Bureau of Business and Economic Research 24
Table 3.3: UNM Compared To Peers - Technology Transfer Indicators
School DisclosuresIssued Patents Signed
Yielding Income Start-ups
University of Arizona (Tucson) 4 11 6 6 4University of Arkansas (Fayetteville) 12 10 8 10 6University of Colorado (Boulder) 6 4 7 4 4University of Iowa (Iowa City) 7 3 5 2 7University of Kansas (Lawrence) 10 13 11 8 3University of Kentucky (Lexington) 7 7 8 13 4University of Missouri (Columbia) 9 10 7 12 7University of Nebraska (Lincoln) 14 14 13 15 7University of New Mexico (STC) 8 9 11 14 4University of Oklahoma (Norman) 11 5 12 12 6University of Oregon (Eugene) 13 12 10 11 7University of South Carolina (Columbia) 9 14 9 12 5University of Tennessee (Knoxville) 10 7 8 7 6University of Texas (Austin) 5 8 4 9 1University of Utah (Salt Lake City) 1 2 3 3 4University of Virginia (Charlottesville) 3 6 2 5 2University of Washington (Seattle) 2 1 1 1 3
Source: Association of University Technology Managers, 2003UNM Bureau of Business and Economic Research, 2004
Options/Licenses
UNM Bureau of Business and Economic Research 25
Fiscal Year 2003 %Main Campus
Tuition/Fees $56,741,574 12.0% 12.2% $6,916,014State and Local 183,346,610 38.9% 0.0% - Federal 96,939,344 20.5% 100.0% 96,939,344 Sales/Service 65,126,667 13.8% 17.4% 11,304,303 Gifts 12,989,939 2.8% 28.7% 3,730,946 Contracts/Grants 15,830,435 3.4% 44.1% 6,975,056 Other 40,879,606 8.7% 33.0% 13,490,270 Total $471,854,175 41.0% 29.5% $139,355,934
Branch CampusesTuition/Fees $5,712,181 14.7% 12.2% $696,236State and Local 18,410,605 47.4% 0.0% - Federal 5,357,054 13.8% 100.0% 5,357,054 Sales/Service 2,743,342 7.1% 17.4% 476,173 Gifts - 0.0% 28.7% - Contracts/Grants 348,809 0.9% 44.1% 153,689 Other 6,306,100 16.2% 33.0% 2,081,013 Total $38,878,091 3.4% 22.5% $8,764,165
UNM - Health Sciences Center2
Tuition/Fees $2,969,566 1.0% 4.4% $129,891State and Local 66,494,015 23.1% 0.0% - Federal 80,324,598 27.9% 100.0% 80,324,598 Sales/Service 106,190,205 36.9% 25.8% 27,363,154 Gifts 10,318,818 3.6% 21.1% 2,178,639 Contracts/Grants 20,883,950 7.3% 44.1% 9,201,688 Other 618,678 0.2% 33.0% 204,164 Total $287,799,830 25.0% 41.5% $119,402,133
UNM Hospitals3
State and Local 71,230,657 20.2% 0.0% - Sales/Service 15,576,504 4.4% 10.0% 1,557,650 Patient Revenue4 261,347,224 74.2% 72.0% 188,170,187 Other 4,081,010 1.2% 100.0% 4,081,010 Total $352,235,395 30.6% 55.0% $193,808,847
Grand Total $1,150,767,491 100.0% 40.1% $461,331,0791 Bond financing not included in revenue2 Includes School of Medicine, College of Nursing, College of Pharmacy3 Part of overall HSC and includes Carrie Tingley Hospital, Children's Hospital and University Psychiatric Center4 "Patient Revenue" includes Medicare & Medicaid and do not show up in "Federal"
Source: UNM Foundation, UNM Health Sciences Center, UNM ControllerUNM Bureau of Business and Economic Research, 2004
$ Millions % $ Millions
% Non-New Mexico
Direct RevenuesTotal Revenues1
Appendix A – Revenue Distribution by Site

UNM Bureau of Business and Economic Research 26
Appendix B – Average Wages For UNM Alumni This study has used the median annual wages of year-round workers, those workers who had wages in each of four quarters in a given year, for the majority of the tables and charts. Since other publications have used average rather than median, two tables corresponding to Figure 2.2 and Figure 2.3 respectively are presented here with the average annual wage rather than the median. In all cases, the average is above the median due to distortion of the distribution caused by relatively few high-wage records. For this reason, the median is a better tool to use when discussing wage distributions.
Figure B.1: Average Starting Wage of UNM Alumni by Degree, Year-round workers
-10,00020,00030,00040,00050,00060,000
$200
2
S tarting Salary $22,766 $24,645 $32,452 $33,372 $48,192 $47,798 $40,533 $57,734 $32,470 $31,171
AA BA BS MA MS PHD JD MBA All NM
MDs omitted due to incomparability.Source: NM Dept of Labor and UNM Office of Alumni RelationsUNM Bureau of Business and Economic Research, 2004
Figure B.2: Growth In Average Wage - UNM Alumni, Academic Year-round workers
1.01.11.21.31.41.5
1 2 3 4 5
Year from Graduation
Yea
r 1
= 1
AA BA BS MA MS PHD
Source: NM Dept of Labor and UNM Office of Alumni RelationsUNM Bureau of Business and Economic Research, 2004

UNM Bureau of Business and Economic Research 27
Appendix C - Bibliography ______. “The Economic Impact of James Madison University on the Harrisonburg/Rockingham
County Area and the Commonwealth of Virginia.” James Madison University, Office of Institutional Research, 1995.
Beck, Roger, Elliott, Donald, Meisel, John and Wagner, Michael. “Economic Impact Studies of
Regional Public Colleges and Universities.” Growth and Change, volume 26, Spring 1995.
Bluestone, Barry. UMass/Boston: An Economic Impact Analysis. University of Massachusetts
at Boston, John W McCormack Institute of Public Affairs, January 1993. Booth, G. Geoffrey and Jarrett, Jeffrey E. “The Identification and Estimation of a University’s
Economic Impacts.” Journal of Higher Education, volume 47 no 5, Sep-Oct 1976. Brown, Kenneth H. and Heaney, Michael T. “A Note on Measuring the Economic Impact of
Institutions of Higher Education.” Research in Higher Education, volume 38 no 2, 1997. Duhart, Sharon. “The Economic Impact of University System of Georgia Institutions on Their
Regional Economies.” University of Georgia Board of Regents, March 2002. Feldman, Maryann and Desrochers, Pierre. “Research Universities and Local Economic
Development: Lessons from the History of Johns Hopkins University.” Industry and Innovation, volume 10 no 1, March 2003.
Hill, Jeremy Ryan. “The Economic Impact of Georgia Southern University.” Georgia Southern
University Bureau of Business Research and Economic Development, August 2003. Hill, Kent. “The Economic Impact of Arizona State University.” Arizona State University
Center for Business Research, December 1999.

UNM Bureau of Business and Economic Research 28
Appendix D - Comparison of Previous Studies
2000 UNM Impact Study and Current Study In 2000, BBER undertook a similar study of the impact of UNM on New Mexico’s economy. The methodology between the two studies was different which lead to different results. Table D.1 shows the differences in methodology. The main divergence was the use of Implan Pro 2.0. This application was used in the current study for (a) calculating the indirect effects, allocating expenditures to industries in and out of New Mexico, and (b) calculating the induced effects which measure the impact of spending by employees of UNM and UNM’s suppliers. Table D.1: Differences in Methodology between 2000 Study and Current Study Methodology 2000 Study Current Study Retirees Included Excluded Employment Full Time Equivalents Jobs, with weights for part time and
students Revenue source Survey Survey Expenditure destination Survey Implan Industry allocation Survey Implan Indirect effects Industry Analysis Implan
Induced effects FOR-UNM model Implan
The previous study allocated the spending in broader industry categories (9 categories) and used average wages in those industries to determine the compensation and employment effects (Output was not calculated in the previous study). Implan allocated spending amongst 353 separate industries. This refinement calculated lower indirect effects. Spending by the employees of UNM and UNM’s suppliers create the induced effects. The previous report used FOR-UNM, BBER’s economic forecasting model, to analyze these effects whereas the current report uses Implan’s household spending patterns. Similar to the industry allocation methods, this is a matter of refinement. Implan, using data from the BLS Consumer Expenditure Survey and other sources, can finely allocate the expenditures and the in-state portions for the household sector. This can lead to lower overall induced effects.8 The combination of the smaller indirect effect and smaller induced effects caused the multipliers to be smaller and hence the overall impact of UNM on the state. Table D.2 shows the differences between the reports.
8 It should be noted that BBER has made significant changes in the FOR-UNM model as required by the federal agency adoption of the North American Industry Classification System (NAICS). The model now provides more detail in the services sector. Preliminary runs using that model suggest that finer categories of spending may yield lower multipliers.

UNM Bureau of Business and Economic Research 29
Table D.2: Differences in Multipliers between 2000 Study and Current Study Multiplier 2000 Study Current Study Output multiplier n.a. 1.67 Salary multiplier 1.70 1.34 Employment multiplier 1.93 1.60
2003 Health Sciences Center Study and the Current Study BBER completed a study of the Health Sciences Center’s impact on New Mexico’s economy in January of 2003 similar to the current study. Both studies used Implan Pro 2.0 as the method for analyzing the indirect and induced impacts. The out-of-state revenue percentage was almost identical. The only major difference between the studies was accounting for the leakage of expenditures out of New Mexico. The previous study erroneously did not account for this leakage, which made the total impact larger than that of the current study. This was an unintended result from a failure to change a default setting in the Implan model. Table D.3 shows the results of each study. The last column of Table D.3 shows what the results would have been if the out-of-state spending share was identical to that calculated in the current study. Table D.3: Comparison of 2003 HSC Study and Current Study
2003 HSC Study Current Study
HSC2003 using UNM2003 Instate
spending Out-of-state revenue 299.6 313.2 49.1 48.9 In-state spending 318.8 243.3 234.00
100 73.4 Output multiplier 1.59 1.70 Salary multiplier 1.32 1.31 Employment multiplier 1.66 1.67 Total Impact – Output 508.5 413.1 372.06 Total Impact – Jobs 6821.0 5778.0 5007.0 Total Impact – Salaries 251.4 228.9 184.5