the economics of sustainable energy for rural development: a study of renewable energy in rural...
TRANSCRIPT

E L S E V I E R PI I:S0301-4215 (97)00099-2
Energy Poli¢y, Vol. 26, No. 1, pp. 45-54, 1998 © 1997 Elsevier Science Ltd
Printed in Great Britain. All rights reserved 0301-4215198 $I9.00 + 0.00
The economics of sustainable energy for rural development: A study of renewable energy in rural China
John Byrne, Bo Shen and William Wallace Center for Energy and Environmental Policy, University of Delaware, Newark, DE 19716, USA National Renewable Energy Laboratory, 1617 Cole Boulevard, Golden, CO 80401, USA
This paper examines recent modeling efforts and case studies to evaluate the economic viability of off- grid renewable energy technologies for rural application in developing countries. Case studies have been conducted for a representative sample of 41 households from the Inner Mongolia Autonomous Region of China, who have operating experience of at least one year with small, off-grid wind (less than 400 W) and photovoltaic (less than 150 Wp) systems. Our analyses indicate that levelized costs of off-grid, household- scale renewable energy systems are cost-competitive with conventional gasoline gen-sets and PVIwind hybrid systems appear to be an economic means of providing year-round electricity service and meeting the rising energy demands of remote households in Inner Mongolia. Policy recommendations for spurring the market development of renewable energy technologies in developing countries are provided in the final section of the paper. © 1997 Elsevier Science Ltd. All rights reserved. Keywords. Renewable energy; Rural energy policy; Economics of renewable energy; Sustainable development
Developing countries have dramatically expanded their power sectors during the last three decades. However, more than 2 billion people living in rural areas still lack the option of grid-based electricity service. Given the high cost of grid extension to utilities throughout the developing world, progress in expanding electricity service to unserved rural areas remains slower than population growth (Lenssen, 1993). Off-grid renewable energy systems represent an important option for narrowing the electricity gap in rural parts of the developing world.
To be successful, rural renewable energy systems will have to compete with small-scale generator sets fueled by gasoline or diesel which have often been used to supply electricity to remote households. The use of gen-sets by rural households has, to a great extent, been limited by the high costs of delivered fuel and maintenance, and the lack of reliable spare parts supply to remote areas. As alternatives, stand- alone renewable energy home systems such as photovoltaic (PV), wind, and PV/wind hybrid technology can meet the growing electricity needs of rural households. Studies of off-grid renewable energy systems in developing countries have shown that these technologies can provide reliable and comparatively low cost electricity services to rural households and communities (Byrne et al., 1997; Cabraal et al., 1996; Hammad, 1995; Liebenthal et al., 1994). The supply of electric-
ity from such systems brings tangible social and economic benefits to rural populations in developing countries that include the ability to refrigerate food and medicine, lighting for households, power for small electric motors (such as water pumps), and provision of education and communica- tion opportunities for isolated rural populations (Acker and Kammen, 1996; Byrne et al., 1997; Cabraal et al., 1996). In addition, wind and PV systems offer an environmentally sustainable means of supporting rural economic: develop- ment (Lenssen, 1993).
This paper summarizes our analysis of small-scale renew- able energy systems supplying electricity to a representative sample of 41 households in the Inner Mongolia Autonomous Region of China.~ It examines the economics of small-scale PV (60 Wp to 120 Wp), wind (100 W to 300 W) and PV/wind hybrid systems (300 W wind turbine with 35 Wp-60 Wp PV for small hybrids and 100 Wp-120 Wp PV for large hybrids) for the region's remote herder families. A newly developed spreadsheet model used for this analysis is introduced. Our evaluation of energy performance and system reliability of
~The 41 household sample was drawn in co-operation with a research team of scientists, and energy and social planners from the Chinese Academy of Sciences, the provincial government of Inner Mongolia. and Inner Mongolia University. Selection was based on criteria of geographic and socioeconomic representativeness of" the Region.

46 The economics of sustainable energy for rural development: J Byrne et al
J f J J f J J f f J J f J f J J J J J J J f f J J
~ J J J J J J J J J J J
Charge Controller
+
Battery
DC/AC Inverter I
\ I /
/ I \
Figure 1 Conceptual drawing of a household-scale hybrid renewable energy system
household-scale renewable energy systems and calculations of the levelized costs for these household systems are discussed. The paper concludes with policy recommendations for spur- ring market development of small-scale, off-grid renewable energy technologies in developing countries.
The economics of household-scale renewable energy systems
Typical stand-alone, household-scale renewable energy systems include photovoltaic (PV) and small wind turbine systems. Less common, but of increased interest, are small-scale PV/wind hybrid systems. The major components of a stand- alone household renewable energy system are an energy conver- sion device (a small PV array or a wind turbine) with necessary support structures and the balance-of-system (BOS) components. The BOS includes a battery bank to store energy, a charge controller to prevent overcharging of the battery and an inverter to convert direct current (DC) to alternating current (AC). 2 A hybrid system has both a PV array and a wind turbine, as well as the other components just described. A stand-alone PV/wind hybrid household system design is illustrated in Figure 1.
Economic modeling of off-grid renewable energy systems
To evaluate the energy and economic pe r fo rmance of three renewable energy technologies - photovol ta ics (PV), wind turbine, and PV/wind hybrids - for off-grid applications in rural settings, we developed a spreadsheet- based compu te r model called Rural Renewable Energy
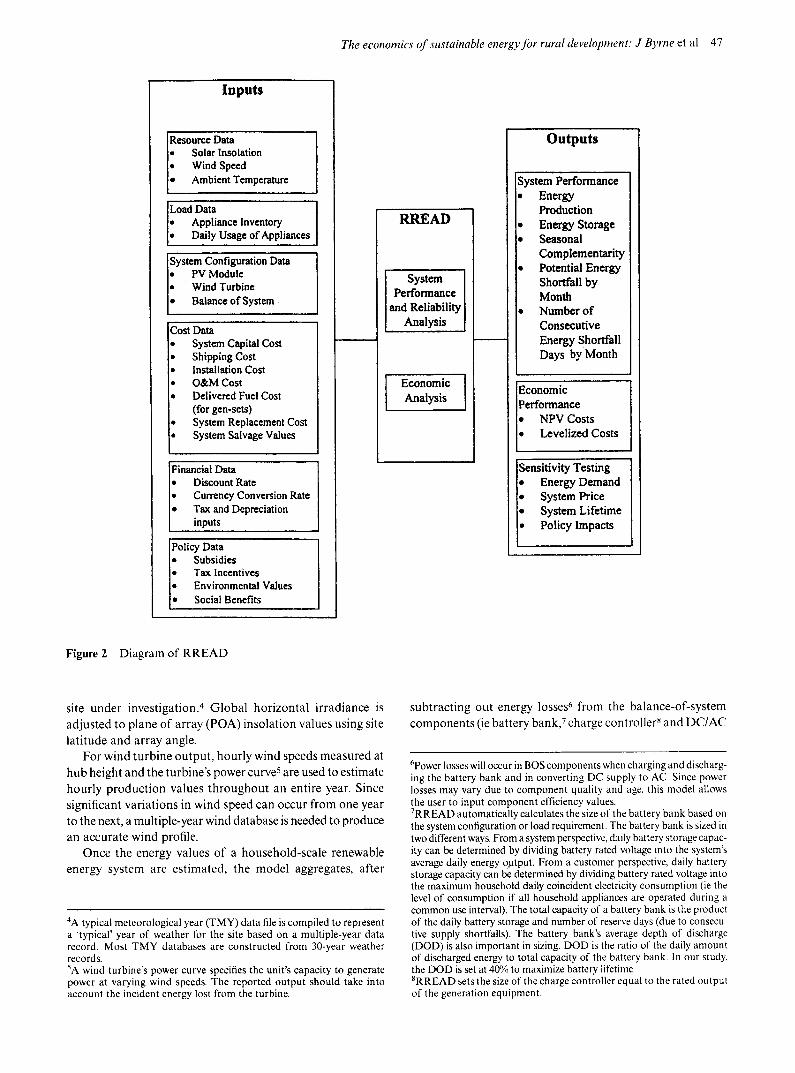
Analysis and Design ( R R E A D ) . The model consists of three modules: a data input module, a calculation engine and an output module (see Figure 2). R R E A D proc- esses resource, economic and financial data, in combina- t ion with inputs on technology configurat ions and relevant policy factors, to provide the user with an analysis of the energy ou tpu t and economic value of user-specified renewable energy applications.
The data input module consists of six sets of data: a renewable energy resource profile, household load data, techni- cal specification of system configuration, system costs, financial data and policy scenario information) The resource, load and system configuration data are used to evaluate system performance and energy output, and to conduct analyses of the reliability of power supply for the user-defined system. Economic, financial and policy data are used to evaluate the economic viability of the system.
System performance and reliability analysis
To determine the amount of electricity available for household or village daily use, RREAD estimates hourly energy output of a PV array and/or wind turbine for an entire year. For PV output, global horizontal irradiance (a measure of solar energy in watts per square meter), DC conversion efficiency of a PV array, the size of the array, and ambient temperatures are used in an algorithm found within the model to estimate hourly production values during a year. A site's hourly global horizontal irradiance and ambient temperature can be obtained from a typical meteorological year (TMY) data file of the
2Although it is not necessary to include an inverter, the prevalence of AC-powered appliances and lighting make this the most practical system configuration.
3For example, the existence of taxes, credits, or subsidies to capture social and environmental externalities of electricity supply that are otherwise not reflected in fuel and technology prices.
The economics of susta&able energy for rural development." J Byrne et al 47
Inputs
Resource Data • Solar Insolation • Wind Speed • Ambient Temperature
Load Data • Appliance Inventory • Daily Usage of Appliances
I System Configuration Data • PV Module • Wind Turbine • Balance of System
Cost Data System Capital Cost Shipping Cost Installation Cost O&M Cost Delivered Fuel Cost (for gen-sets) System Replacement Cost System Salvage Values
Financial Data • Discount Rate • Currency Conversion Rate
l• Tax and Depreciation [ inputs
Policy Data • Subsidies • Tax Incentives • Environmental Values • Social Benefits
RREAD
System I Performance [
and Reliability I Analysis [
I Economic Analysis [
Outputs
System Performance Energy Production Energy Storage Seasonal Complementarity Potential Energy Shortfall by Month Number o f Consecutive Energy Shortfall Days by Month
Economic Performance
[, NPVCos ts
I o evelized Costs
Sensitivity Testing • Energy Demand * System Price • System Lifetime * Policy Impacts
Figure 2 Diagram of R R E A D
site under investigation. 4 Globa l hor izonta l i r radiance is
adjus ted to plane o f array (POA) insolat ion values using site
lat i tude and array angle.
For wind turbine output , hour ly wind speeds measured at
hub height and the turbine's power curve s are used to est imate
hour ly p roduc t ion values t h roughou t an entire year. Since
significant var ia t ions in wind speed can occur f rom one year
to the next, a multiple-year wind database is needed to produce
an accurate wind profile.
Once the energy values o f a household-scale renewable
energy system are est imated, the mode l aggregates, after
4A typical meteorological year (TMY) data file is compiled to represent a 'typical' year of weather lbr the site based on a multiple-year data record. Most TMY databases are constructed from 30-year weather records. 5A wind turbine's power curve specifies the unit's capacity to generate power at varying wind speeds. The reported output should take into account the incident energy lost from the turbine.
subtract ing out energy losses 6 f rom the balance-of-system
componen t s (ie bat tery bank, 7 charge control ler s and D C / A C
6power losses will occur in BOS components when charging and discharg- ing the battery bank and in converting DC supply to AC. Since power losses may vary due to component quality and age, this model allows the user to input component efficiency values. 7RREAD automatically calculates the size of the battery bank based on the system configuration or load requirement. The battery bank is sized in two different ways. From a system perspective, daily battery storage capac- ity can be determined by dividing battery rated voltage into the system's average daily energy output. From a customer perspective, daily battery storage capacity can be determined by dividing battery rated voltage into the maximum household daily coincident electricity consumption (ie the level of consumption if all household appliances are operated during a common use interval). The total capacity of a battery bank is the product of the daily battery storage and number of reserve days (due to consecu- tive supply shortfalls). The battery bank's average depth of discharge (DOD) is also important in sizing. DOD is the ratio of the daily amount of discharged energy to total capacity of the battery bank. In our study, the DOD is set at 40% to maximize battery lifetime. 8RREAD sets the size of the charge controller equal to the rated output of the generation equipment.

48 The economics of sustainable energy for rural development: J Byrne et al
inverter9), the hourly energy production to an annual value. Annual energy production is used to calculate levelized costs of energy supply (described below). ~o
Economic analysis
System performance results are utilized in this model, in conjunction with financial, economic and policy data, to conduct levelized cost and other economic analyses for dif- ferent system configurations. The model estimates costs incurred over the span of the evaluation period for renew- able energy systems and competing technologies such as gasoline or diesel generators. Discounted cost streams, combined with energy values, are used to calculate levelized costs in order to compare various energy options.
To perform a levelized cost analysis, all capital and operat- ing expenditures incurred over the span of the evaluation period must be taken into account. The expenditure stream includes generation equipment costs, BOS component costs, and annual operating and maintenance (O&M) expenses. Generation equipment costs include hardware costs and cost for delivery and installation of the PV array, wind turbine, hybrid or gen-set. The BOS component costs reflect the costs o f purchasing, delivering and installing the power condition- ing systems. Both generation equipment and BOS component cost streams include initial and replacement costs. Since some hardware may still have usable value beyond the evalu- ation period, this model employs a straight line depreciation method to credit the system for the remaining useful life of equipment. Hardware scrap values at the end of each piece of equipment's useful lifetime are also taken into account. The O&M expenses cover regular service, maintenance and repair costs (eg lubrication and bushing repairs are included for gen-sets and array surface washing and electrical connec- tion inspection are included for PV systems). For gen-sets, delivered fuel costs must also be included. These are based on fuel prices in the local market and the average cost per unit of delivered fuel to the site.
After the spreadsheet model estimates all expenditures, it discounts them to their present values over the evaluation period and sums all discounted costs to arrive at a net present value (NPV). The total NPV cost, the length (in years) of the evaluation period, and the discount rate are used to obtain a levelized cost which is then divided by an annual energy value to obtain a levelized unit (kWh) cost. In this model, the annual energy value is determined in two ways. Using a supply or production perspective, R R E A D sets the annual energy value equal to the system net production (ie net of losses due to storage, power conversion, etc.). For a renew-
9The size of the DC/AC inverter can be set equal to the rated output of a household's total appliance stock (a demand perspective), or to the rated output of the generation equipment (a supply perspective). I°RREAD stores monthly values which can be used to evaluate a system's seasonal performance, and daily values which can be used to evaluate the system's ability to meet household or village daily energy needs on a reliable basis. RREAD can calculate the number of 'shortfall days' in each month for different system configurations. Shortfall days are those days when the available solar and/or wind resource, plus the energy delivered from the battery bank, are not sufficient to meet household or village peak load demand.
able energy system, this largely depends on the availability and energy density of the resource. For gen-sets, the major determinant is operating hours. A second approach adopts a demand or end-use perspective in which annual energy value equals actual household energy consumption. This consumption is determined from appliance inventories and household reports of average daily use. However, since resource availability establishes a cap on household consumption level in the case of renewable energy technologies, system net production is used as the annual energy value if potential household demand exceeds the generation capacity of the system.
Sensitivity analysis
R R E A D can conduct sensitivity studies that allow the user to examine the impacts of technical, economic and policy changes on the performance of off-grid renewable energy systems. Reliability of a system can be tested by adjusting household demand levels. Change in the system's levelized costs can be reviewed when system prices, subsidy levels and system configurations change. The economics of a renew- able energy system can be compared to those of a gen-set when changes in fuel costs and operating schedule are introduced. Comparisons can also be made between renew- able energy technologies and gen-sets when continuous duty cycle equipment (such as refrigerators and pumps) must be served. 1
The user can employ R R E A D to evaluate changes in existing or new policy strategies (energy, tax, financial, environmental and other policies). Advances in the efficiency of technology used in off-grid systems can be considered as well.
This spreadsheet model was employed to prepare a series of comparative cost studies for various household systems operating in China's Inner Mongolia Autonomous Region (IMAR). In subsequent sections of the paper, we summarize energy supply and economic analyses performed for the Region's installed household renewable energy systems. However, before reporting the results of our analyses, some basic information on the I M A R is provided.
Profile of the Inner Mongolia autonomous region
The I M A R is one of five minori ty jurisdictions with autonomous administrative authority in China. It is located in the northern part of the country, sharing a border with the Republic of Mongolia. The I M A R encompasses 1.18 million km 2 and accounts for one-eighth of the total area of China. Three-quarters of the Region's territory is grassland.
tlTo serve continuous duty cycle equipment (such as refrigerators), gen-sets can be run continuously on a 24-hour-a-day basis. It is, however, more practical and efficient lbr a gen-set to provide the energy required by such equipment through a battery bank. A charge controller and DC/AC inverter need to be installed if a battery bank is used. RREAD can calculate both cases for gen-sets: serving or not serving continuous duty cycle equipment.

The economics of sustainable energy for rural development. J Byrne et al 49
Its population is approximately 22.5 million and 63 percent live in rural areas. The per capita annual net income of the Region is ¥2000 (about $241 at current exchange rates), n with the rural population averaging ¥970 ($117). While per capita income is modest, the earnings of rural I M A R households are among the highest in the nation's 10 underdeveloped provinces (China State Statistical Bureau, 1995). The average population density in the Region is 19 persons km -2, one of the lowest densities in China. In the Region's vast pastoral areas, the density is less than three persons km -2 (Li, 1991). Due to the high cost of extending the electrical grid to remote herder families of the IMAR, there are still 300,000 households in 1100 villages and 198 townships without electricity today.
According to researchers at the Chinese Academy of Meteorological Science (CAMS), both wind and solar resources in the I M A R are some of the richest in China (Zhu, 1988; see also He and Shi, 1995 and Yan, 1994). The CAMS study divides different regions throughout China into three resource potential categories: rich, marginal and poor. Based on CAMS definition, resources are rich in those areas with 150 W m 2 of wind energy densi ty and 1510 kWh m -2 of annual solar insolation. Both wind and solar resources in the IMAR, despite large variation across the Region, are rich using the CAMS definition?3
Development of the Region's abundant wind and solar resources began in earnest in the late 1970s. Since then, remarkable progress has been made. With financial incen- tives from the Region's government,14 over 120,000 household- scale wind turbines and 3800 PV systems with a total capacity of 11.2 MW and 100 kWp, respectively, have been installed. By the end of 1995, about a half million herdsmen received electricity from one or both of these renewable energy sources (People's Daily, 1996, Oversea Edition, Oct 28). This makes the I M A R one of the largest rural users of wind and PV systems in the world.
The development of renewable energy in Inner Mongolia has helped the Region to build up a relatively complete manufacturing capacity from design to production, installa- tion and maintenance of wind and PV home systems. To date, there are ten wind turbine manufacturers and one PV assembly line operating in Inner Mongolia. Local service stations, as well as technical support and training sites, have spread out to over 60 of the Region's 88 counties (China Electric Power, 1996). This well-established infrastructure,
1.8
1.6 0
. 4
"~ 1.4
e~
© -~ 0.8
c
0.6
>~ 0.4
0.2
Figure 3
PV
:H - e -
. ~ Wind Z
PV/wind output ratios by month for Su Ni Te You
coupled with abundant wind and solar resources, has laid a solid foundation for development of a large scale renewable energy market in Inner Mongolia.
Case studies
Four counties of the IMAR were chosen in consultation with the Chinese Academy of Sciences, the Region's New Energy Office and the I M A R Planning Commission, as sites for our case studies. The four counties, located in the central and northern parts of Inner Mongolia, are Su Ni Te You, Si Zi Wang, A Ba Ga and Dong Wu Zhu Mu Qin.
Resource evaluation
Su Ni Te You has the best combined solar and wind resource ~5 among the four counties. Si Zi Wang has the best measured solar resource and second best wind resource. A Ba Ga has significant solar insolation and a good but variable wind resource. Dong Wu Zhu Wu Qin has modest solar and wind resources, compared to the other three counties.
The four counties under evaluation not only have attrac- tive solar and wind resources, the availability of the two resources exhibits significant complementarity. Strong winds experienced in the spring and autumn months diminish while solar radiation is most intense during the summer. Figure 3 depicts the seasonal complementarity of solar and wind resources in Su Ni Te You.16 The seasonal complementarity of PV and wind systems indicates that a PV/wind hybrid system can offer stable energy service throughout the entire year.
12The exchange rate used Ibr this paper is: $1.00 (US)=¥8.30 (Chinese Yuan). ISThe Region is undeniably rich in solar and wind resources, but varia- tions in both are significant enough that local assessments are essential to good project designs. Thus, the Inner Mongolia New Energy Office reports that wind energy density in the IMAR ranges from 100 W m -z in the southern part of the Region to 300 W m -2 in the north. The Region's annual solar insolation is reported to be between 1400- 1740 kWh m -2 (Inner Mongolia New Energy Office, 1995). ~aBetween 1986 and 1990, the IMAR Government provided 16 million Chinese Yuan (about $2 million) in subsidies to promote the Region's use of household renewable energy systems. While data for recent years were not available, officials of the IMAR indicated that approximately the same level of subsidy continues to be provided.
Levelized cost analysis"
Levelized cost analyses were performed for existing household- scale renewable energy systems used by 41 herder families located in the four counties. There are five sizes of PV systems under evaluation: 60 Wp, 75 Wp, 85 Wp, 100 Wp and 120 Wp.
~SHourly solar and wind resource profiles were obtained from the IMAR Government for each county. 16A 200 W wind system and a 300 W PV system are used to conduct this output ratio analysis because these two systems provide equivalent annual energy service in this particular county,
50 The economics of sustainable energy for rural development: J Byrne et al
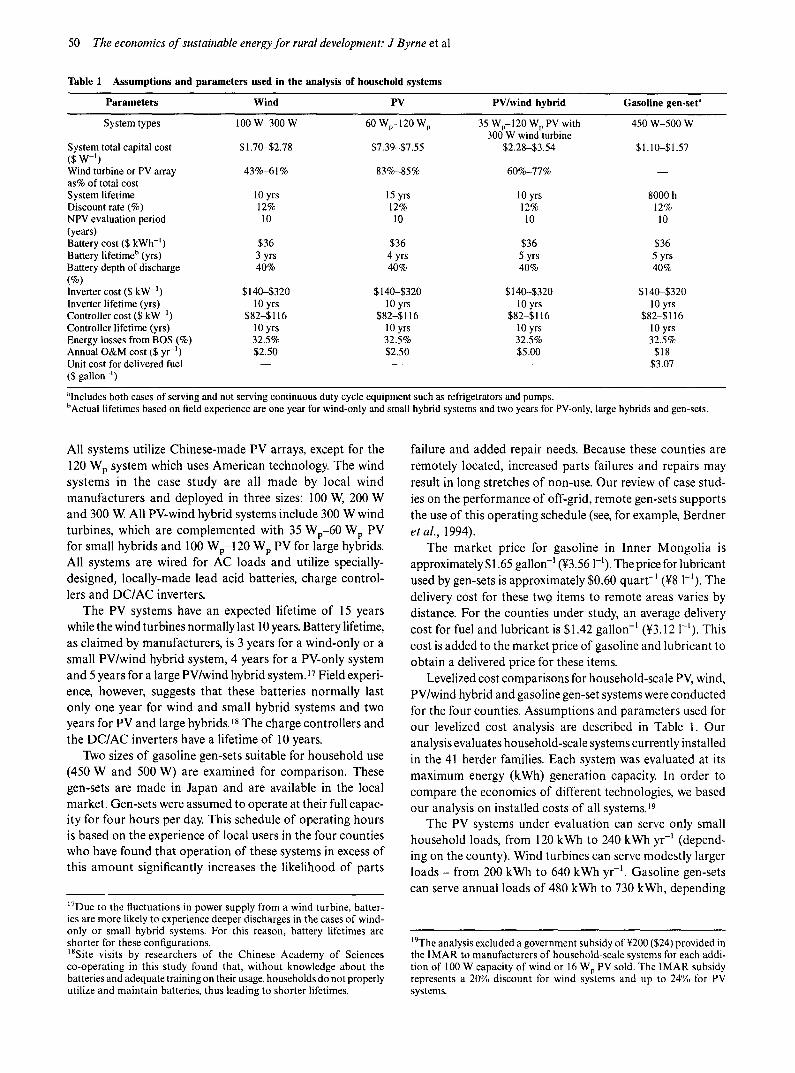
Table 1 Assumptions and parameters used in the analysis of household systems
Parameters Wind PV PV/wind hybrid Gasoline gen-set a
System types 100 W-300 W 60 Wp-120 Wp 35 Wp-120 Wp PV with 450 W-500 W 300 W wind turbine
System total capital cost $1.70-$2.78 $7.39-$7.55 $2.28-$3.54 $1.10-$1.57 ($ w -l) Wind turbine or PV array 43%~1% 83%-85% 60%-77% - - as% of total cost System lifetime 10 yrs 15 yrs 10 yrs 8000 h Discount rate (%) 12% 12% 12% 12% NPV evaluation period 10 10 10 10 (years) Battery cost ($ kWh -t) $36 $36 $36 $36 Battery lifetime b (yrs) 3 yrs 4 yrs 5 yrs 5 yrs Battery depth of discharge 40% 40% 40% 40% (%) Inverter cost ($ kW-I) $140-$320 $140-$320 $140-$320 $140-$320 Inverter lifetime (yrs) 10 yrs 10 yrs 10 yrs 10 yrs Controller cost ($ kW-l) $82-$116 $82-$116 $82-$116 $ 82-$116 Controller lifetime (yrs) 10 yrs 10 yrs 10 yrs 10 yrs Energy losses from BOS (%) 32.5% 32.5% 32.5% 32.5% Annual O&M cost ($ yr -1) $2.50 $2.50 $5.00 $18 Unit cost for delivered fuel - - - - - - $3.07 ($ gallon -l)
~Includes both cases of serving and not serving continuous duty cycle equipment such as refrigetrators and pumps. bActual lifetimes based on field experience are one year for wind-only and small hybrid systems and two years for PV-only, large hybrids and gen-sets.
All systems utilize Chinese-made PV arrays, except for the 120 Wp system which uses American technology. The wind systems in the case s tudy are all made by local wind manufacturers and deployed in three sizes: 100 W, 200 W and 300 W. All PV-wind hybrid systems include 300 W wind turbines, which are complemented with 35 Wp-60 Wp PV for small hybrids and 100 Wp-120 Wp PV for large hybrids. All systems are wired for AC loads and utilize specially- designed, locally-made lead acid batteries, charge control- lers and DC/AC inverters.
The PV systems have an expected lifetime of 15 years while the wind turbines normally last 10 years. Battery lifetime, as claimed by manufacturers, is 3 years for a wind-only or a small PV/wind hybrid system, 4 years for a PV-only system and 5 years for a large PV/wind hybrid system. 17 Field experi- ence, however, suggests that these batteries normally last only one year for wind and small hybrid systems and two years for PV and large hybrids. 18 The charge controllers and the DC/AC inverters have a lifetime of 10 years.
Two sizes of gasoline gen-sets suitable for household use (450 W and 500 W) are examined for comparison. These gen-sets are made in Japan and are available in the local market. Gen-sets were assumed to operate at their full capac- ity for four hours per day. This schedule of operating hours is based on the experience of local users in the four counties who have found that operat ion of these systems in excess of this amount significantly increases the l ikelihood of parts
17Due to the fluctuations in power supply from a wind turbine, batter- ies are more likely to experience deeper discharges in the cases of wind- only or small hybrid systems. For this reason, battery lifetimes are shorter tbr these configurations. 18Site visits by researchers of the Chinese Academy of Sciences co-operating in this study lbund that, without knowledge about the batteries and adequate training on their usage, households do not properly utilize and maintain batteries, thus leading to shorter lifetimes.
failure and added repair needs. Because these counties are remotely located, increased parts failures and repairs may
result in long stretches of non-use. Our review of case stud-
ies on the performance of off-grid, remote gen-sets supports the use of this operating schedule (see, for example, Berdner et al., 1994).
The market price for gasoline in Inner Mongol ia is approximately $1.65 gallon -I C~3.56 l-l). The price for lubricant used by gen-sets is approximately $0.60 quart -1 (¥8 l-l). The
delivery cost for these tw9 items to remote areas varies by distance. For the counties under study, an average delivery cost for fuel and lubricant is $1.42 gallon -1 (g3.12 l-l). This
cost is added to the market price of gasoline and lubricant to obtain a delivered price for these items.
Levelized cost comparisons for household-scale PV, wind, PV/wind hybrid and gasoline gen-set systems were conducted for the four counties. Assumptions and parameters used for our levelized cost analysis are described in Table 1. Our analysis evaluates household-scale systems currently installed in the 41 herder families. Each system was evaluated at its maximum energy (kWh) generation capacity. In order to compare the economics of different technologies, we based our analysis on installed costs of all systems.19
The PV systems under evaluation can serve only small household loads, from 120 kWh to 240 k w h yr -~ (depend- ing on the county). Wind turbines can serve modestly larger loads - from 200 kWh to 640 k w h yr - l . Gasoline gen-sets can serve annual loads of 480 kWh to 730 kWh, depending
19The analysis excluded a government subsidy of ¥200 ($24) provided in the IMAR to manufacturers of household-scale systems tbr each addi- tion of 100 W capacity of wind or 16 Wv PV sold. The 1MAR subsidy represents a 20"/,, discount lbr wind systems and up to 24% ['or PV systems.

The economics of sustainable energy for rural development." J Byrne et al 51
Table 2 Levelized costs for PV, wind, gasoline gen-set and hybrid systems
System Output range (kWh yr -1) Levelized cost based on Mfr. quoted battery lifetime ($ kWh -1)
Levelized cost based on battery lifetime from field analysis
($ kWh -1)
Wind-only 200-640 0.24-0.37 0.50-0.63 PV-only 120-240 0.67-0.73 0.77-0.83 Small hybrids 400-750 0.31-0.46 0.57-0.72 Large hybrids 560-870 0.32-0.46 0.43-0.57 Gen-sets (not serving continuous 660-730 ~ 0.76-0.80" 0.76-0.80 ~' duty cycle equipment) Gen-sets (serving continuous duty 480-560 1.09-1.19 1.16-1.27 cycle equipment)
"These estimates are based on systems configured without storage.
on whether they must serve continuous duty cycle equip- ment. 20
H o u s e h o l d surveys c o n d u c t e d in the region indicate tha t m o s t families c o n s u m e 300 W h - 6 0 0 Wh day -1, ma in ly for l ight ing a nd to power radios or small b lack- and-whi te Tvs. W h e n a small refr igerator is in t roduced , dai ly c o n s u m p t i o n rises to 1.2 k W h - l . 6 kWh. The compara t i ve ly larger c o n s u m p t i o n levels can only be served by the h igher ra ted wind turbines, gen-sets and hybr ids (see Table 2). 21 O u r analysis indicates tha t the leas t -cos t resource for household-sca le , s tand-alone generation in the four counties is wind (see Table 2). At $0.24-$0.37 kWh -1 , the locally made small turbines are by far the mos t economical means for the provision o f electricity services to remote herder families. PV offers the next lowest-cost, s tand-alone opt ion available to herder families: average levelized costs range f rom $0.67 k w h -1 for Si Zi Wang to $0.73 k w h -1 for D o n g Wu Zhu Mu Qin. Levelized costs o f the two gen-set units were comparatively expensive, ranging from $0.76-$1.19 k w h - ~. The higher cost o f gen-sets is due significantly to delivery costs for fuel and to the comparatively large repair and maintenance expenses for gen-sets.
Analysis of renewable energy hybrid systems
As h o u s e h o l d electrici ty c o n s u m p t i o n grows over t ime (especially, in response to d e m a n d s for u n i n t e r r u p t e d energy services across seasons) , PV- and wind-on ly systems in the four count ies m a y not be able to compe te with gen-sets despi te the h igher ievelized costs o f the gen-sets. This is because it b e c o m e s prohib i t ive ly e x p e n s i v e to s u p p l y e l e c t r i c i t y d u r i n g the low- availabili ty per iods for the two resources (ie the sum- mer m o n t h s for wind and the winter m o n t h s for PV). One op t i on is the d e v e l o p m e n t o f PV-wind hybr id sys tems tha t can p roduc e m o r e energy and provide
2°The two sizes of gen-sets in this study can generate 650 kWh- 730 kWh electricity per year if there is no requirement to serve continu- ous duty cycle equipment. However, these sets satisfy lower annual loads - 480 kWh to 550 kWh (due to the power losses from energy storage and conversion), if continuous duty cycle equipment requiring 1 kWh of electricity per day must be served. The standard household refrigerator in the IMAR has a 1 kWh daily electricity requirement. 2~For comparison, an American household typically consumes 25~0 kWh day ~.
con t i nuous service t h r o u g h o u t the year. O f all systems evalua ted in our study, the PV-wind c o m b i n a t i o n was economica l ly the m o s t attractive. A small hybr id o f a 300 W wind turbine with 35 Wp or 60 Wp PV is capable o f mee t ing an annua l energy d e m a n d o f 400 k w h to 750 k W h at a levelized cos t o f $0.31 k w h -~ for Su Ni Te You (the c o u n t y with the best renewable energy profile) and $0.46 k W h -l for D o n g Wu Z h u M u Qin (the coun ty with the poores t wind and solar resources). A large hybrid with a 300 W wind turbine and a 100 Wp or 120 Wp PV array can provide more generat ion capac- ity (520 kWh to 870 k W h yr -~) at a s imilar levelized cos t o f $0.32 to $0.46 k W h -1. Results f rom o u r lev- elized cos t analysis are s u m m a r i z e d in Table 2.
Since there are differences between battery lifetimes quoted by the maufacturer and lifetimes based on field data, we performed sensitivity tests on the assumption of battery lifetime to examine the impact of changes in this assumption on the levelized costs of various systems. We found that using battery lifetimes based on field data significantly increases system levelized cost by 14% to 108% (see Table 2). This suggests that adequately training herdsmen in battery maintenance requirements is very important. Higher qual- ity, sealed batteries can, of course, be an alternative to these locally made batteries. However, higher prices and shipping expenses of the maintenance-free batteries will add even more to the system cost, and affect system affordability to herdsmen in remote areas who have little or no savings to rely on. For such users, in the absence of acceptable financ- ing options, initial capital cost is a major hurdle that often determines affordability.
The quality of the renewable energy resource influences the generating capacity of the PV and wind components by county, but it does not affect the overall ranking of the most to least costly means of providing energy services. Nor does it significantly affect the size of the cost differences among the technologies. Figure 4 depicts the results of our system analysis for the counties of Su Ni Te You and Dong Wu Zhu Mu Qin. From this figure, nearly identical cost patterns can be seen.
Our cost analysis suggests that hybrid systems can meet increased energy demand at relatively stable costs to the user, improving this system's competitive standing over gen-sets,

52 The economics of sustainable energy for rural development." J Byrne et al
1 .6
j -
0 0
1.4
1.2
1.0
0.8
0.6
0.4
0.2
0
S u - N i - T e . Y o u
~ e n - S e t
PV S m a l l H y b r i d
Large Hybrid
I I I I I I I I I 100 2 0 0 300 400 5 0 0 600 700 800 900
k W h / Y e a r
Figure 4
1.6
1.4
,- 1.2
J ~ -~ 1.0
0 .8 ?, o 0.6
0 .4
0.2
G e n - S e t
PV Smal~Hybrld
. L a r g e H y b r i d
0 lJ}O 240 3~)0 4(~0 5~}0
kWh I Y e a r 1. Leve l i zed costs are b a s e d on m a x i m u m kWh g e n e r a t i o n o f e a c h sys tem. 2. Va r i a t i on in l eve l i zed costs of e a c h t e c h n o l o g y is due to d i f f e rences in a s s u m e d
battery life. 3. Hybrid s y s t e m s inc lude 3 0 0 W wind turb ines with 3 5 W - 6 0 W PV fo r sma l l hybrids
a n d 1 0 0 W - 1 2 0 W PV for large hybr ids. 4. T h e g e n - s e t costs are based on the a s s u m p t i o n of serv ing c o n t i n u o u s duty cycle
e q u i p m e n t wi th 1 k W h of daily e n e r g y n e e d .
Levelized costs for PV, wind, gasoline gen-set and hybrid systems in selected counties of Inner Mongolia, China
which can suffer long down-times as maintenance needs, parts failures and fuel shortfalls interrupt service. 22
Ongoing research of the IMAR at the Center for Energy and Environmental Policy and the National Renewable Energy Laboratory includes village-scale design and applications of renewable energy systems. While the data reported here are for household-scale applications only, it is possible to infer that village applications (including the provision of electric- ity service to small enterprises) should also be cost- competitive because village systems can allow more productive
22In this vein, it is important to note that, in surveys conducted tbr this project, herder families with comparatively large consumption loads (1.2 kWh-1.6 kWh) reported a clear preference for renewable energy systems because of their greater reliability, meaning less risk of loss of service.
use of BOS components, thereby lowering levelized unit costs.
Policies to promote village and household-scale renewable energy systems
The analysis presented here confirms the existence of economical renewable energy applications to meet village and household electricity needs in remote areas. Inner Mongolia appears to possess several key features needed in this regard for successful development of rural renew- able energy: ample wind and solar resources; the long distances of many villages and households from the electri- cal grid, making grid connection uneconomical; the exist- ence of reasonably well-developed manufacturing facilities

The economics of sustainable energy for rural development: J Byrne et al 53
to supply village and household systems at moderate cost; and improving economic circumstances which enable families to purchase renewable energy systems. Together, these features create attractive conditions for rural renewable energy development to provide electricity service.
Analyses have found that, in similar circumstances in Asian, Latin American and Pacific island countries, renew- able energy technologies can be cost-effective sources of electricity, especially compared to diesel or gasoline gen-sets (Cabraal et al., 1996; Hammad, 1995; Liebenthal et al., 1994). To take best advantage of the opportunities identified by research to date, policies and institutional strategies for rural renewable energy development are needed. Several policy proposals are offered below to facilitate development of off-grid village and household renewable energy markets.
First, energy planning of governments at different levels, central and local, should begin to set goals and timetables for increasing the use of renewable energy technologies to provide electricity service in areas where grid extension is too costly and where opportunities for the use of renewables is economically warranted. In this regard, it is important that governments clearly communicate to rural communities the infeasibility of grid-service to distant areas. Such communica- tion can speed market penetration of village and household- scale systems which might otherwise face resistance as remote communities continue to expect grid connection in the near future.
Further, governments in developing countries need to establish renewable energy markets for rural populations. Central governments should target key provinces for the development of specific renewable energy options and then promote province-based collaboratives to address barriers. Governments at different levels should also encourage government-industry partnerships to spur market develop- ment of renewable energy technologies.
Developing countries should avoid offering subsidies to local renewable energy manufacturers except in the early years of market development. Subsidies create only short term gains that cannot be sustained when they are removed and prices subsequently rise. In the longer run, public mon- ies can be put to better use by underwriting a Renewable Energy Development Fund that supports demonstration projects, R&D activities, and, most important, revolving loan funds to ease obstacles to the purchase of renewable energy systems in rural areas. For developing countries, a fund of this kind may also attract investment from multilateral organizations and may help to qualify the country for sup- port from the Global Environmental Facility (GEF) of the World Bank and the United Nations Development Programme (UNDP).
The use of revolving funds as financial mechanisms to provide capital for village and household-scale renewable energy development deserves special attention. In many countries, rural communities lack access to commercial financ- ing options. A revolving fund can fill the gap by marshalling public and multilateral funds to capitalize the account and then utilizing community repayments to expand the size of
the fund over time. The existence of such a fund helps greatly to establish and stabilize market opportunities by expanding the number of households and villages who can purchase renewable energy systems.
Flexible loan rates and repayment plans can also serve the goal of market development. Many herder families in Inner Mongolia, for example, desire to purchase renewable energy systems to serve not only basic household needs but also certain economic functions (such as water pumping and electric shearing). If herder families pay less in the beginning and increase payments later when business activity expands, or they are able to borrow money at a lower interest rate in the beginning years and a higher rate in later years, the twin purposes of rural economic development and electrification can be served.
In addition to establishing an effective financial mechanism, developing countries might adopt incentive policies to stimulate the development of rural renewable energy markets. Sliding- scale investment tax credits to manufacturers would be one means of spurring early adoption of renewable energy options. A second would be to recognize the social and environmental benefits of renewable energy by reducing the tax rate on renewable energy manufacturers relative to the level paid by conventional energy suppliers.
Along with incentive policies, developing countries need to examine market transformation strategies that will encour- age more rapid development of renewable energy potentials. One important option includes renewable energy set-asides in which governments set targets for increased use of renew- able energy. Such a strategy will quickly lead energy suppli- ers to identify least-cost applications and, in parallel, stimulate focused technology development to meet emerging markets. A second option would be to support policy collaboratives involving government, industry, community and research organizations in the identification of local renewables markets that could be encouraged to grow with the adoption of policy and institutional reforms.
Finally, developing countries should seek capacity- building and institutional support from multilateral organiza- tions in the areas of renewable energy design, planning, marketing, and policy evaluation. They should also take action to clearly define the institutional basis for co-operation with developed countries for the transfer of renewable energy technologies.
Conclusion
Rural electrification is now and will remain an essential ele- ment for rural development in developing countries. Renew- able energy technologies, such as photovoltaics and wind, can provide an economical and environmentally sustainable option for meeting energy needs of remote rural households in these countries. Adoption of effective policies - the build- ing of an institutional framework to support renewable energy development, the establishment of effective financial mechanisms to provide capital for renewable energy develop- ment, the adoption of incentive based actions to spur the

54 The economics of sustainable energy for rural development: J Byrne et al
renewable energy development, the implementation of market t ransformat ion strategies to encourage renewable energy d e v e l o p m e n t , and the e n h a n c e m e n t o f i n t e rn a t i ona l co-operat ion to promote renewable energy technologies - will create the 'level playing field' needed to enable renewable energy technologies to compete with conventional options such as fossil fuels.
Undoubtedly, the challenges faced by developing countries are great. However, these challenges can be met if principles of sustainable development inform economic, energy and environmental policy, and if international support is mobilized to meet developing country needs. Together, developing countries and the world community can produce the new ideas and enact the innovative policies that will realize a sustainable future.
Acknowledgements
This work was part ial ly supported by the National Renew- able Energy Labora tory (US) under subcontract, XR-2- 11248-1. We would like to thank Ralph Nigro, Applied Energy Group, for his technicial assistance and Li Xiuguo, Lin Li, Shao An, Wang Sicheng, Ji Binghou and Yang Meidong, members of the Chinese research team co-operating in this project, for their efforts in conducting household surveys and gathering resource and equipment data.
References
Acker, R, & Kammen, D (1996). The quiet (energy) revolution: analyz- ing the dissemination of photovoltaic power systems in Kenya. Energy Policy, 24(1), 81-111.
Berdner, J, Whitaker, C, Wenger, H and Jennings C (1994) 'Design and cost optimization of utility-grade off-grid power systems' Paper presented at the World Conference on Photovoltaic Energy Conver- sion, Waikoloa, Hawaii, December 1994
Byrne, J, Shen, B, Wallace, W and Li, X (1997) Levelized Cost Analyses of Small-Scale, Off-Grid Photovoltaic, Wind and P V-Wind Hybrid Systems for Inner Mongolia, China. Report submitted to the National Renewable Energy Laboratory, prepared by the Center for Energy and Environmental Policy, University of Delaware, Newark, Delaware
Cabraal, A, Cosgrove-Davies, M and Schaeffer, L (1996) Best Practices for Photovoltaic Household Electrification Programs." Lessons from Experiences m Selected Countries World Bank Technical Paper No 324. World Bank, Washington, DC
China Electric Power (1996) 'Electricity comes l¥om wind' Vol 503 (No 2), February. Beijing, China
China State Statistical Bureau (1995) Statistical Yearbook of China 1995 China Statistical Publishing House, Beijing, China
Hammad, M (1995). Photovoltaic, wind and diesel: a cost comparative study of water pumping options in Jordan. Energy Policy, 23(8), 723-726.
He, D and Shi, P (1995) 'Wind energy utilization in China' in Yan, Luguang (ed) Solar Energy in China. Proceedings of the High-Level Expert Meeting for China Chinese Academy of Sciences, Beijing, China, 128-136
Inner Mongolia New Energy Office (1995) Graph of Renewable Energy Resource Distribution in Inner Mongolia Hohhot, Inner Mongolia
Lenssen, N (1993) 'Providing energy in developing countries' in World- watch Institute, State of the World, 1993 W W Norton and Company, Inc, New York, NY, 101-119
Li, C (1991) 'The development and utilization of wind energy in Inner Mongolia' in Chinese Solar Energy Society (ed) The Development of New and Renewable Sources of Energy in China China Science and Technology Press, Beijing, 70-72
Liebenthal, A, Mathur, S and Wade, H (1994) Solar Energy: Lessons from Pacific Island Experience World Bank Technical Paper (244), World Bank, Washington, DC
People's Daily (1996) (Overseas edition), 'Energy corridor has been formed in Inner Mongolia grassland' Beijing, China. October 28
Yan, C (1994) China Energy Development Report Economic Manage- ment Press, Beijing, China
Zhu, R (1988) China's Solar and Wind Resources and Utilization Meteorol- ogy Press, Beijing, China