the e⁄ect of mortgage securitization on foreclosure and
TRANSCRIPT

The Effect of Mortgage Securitization on Foreclosure
and Modification
Samuel Kruger∗
December 2016
∗The University of Texas at Austin McCombs School of Business. 2110 Speedway, B6600, Austin, TX 78712.
Email: [email protected]. I thank my dissertation advisors, John Campbell, Josh Coval, Robin
Greenwood, David Scharfstein, and Jeremy Stein for guidance. I also thank Manuel Adelino, Kris Gerardi, Ed
Glaeser, Paul Goldsmith-Pinkham, John Griffi n, Adam Guren, Sam Hanson, Ben Iverson, Amit Seru, Clemens Sialm,
Adi Sunderam, discussants Taylor Nadauld and Tomasz Piskorski, and seminar participants at the Harvard finance
lunch, the Federal Reserve Bank of Atlanta, Georgia Tech, Notre Dame, the Federal Reserve Board of Governors,
Washington University in St. Louis, the University of Texas at Austin, the University of Southern California, the
University of Minnesota, New York University, the University of Illinois at Urbana-Champaign, Dartmouth, the 2014
Summer Real Estate Symposium, and the 2015 Western Finance Association meeting for helpful comments. The
Federal Reserve Bank of Atlanta hosted me while I conducted this research. The views expressed are those of the
author and do not necessarily represent those of the Federal Reserve Bank of Atlanta or the Federal Reserve System.
The Effect of Mortgage Securitization on Foreclosure
and Modification
December 2016
Abstract: Did securitization exacerbate the foreclosure crisis by altering mortgage servicing prac-tices? I exploit the unanticipated freeze of private mortgage securitization in 2007 to provide newevidence that securitization increases foreclosure probability and decreases modification probability.These effects are economically large and persist over time even after implementation of the HomeAffordable Modification Program (HAMP) in 2009. Using hand-collected data on the contractualterms of servicing agreements, I show that servicers typically have broad discretion to modify loansbut face significant incentives favoring foreclosure. The evidence implies that securitization signif-icantly increased foreclosure rates during and after the crisis.
JEL Classification: G01, G21, G32
Keywords: Foreclosure, Loan Modification, Mortgage Securitization, Mortgage Servicing, Finan-cial Crisis
1. Introduction
Since the start of the financial crisis, 5.3 million U.S. homes have been foreclosed. Roughly
half of these foreclosures stemmed from privately securitized mortgages, prompting policy makers
and economists to worry that securitization alters how loans are serviced and leads to unneces-
sary foreclosures. Previous studies find that private securitization increases foreclosure rates and
decreases modification rates (Piskorski, Seru, and Vig, 2010; Agarwal, et al., 2011). These studies
focus on the run-up to and early stages of the financial crisis. I reassess this issue with a long time
series and different approach focused on the later stages of the crisis when delinquencies became
more common.
I contribute to the literature in four ways. First, I use a long time series to reassess the quanti-
tative importance, persistence, and economic significance of securitization’s effect on foreclosure and
modification in the aftermath of the financial crisis. Consistent with Piskorski, Seru, and Vig, (2010)
and Agarwal, et al. (2011), I find that securitization significantly increases foreclosure probability
and decreases modification probability, and when securitized loans are modified, the modifications
tend to be less concessionary and more prone to redefault. The effects are permanent and econom-
ically large. Second, I show that securitization increased foreclosure probability throughout 2007
to 2012, even after significant government intervention through the Home Affordable Modification
Program (HAMP) in 2009. Third, I base these conclusions on a new identification strategy that
exploits the freeze of private securitization markets starting in August of 2007. Because my results
are based on an entirely new source of variation, they provide strong confirmation that the effect
of securitization on foreclosure and modification is causal. Finally, I use hand-collected data on the
contractual terms of servicing agreements to show that servicers typically have broad discretion to
modify loans but face significant incentives favoring foreclosure. Where contractual modification
restrictions exist, foreclosure probabilities are higher, but the effects are not large enough to explain
the full impact of securitization on foreclosure and modification.
Relative to portfolio loans held directly on bank balance sheets, private securitization increases
the probability of foreclosure initiation within twelve months of a mortgage’s first serious delin-
quency by 11.2 ppt (19% of the mean foreclosure initiation rate). Similarly, securitization increases
the probability of foreclosure completion by 7.5 ppt (43% of the mean) and decreases the probabil-
1
ity of modification by 5-11 ppt (33-78% of the mean), depending on how modification is measured.
These results imply that securitization significantly exacerbated the foreclosure crisis. Taken at
face value, they imply that approximately 950,000 of the 5.3 million foreclosures experienced since
the start of the financial crisis were caused by securitization. This is the partial equilibrium effect
of securitization through changes in loan servicing. Securitization also affects loan origination, and
foreclosures could be amplified in general equilibrium due to spillover on house prices. As a result,
this estimate likely understate the full impact of securitization on foreclosure.
In part motivated by the high foreclosure rate of privately securitized mortgages, the fed-
eral government enacted the Home Affordable Modification Program (HAMP) in February of 2009
to incentivize modifications and make modification practices more consistent across mortgages.
I test the consistency of foreclosure and modification practices across securitized and portfolio
loans before and after HAMP and find that private securitization increased foreclosure probability
throughout 2007 to 2012. Using a triple difference identification strategy, I find that HAMP miti-
gated the foreclosure completion difference between securitized and portfolio loans that qualify for
HAMP modifications. However, securitized foreclosure rates remained elevated after 2009 even for
qualifying loans. HAMP’s impact on securitized modifications depends on how modifications are
identified. Whereas reported modification rates are more consistent after 2009, imputed modifica-
tion rates based on observed changes to loan terms remain lower for securitized loans throughout
the sample. The overall evidence suggests that HAMP mitigated but did not eliminate foreclosure
and modification differences between securitized and portfolio loans. As a result, securitized loans
are substantially more likely to be foreclosed and less likely to be modified compared to portfolio
loans despite HAMP. To the extent that HAMP mitigated these differences, the 950,000 foreclosures
caused by securitization would be even higher without HAMP.
I estimate the causal effect of securitization on foreclosure and modification of delinquent
loans by exploiting the sudden and unexpected freeze of private mortgage securitization starting
in August of 2007. Jumbo mortgages originated shortly before the freeze were disproportionately
stuck on bank balance sheets even though many of them were intended for private securitization at
the time they were originated. Because the freeze was unanticipated, loans originated shortly before
the freeze are similar to loans originated earlier in 2007. I also control for potential changes to the
lending environment over time using a difference-in-differences methodology with high quality non-
2
jumbo loans, which are primarily securitized by Fannie Mae and Freddie Mac and were unaffected
by the private securitization freeze.
Securitization’s impact on foreclosure and modification of delinquent loans stems from the
principal-agent relationship between MBS investors and mortgage servicers. Because dispersed
investors cannot directly manage mortgages, securitization involves delegating loan management
to a servicer, subject to an incomplete contract. Servicing current mortgages is relatively straight-
forward to contract, but loss mitigation (including modification) for delinquent mortgages involves
significant discretion. This gives servicers an incentive to underinvest in costly loss mitigation.
I find that servicing agreements do little to overcome the underinvestment problem. Servicers
are required to follow accepted industry practices, but servicing agreements provide no explicit
incentives for loss mitigation. The agreements actually do the opposite. By universally reimbursing
foreclosure expenses, servicing agreements create an extra incentive to pursue foreclosure instead of
loss mitigation. Where they are present, modification restrictions increase foreclosure probability
in loan-level regressions, but they are too rare and insuffi ciently binding to explain the full effect
of securitization on foreclosure and modification. Ex-post renegotiation of servicing contracts is
precluded by trust passivity, stringent contract amendment requirements, and investor dispersion.
Thus, incomplete servicing contracts have real effects. Privately securitized loans are modified less
and foreclosed more than they would be if they were held as portfolio loans.
My results relate most directly to recent work by Piskorski, Seru, and Vig (2010), Agarwal, et
al. (2011), and Adelino, Gerardi, and Willen (2013). Piskorski, Seru, and Vig find that privately
securitized loans are more likely to foreclosed, and Agarwal et al. find that privately securitized
loans are less likely to be modified. To control for potential endogeneity of securitization, both
papers condition their samples on loans becoming delinquent, control for observable characteristics,
and restrict their samples to high quality loans. Agarwal, et al. also control for servicer fixed effects
using servicer identifiers, which are available in their data. Piskorski, Seru, and Vig complement
their baseline analysis with a quasi-experiment for securitization based on early payment default
clauses, which require some originators to buy back loans that become delinquent within 90 days of
securitization. In contrast, Adelino, Gerardi, and Willen find that private securitization does not
impede modification and differences in modification rates are economically small relative to larger
economic forces that kept one-year modification rates under 10% until 2008 for all loans, including
3
portfolio loans. My results confirm the findings of Piskorski, Seru and Vig and Agawal et al. in
a new sample with a new identification strategy and extended time horizon. I discuss my results
relative to the previous literature in more detail in Section 3.6.
This paper adds to a growing literature on the relation between mortgage securitization and
the high level of foreclosure observed during the recent crisis. In part motivated by foreclosure
externalities [see Campbell, Giglio, and Pathak (2011); Anenberg and Kung (2014)], economists
and policymakers worry that unnecessary foreclosures caused by securitization may have exacer-
bated the foreclosure crisis. Securitization can increase foreclosures through two channels. First,
securitization may decrease the quality of loans being originated [Keys et al. (2010); Purnanan-
dam (2011)]. Second, securitization may change how loans are serviced by distorting incentives or
introducing contractual frictions.
I focus on securitization’s impact on how loans are serviced. Zingales (2008), Posner and
Zingales (2009), and White (2009) propose that servicing distortions may explain why foreclosure is
common despite being costly to lenders. Cordell, et al. (2008) note that servicers lack adequate loss
mitigation capacity and have incentives that may not be aligned with investors. Mayer, Morrison,
and Piskorski (2009); Gelpern and Levitin (2009); and Levitin and Twomey (2011) note that some
mortgage servicing contracts restrict modifications and incentivize servicers to pursue foreclosure
over modification. On the other hand, Foote, et al. (2009) note that modification may be more
costly to investors than foreclosure, and Adelino, Gerardi, and Willen (2013) find that modifications
are rare even for portfolio loans. Supporting this idea, Ghent (2011) finds that modifications were
also rare during the Great Depression. Zhang (2013) finds that securitized loan modifications
redefault at higher rates than portfolio loan modifications. Maturana (2016) finds that foregone
modifications of securitized loans would have benefitted investors.
Securitization is not the only friction faced by mortgage servicers. Agarwal et al. (2016)
find that lack of loan modification capability significantly constrains HAMP modifications by many
mortgage servicers. Roshak (2015) finds that reluctance to realize losses also decreases modifications
for portfolio loans. These complementary findings give even more reason to fear that foreclosure
levels are unnecessarily high.
4

2. Data and methodology
To test the effect of securitization on foreclosure and modification, I use loan-level data from
Lender Processing Services (LPS). To analyze the mechanism through which securitization affects
mortgage servicing, I supplement this data with hand-collected data on servicing agreement terms,
which I match to loan-level Core Logic data on privately securitized loans. I discuss these additional
data sources in Section 4.
The LPS data consist of detailed monthly data on individual loans provided by large mortgage
servicers, including at least seven of the top ten servicers. As of 2007, the data included 33 million
active mortgages, representing approximately 60% of the U.S. mortgage market. Importantly, the
data span all mortgages serviced by the participating servicers, including portfolio loans, loans
securitized by Fannie Mae and Freddie Mac (the Government Sponsored Enterprises, GSEs), and
privately securitized loans.
My analysis focuses on first lien loans originated between January and August of 2007. To
avoid survivor bias, I only consider loans that enter the LPS data within four months of origination.
I drop government sponsored loans like VA and FHA loans because these loans may have different
servicer requirements and incentives. To eliminate outliers and focus on reasonably typical prime
and near prime loans, I further restrict the sample to loans with origination FICO scores between
620 and 850, origination loan-to-value ratios of less than 1.5, and terms of 15, 20, or 30 years that
are located in U.S. metropolitan statistical areas (MSAs) outside of Alaska and Hawaii. Finally, I
drop a small set of loans that are at some point transferred to a servicer that doesn’t participate in
the LPS data because the data do not always reveal how delinquencies were ultimately resolved for
these loans. Other than my exclusion of low FICO score loans and inclusion of GSE loans, these
restrictions are largely consistent with Piskorski, Seru, and Vig (2010), Agarwal, et al. (2011), and
Adelino, Gerardi, and Willen (2013). The resulting sample consists of 1.9 million loans.
Table 1 describes the sample. It includes 262,000 jumbo loans (i.e., loans over $417,000,
which are not eligible for GSE securitization)1 and 1.6 million non-jumbo loans. As of six months
after origination, 70% of the jumbo loans were privately securitized. Almost all of the rest (28%)
1The conforming loan limit in 2007 was $417,000 in all states except Alaska and Hawaii, which are excluded from
my sample.
5
were held as portfolio loans. By contrast, 81% of non-jumbo loans were securitized by the GSEs.
Delinquency is common in both sub-samples. Six percent of jumbo loans became seriously (60+
days) delinquent within 1 year, and 36% became seriously delinquent within five years. Similarly, 4%
of non-jumbo loans became seriously delinquent within 1 year and 27% became seriously delinquent
within 5 years.
All of my analysis is conditional on mortgages becoming seriously delinquent, which I define
as delinquencies of at least 60 days. The delinquent loan sample, which consists of all loans that
became seriously delinquent by June of 2013, has 100,000 jumbo loans and 453,000 non-jumbo
loans. The jumbo and non-jumbo loans clearly differ in size. Jumbo loans also tend to have slightly
higher FICO scores. Loan-to-value (LTV) ratios are almost identical across jumbo and non-jumbo
loans.
Identifying delinquencies is straight-forward because LPS includes data on payment status.
Consistent with previous studies, I use the Mortgage Bankers Association’s definition of 60+ day
delinquency. Foreclosures are also identified in the LPS data. I consider both foreclosure initiation,
the referral of a loan to an attorney for foreclosure, and foreclosure completion, indicated by post-
sale foreclosure or real estate owned status. Piskorski, Seru, and Vig (2010) study foreclosure
completion, which has the nice property of being a final resolution. On the other hand, foreclosure
initiation is a more direct servicer decision and is more common within the twelve-month window I
use for most of my analysis. As reported in Table 1, foreclosure is initiated within one year of first
serious delinquency for 59% of jumbo loans and completed for 18%. Foreclosure rates are about
the same for non-jumbo loans.
Identifying loan modifications is more complicated because not all servicers report modifica-
tions. I use two measures for loan modifications. First, I impute modifications based on month-
to-month changes in interest rates, principal balances, and term lengths. For example, an interest
rate reduction on a fixed rate mortgage must be due to a mortgage modification. My algorithm
for identifying loan modifications, described in the internet appendix, is essentially the same as the
algorithm employed by Adelino, Gerardi, and Willen (2013). Broadly, I consider two (potentially
overlapping) types of modifications: concessionary modifications that reduce monthly payments by
decreasing interest rates, decreasing principal balances, or extending loan terms; and modifications
to make loans current by capitalizing past due balances. The loan modification algorithm looks for
6
evidence of either of these patterns. A limitation of the loan modification algorithm is that it does
not identify modifications that do not change interest rates, term to maturity, or principal balances.
In particular, it does not capture temporary payment plans or principal forbearance. To work, the
algorithm requires monthly data on interest rates, term to maturity, and principal balances. This
is universally available for interest rates and principal balances. Monthly term to maturity data,
on the other hand, is only available for about half of the loans in my sample. I limit my imputed
modification analysis to these loans.
Second, following Agarwal, et al. (2011) and Zhang (2013), I use servicer-reported modifica-
tions, which are available in the LPS data starting in 2008 for servicers representing approximately
75% of the observations in my delinquent jumbo loan sample. As reported on Table 1, imputed and
reported modification rates are about the same. By both measures, approximately 15% of delinquent
loans are modified within twelve months of becoming seriously delinquent. Where the imputed and
reported modification samples overlap (i.e., post-2007 delinquencies for loans with term to maturity
data that are serviced by servicers that report modifications), imputed and reported modifications
have a correlation of 81%.
2.1. Instrumental variables methodology
Empirically identifying securitization’s impact on mortgage servicing requires holding loan
quality constant. Securitization’s impact on mortgage origination quality and originators’adverse
selection incentive to securitize low-quality loans make this identification challenging because se-
curitized loans may differ from portfolio loans on unobserved dimensions. Moreover, it is not clear
which direction unobserved quality would bias the results. Privately securitized loans could be
lower or higher quality than observably similar portfolio loans. Originator adverse selection and
screening moral hazard push in the direction of securitized loans being lower quality. On the other
hand, mortgage backed security (MBS) sponsors also have access to unobserved information, which
they could use to select higher quality loans [Jiang, Nelson, Vytlacil (2014); Agarwal, Chang, and
Yavas (2012)]. The impact of loan quality on foreclosure and modification decisions conditional on
delinquency is also ambiguous. Some quality dimensions favor foreclosure, while others favor mod-
ification or inaction. For example, borrower resilience discourages foreclosure because a resilient
borrower is likely to regain his financial footing and repay his mortgage. By contrast, borrower re-
7
liability encourages foreclosure because a reliable borrower must have suffered a large shock before
becoming delinquent on his loan.
I exploit the sudden and unexpected freeze of private mortgage securitization in the third
quarter of 2007 to identify private securitization. Loans originated shortly before the freeze are
similar to loans originated earlier in the year but were significantly less likely to be securitized. My
identification strategy is analogous to Bernstein’s (2015) instrument for public ownership. Bernstein
exploits the fact that NASDAQ returns shortly after an IPO announcement are uncorrelated with
firm prospects but predict whether the IPO will be completed. In both Bernstein’s setting and my
own, ownership structure is endogenous but is influenced by effectively random shocks to related
asset markets.
Purnanandam (2011) also exploits loans being stuck on bank balance sheets in 2007. Us-
ing bank-level call report data, Purnanandam shows that in the cross section, banks with heavy
exposure to originate-to-distribute lending were stuck holding loans that were intended for sale.
These banks subsequently suffered higher delinquency rates and charge-offs than other banks, con-
sistent with originate-to-distribute loans being lower quality than other loans. In contrast, I exploit
time series variation in securitization rates by loan origination month to control for securitization
endogeneity and estimate the impact of securitization on mortgage servicing.
Mortgage securitization comes in two forms. Most residential mortgages are securitized by
Fannie Mae or Freddie Mac (the Government Sponsored Enterprises, GSEs). However, not all
mortgages qualify for GSE securitization. A loan may fail to conform to GSE standards either
because it fails their underwriting standards (subprime loans) or because it exceeds their loan
limits (jumbo loans). Starting in the 1990s and growing rapidly in the early 2000s, liquid private
markets arose to securitize subprime and jumbo loans. In 2006, $1.1 trillion of private mortgage
backed securities (MBS) were issued, including $200 billion backed by jumbo mortgages (Inside
Mortgage Finance, 2008).
Private mortgage securitization abruptly decreased in the third quarter of 2007, disappeared
by the end of 2007, and has essentially remained frozen since then. Fig. 1 plots prime securitization
volume from 2000 to 2011 based on data from Inside Mortgage Finance. Jumbo prime MBS issuance
topped $55 billion dollars in quarters 1 and 2 of 2007 then crashed to $38 billion in Q3 and $18
billion in Q4, followed by almost no issuance after 2007.
8
The private securitization freeze was simultaneous with the August 2007 freeze of asset backed
commercial paper, previously a $1.3 trillion market that was heavily invested in MBS. Both freezes
were unanticipated and appear to have been caused by sudden increases in investor apprehension
and lack of liquidity for mortgage backed securities, particularly subprime MBS. Acharya, Schnabl,
and Suarez (2013) and Kacperczyk and Schnabl (2010) date the collapse of asset backed commercial
paper to the August 9, 2007 suspension of withdrawals at three BNP Paribus funds. Calem, Covas,
and Wu (2013) and Fuster and Vickery (2015) discuss the private MBS issuance freeze, which they
date to August 2007 and exploit as a liquidity shock to jumbo lending. Consistent with these shocks
being unanticipated, asset backed commercial paper was liquidly rolled over at overnight spreads
of 10 basis points until immediately before August 9, 2007, at which point spreads jumped to 150
basis points within one day (Acharya, Schnabl, and Suarez, 2013). Similarly, ABX price indices for
AAA subprime MBS fell below unity for the first time only shortly before the market freeze (see
Fig. 2).2 GSE credit guarantees prevented similar fears in the GSE MBS market, which continued
to issue securities uninterrupted throughout 2007 and the rest of the financial crisis (see Fig. 1).
I use the August 2007 private securitization freeze as a natural experiment for jumbo secu-
ritization. Because the freeze was unanticipated, it did not affect origination decisions until after
it occurred. The exclusion restriction underlying my analysis is that after conditioning on serious
delinquency and controlling for observable characteristics, foreclosure and modification are uncor-
related with origination month except through its effect on securitization probability. This is a
natural implication of an unanticipated shock to private securitization and is less restrictive than
requiring that the shock was completely unanticipated by all agents. The evidence on asset backed
commercial paper spreads and the ABX index indicates that the shock was unanticipated by asset
market participants. Even if some investors or sponsors foresaw potential turmoil, the exclusion
restriction is valid as long as loan origination was unaffected until after the shock. Origination
volumes, interest rates, and loan characteristics indicate this was the case.
To confirm that the exclusion restriction is a reasonable assumption, I plot mortgage origina-
tions by month in Fig. 3. Jumbo originations tracked non-jumbo originations and stayed in the
neighborhood of 30,000 originations per month until August of 2007. Jumbo lending then dramat-
2Markit ABX indices track the prices of credit default swaps on underlying mortgage backed securities. See
Stanton and Wallace (2011) for more information.
9
ically fell in September of 2007 while non-jumbo lending (which was largely unaffected by private
securitization) remained steady. This is the response we would expect from an unexpected freeze in
private securitization. The internet appendix (Fig. A1-14) includes plots of loan characteristics by
origination month. This evidence supports the origination volume data in Fig. 3. Loan character-
istics were fairly stable from January to August of 2007, and jumbo and non-jumbo loans followed
similar patterns. Of particular interest, jumbo interest rates tracked non-jumbo interest rates from
January to August of 2007 and then increased in September relative to non-jumbo interest rates,
consistent with a shock to jumbo financing starting in September.
Though the freeze did not affect pre-freeze origination decisions, it did affect the probability
that these mortgages were securitized. Assembling a pool of loans, selling them to an MBS spon-
sor, and closing on an MBS deal often takes a few months. Internet Appendix Table A1 highlights
this lag. Within my sample of January 2007 originations, only 12% of jumbo loans were privately
securitized in their origination month. By two months after origination, 66% were privately secu-
ritized. Private securitization further increased to 79% by six months after origination. As 2007
progressed, less and less time was available to securitize new originations before the freeze. As a
result, the probability of securitization dropped dramatically in the summer of 2007. Fig. 4 plots
private securitization rates six months after origination for jumbo loans in my sample by origi-
nation month. This is essentially the first stage regression for my identification strategy. Jumbo
private securitization rates were around 80% until April and then started to decline, with dramatic
drops in the summer to 65% in June, 54% in July, and 36% in August. Over this time period, the
volume of portfolio loans increased from 6,500 in April to 17,900 in August, consistent with lenders
being stuck holding portfolio loans they had anticipated securitizing. By contrast, non-jumbo GSE
securitization rates remained steady at around 80% throughout 2007.
A drop in originations after August 2007 (Fig. 3) and a decrease in securitization rates for
loans originated in the three months leading up to August 2007 (Fig. 4) is exactly what we would
expect from an unanticipated shock to securitization in August and is diffi cult to reconcile with
other stories. In particular, flat origination volumes are inconsistent with originators anticipating
the freeze or changing lending standards before August. Similarly, jumbo origination volumes and
securitization rates show no signs of being affected by New Century’s collapse and bankruptcy in
March and April of 2007.
10

My baseline empirical strategy is to estimate equations of the form:
Pr (Yi|Delinquencyi) = α+ γSeci +Xiβ3 + εi (1)
using origination month indicator variables as instruments for private securitization (Seci). The
regression is conditional upon loans becoming seriously delinquent. Yi is an indicator for foreclosure
or modification within one year of first serious delinquency. Seci is an indicator for a mortgage
being privately securitized six months after origination. Xi is a vector of observable loan charac-
teristics including MSA and delinquency month fixed effects. The implied linear probability model
accommodates standard IV regression techniques and readily incorporates fixed effects without
biasing coeffi cient estimates (Angrist and Pischke, 2009).
Identification of securitization status in Eq. (1) comes entirely from variation in when a
loan was originated. The implied second stage regression exploits decreasing securitization rates
by origination month leading up to August 2007 as opposed to the actual securitization status of
individual loans. As a result, the identification strategy is robust to securitization being endogenous
and even to securitization selection criteria changing over time.
Strictly speaking, the identification strategy only requires control variables to the extent that
they are correlated with origination month. Delinquency month fixed effects are important because
foreclosure and modification practices changed over time and delinquency month is correlated with
origination month. Other control variables are less important. Nonetheless, I include a rich set
of observable loan characteristics in Xi to increase Eq. (1)’s explanatory power and make it more
directly comparable to previous studies. I control for borrower credit worthiness with an indicator
for origination FICO scores above 680. I include origination loan-to-value (LTV) ratio as well as
an indicator for LTV of exactly 0.8 because mortgages with an LTV of 0.8 are more likely to have
concurrent second-lien mortgages (Adelino, Gerardi, and Willen, 2013). The loan terms I control
for are origination amount (through its log), origination interest rate, an indicator for fixed rate
mortgages, indicators for term lengths, an indicator for mortgage insurance, and an indicator for
option ARM mortgages. I control for the quality of underwriting with indicators for low income
documentation and no income documentation, and I control for loan purpose with indicators for
refinancing, primary residence, and single family homes. I also control for MSA fixed effects.
11
Ideally, I would like to follow Agarwal et al. (2011) and include servicer fixed effects to control
for differences in capabilities and practices across servicers. Unfortunately, the LPS data do not
include servicer identifiers. This is a limitation of the LPS data relative to the OCC-OTS data
used by Agarwal et al. Piskorski, Seru, and Vig (2010) and Adelino, Gerardi, and Willen (2013)
face the same limitation. As with other control variables, servicer fixed effects only matter if they
correlated with origination month.
One potential concern with this identification strategy is that the mortgage lending environ-
ment may have changed over the course of 2007 resulting in differences between origination month
cohorts even though the securitization freeze was unanticipated. Fortunately, I have a natural
control group that was not affected by the securitization freeze. Prime non-jumbo loans are pre-
dominately securitized by the GSEs, and GSE securitization was uninterrupted throughout 2007.
As a robustness check, I control for origination month fixed effects by estimating equations of the
form:
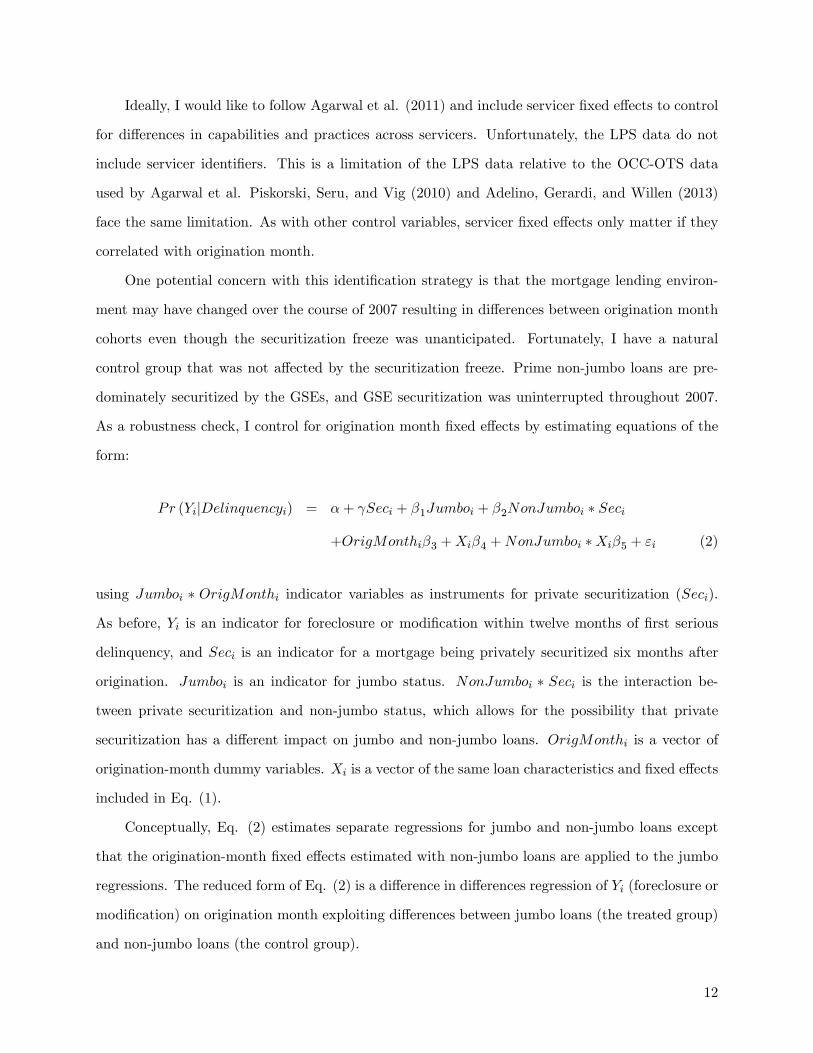
Pr (Yi|Delinquencyi) = α+ γSeci + β1Jumboi + β2NonJumboi ∗ Seci
+OrigMonthiβ3 +Xiβ4 +NonJumboi ∗Xiβ5 + εi (2)
using Jumboi ∗ OrigMonthi indicator variables as instruments for private securitization (Seci).
As before, Yi is an indicator for foreclosure or modification within twelve months of first serious
delinquency, and Seci is an indicator for a mortgage being privately securitized six months after
origination. Jumboi is an indicator for jumbo status. NonJumboi ∗ Seci is the interaction be-
tween private securitization and non-jumbo status, which allows for the possibility that private
securitization has a different impact on jumbo and non-jumbo loans. OrigMonthi is a vector of
origination-month dummy variables. Xi is a vector of the same loan characteristics and fixed effects
included in Eq. (1).
Conceptually, Eq. (2) estimates separate regressions for jumbo and non-jumbo loans except
that the origination-month fixed effects estimated with non-jumbo loans are applied to the jumbo
regressions. The reduced form of Eq. (2) is a difference in differences regression of Yi (foreclosure or
modification) on origination month exploiting differences between jumbo loans (the treated group)
and non-jumbo loans (the control group).
12

The remaining concern is that something changed between January and August of 2007 dif-
ferentially in the jumbo lending environment relative to the non-jumbo lending environment. I
cannot fully rule this out, but the overall evidence (presented in Fig. 3 and the internet appendix)
indicates that jumbo lending was stable and moved in parallel with non-jumbo lending until after
August of 2007. In robustness tests, I control for time-series changes to the lending environment
and limit my analysis to loans that may be less subject to changing unobservable characteristics.
Additionally, monthly changes to foreclosure and modification probabilities track monthly changes
to securitization probability. Even if there were time-series changes specific to jumbo lending, they
are unlikely to rival the large drop in jumbo private securitization rates from 80% in April to 36%
in August.
3. Results
I start by estimating the effect of private securitization on foreclosure and modification in
my baseline sample of jumbo loans that became seriously delinquent by June of 2013. Before
implementing my instrumental variables strategy, I first estimate Eq. (1) with origination month
fixed effects using OLS regressions. Coeffi cient estimates and standard errors (clustered by MSA)
are reported in Table 2. After controlling for observable loan characteristics, seriously delinquent
securitized loans are 8.4 ppt more likely to have foreclosure initiated, 6.1 ppt more likely to have
foreclosure completed, 8.4 ppt less likely to have an imputed modification, and 4.6 ppt less likely to
have a reported modification within a year of becoming seriously delinquent. 97% of sample jumbo
loans are privately securitized or held as portfolio loans so the coeffi cients estimate differences
between these two groups. The samples for the four regressions are identical with two exceptions.
As discussed in the previous section, I can only consistently impute modifications for loans that
report their term to maturity on a monthly basis, and reported modification data start in 2008
and is not available for all servicers. I drop observations for which I do not have modification data,
which decreases the sample size by about 50% for imputed modifications and 30% for reported
modifications.
Like previous studies, my OLS regressions are subject to potential omitted variable bias. The
direction of the bias is theoretically ambiguous. Even assuming securitized loans are unobservably
13
lower quality, the impact of loan quality on foreclosure and modification conditional on delinquency
could be positive or negative. This ambiguity is apparent in the OLS control variable coeffi cient
estimates. Some measures of quality increase foreclosure probability while others decrease it. For
example, a high FICO score increases the probability of foreclosure initiation within six months by
5.1 ppt whereas a low loan-to-value ratio decreases the same probability (see column (1) of Table
2).
Table 3 addresses the omitted variable problem by using origination month to instrument for
jumbo securitization status. Coeffi cients are estimated using two stage least squares. Standard
errors are clustered by MSA. Control variables are the same as in the Table 2 OLS regression
except that origination month is now used as an instrument for private securitization.
Column (1) reports the first stage regression of private securitization on origination month. As
discussed earlier, securitization probability decreased dramatically during the summer of 2007. The
first stage regression shows the same pattern after controlling for observable loan characteristics.
Origination month fixed effects decreased over the course of 2007 with a particularly sharp decline
after May. Origination month is a powerful predictor for securitization. The within-MSA adjusted
R-squared for the first stage regression is 0.25, and the Kleibergen-Paap F statistic is 423. In short,
weak identification is not a problem.
Columns (2) to (5) of Table 3 report instrumental variables estimates for Eq. (1). Conditional
on serious delinquency, private securitization increases the twelve-month probability of foreclosure
initiation by 11.2 ppt and foreclosure completion by 7.5 ppt. Private securitization decreases the
twelve-month probability of imputed modification by 10.9 ppt and decreases the probability of
reported modification by 5.0 ppt. The coeffi cient estimates are all highly statistically significant
and economically large. As percentages of mean rates, the foreclosure initiation coeffi cient is 19%,
the foreclosure completion coeffi cient is 43%, the imputed modification coeffi cient is -78%, and
the reported modification coeffi cient is -33%. Using origination month indicator variables results in
seven instruments for private securitization. The bottom rows of columns (2) to (4) report Hansen’s
J-statistic tests for overidentification, which are insignificant at the 5% level.
Fig. 5 plots baseline sample first stage and reduced form origination month fixed effects for Eq.
(1). Jumbo foreclosure initiation (panel A), foreclosure completion (panel B), imputed modification
(panel C), and reported modification (panel D) origination month fixed effects were fairly constant
14

until April 2007. After April, jumbo foreclosure probability decreased and jumbo modification
probability increased as jumbo private securitization probability (the first stage) decreased. Fig. 5
also plots the reduced form of Eq. (1) for non-jumbo loans. Non-jumbo foreclosure and modification
origination month fixed effects were mostly flat and unrelated to jumbo securitization probability
over the sample period, suggesting that any changes to the lending environment between January
and August of 2007 did not have a major impact on foreclosure and modification practices.
3.1. Robustness checks
The baseline results reported in Table 3 are based on a linear probability model with two stage
least squares regressions. As an alternative specification, I consider bivariate probit models that
jointly estimate securitization status and foreclosure or modification. As discussed by Wooldridge
(2002), this specification implements instrumental variables identification while bounding outcome
(foreclosure or modification) and treatment (securitization) probabilities between 0 and 1 with
probit functions. To avoid biases associated with a large number of fixed effects, I drop the MSA
fixed effects. Columns (1) to (4) of Table 4, Panel A, report marginal effect estimates from the
bivariate probit models. The marginal effects of private securitization on foreclosure initiation (10.5
ppt), foreclosure completion (7.2 ppt), imputed modification (-9.5 ppt), and reported modification
(-5.2 ppt) are all close to my baseline estimates.
Two potential concerns with my baseline empirical strategy are that the jumbo lending envi-
ronment changed between January and August of 2007 or the securitization freeze was anticipated,
particularly late in the sample. The best evidence against these concerns is that the jumbo private
securitization rate stayed stable in the 80-85% range from January to April and then dropped dra-
matically to 36% by August without a significant drop in originations until September (see Fig. 3
and 4). Loan volume would have dropped sooner if the securitization freeze was anticipated, and
other changes to jumbo lending this sudden and large are unlikely especially after controlling for
observable characteristics. Nonetheless, I address the concern by restricting the sample, estimating
origination-month fixed effects with non-jumbo loans, and controlling for time-trends related to
unobservable loan characteristics.
I first consider a restricted sample of loans originated between May and July of 2007. The
probability of securitization dropped significantly over these three months from 77% in May to
15
54% in July, and ending the sample before August reduces the concern that securitization market
changes may have been anticipated at the time of origination. Columns (5) to (8) of Table 4, Panel
A show regression estimates for the restricted sample. The coeffi cient estimates are similar to the
baseline results and remain highly significant even in the reduced sample.
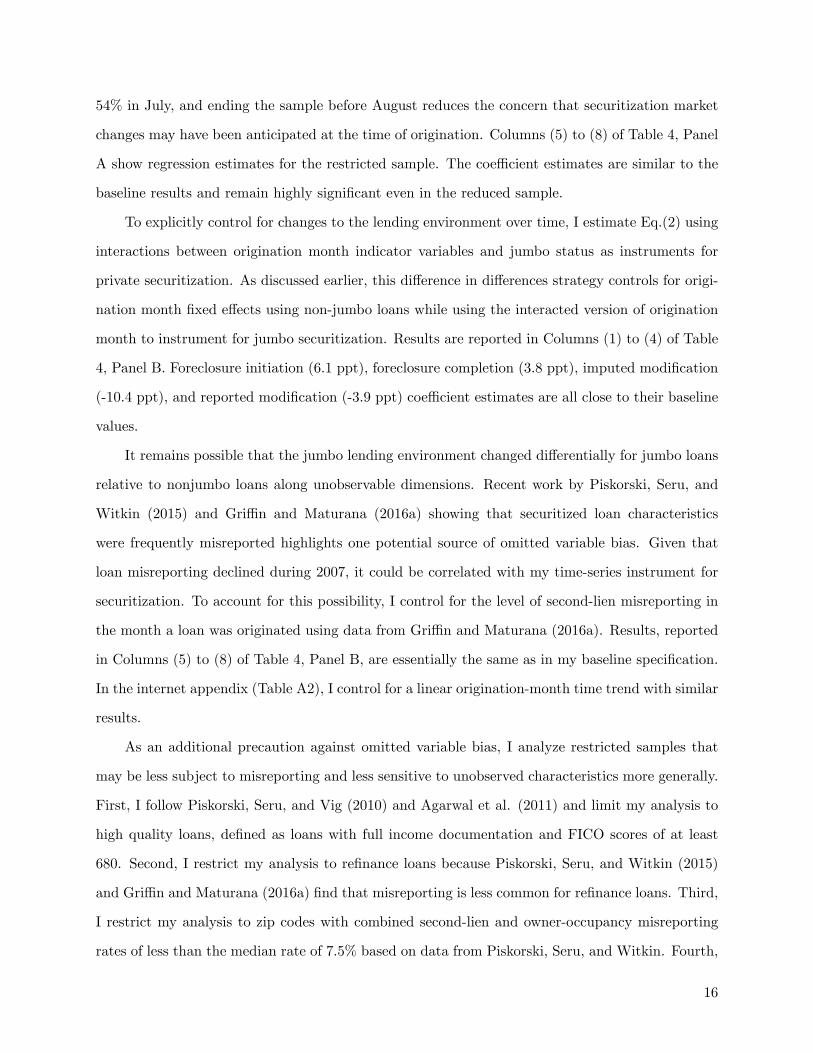
To explicitly control for changes to the lending environment over time, I estimate Eq.(2) using
interactions between origination month indicator variables and jumbo status as instruments for
private securitization. As discussed earlier, this difference in differences strategy controls for origi-
nation month fixed effects using non-jumbo loans while using the interacted version of origination
month to instrument for jumbo securitization. Results are reported in Columns (1) to (4) of Table
4, Panel B. Foreclosure initiation (6.1 ppt), foreclosure completion (3.8 ppt), imputed modification
(-10.4 ppt), and reported modification (-3.9 ppt) coeffi cient estimates are all close to their baseline
values.
It remains possible that the jumbo lending environment changed differentially for jumbo loans
relative to nonjumbo loans along unobservable dimensions. Recent work by Piskorski, Seru, and
Witkin (2015) and Griffi n and Maturana (2016a) showing that securitized loan characteristics
were frequently misreported highlights one potential source of omitted variable bias. Given that
loan misreporting declined during 2007, it could be correlated with my time-series instrument for
securitization. To account for this possibility, I control for the level of second-lien misreporting in
the month a loan was originated using data from Griffi n and Maturana (2016a). Results, reported
in Columns (5) to (8) of Table 4, Panel B, are essentially the same as in my baseline specification.
In the internet appendix (Table A2), I control for a linear origination-month time trend with similar
results.
As an additional precaution against omitted variable bias, I analyze restricted samples that
may be less subject to misreporting and less sensitive to unobserved characteristics more generally.
First, I follow Piskorski, Seru, and Vig (2010) and Agarwal et al. (2011) and limit my analysis to
high quality loans, defined as loans with full income documentation and FICO scores of at least
680. Second, I restrict my analysis to refinance loans because Piskorski, Seru, and Witkin (2015)
and Griffi n and Maturana (2016a) find that misreporting is less common for refinance loans. Third,
I restrict my analysis to zip codes with combined second-lien and owner-occupancy misreporting
rates of less than the median rate of 7.5% based on data from Piskorski, Seru, and Witkin. Fourth,
16

I restrict my analysis to zip codes in which originators with a high incidence of misreporting have
a market share of less than 5% based on data from Griffi n and Maturana (2016b). Fifth, I drop
MSAs with more than a 1% share of total 2007 LPS loan origination volume because Piskorski,
Seru, and Witkin find that MSA loan share is associated with misreporting. Finally, I drop loans
in California, Florida, Nevada, and Arizona because these states exhibited more extreme housing
booms than other parts of the country and Piskorski, Seru, and Witkin find that they have higher
levels of owner-occupany misreporting. Results for all six restricted samples are reported in Table
A2 of the internet appendix. With the exception of foreclosure completion in the sample without
CA, FL, NV, and AZ, all results are close to the baseline coeffi cient estimates and highly statistically
significant.
Table A2 of the internet appendix also reports pre-HAMP results for foreclosure and modi-
fication within six months of delinquency in a sample restricted to loans that became delinquent
within one year of origination. Finally, Table A2 considers: (i) dropping loan characteristic control
variables; (ii) including mortgages that are transferred to non-LPS servicers; (iii) estimating Eq.
(2) without the NonJumboi ∗ Seci interaction term; and (iv) estimating Eq. (2) on a restricted
sample of loans near the jumbo threshold with origination values between $300,000 and $550,000.
Results are consistent with my baseline estimates.
3.2. Long term impact
Private securitization increases the probability of foreclosure and decreases the probability of
modification within twelve months of first serious delinquency. Do these effects also show up in
longer term foreclosure and modification probabilities? How large are the long term effects? What
is the total impact of private securitization on foreclosures?
To answer these questions, I estimate the impact of private securitization on foreclosure and
modification over a three-year analysis window. The analyzed sample includes all jumbo loans that
became seriously delinquent before July of 2011. Table 5 reports the results. Private securitiza-
tion increases the three-year probability of foreclosure initiation by 9.9 ppt, increases three-year
probability of foreclosure completion by 12.3 ppt, decreases the three-year probability of imputed
modification by 11.5 ppt, and decreases the three year probability of reported modification by 6.3
ppt. As a fraction of mean rates for privately securitized jumbo loans, these represent impacts of
17
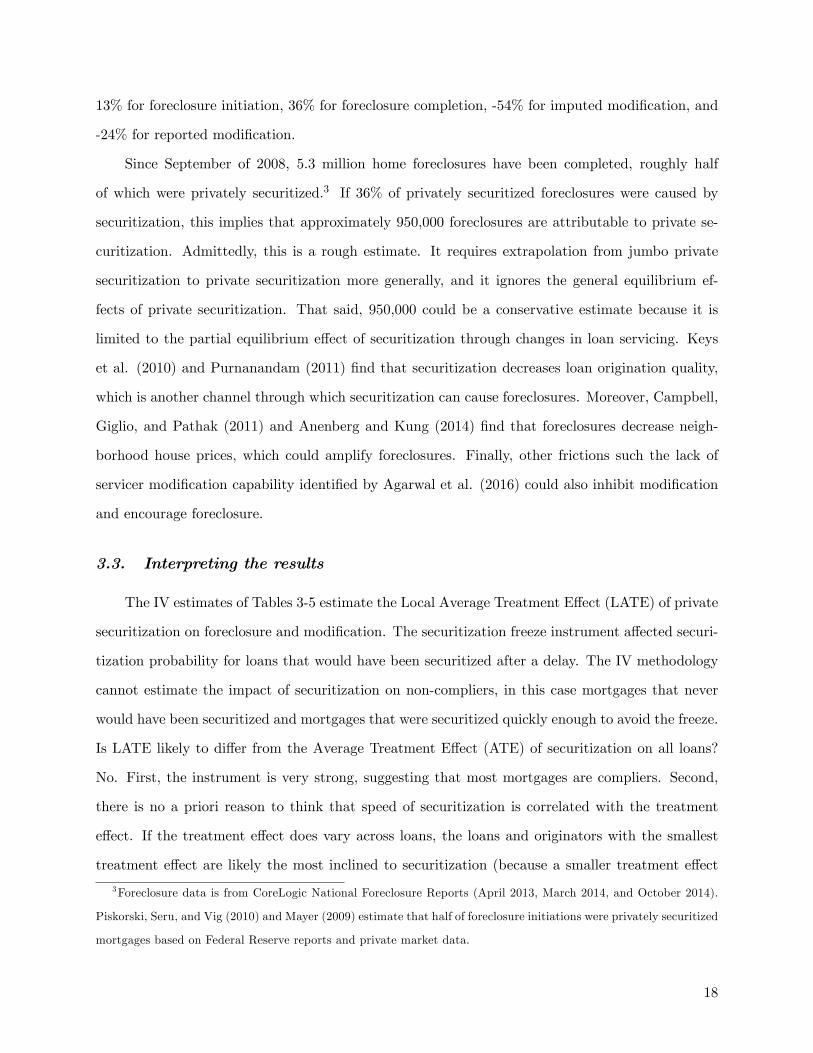
13% for foreclosure initiation, 36% for foreclosure completion, -54% for imputed modification, and
-24% for reported modification.
Since September of 2008, 5.3 million home foreclosures have been completed, roughly half
of which were privately securitized.3 If 36% of privately securitized foreclosures were caused by
securitization, this implies that approximately 950,000 foreclosures are attributable to private se-
curitization. Admittedly, this is a rough estimate. It requires extrapolation from jumbo private
securitization to private securitization more generally, and it ignores the general equilibrium ef-
fects of private securitization. That said, 950,000 could be a conservative estimate because it is
limited to the partial equilibrium effect of securitization through changes in loan servicing. Keys
et al. (2010) and Purnanandam (2011) find that securitization decreases loan origination quality,
which is another channel through which securitization can cause foreclosures. Moreover, Campbell,
Giglio, and Pathak (2011) and Anenberg and Kung (2014) find that foreclosures decrease neigh-
borhood house prices, which could amplify foreclosures. Finally, other frictions such the lack of
servicer modification capability identified by Agarwal et al. (2016) could also inhibit modification
and encourage foreclosure.
3.3. Interpreting the results
The IV estimates of Tables 3-5 estimate the Local Average Treatment Effect (LATE) of private
securitization on foreclosure and modification. The securitization freeze instrument affected securi-
tization probability for loans that would have been securitized after a delay. The IV methodology
cannot estimate the impact of securitization on non-compliers, in this case mortgages that never
would have been securitized and mortgages that were securitized quickly enough to avoid the freeze.
Is LATE likely to differ from the Average Treatment Effect (ATE) of securitization on all loans?
No. First, the instrument is very strong, suggesting that most mortgages are compliers. Second,
there is no a priori reason to think that speed of securitization is correlated with the treatment
effect. If the treatment effect does vary across loans, the loans and originators with the smallest
treatment effect are likely the most inclined to securitization (because a smaller treatment effect
3Foreclosure data is from CoreLogic National Foreclosure Reports (April 2013, March 2014, and October 2014).
Piskorski, Seru, and Vig (2010) and Mayer (2009) estimate that half of foreclosure initiations were privately securitized
mortgages based on Federal Reserve reports and private market data.
18
makes securitization less costly). Thus, if anything LATE is likely conservative relative to ATE.
The treatment itself is also slightly nuanced in the IV regression. Specifically, the IV treatment
is being stuck holding loans intended for securitization. If pre-planning aids portfolio loan servicing
or if the entities stuck holding the loans don’t typically engage in portfolio lending, this treatment
is slightly different from a planned change in securitization practices. To the extent that it matters,
the lack of pre-planning likely decreases an owner’s ability to differentially service portfolio loans,
thereby making the IV estimates conservative.
A final issue of interpretation is how broadly to extrapolate the results. Strictly speaking, my
baseline regressions estimate the impact of private securitization on foreclosure and modification of
jumbo loans originated in 2007. I focus on 2007 originations solely for identification purposes. My
estimates should be valid for jumbo loans originated at other times as well. The estimates are also
informative about private securitization of non-jumbo loans (e.g., subprime loans). Magnitudes may
differ, but the same basic frictions of private securitization likely apply there as well. My results are
less informative about GSE securitization because GSE securitization involves different contracts
and leaves a single entity (the GSE) with full credit exposure for the underlying mortgages.
While my identification strategy is specific to jumbo loans, I can check its external validity
to some extent by estimating OLS regressions on an expanded sample. In the internet appendix
(Table A3), I estimate three-year window regressions on an expanded sample that includes non-
jumbo loans and loans with FICO scores below 620. The coeffi cient estimates are similar to the
Table 5 jumbo IV regressions, supporting my estimate of the overall impact of securitized servicing
in the previous subsection. Table A3 also reports OLS estimates for jumbo and subprime loans
separately with similar results.
3.4. HAMP
To incentivize mortgage modifications and make modification practices more uniform, the
federal government enacted the Home Affordable Modification Program (HAMP) in February of
2009. The program was rolled out over the course of 2009 and was fully operational by the end of the
year. Potential HAMP modifications are evaluated using a standardized NPV test. If the NPV test
indicates that modification is more beneficial to the lender than foreclosure would be, the servicer
employs a four-step waterfall to reduce monthly payments to 31% of income by first capitalizing
19
past-due balances, then reducing interest rates to as low as 2%, then extending loan terms to up to
40 years from the modification date, and then forbearing principal. In 2010, HAMP was expanded
to include principal reductions. Servicers receive $1000 of incentive compensation per HAMP
modification and success fees of up to $1000 per year for three years for performing modifications.
Borrowers can also earn up to $1000 in principal forgiveness per year for five years for keeping
modified mortgages current. HAMP does not override specific contractual restrictions, but it does
create safe harbors for servicers by deeming the HAMP NPV tests to be the appropriate measure
of investor welfare and deeming the waterfall modification methodology to be standard industry
practice. HAMP is a voluntary program, but all major servicers participate, and participating
servicers are required to use HAMP modification guidelines for all qualifying mortgages, whether
they are privately securitized or held as portfolio loans.
HAMP’s effi cacy is the subject of an ongoing debate. For example, Agarwal, et al. (2016)
conclude that HAMP increased modifications but has fallen short of program goals because of
mixed servicer compliance. My instrumental variables methodology does not provide a way to test
whether HAMP succeeded in reducing foreclosures, but I can assess whether it made foreclosure
and modification decisions more uniform across securitized and portfolio loans. Policymakers were
particularly concerned about the perceived bias of securitized loans towards foreclosure and away
from modification. Did HAMP eliminate this bias?
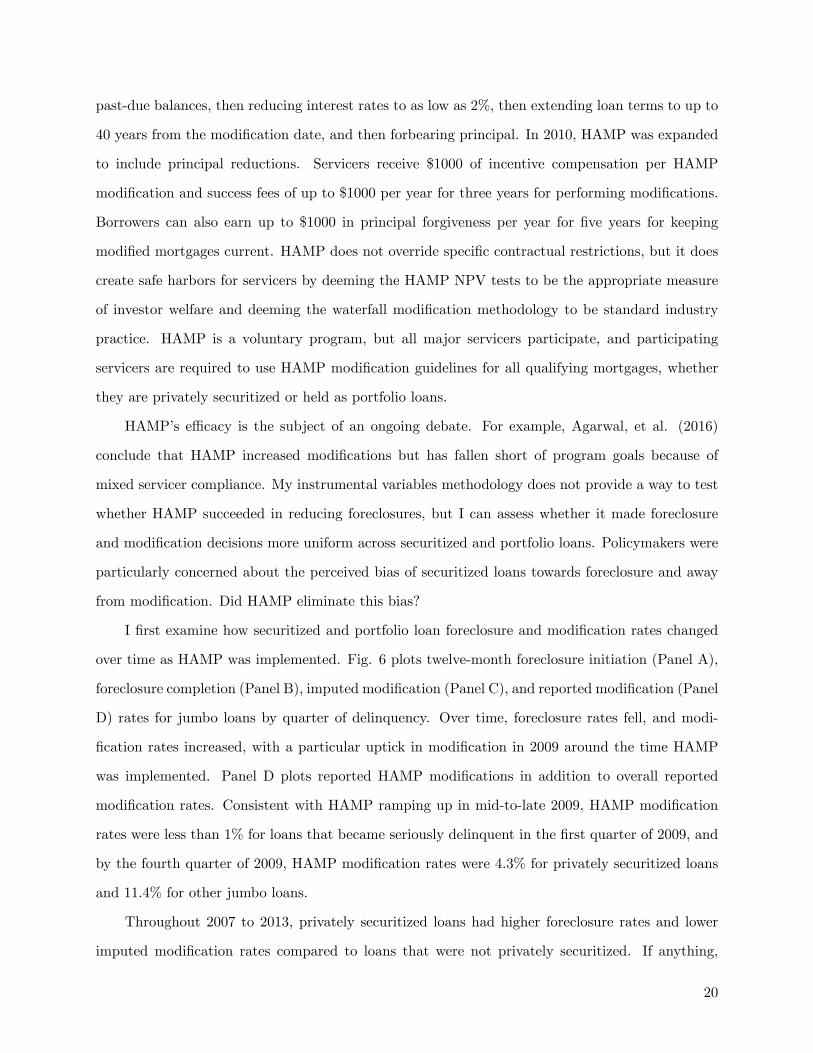
I first examine how securitized and portfolio loan foreclosure and modification rates changed
over time as HAMP was implemented. Fig. 6 plots twelve-month foreclosure initiation (Panel A),
foreclosure completion (Panel B), imputed modification (Panel C), and reported modification (Panel
D) rates for jumbo loans by quarter of delinquency. Over time, foreclosure rates fell, and modi-
fication rates increased, with a particular uptick in modification in 2009 around the time HAMP
was implemented. Panel D plots reported HAMP modifications in addition to overall reported
modification rates. Consistent with HAMP ramping up in mid-to-late 2009, HAMP modification
rates were less than 1% for loans that became seriously delinquent in the first quarter of 2009, and
by the fourth quarter of 2009, HAMP modification rates were 4.3% for privately securitized loans
and 11.4% for other jumbo loans.
Throughout 2007 to 2013, privately securitized loans had higher foreclosure rates and lower
imputed modification rates compared to loans that were not privately securitized. If anything,
20

differences between privately securitized and portfolio loans increased over time, particularly for
foreclosure completion and imputed modification. However, the story for reported modifications
is less clear. In early 2008, privately securitized loans were half as likely to receive a reported
modification (5.4% compared to 10.6%). By contrast, 2010 reported modification rates were the
same for securitized and non-securitized loans, suggesting that HAMP may have closed the gap
in reported modification rates. On the other hand, reported HAMP modifications were lower for
privately securitized loans in 2010, and overall reported modifications for privately securitized loans
again dropped below other loans in 2011.
To more formally assess differences between privately securitized loans and other loans over
time, I repeat my baseline empirical strategy on sub-samples of jumbo loans split by the year in
which they became delinquent. Table 6 reports the results. Foreclosure initiation coeffi cients (Panel
A) had no clear trend over time. Foreclosure completion coeffi cients (Panel B) declined in 2009 and
then increased, both overall and as a percentage of mean foreclosure completion rates. Imputed
modification coeffi cients (Panel C) grew throughout 2007 to 2012 but were reasonably stable as a
percentage of mean imputed modification rates, which also grew during this time period. With
the exception of the reduced sample size in 2013, private securitization increased foreclosure and
decreased imputed modification probability by statistically significant and economically meaningful
amounts in all years.4 In short, there is no evidence that HAMP eliminated the bias of privately
securitized loans toward foreclosure and away from imputed modification. By contrast, reported
modification coeffi cients (Panel D) shrank after 2009 and are statistically indistinguishable from
zero after 2010.
Direct comparisons between pre-HAMP and post-HAMP coeffi cients are somewhat problematic
because it is not clear exactly what the counterfactuals should be. Even aside from HAMP policy
changes, the regressions consider different time periods and the loans analyzed have different ages.
To test whether HAMP changed the effect of securitization on foreclosure and modification, I follow
Agarwal et al. (2016), and exploit the fact that loans with a principal balance of over $729,750
are not eligible for HAMP modifications. Specifically, I estimate triple difference OLS regressions
comparing the effect of private securitization on foreclosure and modification rates before and after
4The sample ends with June 2013 delinquencies because I analyze one-year foreclosure and modification rates, and
my loan data ends in June of 2014.
21
HAMP for loans below and above the principal limit as of the time of their delinquency. To avoid
inference challenges due to HAMP’s gradual phase in, I drop loans that became delinquent in 2009
and use 2008 delinquencies as my pre-HAMP sample and 2010 delinquencies as my post-HAMP
sample.
Table 7 reports the results. The primary coeffi cient of interest is the triple interaction of private
securitization, post-HAMP, and principal balance below $729,750. For foreclosure completion, this
coeffi cient is a highly significant -7.7 ppt, suggesting that HAMP mitigated the tendency of privately
securitized loans to have higher foreclosure rates for qualified loans. While HAMP mitigated the
effect of private securitization on foreclosure completion, it did not eliminate it. To calculate the
effect of private securitization on foreclosure completion for loans under $729,750 in 2010, one needs
to add the private securitization, private securitization ∗ post, private securitization ∗ (principal <=
$729,750), and triple-interaction coeffi cients for a total effect of 5.9 ppt. Though not statistically
significant, foreclosure initiation also has a negative triple interaction coeffi cient. The modification
triple-interaction coeffi cients are both close to zero and statistically insignificant, but with standard
errors of 2.1 ppt for imputed modifications and 1.9 ppt for reported modifications, I cannot rule
out moderate effects. In the internet appendix (Table A4), I repeat the same regressions using
HAMP’s owner-occupancy requirement as an alternative eligibility cutoff with similar results.
The evidence suggests that HAMP led to more consistent reported modification rates and more
consistent foreclosure completion rates for qualifying loans, but the overall bias of privately securi-
tized loans toward foreclosure and away from imputed modification persisted even after HAMP.
3.5. Modification details and effectiveness
In addition to impacting the probability of modification, securitization also affects how loans
are modified. Some securitized servicing contracts place limits on principal and interest reductions
and term extensions. Further, servicers of securitized loans may have an incentive to keep delinquent
loans alive longer through principal-increasing modifications that capitalize past due balances.
Finally, servicers of securitized loans may have less incentive to invest in thoughtful screening and
negotiation to give modifications the best chance of successfully preventing future default. Agarwal,
et al. (2011) test these predictions with OLS regressions of modification terms and redefault rates
on securitization status and find that privately securitized loans are modified more generously
22

but have higher redefault rates. Zhang (2013) also estimates that redefault rates are higher for
securitized loans.
To assess the impact of securitization on modification terms, I employ my IV regression strategy
on the subset of delinquencies that are modified. For this analysis I include all jumbo loans that
became seriously delinquent before 2014 and had an imputed modification within twelve months
of delinquency. First, I consider indicators for different types of modifications as my dependent
variables, thereby estimating the probability of a certain type of modification conditional on there
being a modification of some kind. Except for the different sample and dependent variables, the
regressions are identical to my previous IV regressions. Panel A of Table 8 reports the results.
Securitization decreases the incidence of interest modifications, term extensions, and principal
decreases, and increases the incidence of principal increases.
I also consider how securitization affects net changes to interest rates, term lengths, principal
balances, and monthly payments. Panel B of Table 9 reports results for regressions of net changes
on the same variables considered in Panel A. In contrast to Agarwal et al.’s (2011) results, I
find that privately securitized modifications are less concessionary across all terms. Securitized
modifications have smaller interest rate cuts (by 27 bps), shorter term extensions (by 78 months),
smaller principal decreases (by 2.1%), and smaller payment decreases (by 4.9%).
Finally, I compare the effectiveness of securitized and portfolio modifications by analyzing the
probability of redefault (return to 60+ day delinquency) in the twelve months following imputed
modifications that cured delinquencies. Table 9 reports the results. In column (1), I estimate an
IV regression of redefault on private securitization and control variables in the full sample of jumbo
loans. Redefault is 7.0 ppt higher for privately securitized loans (compared to a mean redefault rate
of 23%). This result is consistent with the redefault differences of Agarwal et al. (2011) and Zhang
(2013). The higher redefault rate of securitized modifications is partially explained by the types
of modifications employed. Column (2) includes controls for modification type. This decreases
the private securitization coeffi cient to 4.1 ppt. Interest decreases, term extensions, and principal
decreases are associated with lower redefault rates.
23
3.6. Comparison to previous literature
My results support Piskorski, Seru, and Vig’s (2010) finding that securitization increases fore-
closure rates and Agarwal, et al.’s (2011) finding that securitization decreases modification rates
and contrast with Adelino, Gerardi, and Willen’s (2013) finding that modification rates are sim-
ilar for securitized and portfolio loans. My analysis differs from previous studies in that I use a
longer time series, different sample, and different source of variation in securitization status. Thus,
my results provide strong confirmation that securitized mortgage servicing has a causal impact on
modifications and foreclosures that is economically large and has persisted over time.
In contrast to the low modification rates reported by Adelino, Gerardi, and Willen (2013) prior
to 2008, modification is reasonably common following the financial crisis. In my sample, 14% of
delinquent loans are modified within one year of delinquency, and 25% are modified within three
years. This is consistent with modification rates rising, as shown by Adelino, Gerardi and Willen.
Further highlighting the importance of modifications, Keys et al. (2013) show that 4 million loans
were modified during the recent crisis, most of which were performed without government support.
As a result, frictions inhibiting modification of securitized loans have a large economic effect.
Adelino, Gerardi, and Willen (2013) advocate using a sample that ends in September of 2008
because government intervention in the mortgage market may have increased after Lehman Brothers
declared bankruptcy. I find that securitization decreases modification rates and increases foreclosure
rates even for loans that became delinquent in 2007. Specifically, Table 10 shows that for 2007
delinquencies, securitization increases foreclosure initiation within one year by 8.7 ppt (10% of
the mean), increases foreclosure completion within one year by 5.4 ppt (12% of the mean), and
decreases imputed modification within one year by 2.5 ppt (132% of the mean). This is consistent
with Agarwal, et al.’s (2011) finding that securitization decreases modification rates for loans that
became delinquent both early and late in 2008. In contrast, Adelino, Gerardi, and Willen (2013)
find that securitization does not decrease modification in a sample that ends in September of 2008.
Limited government intervention in the fourth quarter of 2008 is unlikely to drive the one-year
regression results for my sample of 2007 delinquencies. To confirm this is the case, in Table A5 of
the internet appendix I repeat the 2007 delinquency regressions using only modifications that were
completed by September of 2008. Results are close to those reported in Table 10, indicating that
24
securitization’s impact on modification and foreclosure predates the Lehman Brothers bankruptcy.
Given the different methodologies, samples, and time periods involved, my estimates are re-
markably consistent with Piskorski, Seru and Vig (2010) and Agarwal et al. (2011). For example,
Piskorski, Seru, and Vig find that securitization increases foreclosure probability by 4-7 ppt, and
Agarwal et al. find that securitization decreases reported modification probability by 4.2 ppt. My
baseline estimates for these outcomes in Table 3 are 7.5 ppt and -5.0 ppt, respectively. As a per-
centage of mean foreclosure rates for securitized mortgages, Piskorski, Seru and Vig’s coeffi cients
range from 18% to 33%. Applying the methodology described in Section 3.2, this implies 500,000
to 850,000 foreclosures were caused by securitization, which is similar to the 950,000 foreclosures
my estimates attribute to securitization.
4. Mechanism
The preceding section establishes that privately securitized loans are foreclosed more and
modified less than comparable portfolio loans. Why do servicers treat securitized loans and portfolio
loans differently?
Securitized mortgages are owned by passive trusts on behalf of dispersed investors and managed
by servicers subject to servicing contracts. As in other principal-agent settings, servicing practices
can deviate from investor interests either because of contract rigidity or because servicer incentives
differ from investor incentives. Servicer ownership of mortgage backed securities potentially miti-
gates incentive problems, but principal-agent incentive differences are inherent to the economics of
securitization as long as servicers have less than complete ownership of the mortgages. Moreover,
Huang and Nadauld (2014) find that equity retention promotes modifications that are harmful to
investors.
To better understand how securitization affects mortgage servicing, I hand collect the con-
tractual terms of servicing agreements and link these terms to loan-level data on modifications
and foreclosures. I find that servicing agreements universally incentivize foreclosure over modifica-
tion and other effort-intensive loss mitigation practices. Binding modification restrictions are less
common and have a moderate impact on foreclosure probabilities.
25
4.1. Servicing practices
Foreclosure and modification are not binary responses to delinquency. Servicers have a wide
range of loss mitigation options. For example, Fannie Mae’s 2006 Servicing Guide describes notifica-
tion letters, telephone calls, face-to-face interviews, debt collection, partial payments, delinquency
counseling, grace periods, forbearance agreements, repayment plans, short sales, and deeds-in-lieu
of foreclosure in addition to formal loan modification and foreclosure. Choosing among these alter-
natives requires significant servicer discretion, and most options involve personal interaction with
borrowers. Securitization can bias whether and how all of these options are used.
Servicer automation and loss mitigation capacity further complicate delinquent loan servicing.
Whereas modification and informal loss mitigation require significant discretion, foreclosure can be
largely outsourced and automated. Levitin and Twomey (2011) describe this automation and argue
that heavy reliance on automation left servicers ill-equipped to deal with rising delinquency rates.
Similarly, Agarwal, et al. (2016) find that lack of organizational capability significantly impeded
HAMP modifications.
4.2. Servicing agreements
Securitized mortgage servicing is governed by servicing agreements, which are incorporated
into more general pooling and servicing agreements (PSAs). To understand how these agreements
operate, I hand collect and analyze the terms of PSAs. My sample consists of all prime MBS deals
between January and August of 2007 that exceeded one billion dollars. Thirty seven deals meet
this criteria, collectively representing $70 billion, which is 48% of total prime MBS issuance during
this period based on data from Inside Mortgage Finance. The sample covers nine deal sponsors
and seven servicers.
Table 10 summarizes the PSA servicing terms. Servicers generally have broad authority for
managing loans coupled with responsibility to follow accepted industry practices. Servicers bear
most costs of servicing the loans and are compensated with a servicing fee, which is typically around
25 bps annualized for prime mortgages. The PSAs universally establish a responsibility to foreclose
on suffi ciently delinquent loans and provide reimbursement for foreclosure expenses. They allow
foreclosure to be postponed or avoided if it is not in the best interest of certificate-holders, but this
26
is always an exception to the general rule of foreclosure.
Servicers have discretion to pursue modifications and other loss mitigation alternatives, but
they have little direct incentive to do so because these tools require unreimbursable expenses.
Modification and other loss mitigation practices are never explicitly required and are not reimbursed
through regular loan payments or by the trust. The closest the PSAs come to requiring modification
is a term in seven deals that requires the servicer to “consider”alternatives to foreclosure. In lieu
of reimbursement from the trust, servicers are allowed to charge borrowers a modification fee. This
is explicit in 22% of PSAs and implicit in the other PSAs by virtue of Fannie Mae’s 2006 servicing
guide allowing servicers to charge borrowers a $500 modification fee and some modification-related
expenses.
PSAs frequently limit modifications to mortgages in or near default and sometimes require
that modified loan values exceed expected foreclosure proceeds, but modification prohibitions are
uncommon. Some PSAs restrict specific types of modifications. Decreasing principal balances or
permanently decreasing interest rates is prohibited by 22% of PSAs, and increasing loan matu-
rity beyond the maturity of other loans in the trust or the maturity of the trusts’certificates is
prohibited by 14% of PSAs. Most PSAs lack these restrictions, and many kinds of modifications
are permitted even when they are present. For example, temporary interest rate reductions and
principal forbearance are permitted under all of the PSAs.
This is the largest survey of PSA terms that I am aware of and is the only one that focuses
on prime MBS. Three studies survey subprime modification restrictions with similar results. Hunt
(2009) finds that 67% of subprime deals limit modifications to loans in default or where default is
foreseeable or imminent and 10% prohibit modifications. Credit Suisse (2007) finds that nearly all
PSAs permit modification of loans in default or where default is reasonably foreseeable. Finally, a
Bear Stearns study described by Bajaj (2007) and Hunt (2009) finds that only 10% of deals prohibit
modifications. Thompson (2011) reviews the evidence on PSA terms and concludes that PSAs
generally permit modification but incentivize foreclosure. In their internet appendix, Piskorski,
Seru, and Vig (2010) describe the early payment default buyback terms of subprime MBS deals.
27

4.3. PSA term regressions
To assess how modification restrictions affect servicer behavior, I link PSAs to individual loans
in Core Logic panel data. For comparability to my earlier analysis, I limit the sample to jumbo
loans and impose the restrictions described in Section 3.5 As described in Table 11, the linked data
include 85,000 loans with an aggregate origination value of $60 billion. The loans are similar to
the jumbo loans analyzed in Section 4 but default less. This difference may stem from the linked
sample being entirely from prime MBS whereas my earlier sample included all jumbo mortgages
with FICOs above 620. My analysis focuses on 21 thousand loans that became seriously delinquent
between 2007 and 2013. Foreclosure and modification rates are similar to the baseline sample.
Foreclosure is defined and identified as before. Imputed modification is the same as before except
that I cannot identify term extensions in the Core Logic data. Thus, term modifications are missing
from the PSA-linked data. I do not have servicer modification reports for the Core Logic data so
my modification analysis in this section is limited to imputed modifications.
I regress foreclosure initiation, foreclosure completion, and imputed modification within twelve
months of first serious delinquency on indicators for prohibitions of (1) permanent principal and
interest reductions and (2) term extensions beyond the term of the MBS certificates or other
mortgages. If these terms bind, we should expect them to reduce modifications and increase
foreclosures. The regressions are OLS and include the same control variables as previous regressions
plus servicer fixed effects. The servicer fixed effects are important because PSA terms vary across
servicers and previous studies [e.g., Agarwal, et al. (2011) and Agarwal, et al. (2016)] find that
servicers employ different modification and foreclosure practices. An important caveat is that
within-servicer PSA term variation is limited to two servicers. Servicer A has prohibitions of
permanent principal and interest reductions in the seven deals it sponsors but not in the three
deals it services for other sponsors. Servicer B has prohibitions on term extensions in the four deals
it sponsors but not in the three deals it services for other sponsors.
5Core Logic mortgage data is similar to the LPS data used for my previous analysis but is limited to privately
securitized mortgages. Unlike LPS, Core Logic contains identifiers for servicers, originators, and deals, which allows
me to link loans to PSAs. Sample selection is the same as for the LPS sample except that I do not require loans to
enter the dataset within four months of origination and I do not require loans to be originated in 2007. Survivor bias
is not an issue in the Core Logic data because all loans enter the dataset when a deal closes.
28
Table 12 reports the results. Prohibitions on permanent principal and interest reductions are
associated with increased foreclosure (14.0 ppt for foreclosure initiation and 11.4 ppt for foreclosure
completion). Prohibitions on term extensions are also associated with increased foreclosure (6.8
ppt for foreclosure initiation and 7.0 ppt for foreclosure completion). Point estimates suggest
that both restrictions reduce imputed modifications, but the effects (-2.8 ppt and -3.6 ppt) are
smaller and statistically insignificant. Because I am unable to identify modifications that solely
extend mortgage terms, this likely underestimates the full impact of modification restrictions on
modification probability. These results are directionally what we should expect. However the
magnitudes are too small to explain overall foreclosure and modification differences. For example,
the -2.8 ppt and -3.6 ppt modification effects applied to the 22% and 14% of securitized loans with
these terms explain -1.1 ppt of the -10.9 ppt baseline imputed modification effect for securitized
loans. Similarly, the foreclosure coeffi cient estimates, combined with the incidence of these terms
explain 35% of the foreclosure initiation securitization effect and 45% of the foreclosure completion
securitization effect.
5. Conclusion
This paper’s contribution is fourfold. First, I use a long time series to reassess the quanti-
tative importance, persistence, and economic significance of securitization’s effect on foreclosure
and modification in the aftermath of the financial crisis. Private securitization increases foreclo-
sure probability (by 11.2 ppt for foreclosure initiation and 7.5 ppt for foreclosure completion) and
decreases modification probability (by 10.9 ppt for imputed modifications and 5.0 ppt for reported
modifications), and when securitized loans are modified, the modifications tend to be less conces-
sionary and more prone to redefault. Second, I assess how the effect of securitization on foreclosure
and modification changed over time, including periods before and after government intervention.
The Home Affordable Modification Program (HAMP) succeeded to some extent at mitigating dif-
ferences in reported modification and foreclosure completion rates between securitized and portfolio
loans. However, securitization continued to increase foreclosure probability and decreased imputed
modification probability throughout 2007 to 2012, even after implementation of HAMP in 2009.
Third, I base these conclusions on a new identification strategy that exploits the freeze of private
29

securitization markets starting in August of 2007. Because my results are based on an entirely new
source of variation, they provide strong confirmation that the effect of securitization on foreclosure
and modification is causal. Finally, I describe the mechanisms through which securitization effects
foreclosure and modification, highlighting that incentive differences are at least as important as
contractual prohibitions.
The tendency of securitized loans to be foreclosed and not modified helps to explain why
foreclosure is so prevalent. In my sample of 2007 jumbo mortgages, 36% of privately securitized
foreclosure completions within three years of serious delinquency are attributable to securitized ser-
vicing. Extrapolated to all privately securitized mortgages, this adds up to approximately 950,000
of the 5.3 million foreclosures experienced since the start of the financial crisis. Securitization does
not explain all foreclosures, but many foreclosures would have been prevented if mortgages had been
held directly on bank balance sheets instead of being securitized. Moreover, this effect is purely
from securitization’s impact on mortgage servicing, which is additive to securitization’s impact on
loan origination quality.
The differential treatment of securitized and portfolio loans serves as an example of how own-
ership structure can affect how assets are managed. Despite contracts designed to protect MBS
investors from differential servicing treatment, securitized loans are systematically foreclosed more
and modified less. This is an important factor in the debate about securitized lending both in the
mortgage market and elsewhere. Sub-optimal servicing is a cost of securitization that should be
considered for both regulatory reforms and improvements to private contracts.
Finally, a word about welfare. In a first-best world where all loans are optimally managed,
a loan’s ownership status should not affect foreclosure and modification decisions. Thus, my re-
sults reject the hypothesis that mortgage servicing is effi cient. However, this does not mean that
eliminating securitization would make servicing perfectly effi cient. Portfolio lending is also subject
to principal-agent problems, and externalities (particularly for foreclosure) could drive a wedge
between private and social welfare. My results show the effect of adding a layer of principal-agent
conflict through securitization and highlight a mechanism that has increased foreclosure rates. This
understanding is critical for achieving the policy goal of reducing foreclosures, but it does not pin
down what the policy goal should be. The private and social costs and benefits of foreclosure and
modification remain important topics for future research to address the broader welfare question.
30
References
Acharya, V., Schnabl, P., Suarez, G., 2013. Securitization without risk transfer. Journal of Financial
Economics 107, 515—536.
Adelino, M., Gerardi K., Willen, P., 2013. Why don’t lenders renegotiate more home mortgages?
Redefaults, self-cures and securitization. Journal of Monetary Economics 60, 835—853.
Agarwal, S., Amromin, G., Ben-David, I., Chomsisengphet, S., Evanoff, D., 2011. The role of
securitization in mortgage renegotiation. Journal of Financial Economics 102, 559—578.
Agarwal, S., Amromin, G., Ben-David, I., Chomsisengphet, S., Piskorski, T., Seru, A., 2016.
Policy intervention in debt renegotiation: evidence from the Home Affordable Modification
Program. Journal of Political Economy, forthcoming.
Agarwal, S., Chang, Y., Yavas, A., 2012. Adverse selection in mortgage securitization. Journal of
Financial Economics 105, 640—660.
Anenberg, E., Kung, E., 2014. Estimates of the size and source of price declines due to nearby
foreclosures. American Economic Review 104, 2527—2551.
Angrist, J., Pischke, J., 2009. Mostly Harmless Econometrics: An Empiricist’s Companion. Prince-
ton University Press, Princeton, NJ.
Bajaj, V., 2007. For some subprime borrowers, few good choices. The New York Times, March 22.
Bernstein, S., 2015. Does going public affect innovation? Journal of Finance 70, 1365—1403.
Calem, P., Covas, F., Wu, J., 2013. The impact of the 2007 liquidity shock on bank jumbo mortgage
lending. Journal of Money, Credit, and Banking 45, 59—91.
Campbell, J., Giglio, S., Pathak, P., 2011. Forced sales and house prices. American Economic
Review 101, 2108—2131.
Cordell, L., Dynan, K., Lehnert, A., Liang, N., Mauskopf, E., 2008. The incentives of mortgage ser-
vicers: myths and realities. Unpublished working paper. Board of Governors of the Federal
Reserve System.
CoreLogic, 2013. National foreclosure report for April 2013.
31

CoreLogic, 2014a. National foreclosure report for March 2014.
CoreLogic, 2014b. National foreclosure report for October 2014.
Credit Suisse, 2007. The day after tomorrow: payment shock and loan modifications.
Fannie Mae, 2006. Servicing guide.
Foote, C., Gerardi, K., Goette, L., Willen, P., 2009. Reducing foreclosures: no easy answers. NBER
Macroeconomics Annual 24, 89—138.
Fuster, A., Vickery, J., 2015. Securitization and the fixed-rate mortgage. Review of Financial Studies
28, 176—211.
Gelpern, A., Levitin, A., 2009. Rewriting Frankenstein contracts: the workout prohibition in resi-
dential mortgage-backed securities. Southern California Law Review 82, 1077—1152.
Ghent, A., 2011. Securitization and mortgage renegotiation: evidence from the Great Depression.
Review of Financial Studies 24, 1814—1847.
Griffi n, J., Maturana, G., 2016a. Who facilitated misreporting in securitized loans? Review of
Financial Studies 29, 384—419.
Griffi n, J., Maturana, G., 2016b. Did dubious mortgage origination practices distort house prices?
Review of Financial Studies 29, 1671—1708.
Hunt, J., 2009. What do subprime securitization contracts actually say about loan modification?
Preliminary results and implications. Yale Journal on Regulation 31, 11—24.
Huang, Y., Nadauld, T., 2014. A direct test of agency theories of debt. Unpublished working paper.
Brigham Young University.
Inside Mortgage Finance, 2008. The Mortgage Market Statistical Annual for 2008. Inside Mortgage
Finance Publications, Bethesda, MD.
Jiang, W., Nelson, A., Vytlacil, E., 2014. Securitization and loan performance: a contrast of ex ante
and ex post relations in the mortgage market. Review of Financial Studies 27, 454—483.
Marcin, K., Schnabl, P., 2010. When safe proved risky: commercial paper during the financial crisis
of 2007-2009. Journal of Economic Perspectives 24, 29—50.
32

Keys, B., Mukherjee, T., Seru, A., Vig, V., 2010. Did securitization lead to lax screening? Evidence
from subprime loans. The Quarterly Journal of Economics 125, 307—362.
Keys, B., Piskorski, T., Seru, A., Vig, V., 2013. Mortgage financing in the housing boom and bust.
In: Glaeser, E., Sinai, T. (Ed.), Housing and the Financial Crisis. University of Chicago
Press, Chicago, IL, 143—204.
Levitin, A., Twomey, T., 2011. Mortgage servicing. Yale Journal on Regulation 28, 1—90.
Maturana, G., 2016. When are modifications of securitized loans beneficial to investors? Unpublised
working paper. Emory University.
Mayer, C., 2009. Testimony of Dr. Christopher J. Mayer. House Committee on the Judiciary,
January 22.
Mayer, C., Morrison, E., Piskorski, T., 2009. New proposal for loan modifications. Yale Journal on
Regulation 26, 417—429.
Piskorski, T., Seru, A., Vig, V., 2010. Securitization and distressed loan renegotiation: evidence
from the subprime mortgage crisis. Journal of Financial Economics 97, 369—397.
Piskorski, T., Seru, A., Witkin, J., 2015. Asset quality misrepresentation by financial intermediaries:
evidence from the RMBS market. Journal of Finance 70, 2635—2678.
Posner, E., Zingales, L., 2009. A loan modification approach to the housing crisis. American Law
and Economics Review 11, 575—607.
Purnanandam, A., 2011. Originate-to-distribute model and the subprime mortgage crisis. Review
of Financial Studies 24, 1881—1915.
Rajan, U., Seru, A., Vig, V., 2015. The failure of models that predict failure: distance, incentives
and defaults. Journal of Financial Economics 115, 237—260.
Roshak, K., 2015. Mortgage restructurings and regulatory arbitrage: evidence from the JOBS Act.
Unpublished working paper. University of Houston.
Stanton, R., Wallace, N., 2011. The bear’s lair: index credit default swaps and the subprime
mortgage crisis. Review of Financial Studies 24, 3250—3280.
33
Thompson, D., 2011. Foreclosing modifications: how servicer incentives discourage loan modifica-
tions. Washington Law Review 86, 755—840.
White, A., 2009. Deleveraging the American homeowner: the failure of 2008 voluntary mortgage
contract modifications. Connecticut Law Review 41, 1107—1132.
Wooldridge, J., 2002. Econometric Analysis of Cross Section and Panel Data. MIT Press, Cam-
bridge, MA.
Zhang, Y., 2013. Does loan renegotiation differ by securitization status? A transition probability
study. Journal of Financial Intermediation 22, 513—527.
Zingales, L., 2008. Plan B. Economists’Voice 5, article 4.
34
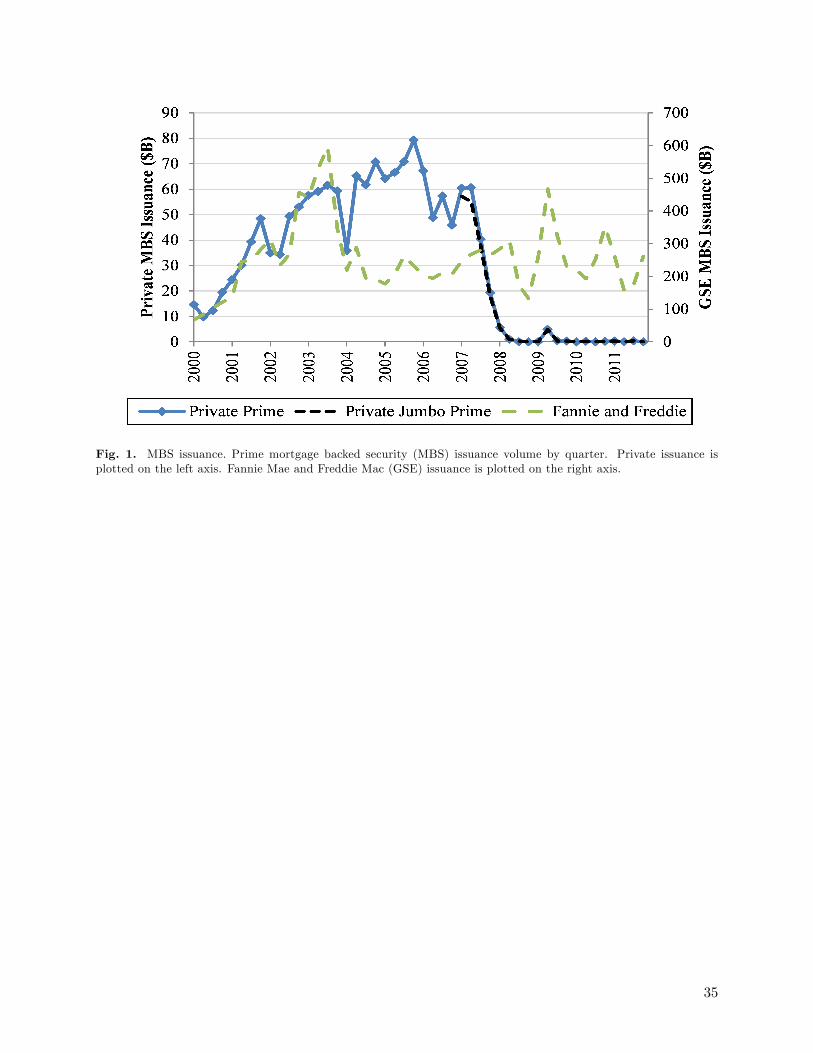
Fig. 1. MBS issuance. Prime mortgage backed security (MBS) issuance volume by quarter. Private issuance isplotted on the left axis. Fannie Mae and Freddie Mac (GSE) issuance is plotted on the right axis.
35

Fig. 2. ABX price index. Daily prices of the Markit ABX.HE.06-1 AAA index, which consists of Credit DefaultSwaps (CDS) on AAA supbrime MBS issued in the second half of 2005.
36
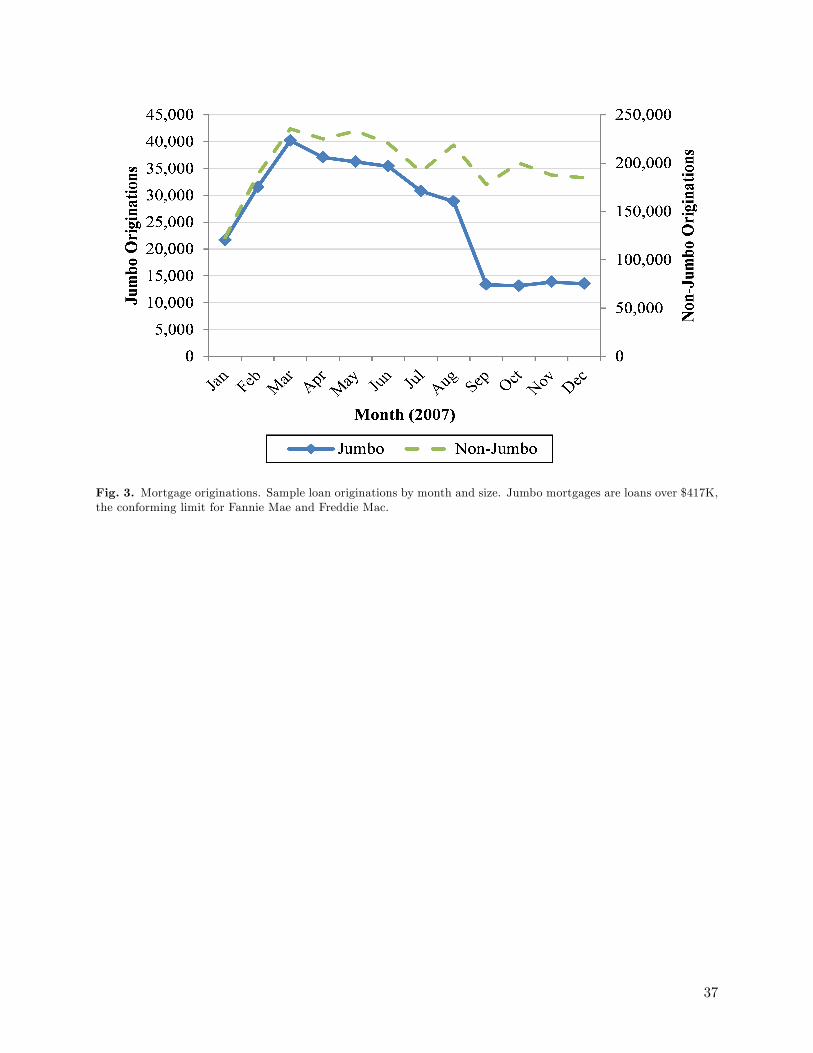
Fig. 3. Mortgage originations. Sample loan originations by month and size. Jumbo mortgages are loans over $417K,the conforming limit for Fannie Mae and Freddie Mac.
37
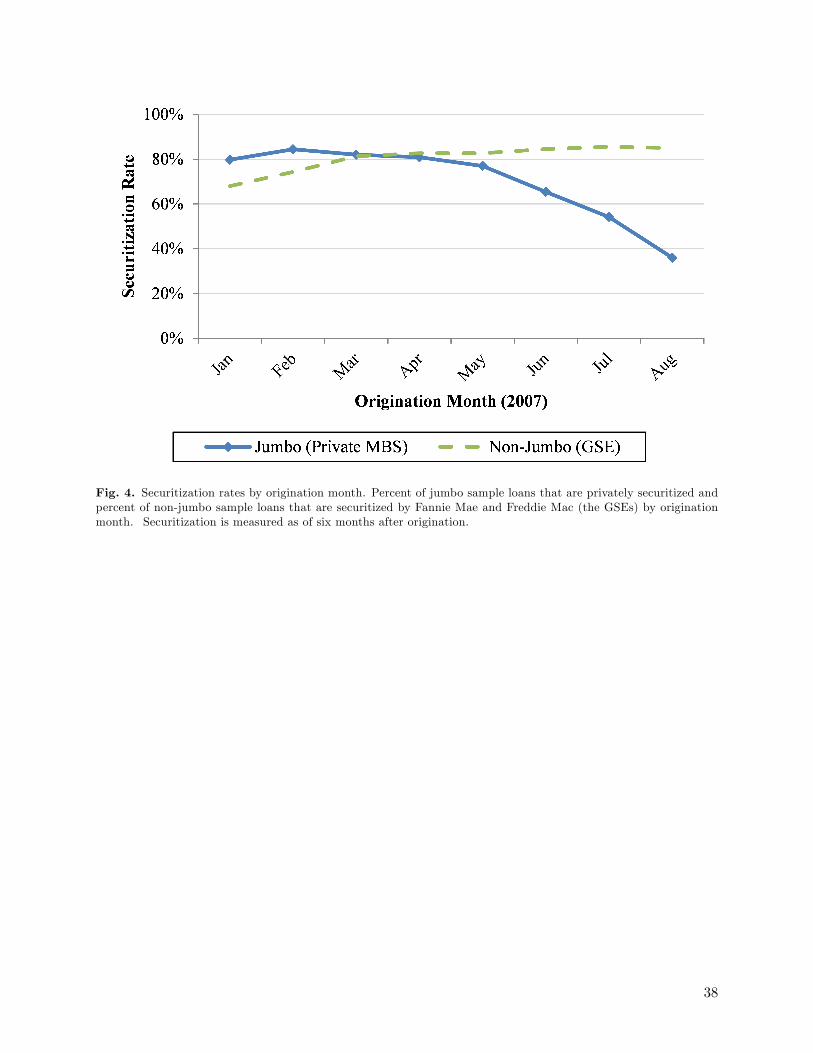
Fig. 4. Securitization rates by origination month. Percent of jumbo sample loans that are privately securitized andpercent of non-jumbo sample loans that are securitized by Fannie Mae and Freddie Mac (the GSEs) by originationmonth. Securitization is measured as of six months after origination.
38

Fig. 5. Reduced form regression fixed effects. Jumbo fixed effects are from the reduced form of the baseline IVregressions reported in Table 3. Non-jumbo fixed effects are for identical regressions estimated for non-jumbo loans.All fixed effects are relative to January.
39
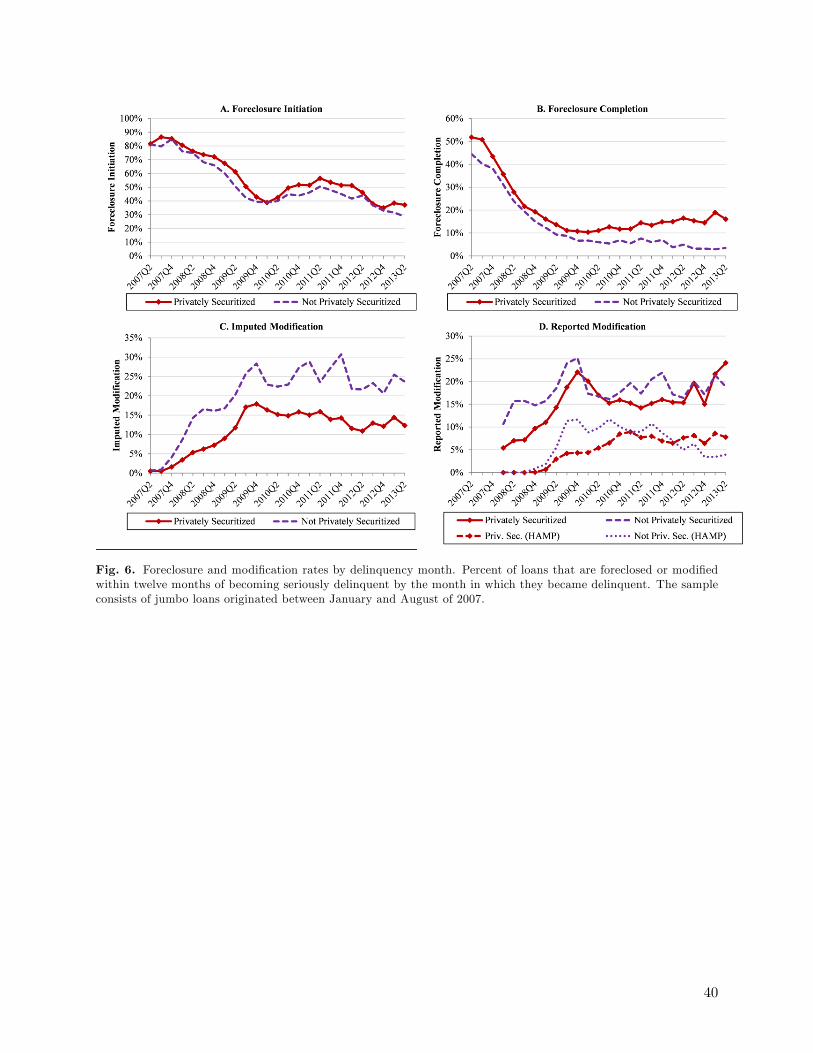
Fig. 6. Foreclosure and modification rates by delinquency month. Percent of loans that are foreclosed or modifiedwithin twelve months of becoming seriously delinquent by the month in which they became delinquent. The sampleconsists of jumbo loans originated between January and August of 2007.
40

Table 1.Data summary.Data come from LPS. The sample consists of first-lien conventional loans originated between January and August
of 2007 that enter the dataset within 4 months of origination, have orgination FICO scores between 620 and 850, haveorigination loan-to-value ratios of less than 1.5, have terms of 15, 20, or 30 years, are located in U.S. MSAs outside ofAlaska and Hawaii, and are not transferred to a non-LPS servicer. Jumbo loans are larger than the GSE conforminglimit ($417K). Portfolio loans are not securitized. Privately securitized loans are securitized in non-GSE mortgagebacked securities. GSE loans are predominantly FHLMC and FNMA but also include some GNMA and FederalHome Loan Bank loans. Delinquency is 60+ day delinquency. Foreclosure initiation is the referral of a mortgage toan attorney to initiate foreclosure proceedings. Foreclosure completion is identified by post-sale foreclosure or REOstatus. Imputed modifications are identified based on observed changes to loan terms. Reported modifications arebased on servicer modification reports. Redefault is a return to 60+ day delinquency after a modification cures aninitial delinquency.
All Loans Delinquent Loans
Jumbo Non-Jumbo Jumbo Non-Jumbo
Number 262,407 1,636,836 99,929 452,584Size (mean) $691,402 $210,355 $650,500 $229,391FICO (mean) 733 726 713 700LTV (mean) 0.73 0.72 0.77 0.78
OwnershipPortfolio 27.5% 9.2% 25.4% 11.5%Private Security 70.1% 9.4% 71.6% 15.9%GSE 1.7% 80.9% 2.2% 72.0%
DelinquencyWithin 1 year 6.1% 3.7%Within 5 years 36.5% 26.5%
Foreclosure InitiationWithin 6 months 47.8% 49.5%Within 1 year 59.4% 61.3%Within 3 years 74.1% 75.9%
Foreclosure CompletionWithin 6 months 5.8% 6.7%Within 1 year 17.5% 18.3%Within 3 years 32.6% 38.8%
Imputed ModificationWithin 6 months 7.1% 7.0%Within 1 year 14.0% 15.4%Within 3 years 25.0% 26.9%
Reported ModificationWithin 6 months 7.6% 6.5%Within 1 year 15.1% 14.5%Within 3 years 27.6% 26.1%
RedefaultWithin 1 year 22.2% 24.1%
41

Table 2.OLS regressions.The dependent variables are indicators for foreclosure initiation, foreclosure completion, imputed modification,
and reported modification within one year of first serious (60+ days) delinquency. All regressions are OLS. Privatelysecuritized is an indicator for private securitization as of six months after origination. The regressions analyze baselinesample jumbo loans, which became seriously (60+ days) delinquent before July of 2013. The imputed modificationregression is restricted to mortgages with term length data. The reported modification regression is restricted tomortgages whoses servicers reported modifications as of the month the loan became seriously delinquent. R-squaredstatistics are calculated within MSAs. Clustered (by MSA) standard errors are in parentheses. * represents 10%significance, ** represents 5% significance, *** represents 1% significance.
(1) (2) (3) (4)OLS OLS OLS OLS
Foreclose Imputed ReportedStart Foreclose Modify Modify
Mean 0.594 0.175 0.140 0.151
Privately Securitized 0.084*** 0.061*** -0.084*** -0.046***(0.007) (0.006) (0.005) (0.003)
FICO >= 680 0.051*** 0.042*** -0.029*** -0.029***(0.005) (0.005) (0.005) (0.004)
LTV Ratio 0.001*** 0.001*** 0.002*** 0.001***(0.000) (0.000) (0.000) (0.000)
LTV = 80 0.017*** 0.015*** -0.010*** -0.010***(0.004) (0.002) (0.003) (0.003)
log(Origination Amount) 0.037*** -0.008 -0.034*** -0.047***(0.007) (0.006) (0.003) (0.003)
Origination Interest Rate 0.003** 0.002* 0.008*** 0.005***(0.001) (0.001) (0.001) (0.001)
Fixed Interest Rate -0.159*** -0.129*** 0.049*** -0.022***(0.009) (0.010) (0.004) (0.005)
Term = 15 Years 0.026 0.020 -0.012 0.000(0.022) (0.017) (0.030) (0.025)
Term = 20 Years -0.080* 0.010 0.056 -0.035(0.046) (0.025) (0.050) (0.030)
Insurance -0.007 -0.004 -0.046*** -0.033***(0.008) (0.006) (0.010) (0.007)
Refinancing Loan -0.041*** -0.040*** 0.032*** 0.020***(0.004) (0.004) (0.003) (0.002)
Option ARM -0.063*** -0.044*** 0.004 -0.039***(0.004) (0.005) (0.007) (0.005)
Single Family Home -0.003 -0.012*** 0.025*** 0.034***(0.006) (0.004) (0.005) (0.003)
Primary Residence -0.084*** -0.058*** 0.060*** 0.067***(0.006) (0.007) (0.005) (0.005)
No Income Documentation 0.053*** -0.004 -0.009* -0.017***(0.006) (0.005) (0.005) (0.003)
Low Income Documentation 0.035*** 0.018*** -0.011** -0.031***(0.006) (0.005) (0.005) (0.004)
Delinquency Month FE Yes Yes Yes YesOrigination Month FE Yes Yes Yes YesMSA FE Yes Yes Yes Yes
Origination Months Jan-Aug Jan-Aug Jan-Aug Jan-AugInclude Non-Jumbo Loans No No No No
Observations 99,891 99,891 51,984 70,291Adjusted R-Squared 0.122 0.116 0.049 0.027
42

Table 3.Baseline IV regressions.The dependent variables are indicators for foreclosure initiation, foreclosure completion, imputed modification,
and reported modification within one year of first serious (60+ days) delinquency. The regressions estimate linearprobability models for these indicators using origination month indicators as instruments for private securitizationstatus six months after origination. All observable loan characteristics shown in Table 2 are included as unreportedcontrols. Privately securitized is an indicator for private securitization as of six months after origination. Theregressions analyze baseline sample jumbo loans, which became seriously (60+ days) delinquent before July of 2013.The imputed modification regression is restricted to mortgages with term length data. The reported modificationregression is restricted to mortgages whoses servicers reported modifications as of the month the loan became seriouslydelinquent. The weak identification test is a Kleibergen-Paap F statistic. R-squared statistics are calculated withinMSAs. Clustered (by MSA) standard errors are in parentheses. * represents 10% significance, ** represents 5%significance, *** represents 1% significance.
(1) (2) (3) (4) (5)OLS IV IV IV IV
Privately Foreclose Imputed ReportedSecuritized Start Foreclose Modify Modify
Mean 0.716 0.594 0.175 0.140 0.151
Privately Securitized 0.112*** 0.075*** -0.109*** -0.050***(0.008) (0.008) (0.008) (0.005)
February Origination -0.023***(0.005)
March Origination -0.037***(0.005)
April Origination -0.032***(0.005)
May Origination -0.081***(0.007)
June Origination -0.239***(0.010)
July Origination -0.395***(0.010)
August Origination -0.587***(0.013)
Loan Characteristic Controls Yes Yes Yes Yes YesDelinquency Month FE Yes Yes Yes Yes YesOrigination Month FE No No No NoMSA FE Yes Yes Yes Yes Yes
Origination Months Jan-Aug Jan-Aug Jan-Aug Jan-Aug Jan-AugInclude Non-Jumbo Loans No No No No No
Observations 99,891 99,891 99,891 51,984 70,291Adjusted R-Squared 0.251 0.121 0.115 0.048 0.027
Weak Identification F-stat 423Hansen’s J-stat (p-value) 11.38 10.49 12.06 11.85
(0.08) (0.11) (0.06) (0.07)
43
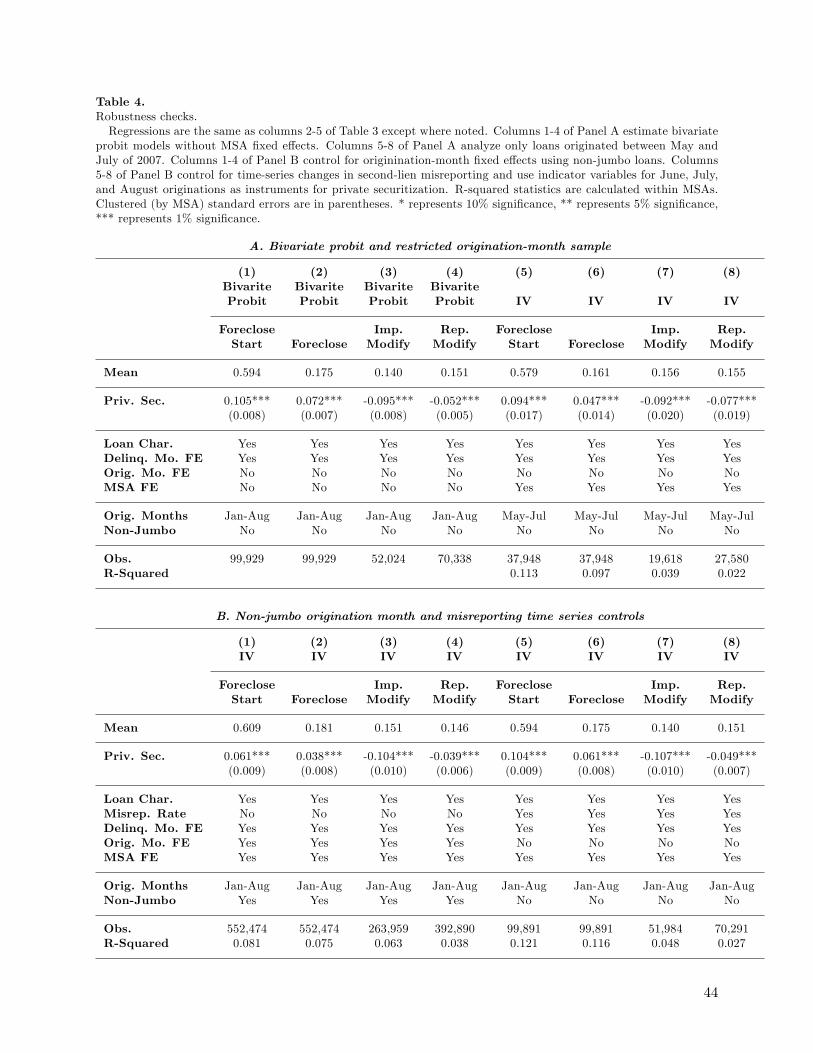
Table 4.Robustness checks.Regressions are the same as columns 2-5 of Table 3 except where noted. Columns 1-4 of Panel A estimate bivariate
probit models without MSA fixed effects. Columns 5-8 of Panel A analyze only loans originated between May andJuly of 2007. Columns 1-4 of Panel B control for originination-month fixed effects using non-jumbo loans. Columns5-8 of Panel B control for time-series changes in second-lien misreporting and use indicator variables for June, July,and August originations as instruments for private securitization. R-squared statistics are calculated within MSAs.Clustered (by MSA) standard errors are in parentheses. * represents 10% significance, ** represents 5% significance,*** represents 1% significance.
A. Bivariate probit and restricted origination-month sample
(1) (2) (3) (4) (5) (6) (7) (8)Bivarite Bivarite Bivarite BivariteProbit Probit Probit Probit IV IV IV IV
Foreclose Imp. Rep. Foreclose Imp. Rep.Start Foreclose Modify Modify Start Foreclose Modify Modify
Mean 0.594 0.175 0.140 0.151 0.579 0.161 0.156 0.155
Priv. Sec. 0.105*** 0.072*** -0.095*** -0.052*** 0.094*** 0.047*** -0.092*** -0.077***(0.008) (0.007) (0.008) (0.005) (0.017) (0.014) (0.020) (0.019)
Loan Char. Yes Yes Yes Yes Yes Yes Yes YesDelinq. Mo. FE Yes Yes Yes Yes Yes Yes Yes YesOrig. Mo. FE No No No No No No No NoMSA FE No No No No Yes Yes Yes Yes
Orig. Months Jan-Aug Jan-Aug Jan-Aug Jan-Aug May-Jul May-Jul May-Jul May-JulNon-Jumbo No No No No No No No No
Obs. 99,929 99,929 52,024 70,338 37,948 37,948 19,618 27,580R-Squared 0.113 0.097 0.039 0.022
B. Non-jumbo origination month and misreporting time series controls
(1) (2) (3) (4) (5) (6) (7) (8)IV IV IV IV IV IV IV IV
Foreclose Imp. Rep. Foreclose Imp. Rep.Start Foreclose Modify Modify Start Foreclose Modify Modify
Mean 0.609 0.181 0.151 0.146 0.594 0.175 0.140 0.151
Priv. Sec. 0.061*** 0.038*** -0.104*** -0.039*** 0.104*** 0.061*** -0.107*** -0.049***(0.009) (0.008) (0.010) (0.006) (0.009) (0.008) (0.010) (0.007)
Loan Char. Yes Yes Yes Yes Yes Yes Yes YesMisrep. Rate No No No No Yes Yes Yes YesDelinq. Mo. FE Yes Yes Yes Yes Yes Yes Yes YesOrig. Mo. FE Yes Yes Yes Yes No No No NoMSA FE Yes Yes Yes Yes Yes Yes Yes Yes
Orig. Months Jan-Aug Jan-Aug Jan-Aug Jan-Aug Jan-Aug Jan-Aug Jan-Aug Jan-AugNon-Jumbo Yes Yes Yes Yes No No No No
Obs. 552,474 552,474 263,959 392,890 99,891 99,891 51,984 70,291R-Squared 0.081 0.075 0.063 0.038 0.121 0.116 0.048 0.027
44
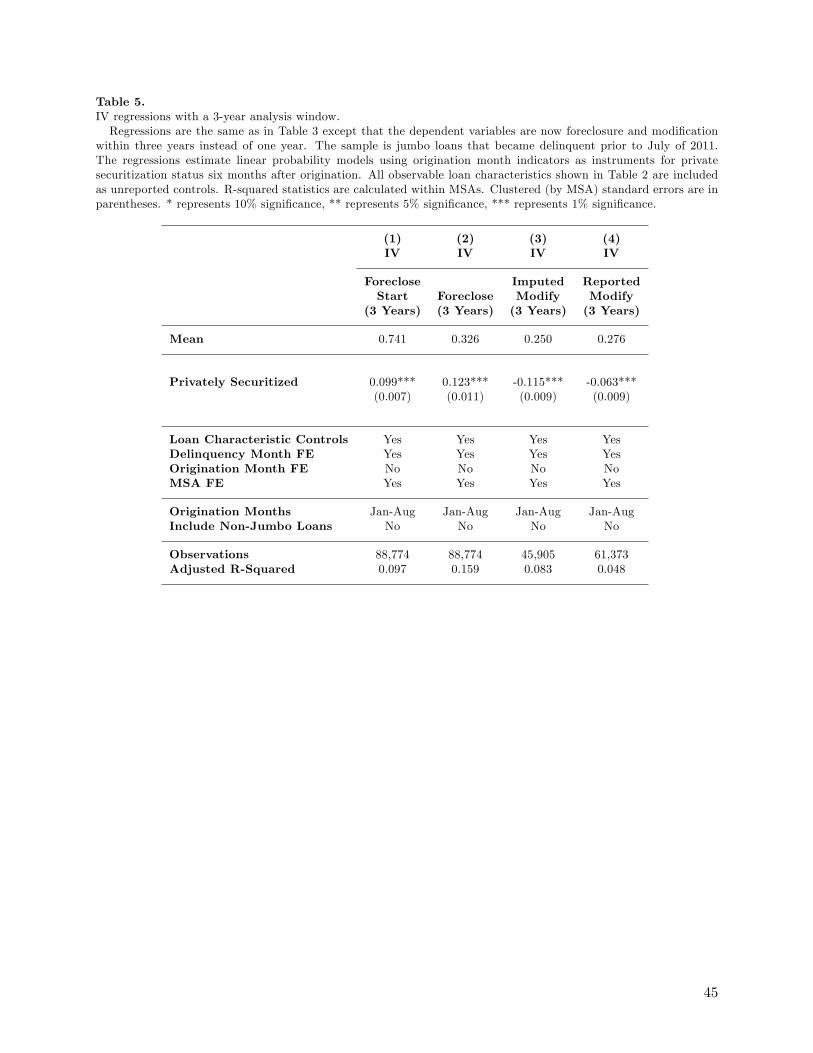
Table 5.IV regressions with a 3-year analysis window.Regressions are the same as in Table 3 except that the dependent variables are now foreclosure and modification
within three years instead of one year. The sample is jumbo loans that became delinquent prior to July of 2011.The regressions estimate linear probability models using origination month indicators as instruments for privatesecuritization status six months after origination. All observable loan characteristics shown in Table 2 are includedas unreported controls. R-squared statistics are calculated within MSAs. Clustered (by MSA) standard errors are inparentheses. * represents 10% significance, ** represents 5% significance, *** represents 1% significance.
(1) (2) (3) (4)IV IV IV IV
Foreclose Imputed ReportedStart Foreclose Modify Modify
(3 Years) (3 Years) (3 Years) (3 Years)
Mean 0.741 0.326 0.250 0.276
Privately Securitized 0.099*** 0.123*** -0.115*** -0.063***(0.007) (0.011) (0.009) (0.009)
Loan Characteristic Controls Yes Yes Yes YesDelinquency Month FE Yes Yes Yes YesOrigination Month FE No No No NoMSA FE Yes Yes Yes Yes
Origination Months Jan-Aug Jan-Aug Jan-Aug Jan-AugInclude Non-Jumbo Loans No No No No
Observations 88,774 88,774 45,905 61,373Adjusted R-Squared 0.097 0.159 0.083 0.048
45
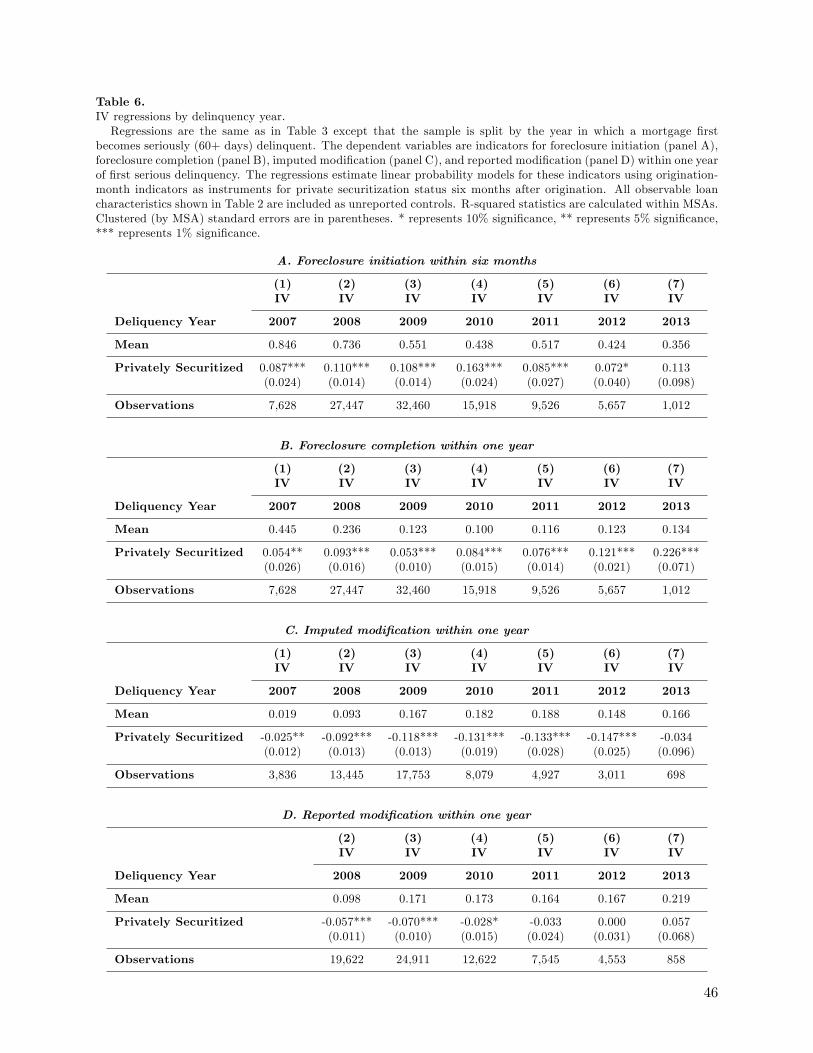
Table 6.IV regressions by delinquency year.Regressions are the same as in Table 3 except that the sample is split by the year in which a mortgage first
becomes seriously (60+ days) delinquent. The dependent variables are indicators for foreclosure initiation (panel A),foreclosure completion (panel B), imputed modification (panel C), and reported modification (panel D) within one yearof first serious delinquency. The regressions estimate linear probability models for these indicators using origination-month indicators as instruments for private securitization status six months after origination. All observable loancharacteristics shown in Table 2 are included as unreported controls. R-squared statistics are calculated within MSAs.Clustered (by MSA) standard errors are in parentheses. * represents 10% significance, ** represents 5% significance,*** represents 1% significance.
A. Foreclosure initiation within six months
(1) (2) (3) (4) (5) (6) (7)IV IV IV IV IV IV IV
Deliquency Year 2007 2008 2009 2010 2011 2012 2013
Mean 0.846 0.736 0.551 0.438 0.517 0.424 0.356
Privately Securitized 0.087*** 0.110*** 0.108*** 0.163*** 0.085*** 0.072* 0.113(0.024) (0.014) (0.014) (0.024) (0.027) (0.040) (0.098)
Observations 7,628 27,447 32,460 15,918 9,526 5,657 1,012
B. Foreclosure completion within one year
(1) (2) (3) (4) (5) (6) (7)IV IV IV IV IV IV IV
Deliquency Year 2007 2008 2009 2010 2011 2012 2013
Mean 0.445 0.236 0.123 0.100 0.116 0.123 0.134
Privately Securitized 0.054** 0.093*** 0.053*** 0.084*** 0.076*** 0.121*** 0.226***(0.026) (0.016) (0.010) (0.015) (0.014) (0.021) (0.071)
Observations 7,628 27,447 32,460 15,918 9,526 5,657 1,012
C. Imputed modification within one year
(1) (2) (3) (4) (5) (6) (7)IV IV IV IV IV IV IV
Deliquency Year 2007 2008 2009 2010 2011 2012 2013
Mean 0.019 0.093 0.167 0.182 0.188 0.148 0.166
Privately Securitized -0.025** -0.092*** -0.118*** -0.131*** -0.133*** -0.147*** -0.034(0.012) (0.013) (0.013) (0.019) (0.028) (0.025) (0.096)
Observations 3,836 13,445 17,753 8,079 4,927 3,011 698
D. Reported modification within one year
(2) (3) (4) (5) (6) (7)IV IV IV IV IV IV
Deliquency Year 2008 2009 2010 2011 2012 2013
Mean 0.098 0.171 0.173 0.164 0.167 0.219
Privately Securitized -0.057*** -0.070*** -0.028* -0.033 0.000 0.057(0.011) (0.010) (0.015) (0.024) (0.031) (0.068)
Observations 19,622 24,911 12,622 7,545 4,553 858
46
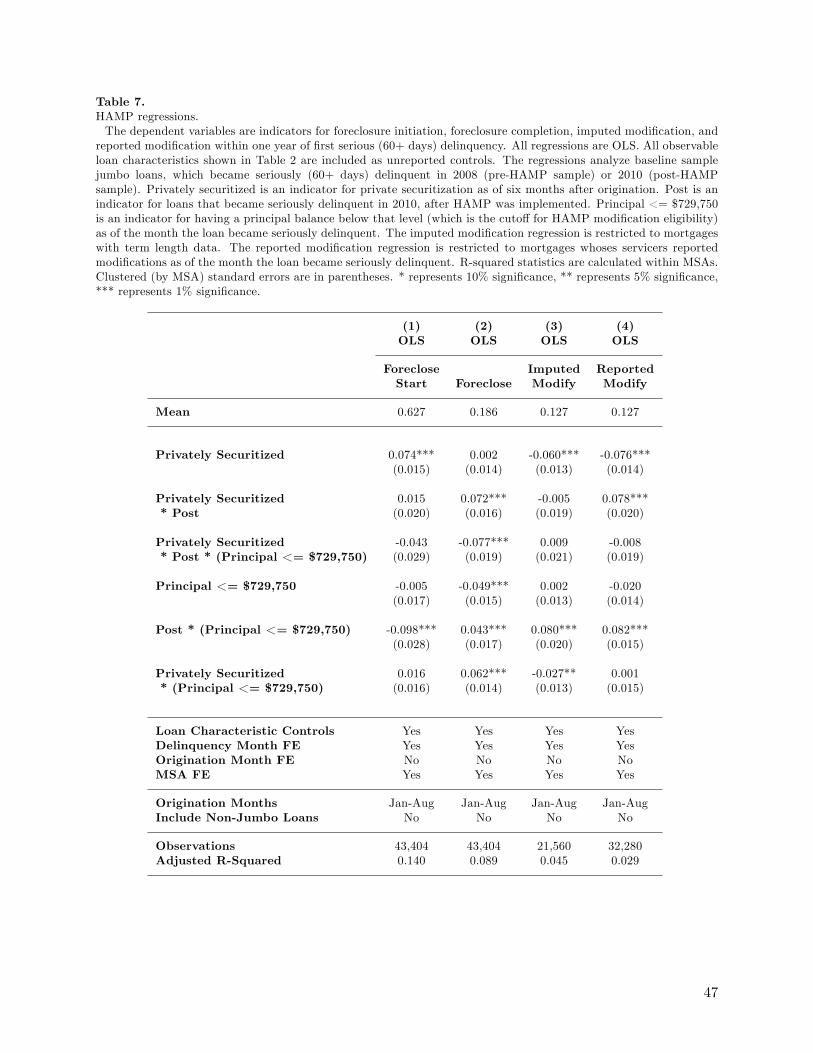
Table 7.HAMP regressions.The dependent variables are indicators for foreclosure initiation, foreclosure completion, imputed modification, and
reported modification within one year of first serious (60+ days) delinquency. All regressions are OLS. All observableloan characteristics shown in Table 2 are included as unreported controls. The regressions analyze baseline samplejumbo loans, which became seriously (60+ days) delinquent in 2008 (pre-HAMP sample) or 2010 (post-HAMPsample). Privately securitized is an indicator for private securitization as of six months after origination. Post is anindicator for loans that became seriously delinquent in 2010, after HAMP was implemented. Principal <= $729,750is an indicator for having a principal balance below that level (which is the cutoff for HAMP modification eligibility)as of the month the loan became seriously delinquent. The imputed modification regression is restricted to mortgageswith term length data. The reported modification regression is restricted to mortgages whoses servicers reportedmodifications as of the month the loan became seriously delinquent. R-squared statistics are calculated within MSAs.Clustered (by MSA) standard errors are in parentheses. * represents 10% significance, ** represents 5% significance,*** represents 1% significance.
(1) (2) (3) (4)OLS OLS OLS OLS
Foreclose Imputed ReportedStart Foreclose Modify Modify
Mean 0.627 0.186 0.127 0.127
Privately Securitized 0.074*** 0.002 -0.060*** -0.076***(0.015) (0.014) (0.013) (0.014)
Privately Securitized 0.015 0.072*** -0.005 0.078**** Post (0.020) (0.016) (0.019) (0.020)
Privately Securitized -0.043 -0.077*** 0.009 -0.008* Post * (Principal <= $729,750) (0.029) (0.019) (0.021) (0.019)
Principal <= $729,750 -0.005 -0.049*** 0.002 -0.020(0.017) (0.015) (0.013) (0.014)
Post * (Principal <= $729,750) -0.098*** 0.043*** 0.080*** 0.082***(0.028) (0.017) (0.020) (0.015)
Privately Securitized 0.016 0.062*** -0.027** 0.001* (Principal <= $729,750) (0.016) (0.014) (0.013) (0.015)
Loan Characteristic Controls Yes Yes Yes YesDelinquency Month FE Yes Yes Yes YesOrigination Month FE No No No NoMSA FE Yes Yes Yes Yes
Origination Months Jan-Aug Jan-Aug Jan-Aug Jan-AugInclude Non-Jumbo Loans No No No No
Observations 43,404 43,404 21,560 32,280Adjusted R-Squared 0.140 0.089 0.045 0.029
47
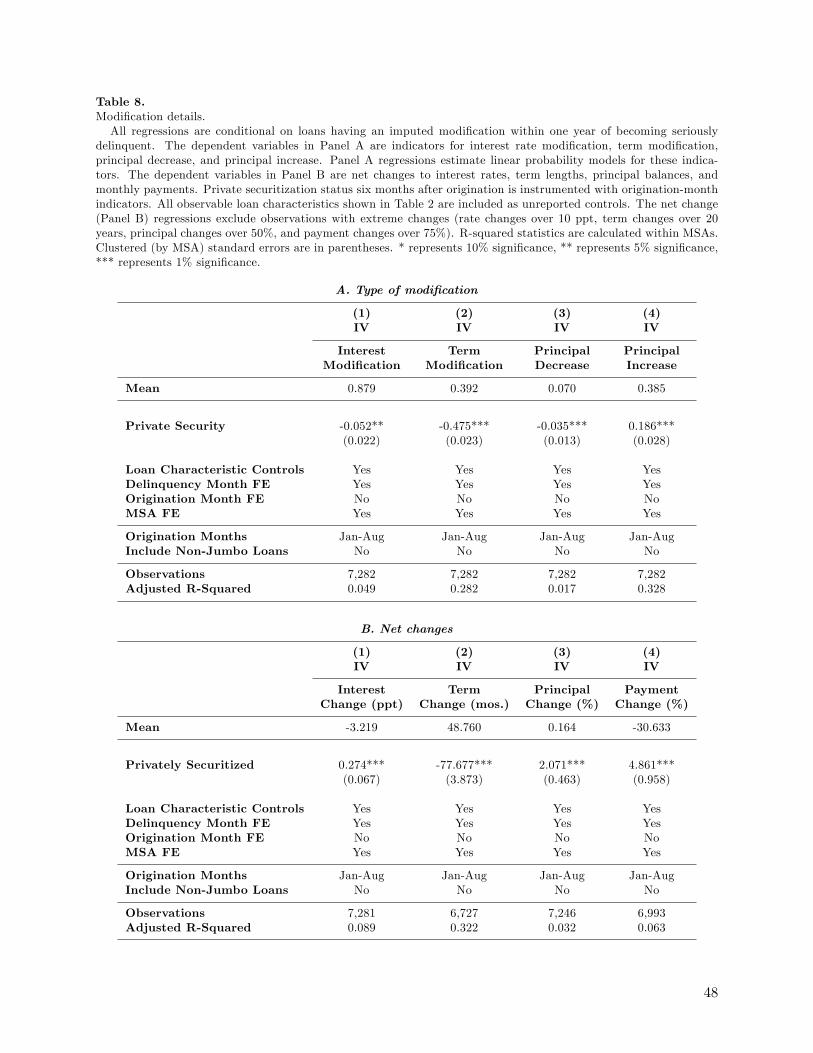
Table 8.Modification details.All regressions are conditional on loans having an imputed modification within one year of becoming seriously
delinquent. The dependent variables in Panel A are indicators for interest rate modification, term modification,principal decrease, and principal increase. Panel A regressions estimate linear probability models for these indica-tors. The dependent variables in Panel B are net changes to interest rates, term lengths, principal balances, andmonthly payments. Private securitization status six months after origination is instrumented with origination-monthindicators. All observable loan characteristics shown in Table 2 are included as unreported controls. The net change(Panel B) regressions exclude observations with extreme changes (rate changes over 10 ppt, term changes over 20years, principal changes over 50%, and payment changes over 75%). R-squared statistics are calculated within MSAs.Clustered (by MSA) standard errors are in parentheses. * represents 10% significance, ** represents 5% significance,*** represents 1% significance.
A. Type of modification
(1) (2) (3) (4)IV IV IV IV
Interest Term Principal PrincipalModification Modification Decrease Increase
Mean 0.879 0.392 0.070 0.385
Private Security -0.052** -0.475*** -0.035*** 0.186***(0.022) (0.023) (0.013) (0.028)
Loan Characteristic Controls Yes Yes Yes YesDelinquency Month FE Yes Yes Yes YesOrigination Month FE No No No NoMSA FE Yes Yes Yes Yes
Origination Months Jan-Aug Jan-Aug Jan-Aug Jan-AugInclude Non-Jumbo Loans No No No No
Observations 7,282 7,282 7,282 7,282Adjusted R-Squared 0.049 0.282 0.017 0.328
B. Net changes
(1) (2) (3) (4)IV IV IV IV
Interest Term Principal PaymentChange (ppt) Change (mos.) Change (%) Change (%)
Mean -3.219 48.760 0.164 -30.633
Privately Securitized 0.274*** -77.677*** 2.071*** 4.861***(0.067) (3.873) (0.463) (0.958)
Loan Characteristic Controls Yes Yes Yes YesDelinquency Month FE Yes Yes Yes YesOrigination Month FE No No No NoMSA FE Yes Yes Yes Yes
Origination Months Jan-Aug Jan-Aug Jan-Aug Jan-AugInclude Non-Jumbo Loans No No No No
Observations 7,281 6,727 7,246 6,993Adjusted R-Squared 0.089 0.322 0.032 0.063
48

Table 9.Modification effectiveness.All regressions are conditional on a loan being cured of initial delinquency with an imputed modification within
one year of becoming seriously delinquent before July of 2013. The dependent variable is an indicator for redefault,defined as a return to 60+ day delinquent status within one year of modification. The regressions estimate linearprobability models using origination month indicators as instruments for private securitization status six months afterorigination. Indicators for modification type are included where indicated. All observable loan characteristics shownin Table 2 are included as unreported controls. R-squared statistics are calculated within MSAs. Clustered (by MSA)standard errors are in parentheses. * represents 10% significance, ** represents 5% significance, *** represents 1%significance.
(1) (2)IV IV
Redefault Redefault
Mean 0.234 0.234
Privately Securitized 0.070*** 0.041*(0.017) (0.024)
Interest Decrease -0.088***(0.015)
Term Increase -0.037*(0.019)
Principal Decrease -0.066***(0.020)
Principal Increase 0.016(0.013)
Loan Characteristic Controls Yes YesDelinquency Month FE Yes YesOrigination Month FE No NoMSA FE Yes Yes
Origination Months Jan-Aug Jan-AugInclude Non-Jumbo Loans No No
Observations 6,875 6,875Adjusted R-Squared 0.145 0.152
49
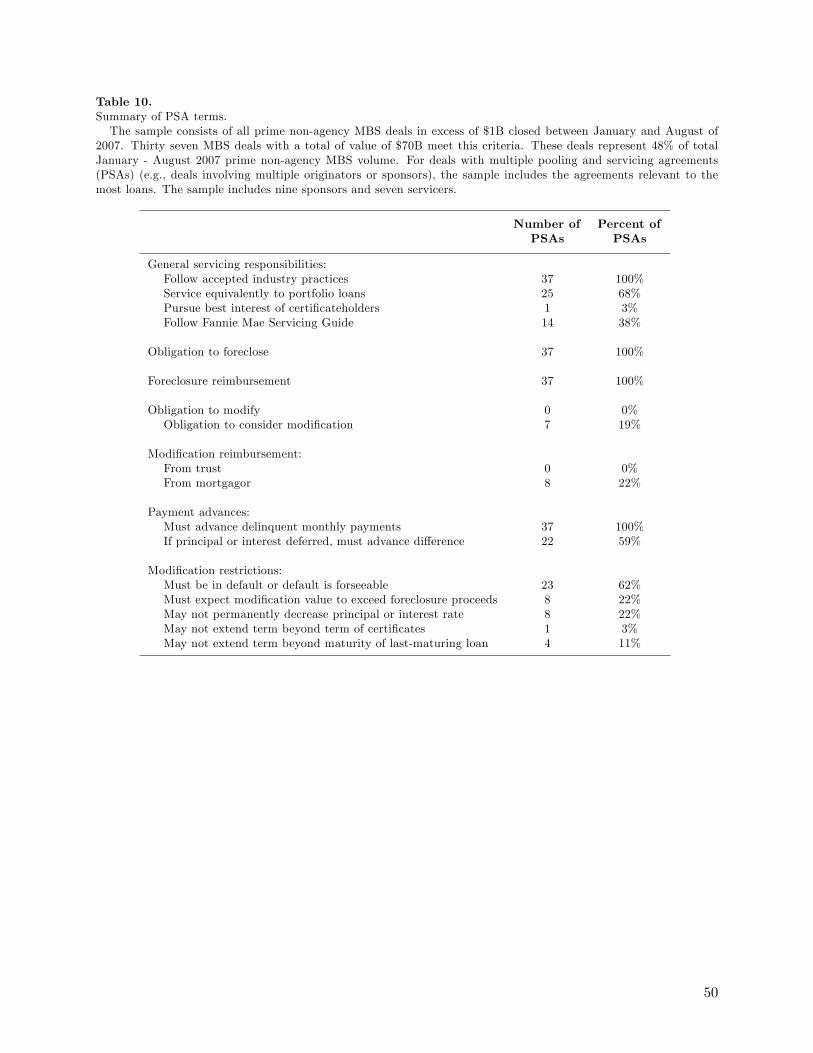
Table 10.Summary of PSA terms.The sample consists of all prime non-agency MBS deals in excess of $1B closed between January and August of
2007. Thirty seven MBS deals with a total of value of $70B meet this criteria. These deals represent 48% of totalJanuary - August 2007 prime non-agency MBS volume. For deals with multiple pooling and servicing agreements(PSAs) (e.g., deals involving multiple originators or sponsors), the sample includes the agreements relevant to themost loans. The sample includes nine sponsors and seven servicers.
Number of Percent ofPSAs PSAs
General servicing responsibilities:Follow accepted industry practices 37 100%Service equivalently to portfolio loans 25 68%Pursue best interest of certificateholders 1 3%Follow Fannie Mae Servicing Guide 14 38%
Obligation to foreclose 37 100%
Foreclosure reimbursement 37 100%
Obligation to modify 0 0%Obligation to consider modification 7 19%
Modification reimbursement:From trust 0 0%From mortgagor 8 22%
Payment advances:Must advance delinquent monthly payments 37 100%If principal or interest deferred, must advance difference 22 59%
Modification restrictions:Must be in default or default is forseeable 23 62%Must expect modification value to exceed foreclosure proceeds 8 22%May not permanently decrease principal or interest rate 8 22%May not extend term beyond term of certificates 1 3%May not extend term beyond maturity of last-maturing loan 4 11%
50

Table 11.PSA-linked loan sample.Data comes from Core Logic loan data linked to my sample of PSAs from prime non-agency MBS deals closed
between January and August of 2007. The sample consists of jumbo (over $417K) first-lien conventional loans thathave orgination FICO scores between 620 and 850, have origination loan-to-value ratios of less than 1.5, have termsof 15, 20, or 30 years, and are located in U.S. MSAs outside of Alaska and Hawaii. The delinquent loan sampleincludes loans that became seriously (60+ days) delinquent between 2007 and June of 2013. Delinquency is 60+ daydelinquency. Foreclosure initiation is the referral of a mortgage to an attorney to initiate foreclosure proceedings.Foreclosure completion is identified by post-sale foreclosure or REO status. Modifications are identified based onobserved changes to loan terms.
DelinquentAll Loans Loans
Number 84,987 20,715Size (mean) $707,606 $670,976FICO (mean) 742 723LTV (mean) 0.71 0.75
OwnershipPrivate Security 100% 100%
DelinquencyWithin 1 year 1.1%Within 5 years 20.8%
Foreclosure InitiationWithin 6 months 49.3%Within 1 year 57.8%
Foreclosure CompletionWithin 6 months 7.0%Within 1 year 20.2%
Imputed ModificationWithin 6 months 6.0%Within 1 year 12.6%
51

Table 12.PSA term regressions.The dependent variables are indicators for foreclosure initiation, foreclosure completion, imputed modification, and
reported modification within one year of first serious (60+ days) delinquency. All regressions are OLS. The reportedindependent variables are indicators for the presence of servicing contract terms. All observable loan characteristicsshown in Table 2 are included as unreported controls. The regressions also control for MSA, origination month,delinquency month, and servicer fixed effects. The regressions analyze sample jumbo loans that became seriously(60+ days) delinquent between 2007 and June of 2013. R-squared statistics are calculated within MSAs. Clustered(by MSA) standard errors are in parentheses. * represents 10% significance, ** represents 5% significance, ***represents 1% significance.
(1) (2) (3)OLS OLS OLS
Foreclose ImputedStart Foreclose Modify
Mean 0.584 0.204 0.126
Permanent Principal and Interest 0.140*** 0.114*** -0.028Reductions Prohibited (0.0256) (0.0216) (0.0185)
Term Extensions Limited 0.068** 0.070*** -0.036(0.0279) (0.0199) (0.0219)
Loan Characteristic Controls Yes Yes YesServicer FE Yes Yes YesDelinquency Month FE Yes Yes YesOrigination Month FE Yes Yes YesMSA FE Yes Yes Yes
Observations 20,362 20,362 20,362Adjusted R-Squared 0.125 0.068 0.040
52