the effect of cell isolation methods on the human
TRANSCRIPT
Vol.:(0123456789)1 3
Molecular Biology Reports (2021) 48:3059–3068 https://doi.org/10.1007/s11033-021-06382-1
ORIGINAL ARTICLE
The effect of cell isolation methods on the human transcriptome profiling and microbial transcripts of peripheral blood
Yanru Xing1,2,3 · Xi Yang2,3 · Haixiao Chen2,3 · Sujun Zhu4 · Jinjin Xu2,3 · Yuan Chen2,3 · Juan Zeng4 · Fang Chen2,3 · Mark Richard Johnson5 · Hui Jiang1,2,3,6 · Wen‑Jing Wang2,3
Received: 21 February 2021 / Accepted: 24 April 2021 / Published online: 30 April 2021 © The Author(s), under exclusive licence to Springer Nature B.V. 2021
AbstractThe expression of human and microbial genes serves as biomarkers for disease and health. Blood RNA is an important biological resource for precision medicine and translational medicine. However, few studies have assessed the human tran-scriptome profiles and microbial communities composition and diversity of peripheral blood from different cell isolation methods, which could affect the reproducibility of researches. We collected peripheral blood from three healthy donors and processed it immediately. We used RNA sequencing to investigate the effect of three leukocyte isolation methods including buffy coat (BC) extraction, red blood cell (RBC) lysis and peripheral blood mononuclear cell (PBMC) isolation with the comparison with whole blood (WB), through analyzing the sensitivity of gene detection, the whole transcriptome profiling and microbial composition and diversity. Our data showed that BC extraction with high globin mRNA mapping rate had similar transcriptome profiles with WB, while RBC lysis and PBMC isolation depleted RBCs effectively. With the efficient depletion of RBC and distinct compositions of leukocyte subsets, RNA-seq of RBC lysis and PBMC isolation uniquely detected genes from specific cell types, like granulocytes and NK cells. In addition, we observed that the microbial compo-sition and diversity were more affected by individuals than isolation methods. Our results showed that blood cell isolations could largely influence the sensitivity of detection of human genes and transcriptome profile.
Keywords Peripheral blood · Cell isolation · Transcriptome profile · Microbial transcript · Biomarker
Introduction
Peripheral blood is a fluid connective tissue throughout the body connecting the entire biological system. Previous studies have shown that peripheral blood gene expression is an important source of information to profile individual
uniqueness [1, 2]. Peripheral blood has distinct patterns of gene expression in different diseases including Parkinson’s disease [3], childhood asthma [4], rheumatoid arthritis [5, 6], infectious diseases [7] and early preeclampsia [8, 9]. A unique pattern of immune dysregulation is found in COVID-19 patients’ blood samples [10, 11]. In addition, studies have shown that composition and diversity of human blood microbial communities change with the onset of diseases including diabetes [12], cirrhotic [13], acute pancreatitis [14], cardiovascular diseases [15] schizophrenia [16], and cancer [17]. Peripheral blood is more available and less risky to collect than invasive organ biopsy, thus provides promis-ing biomarkers for diseases in precision and translational medicine.
Peripheral whole blood (WB) contains white blood cells (WBCs), red blood cells (RBCs), platelets and plasma. WBCs include lymphocyte, granulocyte and monocyte and play critical roles in immunity, exhibiting the major complexity of blood. There are 3 popular methods to iso-late WBCs from WB, including buffy coat (BC) extraction,
* Wen-Jing Wang [email protected]
1 School of Future Technology, University of Chinese Academy of Sciences, Beijing, China
2 BGI-Shenzhen, Shenzhen 518083, China3 China National GeneBank, BGI-Shenzhen, Shenzhen, China4 Obstetrics Department, Shenzhen Maternity and Child
Healthcare Hospital, Shenzhen, Guangdong Province, China5 Academic Obstetric Department, Imperial College London,
Chelsea & Westminster Hospital campus, London, UK6 Guangdong Enterprise Key Laboratory of Human Disease
Genomics, Shenzhen, China

3060 Molecular Biology Reports (2021) 48:3059–3068
1 3
RBC lysis and peripheral blood mononuclear cell (PBMC) isolation. BC extraction is achieved by extracting the white membrane layer of blood after centrifugation, remaining most WBCs and platelets [18, 19]. RBC lysis removes eryth-rocytes and leaves WBCs and platelets [20]. PBMC isolation uses density gradient centrifugation to separate mononuclear cells, such as lymphocytes and monocytes [21]. These cell isolation methods maintain different subpopulations of blood cells, leading to distinct expression patterns. Previous stud-ies have observed a reduced number of detected genes, a high variability of gene expression profile and a low sig-nal-to-noise ratio in WB compared with WBC, which was related to the RBC-derived globin transcripts [22, 23]. The gene expression pattern and cell subpopulations were also varied among WB and WBC isolations [22]. Most of these studies evaluated the difference on a group of selected genes by microarray. With the development of RNA sequencing (RNA-seq), it is possible to identify the changes of whole human transcriptome profile and microbial composition and diversity among WBC isolations, and the potential to affect biomarker discovery.
Here, we used RNA-seq to comprehensively investigate the influence of 3 popular WBC isolation methods on human transcriptome profile and microbial composition and diver-sity, including BC extraction, RBC lysis and PBMC isola-tion. With the assessment of the three cell isolation methods,
we provide a reference to help researchers to choose suitable pretreatments for particular study purposes.
Materials and methods
Sample collection and leukocyte isolation
Three healthy volunteers (two males and one female) were enrolled, and 10 mL peripheral blood was collected each using EDTA anticoagulation tubes (BD, 0202992058) and processed immediately. Each tube of WB was divided into four parts, three of which underwent three different leuko-cyte isolation methods, and one portion was mixed with TRIzol LS Reagent (Thermo Fisher, 10296028). The meth-ods of BC extraction, RBC lysis and PBMC isolation are described in Fig. 1. The study protocol was approved by the BGI Institutional Review Board (NO. BGI-IRB 17034). All donors signed consent forms for non-therapeutic use of their donated blood samples.
RNA extraction, library preparation and sequencing
Twelve RNA samples were extracted by TRIzol Reagent (Thermo Fisher, 15596026) or TRIzol LS Reagent (Thermo Fisher, 10296028) according to the manufacturer’s manual. RNA concentration and integrity were measured by Agilent
Peripheral blood samples collected from volunteers (n=3)
WB: Take 150 μL whole blood into a 1.5 mL EP tube.
BC extraction: (1) Take 1 mL whole blood into a 2 mL EP tube, and centrifuge for 10 min at 1,600g at 4 ℃. (2) Remove the plasma and take 100 μL buffy coat into a new 1.5 mL EP tube.
RBC lysis: (1) Add 3 mL RBC lysis buffer into 1 mL whole blood, mix gently and incubate at room temperature for 10 min. (2) Centrifuge for 5 min at 1,600g at 4 ℃. (3) Remove the supernatant. Mix the sample with 100 μL PBS buffer gently. (4) Centrifuge at 1,600g for 1 min at 4 ℃. Discard the supernatant. (5) Resuspend the sample with 100 μL PBS, and transfer the sample into a new 1.5 mL EP tube.
PBMC isolation: (1) Dilute 1.5 mL whole blood with 1.5 mL PBS. (2) Add 1.5 mL lymphocyte separation solution ficoll and centrifuge at 400g for 30 minutes. (3) Collect mononuclear cells at the junction of the plasma layer and lymphocyte separation fluid, transfer the sample into a new centrifuge tube. (4) Mix with 3 mL sterile cold PBS, centrifuge at 200g for 10 mins and discard the supernatant. Repeat once if it is needed.(5) Dissolve with 100 μL PBS, and transfer the sample into a new 1.5 mL EP tube.
Mixed with 300 μL TRIzolMixed with 450 uL TRIzol LS
RNA isolation
Fig. 1 Schematic of sample processing. Whole blood was collected in EDTA anticoagulation tubes (n = 3). All samples were treated immedi-ately after collection

3061Molecular Biology Reports (2021) 48:3059–3068
1 3
2100 bioanalyzer (Agilent Technologies, G2939A). Samples with total RNA amount ≥ 200 ng and RIN score ≥ 6 were qualified to construct sequencing library. RNase H method was applied to deplete rRNA [24]. Sequencing was per-formed on BGISEQ-500RS (single-end 50 bp) developed by BGI.
Data filtering, alignment and expression quantification
Reads with adaptors and low quality were filtered by SOAPnuke [25], and rRNA was removed (hg19 rRNA ref) by SOAP2 [26] to obtain clean data. Metrics for clean data were calculated according to output files generated by SOAPnuke [25]. We used HISAT (version 2.1.0) [27] with default parameters to aligned all clean data on the human genome (hg19) and calculate metrics of alignment. We used RNA-SeQC (version 2.6.4) [28] to assessed the proportion of reads aligned to annotated CDS exons, 5′UTR exons. 3′UTR exons, introns, TSS up/down 10 kb and other regions.
We aligned all clean data on human transcript reference by Bowtie2 [29], the refMrna.fa.gz file from the UCSC database [30] removed NR_RNA as the mRNA reference, and NONCODEv5_human.fa.gz file from the NONCODE database [31] as the non-coding RNA reference. Saturation curves display the number of detected genes according to BAM files generated by Bowtie2. All transcripts estimated counts and Transcripts Per Million mapped reads (TPM) were obtained using Kallisto [32]. We performed principal component analysis (PCA) and calculated the coefficient of variation according to all expressed genes among isolation methods.
Blood cell subsets analysis
We estimated the content of globin mRNA (Supplementary Table S1) reads in clean data to present the residue of eryth-rocytes. CIBERSORT [33] was used to estimate the relative proportion of leukocyte subpopulations.
Identification of differentially expressed genes (DEGs) and co‑expression genes
We used edgeR [34] to identify DEGs between isolation methods. The Benjamini-Hochberg (BH) method [35] was employed to correct multiple comparisons. DEGs were considered significant if they exhibited a BH-adjusted p-value ≤ 0.01 and fold change ≥ 2.
Then we identified isolation-associated co-expression genes by WGCNA [36] according to all DEGs’ TPM. We chose β = 9 as the soft threshold [37]. The Pearson correla-tion between module eigengenes (ME) [36] and isolation method was also calculated. Metascape [38] was used to
analyze the disease enrichment according to DisGeNET database [39]. FunRich [40] was used to analyze the cell type enrichment of coding genes in different modules.
Human gene expression in different blood cell types
Gene expression levels summarized in 18 blood cell types is based on the Human Protein Atlas (version 20.0) [41] and Ensembl (version 92.38) [42]. TPM of uniquely detected genes in each group of cell was merged and observed in different cell types. Expression of coding genes of black and yellow modules in different blood cell types was also observed.
The blood microbiome analyses
Clean reads that failed to align to the human genome were further filtered with low-quality and low complexity reads, and the remaining reads were aligned to microbiome using Kraken (version 0.10.5) [43] with a database including viral, archaeal, bacterial, protozoa, fungi, and human. We excluded the human reads and calculated the microbiome reads in per million clean reads (microbiome-RPM) and the relative abundances of bacterial taxa at phylum level. The alpha diversity in each sample was determined using the Simpson index. To measure sample-to-sample dissimilari-ties between microbial communities, we used Bray–Curtis beta diversity index. Principal coordinates analysis (PCoA) was performed based on unweighted Bray–Curtis distances.
Statistical analysis
The coefficients of variation (CV) of commonly detected genes expression under each pretreatment were calculated. Paired two-sided t-test was used to compare the differences in CV, proportions of globin mRNA and leukocyte subsets between cell groups in this study, and p < 0.05 was consid-ered to be significant. The relative proportions of leukocyte subsets were presented as mean ± SD.
Results
Quality control of RNA and RNA‑seq
RNA was extracted from all processed samples with an average RIN value of 8.1 ± 1.0 (mean ± SD) and sequenc-ing libraries were successfully constructed (Supplementary Table S2). For each sample of RNA-seq, about 100 M clean reads were obtained respectively (Supplementary Table S3). The proportion of rRNA reads and filtered reads in raw reads did not show significant difference among pretreatments (Supplementary Table S4). Q20 of all samples were larger

3062 Molecular Biology Reports (2021) 48:3059–3068
1 3
than 98.75%, which inferred that the sequencing accuracy of most bases was up to 99% (Fig. S1A). The GC content in WB and BC extraction was higher than RBC lysis and PBMC isolation (Fig. S1B). All pretreatments have similar total aligned percentages, while WB and BC extraction with a higher multi-aligned and lower uniquely aligned percent-ages (Fig. S1C). We also observed that WB and BC extrac-tion with higher proportion of CDS exons and lower propor-tion of introns (Fig. S1D).
Blood cell subsets analysis
The proportion of globin mRNA showed WB > BC extrac-tion > RBC lysis > PBMC isolation (Fig. 2a, Supplementary Table S4). The proportion of leukocyte subsets varied with subjects (Fig. S2, Supplementary Table S5). As expected, neutrophils were rare in PBMC, with increasing proportions of lymphocyte and monocyte (Fig. 2b).
Detection of human expressed genes
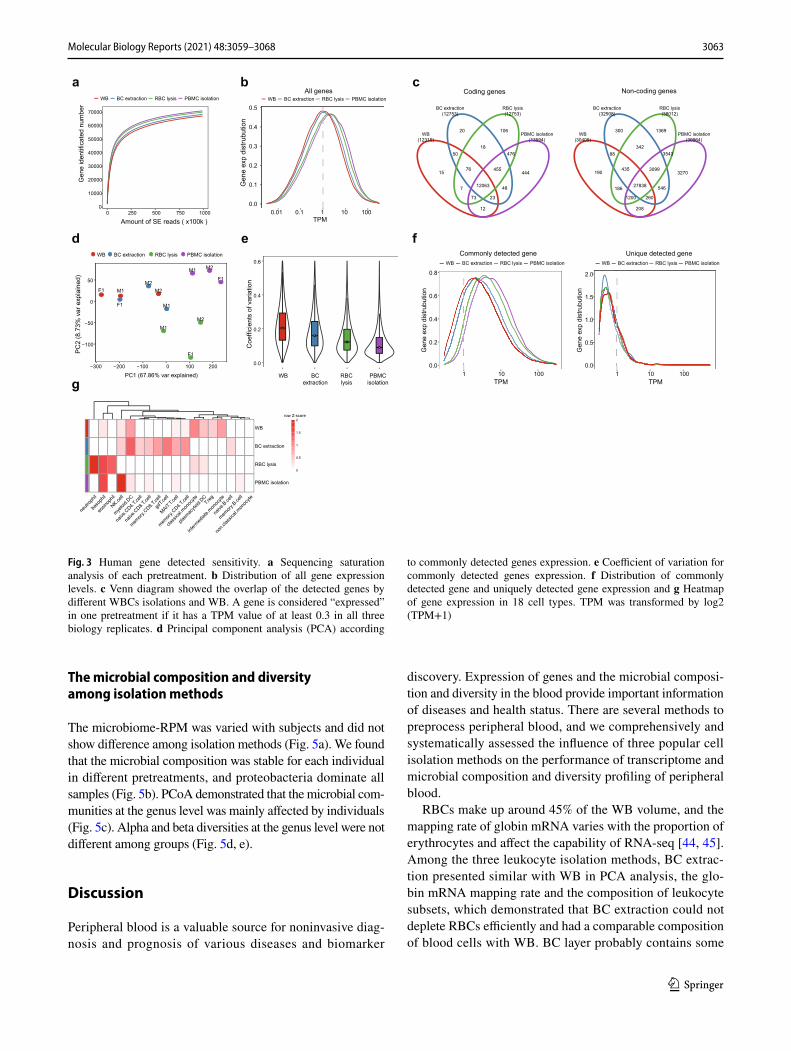
Saturation curves displayed that the number of detected genes performed PBMC isolation ≥ RBC lysis > BC extrac-tion > WB at a random number of clean reads (Fig. 3a). The number of high abundance genes (TPM > 1) and uniquely detected genes (only detected in one cell group) (Fig. 3b, c) showed similar trends.
According to the commonly detected genes of the four cell groups, the PCA showed that the expression profil-ing of WB and BC extraction were similar and the other two groups were distinct (Fig. 3d), and the CV performed PBMC isolation < RBC lysis < BC extraction < WB (Fig. 3e). Compared with the expression of commonly detected genes, that of uniquely detected genes was lower (Fig. 3f). We further found that the uniquely detected genes in RBC lysis were highly expressed in granulocytes
(neutrophils, basophils and eosinophils), and those in PBMC isolation were highly expressed in basophils and NK cells (Fig. 3g). Enrichment analysis for DisGeNET did not identify significant terms.
Characterization of DEGs among isolation methods
The fold change distribution of DEGs in any two groups was shown in Fig. 4a. No DEG was identified between BC and WB. Through WGCNA, we successfully identified two integrative gene modules, and labeled by black and yellow (Fig. 4b). Furthermore, we found that the black module showed positive correlations with WB and BC extraction, while the yellow module showed a positive correlation with RBC lysis and a negative correlation with PBMC isolation (Fig. 4c). Heatmap showed that genes in black module had relatively high expression in WB and BC extraction, while those in the yellow module were highly expressed in RBC lysis (Fig. 4d).
The enrichment analysis of cell type showed coding gens in black module were significantly enriched in eryth-rocytes and yellow module were enriched in neutrophils (Fig. S3A) which consistent with the principle of experi-ments. We further found that the genes in black and yellow modules were also expressed in other leukocyte subsets (Fig. S3B). The gene expression distributions of black and yellow modules were shown in Fig. 4e. In DisGeNET enrichment analysis terms, the genes in black module were mostly enriched in erythrocytes related disease such as erythroleukemia, anemia, beta thalassemia intermedia, acute erythroblastic leukemia and hereditary spherocytosis (Fig. 4f). Genes in yellow module were mostly enriched in inflammation-related diseases, such as pneumonitis, inflammation, infection, Juvenile psoriatic arthritis and inflammatory dermatosis (Fig. 4f).
M1
M2
F1
M1M2
F1M1
M2F1
M1
M2
F1
0
10
20
30
WB BCextraction
RBClysis
PBMCisolation
Glo
bin
mR
NA
read
s / c
lean
read
s (%
)
a b
*
*
(Tregs)
0
20
40
60
80
Neutrophils Monocytes T cells CD8 T cells CD4naive
T cellsregulatory
NK cellsresting
Rel
ativ
e pr
opor
tion
(%)
WB BC extraction RBC lysis PBMC isolation
** *
**
**
***
***
***
Fig. 2 Blood cell subsets among WBCs isolations and WB. a Percentage of globin mRNA reads in clean reads. b The relative proportions of neutrophils, monocytes, CD8 cells, CD4 naïve cells, T regulatory cells, and NK cells resting. *Shows p-value < = 0.05
3063Molecular Biology Reports (2021) 48:3059–3068
1 3
The microbial composition and diversity among isolation methods
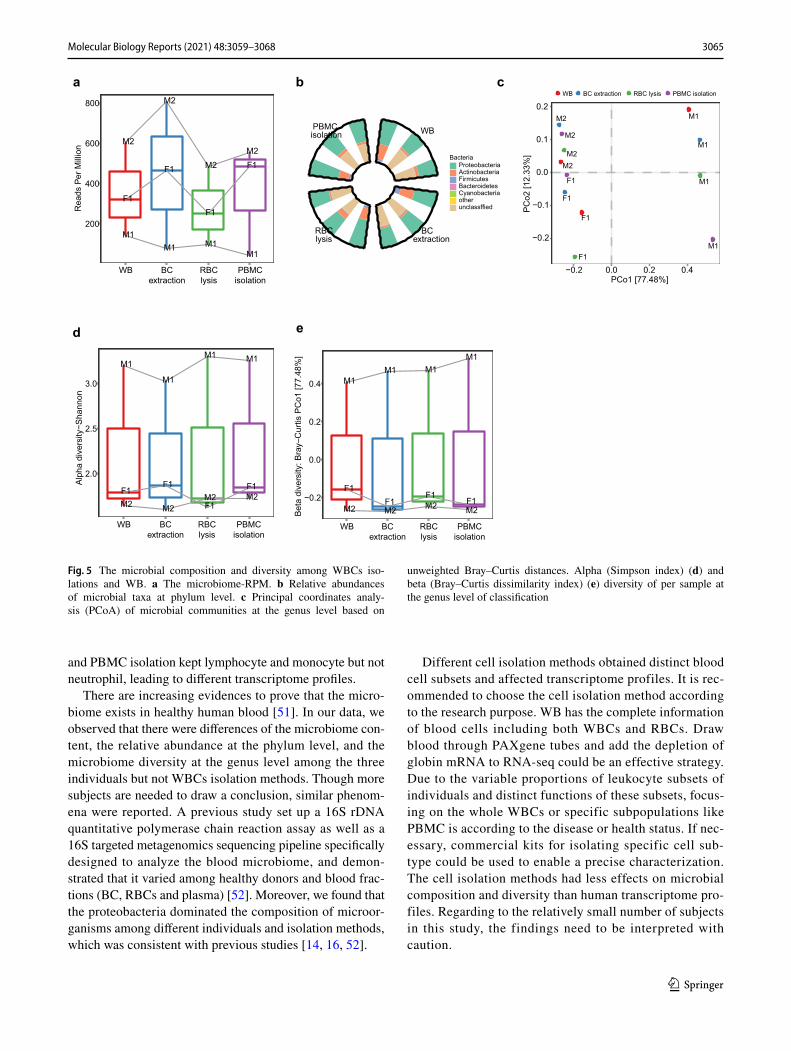
The microbiome-RPM was varied with subjects and did not show difference among isolation methods (Fig. 5a). We found that the microbial composition was stable for each individual in different pretreatments, and proteobacteria dominate all samples (Fig. 5b). PCoA demonstrated that the microbial com-munities at the genus level was mainly affected by individuals (Fig. 5c). Alpha and beta diversities at the genus level were not different among groups (Fig. 5d, e).
Discussion
Peripheral blood is a valuable source for noninvasive diag-nosis and prognosis of various diseases and biomarker
discovery. Expression of genes and the microbial composi-tion and diversity in the blood provide important information of diseases and health status. There are several methods to preprocess peripheral blood, and we comprehensively and systematically assessed the influence of three popular cell isolation methods on the performance of transcriptome and microbial composition and diversity profiling of peripheral blood.
RBCs make up around 45% of the WB volume, and the mapping rate of globin mRNA varies with the proportion of erythrocytes and affect the capability of RNA-seq [44, 45]. Among the three leukocyte isolation methods, BC extrac-tion presented similar with WB in PCA analysis, the glo-bin mRNA mapping rate and the composition of leukocyte subsets, which demonstrated that BC extraction could not deplete RBCs efficiently and had a comparable composition of blood cells with WB. BC layer probably contains some
a cb
0
10000
20000
30000
40000
50000
60000
70000
0 250 500 750 1000
Amount of SE reads ( x100k )
Gen
e id
entif
icat
ed n
umbe
r
WB BC extraction RBC lysis PBMC isolation
M1 M2F1
M1
M2
F1
M1M2
F1
M1 M2
F1
−100
−50
0
50
−300 −200 −100 0 100 200
PC1 (67.86% var explained)
PC
2 (8
.73%
var
exp
lain
ed)
WB BC extraction RBC lysis PBMC isolation
0.0
0.2
0.4
0.6
WB BCextraction
RBClysis
PBMCisolation
Coe
ffici
ents
of v
aria
tion
d e
444
106
476
20
48
18
45515
12
7
73
50
23
76
12063
WB(12319)
BC extraction(12753)
RBC lysis(12753)
PBMC isolation(13594)
3270
1369
3543
300
546
342
3099190
208
186
1200
88
260
435
27838
WB(30405)
BC extraction(32908)
RBC lysis(38012)
PBMC isolation(39964)
0.0
0.2
0.4
0.6
0.8
1 10 100TPM
Gen
e ex
p di
stru
butio
n
Commonly detected geneWB BC extraction RBC lysis PBMC isolation
0.0
0.5
1.0
1.5
2.0
1 10 100TPM
Gen
e ex
p di
stru
butio
n
Unique detected geneWB BC extraction RBC lysis PBMC isolation
neutr
ophil
baso
phil
eosin
ophil
NK.cell
myeloi
d.DC
naive
.CD4.T
.cell
naive
.CD8.T
.cell
memory
.CD8.T
.cell
gdT.c
ell
MAIT.T.c
ell
memory
.CD4.T
.cell
class
ical.m
onoc
yte
plasm
acyto
id.DC
T.reg
interm
ediat
e.mon
ocyte
naive
.B.ce
ll
memory
.B.ce
ll
non.c
lassic
al.mon
ocyte
WB
BC extraction
RBC lysis
PBMC isolation
0
0.5
1
1.5
2
0.0
0.1
0.2
0.3
0.4
0.5
0.01 0.1 1 10 100TPM
Gen
e ex
p di
stru
butio
n
All genesWB BC extraction RBC lysis PBMC isolation
Coding genes Non-coding genes
f
g
row Z-score
Fig. 3 Human gene detected sensitivity. a Sequencing saturation analysis of each pretreatment. b Distribution of all gene expression levels. c Venn diagram showed the overlap of the detected genes by different WBCs isolations and WB. A gene is considered “expressed” in one pretreatment if it has a TPM value of at least 0.3 in all three biology replicates. d Principal component analysis (PCA) according
to commonly detected genes expression. e Coefficient of variation for commonly detected genes expression. f Distribution of commonly detected gene and uniquely detected gene expression and g Heatmap of gene expression in 18 cell types. TPM was transformed by log2 (TPM+1)

3064 Molecular Biology Reports (2021) 48:3059–3068
1 3
RBCs, or BC extraction inevitably includes erythrocyte layer [18, 46]. With the comparable residue of erythrocytes as WB, the RNA-seq data of BC extraction showed a smaller number of detected genes, a higher GC content and a higher proportion of CDS exon than RBC lysis and PBMC separa-tion. More genes with low abundance (TPM < 1) and less uniquely detected genes were also identified in WB and BC extraction. In addition, genes in the black module positively associated with WB and BC extraction, were observed with high abundance in these two groups and enriched in diseases such as anemia and beta thalassemia. As a result, BC extrac-tion could not remove erythrocytes effectively and affected the capability of RNA-seq.
WBCs are important components of the peripheral immune system and play an essential role in protecting the body against infection, illness and disease. They include granulocytes, monocytes and lymphocytes. In healthy peripheral blood, neutrophil ranges from 50 to 75%, mono-cytes range from 1 to 8%, and lymphocytes range from 20
to 40% [47]. The relative proportions and expression of leu-kocyte subsets change with diseases [48–50]. Neutrophil is usually maintained by RBC lysis but depleted by PBMC isolation. Though these two isolation methods removed most erythrocytes, they showed distinct transcriptome profiles due to maintaining neutrophils or not. Our results showed that the variability of gene expression was higher in RBC lysis compared with PBMC isolation, which might be caused by the variation of the proportion of neutrophils (51.19% ± 10.05%) in RBC lysis. Genes uniquely detected in RBC lysis showed low abundance (TPM < 1), and had rela-tively high expression in granulocytes (including neutrophil, basophil and eosinophil). Genes uniquely detected in PBMC isolation also presented low abundance (TPM < 1), and had relatively high expression in basophils and NK cells. The neutrophil genes expressed more highly in RBC lysis than PBMC isolation as we observed in the yellow module [22, 23], and these genes enriched in infection and inflammation. In conclusion, RBC lysis maintained most WBC subsets,
0.3
0.4
0.5
0.6
0.7
0.8
0.9
1.0
Cluster Dendrogram
Hei
ght
Dynamic Tree Cut
Merged dynamic
row Z-score
Method
WB
BC extraction
RBC lysis
PBMC isolation
Cluster
black
yellow
0
0.5
1
1.5
2
Module−trait relationships
−1
−0.5
0
0.5
1
WB BC extraction RBC lysis PBMC isolation
MEblack(329, 123)
MEyellow(576, 821)
MEgrey(1, 1)
0.63(0.03)
0.49(0.1)
−0.51(0.09)
−0.61(0.04)
−0.18(0.6)
0.013(1)
0.84(6e−04)
−0.67(0.02)
−0.01(1)
0.23(0.5)
−0.098(0.8)
−0.12(0.7)
a b
c
dUp: 1521 (789, 732) Down: 45 (19, 26)
Up: 1115 (586, 529) Down: 6 (1, 5)
Up: 1213 (494, 719) Down: 4 (2, 2)
Up: 121 (96, 25) Down: 10 (0, 10)
Up: 0 (0, 0) Down: 1 (0, 1)
BC extraction vs. RBC lysis
WB vs. RBC lysis
RBC lysis vs. PBMC isolation
BC extraction vs. PBMC isolation
WB vs. PBMC isolation
−10 −5 0 5 10
050
100150200250
0
50
100
150
0
50
100
150
200
0
5
10
15
0.00
0.25
0.50
0.75
1.00
log2 (Fold Change)
DEG
s nu
mbe
r
0.0
0.2
0.4
0.01 0.1 1 10 100 1000 10000TPM
Gen
e ex
p di
stru
butio
n
Black moduleWB BC extraction RBC lysis PBMC isolation
0.0
0.2
0.4
0.6
0.01 0.1 1 10 100 1000TPM
Gen
e ex
p di
stru
butio
n
Yellow moduleWB BC extraction RBC lysis PBMC isolation
e
2217
102211
15
6749
472438
47
Black
Yellow
5 10 15 20
Erythroleukemia (Erythroid/Myeloid)Anemia, HemolyticBeta thalassemia intermediaAcute Erythroblastic LeukemiaHereditary spherocytosisCooley's anemia
PneumonitisInflammationInfectionJuvenile psoriatic arthritisInflammatory dermatosisBacterial Infections
−log10 (q−Value)
DisGeNET enrichment analysis termsf
Fig. 4 Human gene expression profile difference among WBCs iso-lations and WB. a The fold change distribution of DEGs. b Gene dendrogram. The color row underneath the dendrogram shows the module assignment determined by the Dynamic Tree Cut. c Pearson correlation between module eigengene and the pretreatment. The cor
(up) and p-value (down) are shown in box. The numbers of coding (left) and non-coding (right) gene are shown in brackets. d Heatmap of genes expression in each sample. TPM was transformed by log2 (TPM + 1). e Distribution of gene expression levels. f Summary of enrichment analysis in DisGeNET. (Color figure online)
3065Molecular Biology Reports (2021) 48:3059–3068
1 3
and PBMC isolation kept lymphocyte and monocyte but not neutrophil, leading to different transcriptome profiles.
There are increasing evidences to prove that the micro-biome exists in healthy human blood [51]. In our data, we observed that there were differences of the microbiome con-tent, the relative abundance at the phylum level, and the microbiome diversity at the genus level among the three individuals but not WBCs isolation methods. Though more subjects are needed to draw a conclusion, similar phenom-ena were reported. A previous study set up a 16S rDNA quantitative polymerase chain reaction assay as well as a 16S targeted metagenomics sequencing pipeline specifically designed to analyze the blood microbiome, and demon-strated that it varied among healthy donors and blood frac-tions (BC, RBCs and plasma) [52]. Moreover, we found that the proteobacteria dominated the composition of microor-ganisms among different individuals and isolation methods, which was consistent with previous studies [14, 16, 52].
Different cell isolation methods obtained distinct blood cell subsets and affected transcriptome profiles. It is rec-ommended to choose the cell isolation method according to the research purpose. WB has the complete information of blood cells including both WBCs and RBCs. Draw blood through PAXgene tubes and add the depletion of globin mRNA to RNA-seq could be an effective strategy. Due to the variable proportions of leukocyte subsets of individuals and distinct functions of these subsets, focus-ing on the whole WBCs or specific subpopulations like PBMC is according to the disease or health status. If nec-essary, commercial kits for isolating specific cell sub-type could be used to enable a precise characterization. The cell isolation methods had less effects on microbial composition and diversity than human transcriptome pro-files. Regarding to the relatively small number of subjects in this study, the findings need to be interpreted with caution.
M1
M2
F1
M1
M2
F1
M1
M2
F1
M1
M2F1
200
400
600
800
WB BCextraction
RBClysis
PBMCisolation
Rea
ds P
er M
illio
n
WB
BCextraction
RBClysis
PBMCisolation
BacteriaProteobacteriaActinobacteriaFirmicutesBacteroidetesCyanobacteriaotherunclassffied
M1
M2F1
M1
M2
F1
M1
M2F1
M1
M2F1
2.0
2.5
3.0
WB BCextraction
RBClysis
PBMCisolation
Alp
ha d
iver
sity
−Sha
nnon
M1
M2
F1
M1
M2F1
M1
M2F1
M1
M2F1−0.2
0.0
0.2
0.4
WB BCextraction
RBClysis
PBMCisolation
Bet
a di
vers
ity: B
ray–
Cur
tis P
Co1
[77.
48%
]
a b c
d
M1
M2
F1
M1
M2
F1
M1
M2
F1M1
M2
F1
−0.2
−0.1
0.0
0.1
0.2
−0.2 0.0 0.2 0.4PCo1 [77.48%]
PC
o2 [1
2.33
%]
WB BC extraction RBC lysis PBMC isolation
e
Fig. 5 The microbial composition and diversity among WBCs iso-lations and WB. a The microbiome-RPM. b Relative abundances of microbial taxa at phylum level. c Principal coordinates analy-sis (PCoA) of microbial communities at the genus level based on
unweighted Bray–Curtis distances. Alpha (Simpson index) (d) and beta (Bray–Curtis dissimilarity index) (e) diversity of per sample at the genus level of classification

3066 Molecular Biology Reports (2021) 48:3059–3068
1 3
Conclusions
We systematically assessed the effect of BC extraction, RBC lysis and PBMC isolation on human transcriptome profiles and microbial transcripts, and found that the com-position of blood cell subpopulations varied with these methods. We provide a reference for researchers to develop proper sample processing strategies for their own study purposes.
Supplementary Information The online version contains supplemen-tary material available at https:// doi. org/ 10. 1007/ s11033- 021- 06382-1.
Acknowledgements We are grateful to the healthy volunteers who par-ticipated in the study, and the colleagues in BGI-Shenzhen who helped to conduct RNA sequencing. We also thank Dr. Qing Zhou, Dr. Zhong-zhen Liu and Jinghua Sun for giving their comments on this study. We thank Liang Wu for sharing his analysis method on this study.
Funding This project is supported by the National Natural Science Foundation of China (No.81300075), the Natural Science Founda-tion of Guangdong Province (No. 2014A030313795), the Shenzhen Municipal Government of China (No.JCYJ20170412152854656, JCYJ20180703093402288), and the Shenzhen Peacock Plan (No. KQTD20150330171505310).
Availability of data The data reported in this study are also available in the CNGB Nucleotide Sequence Archive (CNSA: https:// db. cngb. org/ cnsa; accession number CNP0000266).
Declarations
Conflict of interest The authors declare no conflicts of interest.
Informed consent All volunteers signed informed consent, and the study protocol was approved by the BGI Institutional Review Board (NO. BGI-IRB 17166).
References
1. Petrov PD, Bonet ML, Reynes B, Oliver P, Palou A, Ribot J (2016) Whole blood RNA as a source of transcript-based nutrition- and metabolic health-related biomarkers. PLoS ONE 11(5):e0155361. https:// doi. org/ 10. 1371/ journ al. pone. 01553 61
2. Chomczynski P, Wilfinger WW, Eghbalnia HR, Kennedy A, Rymaszewski M, Mackey K (2016) Inter-individual differ-ences in RNA levels in human peripheral blood. PLoS ONE 11(2):e0148260. https:// doi. org/ 10. 1371/ journ al. pone. 01482 60
3. Soreq L, Salomonis N, Guffanti A, Bergman H, Israel Z, Soreq H (2015) Whole transcriptome RNA sequencing data from blood leukocytes derived from Parkinson’s disease patients prior to and following deep brain stimulation treatment. Genom Data 3:57–60. https:// doi. org/ 10. 1016/j. gdata. 2014. 11. 009
4. Persson H, Kwon AT, Ramilowski JA, Silberberg G, Soderhall C, Orsmark-Pietras C, Nordlund B, Konradsen JR, de Hoon MJ, Melen E, Hayashizaki Y, Hedlin G, Kere J, Daub CO (2015) Transcriptome analysis of controlled and therapy-resistant childhood asthma reveals distinct gene expression profiles. J
Allergy Clin Immunol 136(3):638–648. https:// doi. org/ 10. 1016/j. jaci. 2015. 02. 026
5. Sumitomo S, Nagafuchi Y, Tsuchida Y, Tsuchiya H, Ota M, Ishigaki K, Suzuki A, Kochi Y, Fujio K, Yamamoto K (2018) Transcriptome analysis of peripheral blood from patients with rheumatoid arthritis: a systematic review. Inflamm Regen 38:21. https:// doi. org/ 10. 1186/ s41232- 018- 0078-5
6. Lequerre T, Gauthier-Jauneau AC, Bansard C, Derambure C, Hiron M, Vittecoq O, Daveau M, Mejjad O, Daragon A, Tron F, Le Loet X, Salier JP (2006) Gene profiling in white blood cells predicts infliximab responsiveness in rheumatoid arthritis. Arthritis Res Ther 8(4):R105. https:// doi. org/ 10. 1186/ ar1990
7. Holcomb ZE, Tsalik EL, Woods CW, McClain MT (2017) Host-based peripheral blood gene expression analysis for diagnosis of infectious diseases. J Clin Microbiol 55(2):360–368. https:// doi. org/ 10. 1128/ JCM. 01057- 16
8. Tarca AL, Romero R, Erez O, Gudicha DW, Than NG, Bensh-alom-Tirosh N, Pacora P, Hsu CD, Chaiworapongsa T, Hassan SS, Gomez-Lopez N (2020) Maternal whole blood mRNA sig-natures identify women at risk of early preeclampsia: a longi-tudinal study. J Matern Fetal Neonatal Med. https:// doi. org/ 10. 1080/ 14767 058. 2019. 16859 64
9. Hong S, Banchereau R, Maslow BL, Guerra MM, Cardenas J, Baisch J, Branch DW, Porter TF, Sawitzke A, Laskin CA, Buyon JP, Merrill J, Sammaritano LR, Petri M, Gatewood E, Cepika AM, Ohouo M, Obermoser G, Anguiano E, Kim TW, Nulsen J, Nehar-Belaid D, Blankenship D, Turner J, Banchereau J, Salmon JE, Pascual V (2019) Longitudinal profiling of human blood transcriptome in healthy and lupus pregnancy. J Exp Med 216(5):1154–1169. https:// doi. org/ 10. 1084/ jem. 20190 185
10. Giamarellos-Bourboulis EJ, Netea MG, Rovina N, Akinosoglou K, Antoniadou A, Antonakos N, Damoraki G, Gkavogianni T, Adami ME, Katsaounou P, Ntaganou M, Kyriakopoulou M, Dimopoulos G, Koutsodimitropoulos I, Velissaris D, Koufar-gyris P, Karageorgos A, Katrini K, Lekakis V, Lupse M, Kotsaki A, Renieris G, Theodoulou D, Panou V, Koukaki E, Koulouris N, Gogos C, Koutsoukou A (2020) Complex immune dysregula-tion in COVID-19 patients with severe respiratory failure. Cell Host Microbe 27(6):992-1000 e1003. https:// doi. org/ 10. 1016/j. chom. 2020. 04. 009
11. Zhang D, Guo R, Lei L, Liu H, Wang Y, Wang Y, Qian H, Dai T, Zhang T, Lai Y, Wang J, Liu Z, Chen T, He A, O’Dwyer M, Hu J (2020) COVID-19 infection induces readily detectable morphologic and inflammation-related phenotypic changes in peripheral blood monocytes. J Leukoc Biol. https:// doi. org/ 10. 1002/ JLB. 4HI07 20- 470R
12. Qiu J, Zhou H, Jing Y, Dong C (2019) Association between blood microbiome and type 2 diabetes mellitus: a nested case-control study. J Clin Lab Anal 33(4):e22842. https:// doi. org/ 10. 1002/ jcla. 22842
13. Traykova D, Schneider B, Chojkier M, Buck M (2017) Blood microbiome quantity and the hyperdynamic circulation in decompensated cirrhotic patients. PLoS ONE 12(2):e0169310. https:// doi. org/ 10. 1371/ journ al. pone. 01693 10
14. Li Q, Wang C, Tang C, Zhao X, He Q, Li J (2018) Identifica-tion and characterization of blood and neutrophil-associated microbiomes in patients with severe acute pancreatitis using next-generation sequencing. Front Cell Infect Microbiol 8:5. https:// doi. org/ 10. 3389/ fcimb. 2018. 00005
15. Amar J, Lange C, Payros G, Garret C, Chabo C, Lantieri O, Courtney M, Marre M, Charles MA, Balkau B, Burcelin R, Group DESIRS (2013) Blood microbiota dysbiosis is associated with the onset of cardiovascular events in a large general popu-lation: the D.E.S.I.R. study. PLoS ONE 8(1):e54461. https:// doi. org/ 10. 1371/ journ al. pone. 00544 61

3067Molecular Biology Reports (2021) 48:3059–3068
1 3
16. Olde Loohuis LM, Mangul S, Ori APS, Jospin G, Koslicki D, Yang HT, Wu T, Boks MP, Lomen-Hoerth C, Wiedau-Pazos M, Cantor RM, de Vos WM, Kahn RS, Eskin E, Ophoff RA (2018) Transcriptome analysis in whole blood reveals increased microbial diversity in schizophrenia. Transl Psychiatry 8(1):96. https:// doi. org/ 10. 1038/ s41398- 018- 0107-9
17. Poore GD, Kopylova E, Zhu Q, Carpenter C, Fraraccio S, Wan-dro S, Kosciolek T, Janssen S, Metcalf J, Song SJ, Kanbar J, Miller-Montgomery S, Heaton R, McKay R, Patel SP, Swafford AD, Knight R (2020) Microbiome analyses of blood and tissues suggest cancer diagnostic approach. Nature 579(7800):567–574. https:// doi. org/ 10. 1038/ s41586- 020- 2095-1
18. Sutton DW, Chen PC, Schmid-Schonbein GW (1988) Cell sepa-ration in the buffy coat. Biorheology 25(4):663–673. https:// doi. org/ 10. 3233/ bir- 1988- 25406
19. Teetson W, Cartwright C, Dreiling BJ, Steinberg MH (1983) The leukocyte composition of peripheral blood buffy coat. Am J Clin Pathol 79(4):500–501. https:// doi. org/ 10. 1093/ ajcp/ 79.4. 500
20. Brisco P, Sankbeil J, Kephart D (1997) RNA purification: a rapid and versatile protocol for the isolation of total RNA. Pro-mega Notes 64:07
21. Ulmer AJ, Scholz W, Ernst M, Brandt E, Flad HD (1984) Isola-tion and subfractionation of human peripheral blood mononu-clear cells (PBMC) by density gradient centrifugation on Per-coll. Immunobiology 166(3):238–250. https:// doi. org/ 10. 1016/ S0171- 2985(84) 80042-X
22. Debey S, Schoenbeck U, Hellmich M, Gathof BS, Pillai R, Zander T, Schultze JL (2004) Comparison of different isola-tion techniques prior gene expression profiling of blood derived cells: impact on physiological responses, on overall expres-sion and the role of different cell types. Pharmacogenomics J 4(3):193–207. https:// doi. org/ 10. 1038/ sj. tpj. 65002 40
23. Feezor RJ, Baker HV, Mindrinos M, Hayden D, Tannahill CL, Brownstein BH, Fay A, MacMillan S, Laramie J, Xiao W, Moldawer LL, Cobb JP, Laudanski K, Miller-Graziano CL, Maier RV, Schoenfeld D, Davis RW, Tompkins RG, Inflamma-tion, Host Response to Injury L-SCRP (2004) Whole blood and leukocyte RNA isolation for gene expression analyses. Physiol Genomics 19(3):247–254. https:// doi. org/ 10. 1152/ physi olgen omics. 00020. 2004
24. Adiconis X, Borges-Rivera D, Satija R, DeLuca DS, Busby MA, Berlin AM, Sivachenko A, Thompson DA, Wysoker A, Fennell T, Gnirke A, Pochet N, Regev A, Levin JZ (2013) Comparative analysis of RNA sequencing methods for degraded or low-input samples. Nat Methods 10(7):623–629. https:// doi. org/ 10. 1038/ nmeth. 2483
25. Chen Y, Chen Y, Shi C, Huang Z, Zhang Y, Li S, Li Y, Ye J, Yu C, Li Z, Zhang X, Wang J, Yang H, Fang L, Chen Q (2018) SOAPnuke: a MapReduce acceleration-supported software for integrated quality control and preprocessing of high-throughput sequencing data. Gigascience 7(1):1–6. https:// doi. org/ 10. 1093/ gigas cience/ gix120
26. Li R, Yu C, Li Y, Lam TW, Yiu SM, Kristiansen K, Wang J (2009) SOAP2: an improved ultrafast tool for short read align-ment. Bioinformatics 25(15):1966–1967. https:// doi. org/ 10. 1093/ bioin forma tics/ btp336
27. Kim D, Langmead B, Salzberg SL (2015) HISAT: a fast spliced aligner with low memory requirements. Nat Methods 12(4):357–360. https:// doi. org/ 10. 1038/ nmeth. 3317
28. DeLuca DS, Levin JZ, Sivachenko A, Fennell T, Nazaire MD, Williams C, Reich M, Winckler W, Getz G (2012) RNA-SeQC: RNA-seq metrics for quality control and process optimization. Bioinformatics 28(11):1530–1532. https:// doi. org/ 10. 1093/ bioin forma tics/ bts196
29. Langmead B, Salzberg SL (2012) Fast gapped-read alignment with Bowtie 2. Nat Methods 9(4):357–359. https:// doi. org/ 10. 1038/ nmeth. 1923
30. Rosenbloom KR, Armstrong J, Barber GP, Casper J, Clawson H, Diekhans M, Dreszer TR, Fujita PA, Guruvadoo L, Haeussler M, Harte RA, Heitner S, Hickey G, Hinrichs AS, Hubley R, Karol-chik D, Learned K, Lee BT, Li CH, Miga KH, Nguyen N, Paten B, Raney BJ, Smit AF, Speir ML, Zweig AS, Haussler D, Kuhn RM, Kent WJ (2015) The UCSC Genome Browser database: 2015 update. Nucleic Acids Res 43(Database issue):D670–D681. https:// doi. org/ 10. 1093/ nar/ gku11 77
31. Fang S, Zhang L, Guo J, Niu Y, Wu Y, Li H, Zhao L, Li X, Teng X, Sun X, Sun L, Zhang MQ, Chen R, Zhao Y (2018) NON-CODEV5: a comprehensive annotation database for long non-coding RNAs. Nucleic Acids Res 46(D1):D308–D314. https:// doi. org/ 10. 1093/ nar/ gkx11 07
32. Bray NL, Pimentel H, Melsted P, Pachter L (2016) Erratum: near-optimal probabilistic RNA-seq quantification. Nat Biotechnol 34(8):888. https:// doi. org/ 10. 1038/ nbt08 16- 888d
33. Newman AM, Liu CL, Green MR, Gentles AJ, Feng W, Xu Y, Hoang CD, Diehn M, Alizadeh AA (2015) Robust enumera-tion of cell subsets from tissue expression profiles. Nat Methods 12(5):453–457. https:// doi. org/ 10. 1038/ nmeth. 3337
34. Robinson MD, McCarthy DJ, Smyth GK (2010) edgeR: a Bio-conductor package for differential expression analysis of digital gene expression data. Bioinformatics 26(1):139–140. https:// doi. org/ 10. 1093/ bioin forma tics/ btp616
35. Benjamini Y, Hochberg Y (1995) Controlling the false discovery rate: a practical and powerful approach to multiple testing. J R Stat Soc Ser B 57:289–300
36. Langfelder P, Horvath S (2008) WGCNA: an R package for weighted correlation network analysis. BMC Bioinform 9:559. https:// doi. org/ 10. 1186/ 1471- 2105-9- 559
37. https:// horva th. genet ics. ucla. edu/ html/ Coexp ressi onNet work/ Rpack ages/ WGCNA/ faq. html
38. Zhou Y, Zhou B, Pache L, Chang M, Khodabakhshi AH, Tana-seichuk O, Benner C, Chanda SK (2019) Metascape provides a biologist-oriented resource for the analysis of systems-level datasets. Nat Commun 10(1):1523. https:// doi. org/ 10. 1038/ s41467- 019- 09234-6
39. Pinero J, Bravo A, Queralt-Rosinach N, Gutierrez-Sacristan A, Deu-Pons J, Centeno E, Garcia-Garcia J, Sanz F, Furlong LI (2017) DisGeNET: a comprehensive platform integrating infor-mation on human disease-associated genes and variants. Nucleic Acids Res 45(D1):D833–D839. https:// doi. org/ 10. 1093/ nar/ gkw943
40. Pathan M, Keerthikumar S, Ang CS, Gangoda L, Quek CY, Wil-liamson NA, Mouradov D, Sieber OM, Simpson RJ, Salim A, Bacic A, Hill AF, Stroud DA, Ryan MT, Agbinya JI, Mariadason JM, Burgess AW, Mathivanan S (2015) FunRich: an open access standalone functional enrichment and interaction network analysis tool. Proteomics 15(15):2597–2601. https:// doi. org/ 10. 1002/ pmic. 20140 0515
41. Ponten F, Jirstrom K, Uhlen M (2008) The Human Protein Atlas—a tool for pathology. J Pathol 216(4):387–393. https:// doi. org/ 10. 1002/ path. 2440
42. Zerbino DR, Achuthan P, Akanni W, Amode MR, Barrell D, Bhai J, Billis K, Cummins C, Gall A, Giron CG, Gil L, Gordon L, Haggerty L, Haskell E, Hourlier T, Izuogu OG, Janacek SH, Juettemann T, To JK, Laird MR, Lavidas I, Liu Z, Loveland JE, Maurel T, McLaren W, Moore B, Mudge J, Murphy DN, Newman V, Nuhn M, Ogeh D, Ong CK, Parker A, Patricio M, Riat HS, Schuilenburg H, Sheppard D, Sparrow H, Taylor K, Thormann A, Vullo A, Walts B, Zadissa A, Frankish A, Hunt SE, Kostadima M, Langridge N, Martin FJ, Muffato M, Perry E, Ruffier M, Staines DM, Trevanion SJ, Aken BL, Cunningham F, Yates A, Flicek P

3068 Molecular Biology Reports (2021) 48:3059–3068
1 3
(2018) Ensembl 2018. Nucleic Acids Res 46(D1):D754–D761. https:// doi. org/ 10. 1093/ nar/ gkx10 98
43. Wood DE, Salzberg SL (2014) Kraken: ultrafast metagenomic sequence classification using exact alignments. Genome Biol 15(3):R46. https:// doi. org/ 10. 1186/ gb- 2014- 15-3- r46
44. Choi I, Bao H, Kommadath A, Hosseini A, Sun X, Meng Y, Stothard P, Plastow GS, Tuggle CK, Reecy JM, Fritz-Waters E, Abrams SM, Lunney JK, le Guan L (2014) Increasing gene discovery and coverage using RNA-seq of globin RNA reduced porcine blood samples. BMC Genomics 15:954. https:// doi. org/ 10. 1186/ 1471- 2164- 15- 954
45. Mastrokolias A, den Dunnen JT, van Ommen GB, t Hoen PA, van Roon-Mom WM (2012) Increased sensitivity of next generation sequencing-based expression profiling after globin reduction in human blood RNA. BMC Genomics 13:28. https:// doi. org/ 10. 1186/ 1471- 2164- 13- 28
46. Sorg N, Poppe C, Bunos M, Wingenfeld E, Hummer C, Kramer A, Stock B, Seifried E, Bonig H (2015) Red blood cell depletion from bone marrow and peripheral blood buffy coat: a compari-son of two new and three established technologies. Transfusion 55(6):1275–1282. https:// doi. org/ 10. 1111/ trf. 13001
47. Alberts B (2002) Molecular biology of the cell, 4th edn. Garland Science, New York
48. Bobdey S, Ganesh B, Mishra P, Jain A (2017) Role of mono-cyte count and neutrophil-to-lymphocyte ratio in survival of oral
cancer patients. Int Arch Otorhinolaryngol 21(1):21–27. https:// doi. org/ 10. 1055/s- 0036- 15873 18
49. Liu G, Zhang S, Hu H, Liu T, Huang J (2020) The role of neu-trophil-lymphocyte ratio and lymphocyte-monocyte ratio in the prognosis of type 2 diabetics with COVID-19. Scott Med J 65(4):154–160. https:// doi. org/ 10. 1177/ 00369 33020 953516
50. Kazancioglu S, Yilmaz FM, Bastug A, Sakalli A, Ozbay BO, Buyuktarakci C, Bodur H, Yilmaz G (2020) Lymphocyte subset alteration and monocyte CD4 expression reduction in patients with severe COVID-19. Viral Immunol. https:// doi. org/ 10. 1089/ vim. 2020. 0166
51. Castillo DJ, Rifkin RF, Cowan DA, Potgieter M (2019) The healthy human blood microbiome: fact or fiction? Front Cell Infect Microbiol 9:148. https:// doi. org/ 10. 3389/ fcimb. 2019. 00148
52. Paisse S, Valle C, Servant F, Courtney M, Burcelin R, Amar J, Lelouvier B (2016) Comprehensive description of blood microbi-ome from healthy donors assessed by 16S targeted metagenomic sequencing. Transfusion 56(5):1138–1147. https:// doi. org/ 10. 1111/ trf. 13477
Publisher’s Note Springer Nature remains neutral with regard to jurisdictional claims in published maps and institutional affiliations.