the effect of consumption volume on profile and liking of oral
TRANSCRIPT

The effect of consumption volume on profile and liking of oral nutritional supplements of varied sweetness: sequential profiling and boredom tests
Article
Accepted Version
Methven, L., Rahelu, K., Economoua, N., Kinneavya, L., Ladbrooke-Davis, L., Kennedy, O., Mottram, D. S. and Gosney, M. (2010) The effect of consumption volume on profile and liking of oral nutritional supplements of varied sweetness: sequential profiling and boredom tests. Food Quality and Preference, 21 (8). pp. 948-955. ISSN 0950-3293 doi: https://doi.org/10.1016/j.foodqual.2010.04.009 Available at http://centaur.reading.ac.uk/8137/
It is advisable to refer to the publisher’s version if you intend to cite from the work. See Guidance on citing .
To link to this article DOI: http://dx.doi.org/10.1016/j.foodqual.2010.04.009
Publisher: Elsevier

All outputs in CentAUR are protected by Intellectual Property Rights law, including copyright law. Copyright and IPR is retained by the creators or other copyright holders. Terms and conditions for use of this material are defined in the End User Agreement .
www.reading.ac.uk/centaur
CentAUR
Central Archive at the University of Reading
Reading’s research outputs online
1
The Effect of Consumption Volume on Profile and Liking of Oral Nutritional 1
Supplements of Varied Sweetness: Sequential Profiling and Boredom Tests 2
3
L. Methvena*, K. Rahelua, N. Economoua, L. Kinneavya, L. Ladbrooke-Davisa, O. B. 4
Kennedya, D. S. Mottrama , M. A. Gosneyb 5
6
aDepartment of Food and Nutritional Sciences, University of Reading, Whiteknights, 7
Reading RG6 6AP, UK 8
bClinical Health Sciences, University of Reading, London Road, Reading, Berkshire, RG1 9
5AQ 10
*Corresponding author. Fax: +44 (0)118 9310080. E-mail address: 11
Running Title: Sequential Profile and Liking of Oral Nutritional Supplements 13
14
Abstract 15
Oral nutrition supplements (ONS) are routinely prescribed to those with, or at risk of, 16
malnutrition. Previous research identified poor compliance due to taste and sweetness. 17
This paper investigates taste and hedonic liking of ONS, of varying sweetness and metallic 18
levels, over consumption volume; an important consideration as patients are prescribed 19
large volumes of ONS daily. A sequential descriptive profile was developed to determine 20
the perception of sensory attributes over repeat consumption of ONS. Changes in liking of 21
ONS following repeat consumption were characterised by a boredom test. Certain flavour 22
(metallic taste, soya milk flavour) and mouthfeel (mouthdrying, mouthcoating) attributes 23
built up over increased consumption volume (p≤0.002). Hedonic liking data from two 24
cohorts, healthy older volunteers (n=32, median age 73) and patients (n=28, median age 25
85), suggested such build-up was disliked. Efforts made to improve the palatability of ONS 26
2
must take account of the build up of taste and mouthfeel characteristics over increased 27
consumption volume. 28
29
Keywords: oral nutrition supplements, sensory attributes, sequential profile, boredom test 30
31
1. Introduction 32
Malnutrition is a recognised problem in the elderly population, especially in hospitalised 33
subjects; 60% of older people are at risk of malnutrition, or their situation worsening, in 34
hospital (Age Concern, 2006). Identification and treatment of malnutrition in this high-risk 35
group is extremely important to reduce the risk of disease, prevent worsening of any 36
existing conditions and to maintain an optimum quality of life (O’Flynn, Peake, Hickson, 37
Foster and Frost, 2005). Oral nutrition supplements (ONS) are supplementary oral dietary 38
“food” routinely prescribed in-between meals to help improve the nutritional status of those 39
with, or at risk of, malnutrition (Lochs et al, 2006). A review of sixty-two intervention trials 40
(10,187 participants) by Milner, Potter, Vivanti and Avenell (2002) found ONS 41
supplementation to produce consistent weight gain (in 42 trials), and decreased relative 42
risk for mortality in trials where participants were undernourished (n=2461). 43
It has been suggested that the success of ONS may depend on consumption of sufficient 44
quantities over an extended time period (Rahemtulla et al., 2005). A study investigating the 45
effect of quantity of ONS consumed on weight loss and lean tissue in cancer patients, 46
identified a failure to achieve the desired supplement intake prevented patients from 47
obtaining important clinical benefits (Fearon et al., 2003). Gosney (2003) indicated that 48
compliance of ONS can be low, thus limiting the success that can be achieved from 49
prescribing ONS. A 24-hour study of 96 elder care ward patients found that two-thirds of 50
the patients given ONS drank less than 50% of the carton resulting in 63% of ONS being 51
wasted. Poor compliance with ONS has been demonstrated previously; Nolan (1999) 52
3
reported average wastage of two different ONS to be 41 % and 44% and Stableforth 53
(1986) showed that elderly patients with femoral neck fractures only tolerated limited 54
amounts of ONS which meant that large calorie deficits remained. Bolton et al (1992) 55
compared the long term palatability of three commercial ONS products with cancer 56
patients and found that 54% of patients discontinued the trial for flavour reasons. In the 57
2003 study, Gosney (2003) found the greatest wastage of ONS was found in patients who 58
disliked the taste (72%). Of the 67% of patients who completed questionnaires, 56% said 59
they did not like the products and specific dislikes were taste (25%), texture (19%) and 60
sweetness (38%). Other factors that were thought to decrease compliance with ONS 61
include a lack of thirst, chemosensory changes associated with ageing, the unfamiliarity of 62
cartons to elderly people, in comparison to the frequently available cups of tea, and 63
frequent spillage from cartons as a result of decreased dexterity (Gosney, 2003). Taste 64
fatigue, which tends to occur when ONS are consumed regularly over prolonged periods, 65
is thought to contribute to poor compliance (Rahemtulla et al., 2005). 66
A recent study reported age-related differences in preferred sweetness level, which were 67
in-line with increased detection and recognition thresholds for sweetness; an overall dislike 68
of ONS and dislike of the sweetness level of ONS vanilla products (Law, Gosney and 69
Kennedy, 2006; Law 2006). Literature on age related taste threshold changes, and 70
potential affects on food preference are somewhat contradictory. A number of studies have 71
shown sweet taste threshold to increase with age (Zandstra and de Graaf, 1998; Mojet, 72
Heidema and Christ-Hazelhof, 2003; Fukunaga, Uematsu and Sugimoto, 2005), whilst 73
other studies have found no significant age-related decline in sweet perception (Kaneda et 74
al, 2000; Koskinen, Kälviänen and Tuorila 2003). Mojet, Christ-Hazelhof and Heidema 75
(2005) found no correlation between threshold sensitivity and optimal liking concentration 76
for any basic taste stimuli; however Zandstra and de Graaf (1998) did find a trend for high 77

4
optimal concentrations of sucrose and orange flavour in drinks for elderly subjects 78
compared to younger adults. 79
Development of ONS with lower sweetness, by replacing sucrose with an alternative 80
saccharide, palatinoseTM ( -D-glucopyranosyl-1,6-fructose), led to segmentation in 81
preference between consumers who liked the less sweet variants, and those who liked the 82
sweeter control (Methven et al, 2008). The study noted that further work was needed to 83
investigate if there was a difference in liking between ONS of different sweetness levels on 84
consumption of greater quantities, in line with the typical pack size (200 ml). However, 85
there appears to be no study in the literature which examines the specific sensory 86
attributes of ONS or their affect on liking over increasing consumption volume; this latter 87
point is likely to be extremely important in identifying potential reasons for the rejection of 88
ONS, which may arise when greater quantities of ONS are consumed. 89
In order to measure change in sensory perception over consumption time, time intensity 90
profiling (TI) is typically used (Duizer, Bloom and Findlay, 1997), however TI can only 91
characterise a maximum of two attributes per sample. A temporal dominance method 92
(Labbe, Schlich, Pineau, Gilbert and Martin, 2009) has been developed recently, although 93
one potential drawback of this method for products such as ONS could be that attributes of 94
secondary rather than primary dominance might be important determinants of product 95
liking. A previous study used progressive profiling (Jack, Piggott and Paterson, 1994) to 96
profile the textural attributes of hard cheese during mastication. In the present study this 97
idea has been progressed, with the help of Compusense, to a sequential profiling method 98
where up to five attributes are scored over consecutive tastings, at regimented time 99
intervals. 100
The present study aimed to investigate the effect of consumption volume on the sensory 101
profile and liking of ONS. In addition the study aimed to investigate if modifications of 102
sweetness and metallic levels could improve the hedonic liking of ONS. 103
5
2. Materials and methods 104
The commercial ONS (CONS) used was Ensure Vanilla Plus (Abbott Nutrition, 105
Maidenhead, UK), and Lactisole (sodium 2-(4-methoxyphenoxy)-propanoate) was used as 106
a sweetness suppressor (Domino Sugar, American Sugar Refining, USA). Standard 107
ingredients used in the manufacture of ONS were as follows : glucose syrup (Cerestar 108
01921, Cargill, Manchester, UK), sucrose (Tate and Lyle, London, UK), high oleic 109
sunflower oil, canola oil, and rape seed oil (Cargill, Liverpool, UK), sodium caseinate 110
(Bacarel, Stone, UK), milk protein concentrate (MPC85, Bacarel, Stone, UK), soy protein 111
isolate (ProFit SI90, Food Ingredient Technologies, Bedfordshire, UK); soy lecithin 112
(Emulpur IP, Cargill, Hamburg, Germany); commercial blends of emulsifier, vanilla flavour, 113
vitamins and minerals were supplied by Abbott (Abbott Nutrition, Columbus, USA). 114
Mineral water (Harrogate Spa, UK) and medium sliced white bread (Hovis, Windsor, UK) 115
were used as palate cleansers in sensory testing. Sucrose (Tate and Lyle, London, UK) 116
and iron sulphate heptahydrate (Fluka, Sigma Aldrich, Germany) were used for taste 117
threshold tests. 118
2.1 Manufacture of ONS modifications 119
Preparation of suppressed sweetness ONS (SSONS) was carried out by adding the 120
sweetness suppressor lactisole to the commercial vanilla ONS products (0.003mg 121
lactisole/100ml Ensure Plus Vanilla). In addition, ONS samples were manufactured on a 122
pilot scale ultra heat treatment (UHT) plant. The standard formulation (PPSONS) 123
consisted, per 100g, of glucose syrup (17g), sodium caseinate (3.5 g), sucrose (2 g), oil 124
blend (4.4g), milk protein concentrate (1.8 g), soy protein isolate (1.3 g) and a commercial 125
blend of emulsifier, flavour, vitamins and minerals. Ingredients were blended at 60 °C prior 126
to ultra heat treatment by indirect steam injection at 140ºC for 27 seconds. Two 127
formulations were manufactured, the standard formulation (PPSONS) and a formulation 128
without mineral mix(PPNONS). The total solids content of all products measured by 129

6
refractometer, was 32%. The pH ranged from 6.6 to 6.8 and density ranged from 1.05 and 130
1.09 g/ml. All samples were stored at 4ºC prior to tasting. 131
2.2. Sensory methods 132
All sensory evaluation (sensory panel, healthy older volunteer and patient groups) was 133
carried out at room temperature (25 °C +/- 2°C), product temperature was allowed to 134
equilibrate to room temperature; actual product temperature at serving was 20 °C (+/- 3 135
°C). 136
2.2.1 Sensory, volunteer and patient groups 137
This study employed three different groups to assess the products; a trained sensory 138
panel, a healthy older volunteer panel and a patient group. The trained sensory panel 139
comprised 12 adults (11 females, 1 male; median age 42 years, range 33-59), expert in 140
profiling techniques, all had over 1 years experience and had been given a minimum of 4 141
hours training on profiling of ONS. The healthy older volunteer panel comprised 32 142
healthy, older, free-living volunteers (20 females, 12 males; median age 73 years, range 143
66-88). The patients were 28 older adults (11 female, 17 male; median age 85, range 71-144
90) in hospital with a variety of medical conditions. Permission for the studies with the first 145
two panels was granted by the University of Reading Research Ethics committee and the 146
study with patients was approved by the Berkshire National Research Ethics committee 147
(NRES 08H0505176). All participants gave written informed consent prior to taking part in 148
the study. 149
Quantification with the trained panel took place in isolated booths, under artificial daylight 150
unless specified otherwise. Healthy older volunteer panels took place in a central location, 151
using isolated tables; lighting was standard fluorescent lighting. Patients were studied 152
individually at their bedside, under standard hospital lighting conditions.. 153
2.2.2. Sequential profiling 154

7
The trained sensory panel characterised five specific sensory attributes of various ONS in 155
a sequential profile. This is a descriptive profiling method developed to determine the 156
perception of sensory attributes upon repeat consumption of ONS over time. Panellists 157
tasted eight consecutive aliquots (5 ml) of each ONS sample and were instructed to score 158
the selected five attributes following each of the eight tastings. For each tasting, panellists 159
were also instructed to score the same five attributes as after-effects, following 30 s and 160
60 s time delays. A two minute time delay was enforced between samples. Panellists 161
scored each attribute on unstructured line scales with the appropriate anchors. 162
Compusense five was used to design and run the profile and capture data. 163
The five attributes scored were sweet, metallic, soya milk flavour, mouthcoating and 164
mouthdrying. In a previous full quantitative descriptive analysis (QDA) profile of four 165
commercial products (Ensure Vanilla Plus, Abbott Nutrition UK; Fortisip Vanilla, Nutricia 166
Clinical Care UK; Resource Shake Vanilla and Clinutren Vanilla, Nestle Nutrition France) 167
sweet taste was found to be significantly different between samples (p=0.03), soya milk 168
flavour was only found to be significant as an aftertaste (p=0.03) (data not shown). QDA 169
did not reveal significant differences in metallic taste, mouthdrying or mouthcoating; and 170
yet these characteristics were thought to be distinct in ONS. The trained panel commented 171
on this and noted that these attributes appeared to last in the mouth beyond the profiling 172
session. It was, therefore, decided to study metallic, mouthdrying and mouthcoating, 173
alongside sweet taste and soya milk flavour, using the sequential profile. 174
Sequential profile data was collected for the following ONS: standard commercial vanilla 175
ONS (CONS) (Ensure Plus), sweetness suppressed vanilla ONS (SSONS; Lactisole in 176
Ensure; 0.003g/100ml), pilot ONS control (PPSONS, with vitamins and minerals) and pilot 177
ONS with no mineral addition (PPNONS). 178
The commercial products (with and without lactose) were tasted in one week, in replicate, 179
samples presented in a balanced order. The pilot plant products were presented in 180
8
replicate in a separate week, in balanced order. Samples were coded with 3-digit numbers; 181
however, all samples which were the same received the same code (panellist not blinded 182
to sequential protocol). Still mineral water and bread were provided as palate cleansers in-183
between product samples (not between the eight consecutive aliquots of the same 184
sample). Panellists were instructed to drink all the sample volume presented and were not 185
permitted to drink water during sequential profiling. 186
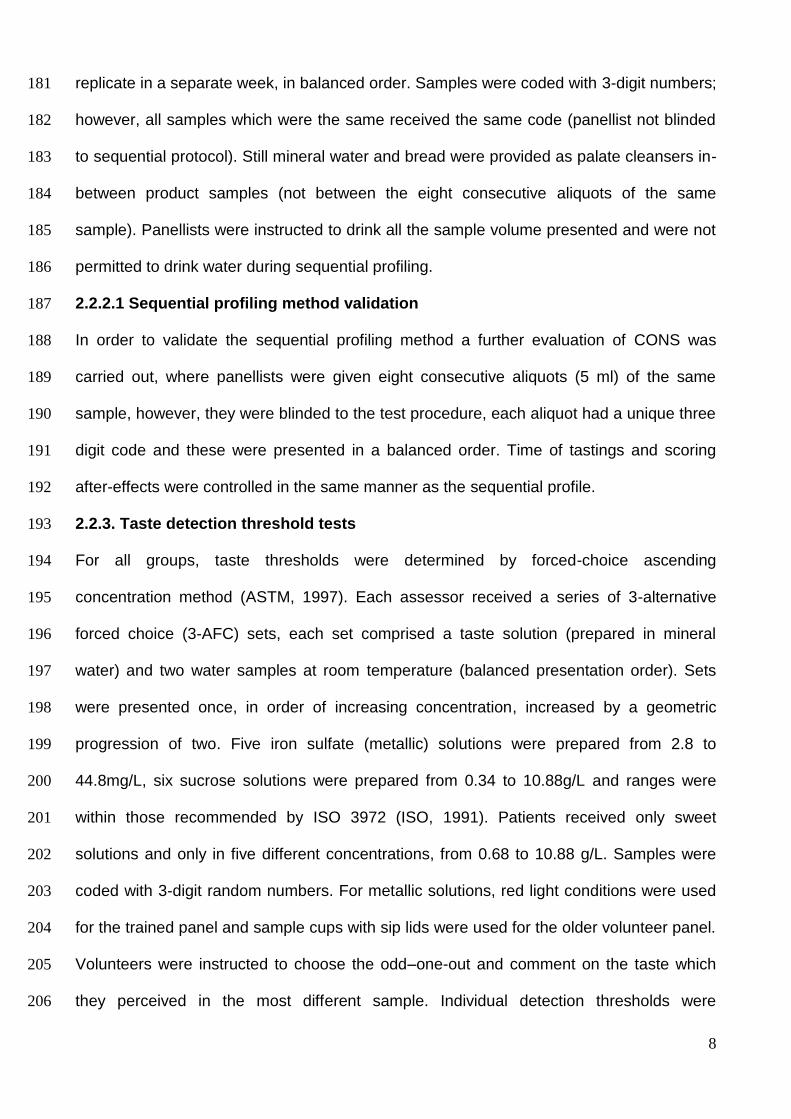
2.2.2.1 Sequential profiling method validation 187
In order to validate the sequential profiling method a further evaluation of CONS was 188
carried out, where panellists were given eight consecutive aliquots (5 ml) of the same 189
sample, however, they were blinded to the test procedure, each aliquot had a unique three 190
digit code and these were presented in a balanced order. Time of tastings and scoring 191
after-effects were controlled in the same manner as the sequential profile. 192
2.2.3. Taste detection threshold tests 193
For all groups, taste thresholds were determined by forced-choice ascending 194
concentration method (ASTM, 1997). Each assessor received a series of 3-alternative 195
forced choice (3-AFC) sets, each set comprised a taste solution (prepared in mineral 196
water) and two water samples at room temperature (balanced presentation order). Sets 197
were presented once, in order of increasing concentration, increased by a geometric 198
progression of two. Five iron sulfate (metallic) solutions were prepared from 2.8 to 199
44.8mg/L, six sucrose solutions were prepared from 0.34 to 10.88g/L and ranges were 200
within those recommended by ISO 3972 (ISO, 1991). Patients received only sweet 201
solutions and only in five different concentrations, from 0.68 to 10.88 g/L. Samples were 202
coded with 3-digit random numbers. For metallic solutions, red light conditions were used 203
for the trained panel and sample cups with sip lids were used for the older volunteer panel. 204
Volunteers were instructed to choose the odd–one-out and comment on the taste which 205
they perceived in the most different sample. Individual detection thresholds were 206

9
calculated as the geometric mean of the detection threshold and the concentration 207
preceding this. 208
2.2.4 Hedonic tests 209
Hedonic liking data was collected from 32 healthy older adults and 28 patients, using a 210
modified boredom test (Köster and Mojet, 2007). This was used to characterise any 211
changes in liking of ONS following repeat consumption and to compare the liking of pairs 212
of samples. All subjects began by tasting 5ml of each of two samples (random 3 digit 213
coded, balanced presentation order) and scored liking for each on a 9-point hedonic scale 214
(initial liking), scaled from dislike extremely to like extremely. They then tasted a series of 215
eight consecutive 5ml aliquots of one sample (balanced presentation across volunteers, 216
samples coded by symbol) and were permitted to drink mineral water, if desired after 217
tasting the first four aliquots of the series of eight. Subjects subsequently tasted a further 218
5ml of each of the two samples (random 3 digit coded, balanced presentation order), re-219
scored their liking for each on the 9-point hedonic scale (final liking) and were asked to 220
state the sweetest sample of the final two samples. Subjects consumed 60ml of ONS in 221
total. The boredom trial was modified for the patient group in that the central eight 5 ml 222
aliquots were replaced by a central cup containing the full 40 ml of sample as it was 223
impractical to present 12 small cups on one tray at a patient’s bedside. Patients were also 224
their sugar usage in tea and/or coffee. 225
2.3. Statistical analysis 226
SENPAQ (version 3.2) was used to carry out analysis of variance (ANOVA) and principal 227
component analysis (PCA) of sensory panel profiling data. In order to determine the 228
effects of time from the sequential profiling, three-way ANOVA was carried out in XLSTAT 229
(version 2009.1.02), using sample (n=2), assessors (n=12) and time (n=8) as explanatory 230
variables. Non-parametric testing on the liking data and ANOVA on taste threshold data 231
were also carried out in XLSTAT (version 2009.1.02). 232
10
3. Results and discussion 233
3.1. Sensory data 234
3.1.1. Sequential Profile 235
3.1.1.1 Standard ONS and sweetness suppressed ONS 236
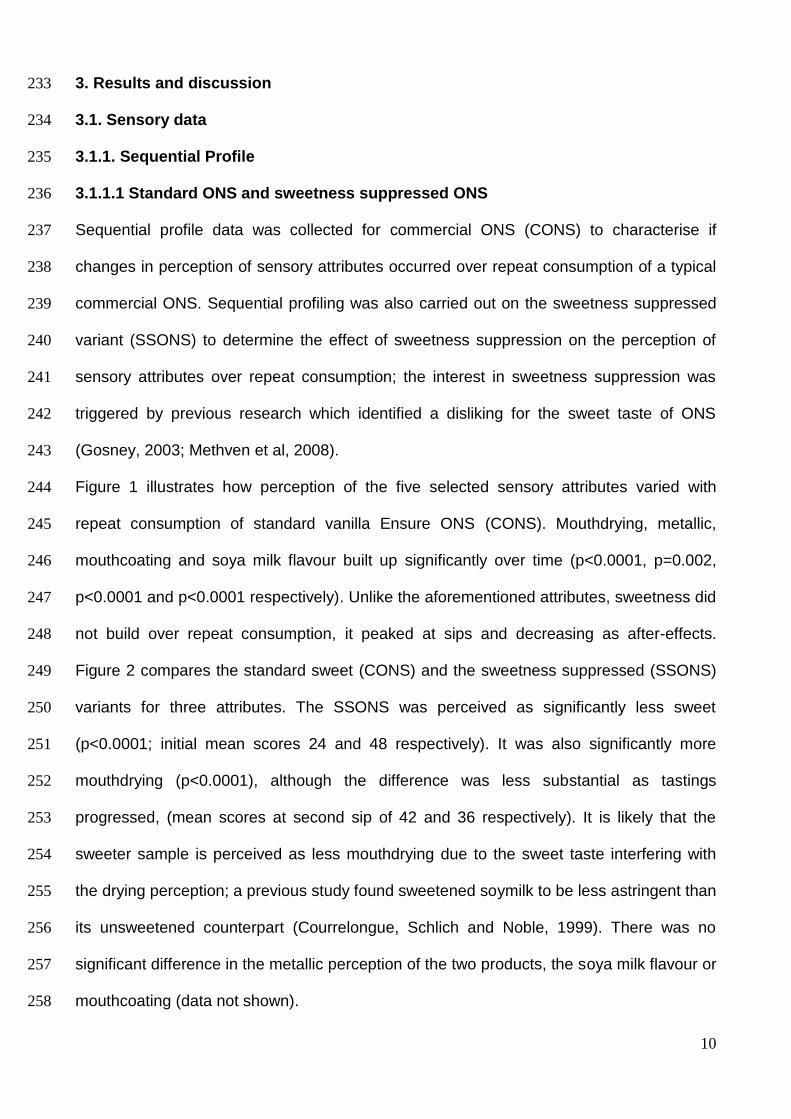
Sequential profile data was collected for commercial ONS (CONS) to characterise if 237
changes in perception of sensory attributes occurred over repeat consumption of a typical 238
commercial ONS. Sequential profiling was also carried out on the sweetness suppressed 239
variant (SSONS) to determine the effect of sweetness suppression on the perception of 240
sensory attributes over repeat consumption; the interest in sweetness suppression was 241
triggered by previous research which identified a disliking for the sweet taste of ONS 242
(Gosney, 2003; Methven et al, 2008). 243
Figure 1 illustrates how perception of the five selected sensory attributes varied with 244
repeat consumption of standard vanilla Ensure ONS (CONS). Mouthdrying, metallic, 245
mouthcoating and soya milk flavour built up significantly over time (p<0.0001, p=0.002, 246
p<0.0001 and p<0.0001 respectively). Unlike the aforementioned attributes, sweetness did 247
not build over repeat consumption, it peaked at sips and decreasing as after-effects. 248
Figure 2 compares the standard sweet (CONS) and the sweetness suppressed (SSONS) 249
variants for three attributes. The SSONS was perceived as significantly less sweet 250
(p<0.0001; initial mean scores 24 and 48 respectively). It was also significantly more 251
mouthdrying (p<0.0001), although the difference was less substantial as tastings 252
progressed, (mean scores at second sip of 42 and 36 respectively). It is likely that the 253
sweeter sample is perceived as less mouthdrying due to the sweet taste interfering with 254
the drying perception; a previous study found sweetened soymilk to be less astringent than 255
its unsweetened counterpart (Courrelongue, Schlich and Noble, 1999). There was no 256
significant difference in the metallic perception of the two products, the soya milk flavour or 257
mouthcoating (data not shown). 258

11
3.1.1.2 ONS control and No-Mineral ONS formulations 259
It was hypothesised that the minerals added to ONS during manufacture may contribute to 260
both astringent and metallic tastes. The mineral supplementation added to ONS contains 261
iron sulfate, known to impart metallic taste (Lim and Lawless, 2006). Minerals, particularly 262
zinc, are also known to impart astringent properties to solutions (Yang and Lawless, 2005). 263
To test the hypothesis, a control ONS formulation (PPSONS) that contained the full 264
mineral supplement and a formulation that had no mineral supplementation (PPNONS) 265
were manufactured. Figure 3 demonstrates the mouthdrying and metallic profiles of these 266
two ONS products. As with commercial ONS; metallic and mouthdrying built up 267
significantly over consumption time (p=0.001 and p<0.0001 respectively) for both products. 268
On first consumption (5 ml) the mineral free product had a lower mean for metallic taste 269
(21.5 compared to 24.2) although the difference was not significant. Over all of the 270
consumption period (eight 5 ml samples) the mineral free product (PPNONS) was 271
significantly less metallic (p<0.0001), although the difference in overall means across time 272
was very small (25.2 and 26.7 respectively). It is therefore noted that although the minerals 273
added to the ONS formulation do contribute to the metallic taste, expected as the 274
supplementation contains iron sulfate, this cannot be the only source of metallic taste in 275
the products. The mineral supplementation is not thought to be the major source of 276
mouthdrying as the two products did not differ significantly in mouthdrying. It is 277
hypothesised that another source of mouthdrying could be the milk proteins typically used 278
in ONS formulations. Previous studies have shown whey proteins to cause mouthdrying 279
through precipitation onto the tongue (Sano, Egashira, Kinekawa and Kitabatake, 2005); 280
alternatively proteolysis of on β-casein can yield γ-caseins which are associated with 281
perceived dryness of milks (Harwalkar, Cholette, McKellar and Emmons, 1993). 282
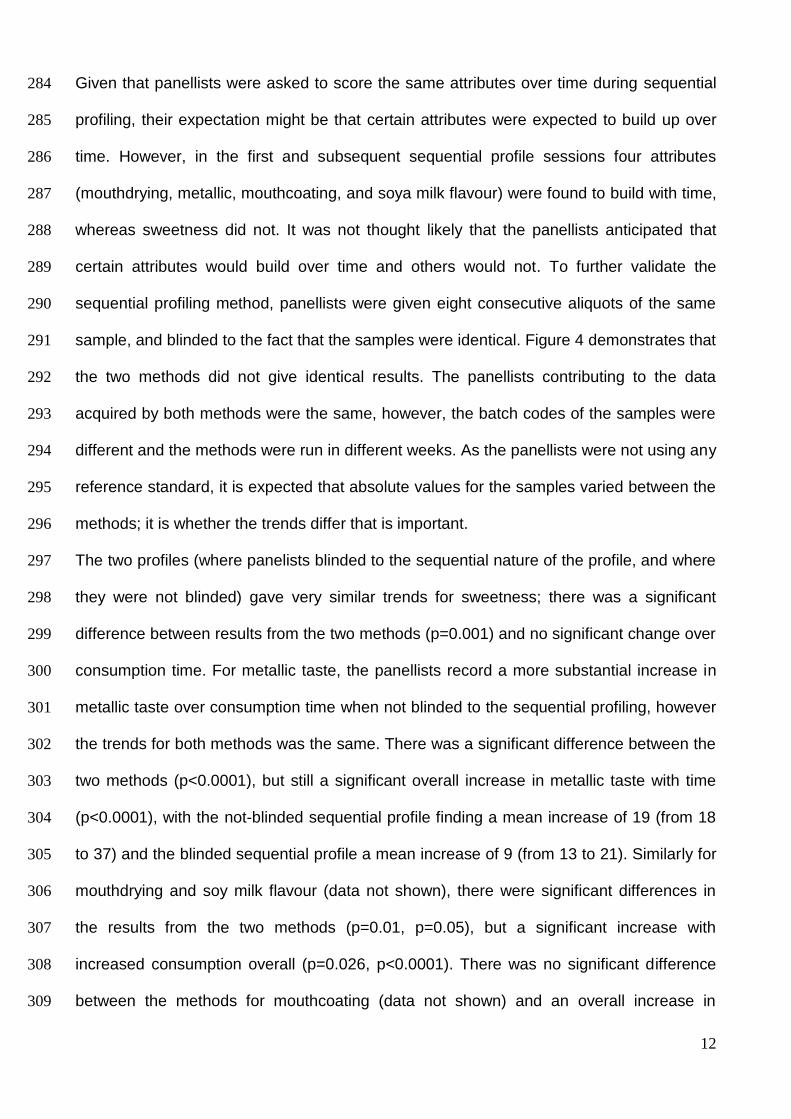
3.1.1.3 Validation of the sequential profile 283
12
Given that panellists were asked to score the same attributes over time during sequential 284
profiling, their expectation might be that certain attributes were expected to build up over 285
time. However, in the first and subsequent sequential profile sessions four attributes 286
(mouthdrying, metallic, mouthcoating, and soya milk flavour) were found to build with time, 287
whereas sweetness did not. It was not thought likely that the panellists anticipated that 288
certain attributes would build over time and others would not. To further validate the 289
sequential profiling method, panellists were given eight consecutive aliquots of the same 290
sample, and blinded to the fact that the samples were identical. Figure 4 demonstrates that 291
the two methods did not give identical results. The panellists contributing to the data 292
acquired by both methods were the same, however, the batch codes of the samples were 293
different and the methods were run in different weeks. As the panellists were not using any 294
reference standard, it is expected that absolute values for the samples varied between the 295
methods; it is whether the trends differ that is important. 296
The two profiles (where panelists blinded to the sequential nature of the profile, and where 297
they were not blinded) gave very similar trends for sweetness; there was a significant 298
difference between results from the two methods (p=0.001) and no significant change over 299
consumption time. For metallic taste, the panellists record a more substantial increase in 300
metallic taste over consumption time when not blinded to the sequential profiling, however 301
the trends for both methods was the same. There was a significant difference between the 302
two methods (p<0.0001), but still a significant overall increase in metallic taste with time 303
(p<0.0001), with the not-blinded sequential profile finding a mean increase of 19 (from 18 304
to 37) and the blinded sequential profile a mean increase of 9 (from 13 to 21). Similarly for 305
mouthdrying and soy milk flavour (data not shown), there were significant differences in 306
the results from the two methods (p=0.01, p=0.05), but a significant increase with 307
increased consumption overall (p=0.026, p<0.0001). There was no significant difference 308
between the methods for mouthcoating (data not shown) and an overall increase in 309
13
mouthcoating with increasing consumption (p=0.001). In conclusion, it was found that 310
panellists may exaggerate increase in perception were they aware that they had 311
performed a sequential profile; however, the significant changes found over time were the 312
same whether panelists were blinded to the sequential nature or not. 313
Panellists received two ONS samples in one sequential profiling session; they therefore 314
consumed 80ml per session. This amount is in line with typical volumes of ONS consumed 315
in hospitals, as previously reported; Gosney (2003) identified that only 37% of ONS were 316
consumed, which is approximately 80ml, assuming a typical pack size of 220ml. The data 317
from the commercial sequential profiles is therefore likely to represent the sensory 318
characteristics perceived by patients consuming similar volumes of these products. 319
3.1.2 Taste threshold tests 320
3.1.2.1 Metallic taste thresholds 321
Metallic detection threshold tests were conducted to identify whether older consumers 322
could potentially identify the metallic attribute in the ONS, and to determine any difference 323
in metallic threshold between younger and older adults (Figure 5). However, it was 324
surprising that only 60% of the trained sensory panellists (median age 42) correctly 325
identified any sample differences in the metallic threshold test; the group best estimated 326
metallic threshold (geometric mean) for these panellists was 16mg/L. Forty percent of the 327
sensory panellists could not detect metallic at the maximum concentration of 45mg/L. In 328
comparison, only 32% of the healthy older volunteers (median age 73) correctly identified 329
any sample differences in the metallic threshold test; the group best estimated metallic 330
threshold for these volunteers was 26mg/L. The higher metallic detection threshold and 331
higher proportion of non-detectors observed in the group of healthy older volunteers was 332
expected as several studies have found elevated thresholds for taste and a diminished 333
ability to discriminate between suprathreshold stimuli (Schiffman and Graham, 2000). 334
However, the present study also questions the validity of using the 3-AFC test as a 335
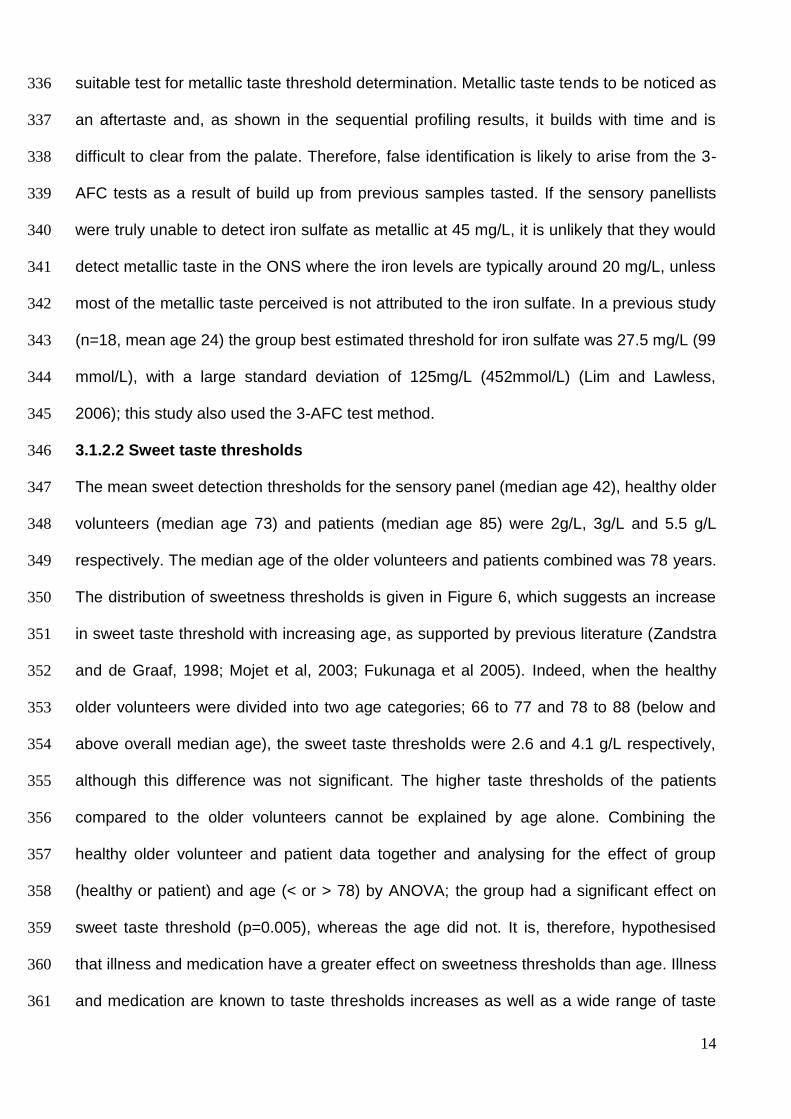
14
suitable test for metallic taste threshold determination. Metallic taste tends to be noticed as 336
an aftertaste and, as shown in the sequential profiling results, it builds with time and is 337
difficult to clear from the palate. Therefore, false identification is likely to arise from the 3-338
AFC tests as a result of build up from previous samples tasted. If the sensory panellists 339
were truly unable to detect iron sulfate as metallic at 45 mg/L, it is unlikely that they would 340
detect metallic taste in the ONS where the iron levels are typically around 20 mg/L, unless 341
most of the metallic taste perceived is not attributed to the iron sulfate. In a previous study 342
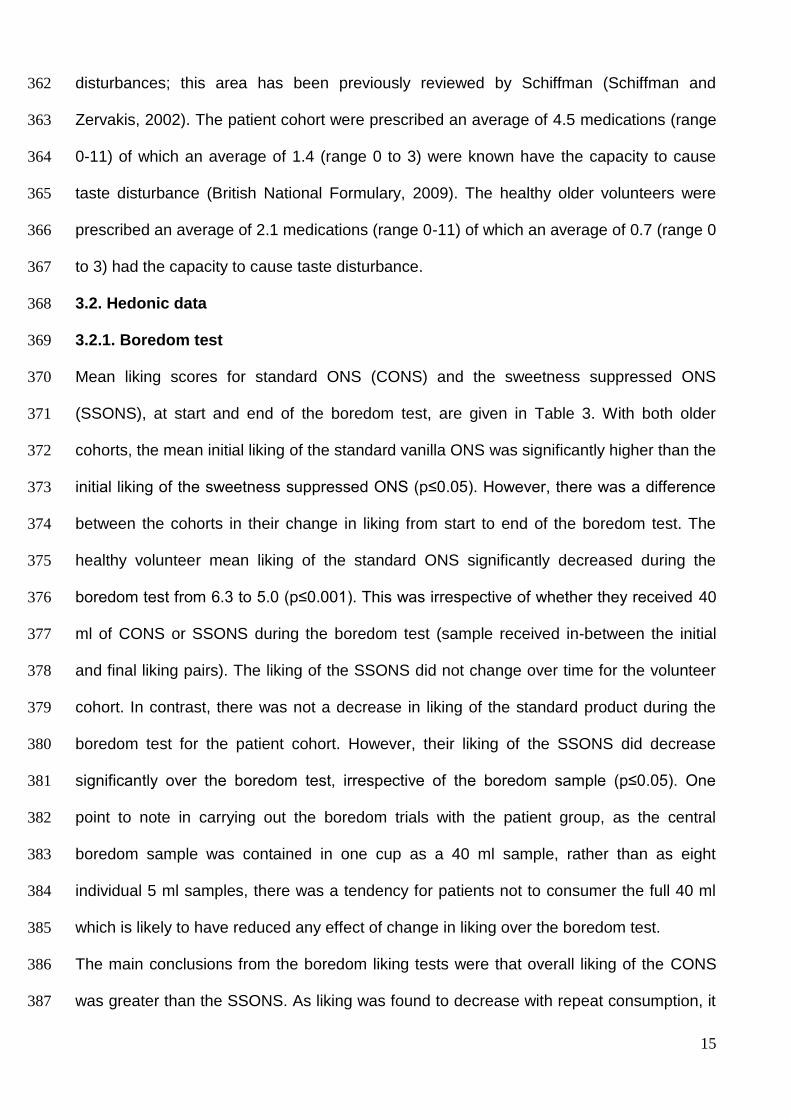
(n=18, mean age 24) the group best estimated threshold for iron sulfate was 27.5 mg/L (99 343
mmol/L), with a large standard deviation of 125mg/L (452mmol/L) (Lim and Lawless, 344
2006); this study also used the 3-AFC test method. 345
3.1.2.2 Sweet taste thresholds 346
The mean sweet detection thresholds for the sensory panel (median age 42), healthy older 347
volunteers (median age 73) and patients (median age 85) were 2g/L, 3g/L and 5.5 g/L 348
respectively. The median age of the older volunteers and patients combined was 78 years. 349
The distribution of sweetness thresholds is given in Figure 6, which suggests an increase 350
in sweet taste threshold with increasing age, as supported by previous literature (Zandstra 351
and de Graaf, 1998; Mojet et al, 2003; Fukunaga et al 2005). Indeed, when the healthy 352
older volunteers were divided into two age categories; 66 to 77 and 78 to 88 (below and 353
above overall median age), the sweet taste thresholds were 2.6 and 4.1 g/L respectively, 354
although this difference was not significant. The higher taste thresholds of the patients 355
compared to the older volunteers cannot be explained by age alone. Combining the 356
healthy older volunteer and patient data together and analysing for the effect of group 357
(healthy or patient) and age (< or > 78) by ANOVA; the group had a significant effect on 358
sweet taste threshold (p=0.005), whereas the age did not. It is, therefore, hypothesised 359
that illness and medication have a greater effect on sweetness thresholds than age. Illness 360
and medication are known to taste thresholds increases as well as a wide range of taste 361
15
disturbances; this area has been previously reviewed by Schiffman (Schiffman and 362
Zervakis, 2002). The patient cohort were prescribed an average of 4.5 medications (range 363
0-11) of which an average of 1.4 (range 0 to 3) were known have the capacity to cause 364
taste disturbance (British National Formulary, 2009). The healthy older volunteers were 365
prescribed an average of 2.1 medications (range 0-11) of which an average of 0.7 (range 0 366
to 3) had the capacity to cause taste disturbance. 367
3.2. Hedonic data 368
3.2.1. Boredom test 369
Mean liking scores for standard ONS (CONS) and the sweetness suppressed ONS 370
(SSONS), at start and end of the boredom test, are given in Table 3. With both older 371
cohorts, the mean initial liking of the standard vanilla ONS was significantly higher than the 372
initial liking of the sweetness suppressed ONS (p≤0.05). However, there was a difference 373
between the cohorts in their change in liking from start to end of the boredom test. The 374
healthy volunteer mean liking of the standard ONS significantly decreased during the 375
boredom test from 6.3 to 5.0 (p≤0.001). This was irrespective of whether they received 40 376
ml of CONS or SSONS during the boredom test (sample received in-between the initial 377
and final liking pairs). The liking of the SSONS did not change over time for the volunteer 378
cohort. In contrast, there was not a decrease in liking of the standard product during the 379
boredom test for the patient cohort. However, their liking of the SSONS did decrease 380
significantly over the boredom test, irrespective of the boredom sample (p≤0.05). One 381
point to note in carrying out the boredom trials with the patient group, as the central 382
boredom sample was contained in one cup as a 40 ml sample, rather than as eight 383
individual 5 ml samples, there was a tendency for patients not to consumer the full 40 ml 384
which is likely to have reduced any effect of change in liking over the boredom test. 385
The main conclusions from the boredom liking tests were that overall liking of the CONS 386
was greater than the SSONS. As liking was found to decrease with repeat consumption, it 387

16
is likely that consumption of a typical pack volume may reduce liking of the products even 388
further. It is hypothesised that the attributes of mouthdrying and metallic which were found 389
in the sequential profiling study to build substantially over consumption volume may, in 390
part, cause the reduction in liking. 391
3.2.2 Consideration of sugar usage and sweetness thresholds on ONS liking 392
There were 17 patients who regularly took sugar in their tea or coffee and 11 who did not. 393
There was no correlation between sugar usage and sweetness threshold. In addition, 394
there was no correlation between sugar usage or sweetness threshold and liking scores 395
for the standard ONS in comparison to the sweetness suppressed variant. The later point 396
supports the previous study by Mojet et al (2005) which found sweetness thresholds not to 397
correlate with preferred sweetness level. The volunteers and patients could determine that 398
the standard ONS sample was sweeter than the SSONS (p<0.0001; 26 out of 32 399
volunteers; 25 out of 27 patients). Healthy older volunteers and patients who incorrectly 400
identified which sample was the sweetest, did not have the highest sweetness thresholds; 401
implying that the sweetness of the products was above each individuals sweetness 402
threshold. This also demonstrates that sugar consumption in hot beverages did not impact 403
upon ONS sweetness perception. 404
4. Conclusions 405
Sequential profiling was used to characterise five attributes of vanilla dairy-based ONS 406
over repeat consumption. This highlighted a significant build up of mouthdrying, metallic 407
and mouthcoating attributes over a total consumption volume of 40 ml, which would not 408
have been found though a standard profiling study. Such build may have major 409
implications on the long-term, repeat consumption of these products, especially since 410
patients are often encouraged to drink up to 600ml daily. Liking of ONS, with both healthy 411
older and older patient groups, was found to diminish over repeat consumption (60ml), 412
suggesting that build up of taste and mouthfeel attributes over repeat consumption was 413

17
disliked. The combined use of sequential profiling and liking over repeat consumption 414
(using a boredom test approach) is recommended as a methodology suitable for the 415
exploration of products such as ONS which are known to have aftertastes. 416
Removal of the minerals from an ONS formulation did not significantly reduce mouthdrying 417
and although the effect on metallic taste perception was significant, it was not substantial. 418
Components other than iron sulfate, intrinsic to ONS, such as the calcium and milk 419
proteins, may contribute to these attributes. In support of this, calcium salts have been 420
shown to exhibit both astringent and metallic taste properties (Lawless, Rapacki, Horne 421
and Hayes, 2003) and both whey protein precipitation and casein proteolysis products 422
have been associated with mouthdrying (Sano et al, 2005; Harwalkar et al, 1993). Further 423
research into the properties of ONS ingredients may help to elucidate potential causes of 424
the build up of attributes over repeat consumption. If the build up can be reduced this may 425
lead to improve palatability and consumption of ONS. 426
Acknowledgments: This work has been supported by Research into Ageing (Age UK), a 427
UK Charity. Abbott Nutrition and Nestle Nutrition are thanked for supply of ingredients, 428
samples and advice. Thank you to Dr Chris Findlay and the Compusense support team for 429
their assistance in setting up the sequential profile. 430
References 431
Age Concern (2006). Hungry to be Heard; the scandal of malnourished older people in hospital. Age 432
Concern, London. 433
ASTM Committee (1997) Standard practice E 679-91. Determination of odor and taste thresholds by a 434
forced-choice ascending concentration series methods of limits. Philadelphia, PA: American Society 435
for Testing and Materials. 436
Bolton, J., Abbott, J.R., Kiely. M., Alleyne,M. Bel,S., Stubbs,L. & Slevin, M. (1992) Comparison of three oral 437
sip-feed supplements in patients with cancer. Journal of Human Nutrition and Dietetics, 5 (2)79-84. 438
British National Formulary (2009) BNF 58, London : BMJ Group and RPS Publishing. 439
Courrelongue, S., Schlich, P. & Noble, A.C. (1999) Using repeated ingestion to determine the effects of 440
sweetness, viscosity and oiliness on temporal perception of soymilk astringency. Food Quality and 441
Preference, 10, 273-279. 442
Duizer, L., Bloom, K. & Findlay, C.J. (1991) Dual-attribute time-intensity sensory evaluation: A new method 443
for temporal measurement of sensory perceptions. Food Quality and Preference, 8(4),261-269. 444

18
Fearon, K.C., Meyenfeldt, M.F., Moses, A.G., Van Geenen, R., Roy, A., Gouma, D.J., Giacosam, A., Van 445
Gossum, A., Bauer, J., Barber, M.D., Aaronson, N.K., Voss, A.C. & Tisdale, M.J. (2003) Effect of a 446
protein and energy dense N-3 fatty acid enriched oral supplement on loss of weight and lean tissue 447
in cancer cachexia: a randomised double blind trial. Gut, 52, 1479–1486. 448
Fukunaga, A., Uematsu, H & Sugimoto, K. (2005) Influences of aging on taste perception and oral somatic 449
sensation. Journal of Gerantology, 60A(1), 109-113. 450
Gosney, M. (2003) Are we wasting our money on food supplements in elder care wards? Journal of 451
Advanced Nursing, 43(3), 275-280. 452
Harwalkar, V. R., Cholette, H., McKellar, R.C. & Emmons, D.B. (1993) Relation Between Proteolysis and 453
Astringent Off-Flavor in Milk. J. Dairy Sci. 76: 2521-2527. 454
International Standard ISO 3972 (1991) Methods for sensory analysis of food - Part 7: Investigating 455
sensitivity of taste. 456
Jack, F.R., Piggott, J.R. & Paterson, A. (1994) Analysis of textural changes in hard cheese during 457
mastication by progressive profiling. Journal of Food Science, 59(3), 539-543. 458
Kaneda, H., Maeshima, K., Goto, N., Kobayakowa, T., Ayabe-Kanamura, S. & Saito, S. (2000) Decline in 459
taste and odour discrimination abilities with age, and relationship between gestation and olfaction. 460
Chemical Senses, 25, 331-337. 461
Köster, E.P. & Mojet, J. (2007) Boredom and the reasons why some new food products fail. In: Consumer-462
led food product development (p262-280). Cambridge: Woodhead Publishing Limited. 463
Koskinen, S., Kälviänen, N. & Tuorila, H. (2003) Flavour enhancement as a tool for increasing pleasantness 464
and intake of a snack product amongst the elderly. Appetite, 41, 87-96. 465
Labbe, D., Schlich, P., Pineau, N., Gilbert, F.& Martin, N. (2009) Temporal dominance of sensations and 466
sensory profiling: A comparative study. Food Quality and Preference, 20, 216-221. 467
Law, C.K−W., Gosney, M.A. & Kennedy, O.B. (2006) Age related changes in taste and effect on food 468
supplement palatability. Proceedings of the Nutrition Society, 65, OCB, 56A. 469
Law, C.K−W., (2006) Age related changes in taste and effect on food supplement palatability. Dissertation 470
for BSc Degree in Food Science, University of Reading. 471
Lawless, H., Rapacki, F., Horne, J. & Hayes, A. (2003) The taste of calcium and magnesium salts and 472
anionic modifications. Food Quality and Preference, 14(4), 319-325. 473
Lim, J. & Lawless, H. (2006) Detection thresholds and taste qualities of iron salts. Food Quality and 474
Preference, 17,513-521. 475
Lochs, H., Alliaon, S.P., Meier ,R., Pirlich, M., Kondrup, J., Schneider, St., Berghe, G., & Pichard, C. (2006) 476
Introductory to the ESPEN Guidelines on Enteral Nutrition: Terminology, Definitions and General 477
Topics. Clinical Nutrition, 25(2), 180-186. 478
Methven, L., Kennedy, O.B., Mottram, D.S., Grimble, G.K., Bushell, M., Gray, L. & Gosney, M.A. (2008) The 479
effect of saccharide type on sweet perception and preference of Oral Nutritional Supplements by 480
elderly people. Proceedings of the Nutrition Society, 68 (OCE1) E55. 481
Milner, A.C., Potter, J., Vivanti, A., & Avenell,A. (2002) Protein and energy supplementation in elderly people 482
at risk of malnutrition. Cochrane Database Systematic Reviews 2007, Issue 4. Art. No.:CD003288. 483
DOI: 10.1002/14651858. CD003288.pub3. 484
Mojet, J., Heidema, J. & Christ-Hazelhof, E. (2003) Taste perception with age: generic or specific losses in 485
supra-threshold intensities of five taste qualities ? Chemical Senses. 28, 397-413. 486

19
Mojet, J., Christ-Hazelhof, E , & Heidema, J. (2005) Taste perception with age: pleasantness and its 487
relationships with threshold sensitivity and supra-threshold intensity of five taste qualities. Food 488
Quality and Preference, 16, 413-423. 489
Nolan, A. (1999). Audit of supplement use on care of the elderly and rehabilitation wards. Journal of Human 490
Nutrition and Dietetics, 12(5), 453-458. 491
O’Flynn, J., Peake, H., Hickson, M., Foster, D., & Frost, G. (2005) The prevalence of malnutrition in hospitals 492
can be reduced: Results from three consecutive cross-sectional studies. Clinical Nutrition, 24(6), 493
1078-1088. 494
Rahemtulla, Z., Baldwin, C., Spiro, A., McGough, C., Norman, A.R., Frost, G., Cinningham, D., & Andreyev, 495
H. (2005) The palatability of milk-base and non-mil-based nutritional supplements in gastrointestinal 496
cancer and the effect of chemotherapy. Clinical Nutrition, 24, 1029-1037. 497
Sano, H., Egashira, T., Kinekawa Y. & Kitabatake, N. (2005) Astringency of Bovine Milk Whey Protein. J. 498
Dairy Sci. 88: 2312-2317. 499
Schiffman, S.S. & Graham, B.G. (2000) Taste and smell perception affect appetite and immunity in the 500
elderly. European Journal of Clinical Nutrition, 54(3), S54-S63. 501
Schiffman, S.S. & Zervakis (2002) Taste and smell perception in the elderly: effect of medication and 502
disease. Advances in Food and Nutrition Research, 44, 247-346. 503
Stableforth, P.G. (1986). Supplement feeds and nitrogen and calorie balance following femoral neck fracture. 504
British Journal of Surgery, 72, 651-655. 505
Yang, H.H-L, & Lawless, H. (2005) Descriptive analysis of divalent salts. Journal of Sensory Studies, 20, 97-506
113. 507
Zandstra, E.H. & de Graaf, C. (1998) Sensory perception and pleasantness of orange beverages from 508
childhood to old age. Food Quality and Preference, 9(1/2) 5-12. 509
510
Figure 1: Sequential profile of commercial vanilla ONS 511
Footnote figure 1: 512 (a)
Sip 1–8, consumption point of 5 ml aliquots; AE1, AE2, after-effects at 30 s and 60 s post consumption 513 of aliquots 1–8. 514
515
Figure 2: Sequential profiles of two sweetness variants of vanilla ONS 516
Footnote figure 2: 517 (a)
Sip 1–8, consumption point of 5 ml aliquots; AE1, AE2, after-effects at 30 s and 60 s post consumption 518 of aliquots 1–8. CONS = Standard commercial ONS ; SSONS = Sweetness Suppressed commercial 519 ONS 520
521
Figure 3: Sequential profiles of two mineral variants of vanilla ONS 522
Footnote figure 3: 523 (a)
Sip 1–8, consumption point of 5 ml aliquots; AE1, AE2, after-effects at 30 s and 60 s post consumption 524 of aliquots 1–8. PPSONS = control pilot plant ONS; PPNONS = No mineral pilot plant ONS 525
526
20
Figure 4: Validation of sequential profiling, used to quantify three attributes of 527
commercial vanilla ONS over eight consecutive (5 ml) consumptions 528
Footnote figure 4: 529 (a)
Sip 1–8, consumption point of 5 ml aliquots; AE1, AE2, after-effects at 30 s and 60 s post consumption 530 of aliquots 1–8. Blind= panellists not aware that consecutive samples were the same sample; Sequential 531 = panelists aware profile was sequential 532 533
Figure 5: Frequency distribution of metallic taste detection thresholds for sensory 534
panellists and healthy older volunteers 535
536
Figure 6: Frequency distribution of sweet taste detection thresholds for sensory 537
panellists, healthy older volunteers and patients 538
539
21
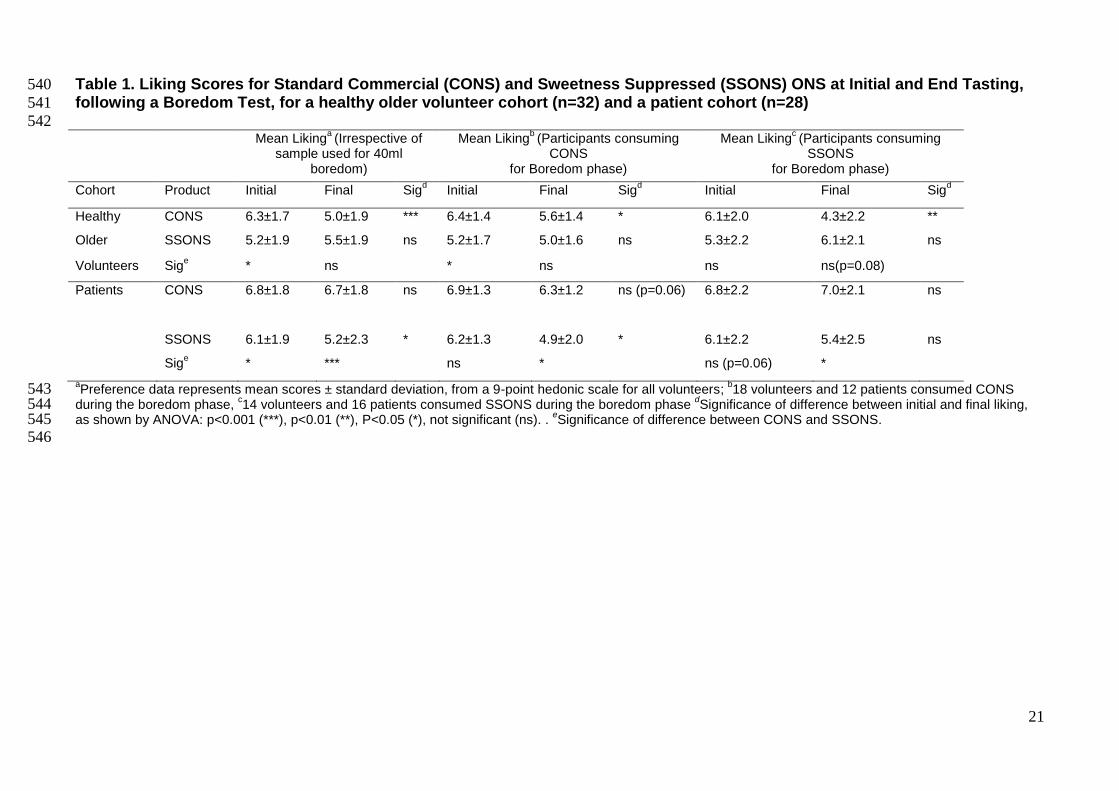
Table 1. Liking Scores for Standard Commercial (CONS) and Sweetness Suppressed (SSONS) ONS at Initial and End Tasting, 540
following a Boredom Test, for a healthy older volunteer cohort (n=32) and a patient cohort (n=28) 541
542 Mean Liking
a (Irrespective of
sample used for 40ml boredom)
Mean Likingb (Participants consuming
CONS for Boredom phase)
Mean Likingc (Participants consuming
SSONS for Boredom phase)
Cohort Product Initial Final Sigd Initial Final Sig
d Initial Final Sig
d
Healthy CONS 6.3±1.7 5.0±1.9 *** 6.4±1.4 5.6±1.4 * 6.1±2.0 4.3±2.2 **
Older SSONS 5.2±1.9 5.5±1.9 ns 5.2±1.7 5.0±1.6 ns 5.3±2.2 6.1±2.1 ns
Volunteers Sige * ns * ns ns ns(p=0.08)
Patients CONS 6.8±1.8 6.7±1.8 ns 6.9±1.3 6.3±1.2 ns (p=0.06) 6.8±2.2 7.0±2.1 ns
SSONS 6.1±1.9 5.2±2.3 * 6.2±1.3 4.9±2.0 * 6.1±2.2 5.4±2.5 ns
Sige * *** ns * ns (p=0.06) *
aPreference data represents mean scores ± standard deviation, from a 9-point hedonic scale for all volunteers;
b18 volunteers and 12 patients consumed CONS 543
during the boredom phase, c14 volunteers and 16 patients consumed SSONS during the boredom phase
dSignificance of difference between initial and final liking, 544
as shown by ANOVA: p<0.001 (***), p<0.01 (**), P<0.05 (*), not significant (ns). . eSignificance of difference between CONS and SSONS. 545
546