the effect of magnets on the fermentation of s. cerevisiae ... · project number: mqp tac – fr13...
TRANSCRIPT

Project Number: MQP TAC – FR13
The Effect of Magnets on the Fermentation of S. cerevisiae in
Various Culture Media
A Major Qualifying Project
Submitted to the Faculty
of the
WORCECSTER POLYTECHNIC INSTITUTE
in partial fulfillment of the requirements for the
Degree of Bachelor of Science in
Chemical Engineering
by
_________________________________
James Henry Grey
Date: February 19, 2006
Approved:
__________________________ _____________________________
Professor Terri Anne Camesano Professor Marie-Noëlle Pons
Associate Professor Director of Research CNRS
Chemical Engineering Laboratoire des Sciences du Génie
Worcester Polytechnic Institute Chimique, CNRS-ENSIC-INPL
100 Institute Rd 1 rue Grandville, BP 20451
Worcester MA 01609 F-54001 Nancy cedex
USA France
Major Advisor Co-Advisor
0
ABSTRACT
The world has growing energy needs. Ethanol can help meet these needs.
Fermentation is the main method of producing ethanol. This project’s focus is on
increasing the efficiency of yeast resulting in a more productive fermentation. Prior
experiments have shown that fermentations carried out within a high intensity magnetic
field have an increased growth rate, as well as increased carbon dioxide and ethanol
production. Data from prior experiments was verified and several growth mediums were
tested. The monitoring of yeast cell morphology was based on optical microscopy
coupled with image analysis. Total biomass was determined by testing absorbance.
Viability of cells was found using Methylene Blue. Concentration of sugars was analyzed
using the anthrone method.
1
TABLE OF CONTENTS
ABSTRACT………………………………………………………………………………0
TABLE OF CONTENTS…………………………………………………………………1
TABLE OF FIGURES……………………………………………………………………2
INTRODUCTION………………………………………………………………………...3
History…………………………………………………………………………….3
Yeast………………………………………………………………………………3
Distillation…………………………………………………………………………4
Ethanol Uses………………………………………………………………………5
Ethanol as a Fuel Source…………………………………………………………..6
METHODOLOGY………………………………………………………………………..8
Environment……………………………………………………………………….8
Grape Juice………………………………………………………………………...8
Sugar Water……………………………………………………………………….9
Molasses…………………………………………………………………………..9
Yeast……………………………………………………………………………..10
Microscope……………………………………………………………………….10
Cell Staining……………………………………………………………………...11
Neutral Red………………………………………………………………11
Viability………………………………………………………………….12
Biomass Absorbance…………………………………………………………….13
Filtering Cells……………………………………………………………………14
Sugar Concentration……………………………………………………………..15
Magnets…………………………………………………………………………..17
Vessels…………………………………………………………………………...18
RESULTS………………………………………………………………………………..19
Effect of Magnet on Growth……………………………………………………..19
Effect of Magnet on Sugar……………………………………………………….20
DISCUSSION……………………………………………………………………………23
Microscopy………………………………………………………………………23
Stains……………………………………………………………………………..23
Effect of Magnet on Growth……………………………………………………..24
Accuracy in Sugar Concentration Determination………………………………..24
WORK CITED…………………………………………………………………………..29
DATA TABLES…………………………………………………………………………32
Biomass Absorbance……………………………………………………………..32
Anthrone Absorbance……………………………………………………………33

2
TABLE OF FIGURES
Figure 1: Ethanol Production by Type (Berg)……………………………………….5
Figure 2a: Unsuccessful Anthrone Reagent Preparation…………………………….15
Figure 2b: Successful Anthrone Reagent Preparation……………………………….15
Figure 3: Anthrone Method for Testing Sugar Content Calibration Curve………...16
Figure 4: Magnets with Supportive Boxes…………………………………………18
Figure 5: Vessels with and without Magnets………………………………………18
Figure 6: Absorbance at 660nm in Fermenting Grape Juice……………………….19
Figure 7: Absorbance at 660nm in Fermenting Molasses………………………….20
Figure 8: Grape Juice Sugar Consumption…………………………………………20
Figure 9: Visual Comparison of Absorbance Based on Time……………………...21
Figure 10: Visual Comparison of Absorbance Based on Fermenter………………...21
Figure 11: Molasses Sugar Consumption……………………………………………22
Figure 12: Effect of Clean Glassware and Mixing on Absorbance…………………26
Figure 13: Molasses Anthrone Absorbance…………………………………………27

3
INTRODUCTION
History
Alcohol has an important history and relationship to many world events. Alcohol
has been produced for over 9000 years in ancient China (McGovern). In 3000 BCE wine
was produced in large quantities in the Mediterranean, and beer was an important part of
trade in Mesopotamia. The practice of distilling alcohol goes back to at least 500 BCE in
India, (Allchin) and grain alcohol was distilled throughout Europe in the middle ages
(Erowid). Distillation of alcohol was, and is, a common practice. After being distilled,
alcohol can last longer, is easier to ship due to its smaller volume, and is a much faster
way to get intoxicated. During the 1700s and 1800s rum production and trade made the
American colonies, as well as several European countries, very wealthy. Rum was even
given as a health ration to help prevent scurvy by the royal navy for over 300 years
(H2G2). Alcohol is used as a beverage, a medicine, a social lubricant, and has rolls in
religious activities. One of the newest uses for alcohol, specifically ethanol, is as a
renewable fuel source. For the past 9000 years the workhorse behind ethanol production
has been yeast.
Yeast
One of the first domesticated organisms used by people is simple wild yeast
(Phillips). Yeast, or more specifically Saccharomyces cerevisiae, is a single celled fungus
which converts sugars to carbon dioxide and ethanol (YoBrew). This is called alcohol
fermentation, and will be the only type of fermentation covered in this paper; other kinds
of fermentation include lactic acid which is responsible for acidic dairy products (Case).
4
Alcohol fermentation is an anaerobic process first documented and researched by Louis
Pasteur in the 1860s. It is a very complex balance of enzymes, but this short description is
in-depth enough for this paper. The process includes turning a collection of different
types of sugars into the specific sugar glucose. Through nine different reactions and their
respective enzymes the glycolysis pathway converts glucose to pyruvic acid. This acid is
then turned to acetaldehyde and carbon dioxide. Finally the acetaldehyde is turned into
ethanol (Hong), (Farabee).
There are many different strains of this yeast, some which have been
bred/genetically engineered to produce high volumes of ethanol. An ethanol content as
high as 17% to 20% can be achieved by using specific strains of ethanol tolerant yeast
(Argiriou), (Strand), (YoBrew). The yeasts are limited in the amount of ethanol they can
produce because the ethanol itself is toxic to them. In order to achieve higher purities of
ethanol a technique called distillation must be applied. Ethanol can also be made from
crude oil, or gas and coal. This is called synthetic alcohol, and is not very common. In
2003 only 5% of ethanol was made this way. This percentage is likely to drop even more
due to the increasing prices of its crude oil feed stock (Berg).
Distillation
Distillation is a process which takes advantage of the differences in boiling points
in order to separate different chemicals. In this case ethanol and water are separated in
anything from a simple pot still to large industrial distillation columns capable of turning
out high quantities and high purities of ethanol. This process itself does not form any
ethanol, it just separates it from water and any other impurities left over from the brewing

5
process. For a higher concentration of ethanol in the feedstock (ethanol produced by
yeast), more ethanol will be liberated from the water for use elsewhere. Through
distillation, wine is turned into brandy, grains are turned into whiskey, and corn and sugar
beets are turned into fuel grade ethanol.
Ethanol Uses
Alcohol has many uses. As a beverage, a solvent, and a fuel source to name a few.
The beverage market has been widely exploited for many centuries and is leveling off
due to increased health concerns (Berg). The solvent industry which uses ethanol for
paints, coatings, pharmaceuticals, and other products uses less then the beverage industry.
The main use of ethanol for the past 25 years has been as a fuel source.
Figure 1, taken from (Berg)
6
Ethanol as a Fuel Source
Ethanol as a fuel source is not as new an idea as is commonly thought. In 1826 the
first American internal combustion engine was produced, and it was fueled by ethanol. In
1899, Kaiser William II promoted ethanol use by imposing tariffs on imported oil, and
giving awards for adapting ethanol for industrial use in Germany. By 1902, around
95,000 ethanol fueled stoves and 37,000 lamps were produced in Germany. Many
exhibits and races were held around the turn of the century featuring alcohol and
gasoline/alcohol blend fueled vehicles. In the 1930s ethanol gasoline blends were sold in
the Midwest, with the ethanol being derived from local corn crops. Henry Ford and the
head of research of General Motors were supporters of ethanol as a fuel source and as an
anti-knock octane boosting additive to gasoline. Ford was known to have said “There's
enough alcohol in one year's yield of an acre of potatoes to drive the machinery necessary
to cultivate the fields for a hundred years.” While there is not any readily available proof
on this number he had the right idea, that ethanol would work as a fuel source (Kovarik).
Currently surplus wine is being distilled to fuel European vehicles (Romanowicz).
Ethanol is currently used in the United States as a gasoline additive in a 10%
ethanol, 90% gasoline blend (E-10). This E-10 can be used in any vehicle made to run on
gasoline, and is mandatory in some areas of the country as a fuel oxygenate to improve
air quality. Many new flexible fuel vehicles (FFVs) are being produced which can run on
conventional gasoline, and E-85, a blend of 85% ethanol and 15% gasoline. More then 5
million FFVs have been sold in the US Many of the owners do not know they are driving
one however due to a lack of E-85 distribution infrastructure in many areas. (Ethanol
Market)
7
If London was known for gin production, the Caribbean for rum, and Ireland for
whiskey, then Brazil should be known for fuel. Brazil is the only country that has
switched over to ethanol as its primary fuel source. In the early 1980s the Brazilian
government began the Proálcool program in order to increase the countries domestic fuel
supply. This was a great success, with ethanol gaining the market majority over gasoline.
In 2003 Brazil was the largest exporter of ethanol in the world at 770 million liters
(Berg).
Ethanol does have some drawbacks that have caused it to not become the world’s
dominant fuel source. Ethanol has historically been more expensive then gasoline.
Ethanol does not have the distributive infrastructure or client base that gasoline has.
Fortunately, ethanol use is on the upswing. Only Brazil uses more fuel ethanol then the
US (Agriculture Online). Ethanol is a renewable source of energy, with a positive energy
balance (Hosein1). For every BTU of fuel dedicated to ethanol production, 6.34 BTU of
ethanol is created (Hosein2). With further breakthroughs in ethanol research and the
increasing prices of gasoline, the future of ethanol is bright.

8
METHODOLOGY
Environment
Fermentations are not always successful. Several problems can cause the process
to be sluggish or halt completely. Sugar is the fuel of yeast, but since too much can be
toxic, sugar concentrations above 1kg per 4.5 liters must be avoided. An assimilable
nitrogen source of at least 150mg/L of free amino nitrogen is needed as a nutrient source,
less then this can cause poor yeast growth and the formation of hydrogen sulfide. An
acidic pH between 3.5 and 5.5 was desired. The target temperature was 20°C for the
experiment. Below 18°C the fermentation can be sluggish, and above 26°C and the yeast
may be killed. Though fermentation is an anaerobic process oxygen is still necessary for
the initial yeast replication (YoBrew2), (Siler).
The three growth media tested include 100% pure grape juice distributed by
CORA 77183 Croissy-Beaubourg France, molasses donated by Ajinomoto Foods Europe,
and a mixture of water, yeast extract, and glucose which will further be referred to as
sugar water.
Grape Juice
Grape juice is a well-established method for producing alcohol in the form of
wine. Grape juice has good levels of yeast nutrients, acid, tannin, and two important
fermentable sugars (YoBrew2). The most easily accessible sugar for the yeast to use is
glucose. Though the other sugar, fructose, is available in similar concentrations, it is
more difficult for yeast to process. This results in the glucose concentration within the
grape juice falling more rapidly then the fructose concentration. While tannin’s

9
preservative qualities are important to the long term maturation of wine, they do not play
a major role in these experiments.
Sugar Water
The sugar water was prepared as follows. One liter of water was brought to a boil
in a large metal vessel. 5g of yeast extract was added, which provides much of the
nutrients required by the yeast. A nitrogen source of 1.2g amonium sulfate, and a
phosphorus source of 1g potassium dihydrogenophosphate were dissolved into the liquid.
50g of glucose was added in order to fuel the fermentation. The broth was stirred to
dissolve everything with a magnetic stir rod, and left to boil for 15mins. Finally the broth
was cooled to room temperature so that it would not kill the yeast which would later be
introduced.
Molasses
Molasses is derived from sugar cane or sugar beet and its cane version is the base
stock for rum. The molasses used in the lab was a blend of several kinds of beet
molasses, donated by Ajinomoto Foods Europe. The molasses had a sugar content of
about 50% by mass. A similar dilution was sought to match the sugar water experiment.
100g of molasses was dissolved in 1L of water by stirring; this produced a broth with an
initial sugar concentration of about 50g/L.

10
Yeast
The yeast used was the generic dehydrated yeast Saccharomyces cerevisiae, the
type available in small packets in the baking section of grocery stores. Before being
introduced to growth media the yeast was rehydrated in a graduated cylinder with a
magnetic stir rod. During initial testing of stains and calibration of equipment 100ml of
distilled water and 0.07g yeast were combined and stirred vigorously for 30 min. This
was necessary to wake up the cells and break up agglomerates that had formed. When the
yeast was being rehydrated for the purpose of fermentation, an inoculum was made. This
fluid contains all the yeast necessary in 10ml to inoculate 200 ml of sugar water, grape
juice or molasses. The inoculum was made by stirring 1g of yeast and 50ml of water
vigorously for 30 min.
Microscope
The microscope used was a Zeiss AXIO Imager.A1, accompanied by a Zeiss
AxioCam. The AxioVision 4.5 program was used to capture images. Once captured, the
images were interpreted by the software package Visilog 5.3 using a subroutine written
by Marie-Noëlle Pons. When viewed using the 100x objective lens the resulting total
magnification was 100 micro meters to 972 pixels. Capturing images was the most time
consuming part of the project. A series of 50 pictures were grabbed from each slide of
yeast broth. Each slide contained 1 drop of broth under a cover slip. A sample was taken
this way every 2 to 4 hours depending on the availability of equipment. The pictures of
the slide had to be focused so that there was a black halo around each cell. Then the
program would fill in this halo, using the hole fill feature, and count this circle as a cell.

11
Budding cells and double cells were counted the same way. Agglomerates were counted
as well, but only to find the total biomass visible in the picture. Cells that were partially
within the picture and partially out of view were disregarded using the “border kill”
feature. Sometimes this did not work with the program that counted the cells, so a
different approach was tried. Instead of a focusing to achieve a black halo, a white halo
would be focused for. This white halo would be the guide for the hole fill feature, and all
subsequent computer processing. When successful, an information sheet for each set of
about 50 pictures was generated. The info sheet listed the size and shape for every cell it
was able to process on every picture it was able to process.
Cell Staining
Staining cells involves introducing another chemical to the cell before viewing
with a microscope, there are many varieties of stains in existence, but only a few were
considered for this experiment.
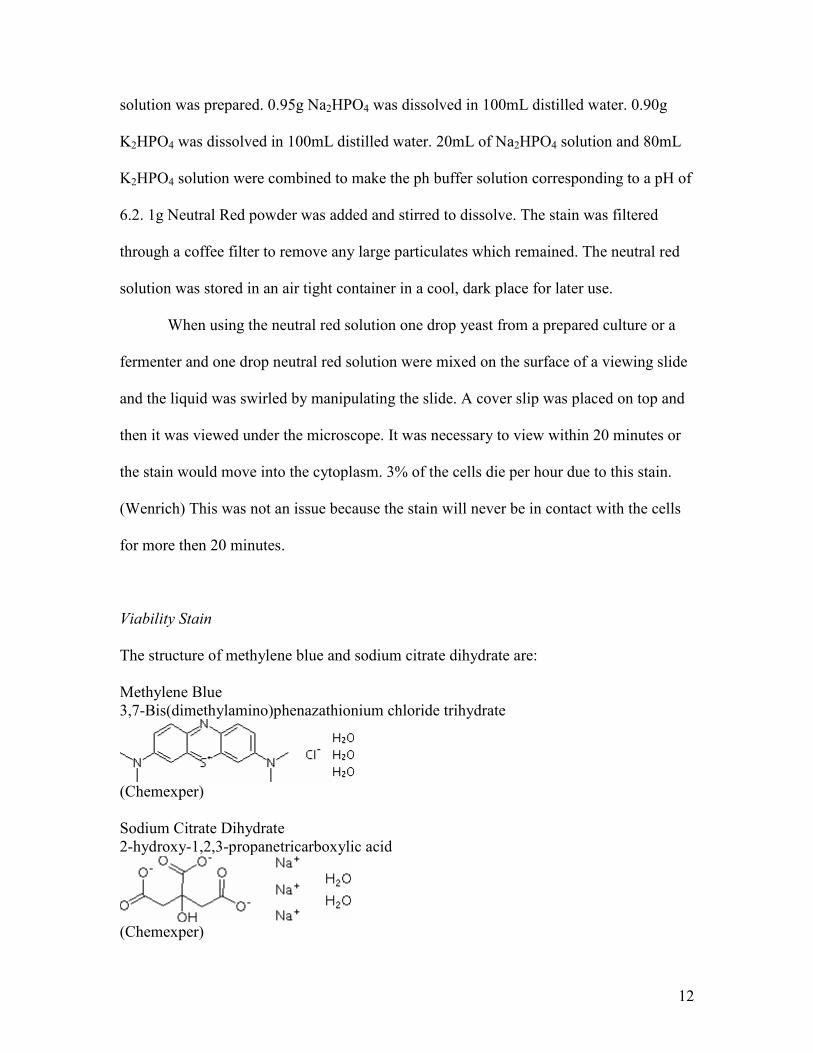
Neutral Red
The structure of neutral red is:
3-Amino-7-dimethylamino-2-methylphenazine hydrochloride
(Chemexper)
The purpose of neutral red is to stain vacuoles and lysosomes. This is helpful to
detect differences in those organelles throughout the lifecycle of the cell, and between
different fermentation batches. For the preparation and of this stain the following buffer
12
solution was prepared. 0.95g Na2HPO4 was dissolved in 100mL distilled water. 0.90g
K2HPO4 was dissolved in 100mL distilled water. 20mL of Na2HPO4 solution and 80mL
K2HPO4 solution were combined to make the ph buffer solution corresponding to a pH of
6.2. 1g Neutral Red powder was added and stirred to dissolve. The stain was filtered
through a coffee filter to remove any large particulates which remained. The neutral red
solution was stored in an air tight container in a cool, dark place for later use.
When using the neutral red solution one drop yeast from a prepared culture or a
fermenter and one drop neutral red solution were mixed on the surface of a viewing slide
and the liquid was swirled by manipulating the slide. A cover slip was placed on top and
then it was viewed under the microscope. It was necessary to view within 20 minutes or
the stain would move into the cytoplasm. 3% of the cells die per hour due to this stain.
(Wenrich) This was not an issue because the stain will never be in contact with the cells
for more then 20 minutes.
Viability Stain
The structure of methylene blue and sodium citrate dihydrate are:
Methylene Blue
3,7-Bis(dimethylamino)phenazathionium chloride trihydrate
(Chemexper)
Sodium Citrate Dihydrate
2-hydroxy-1,2,3-propanetricarboxylic acid
(Chemexper)
13
The purpose of this stain was to determine the fraction of viable and nonviable
cells in a sample. If a high percentage of the cells are viable then meant the culture was in
good condition. To prepare this stain .01g Methylene Blue was first dissolved in 10mL
distilled water. To this 2g sodium citrate dihydrate was introduced and allowed to
dissolve. Then enough distilled water to make 100mL was added. A small amount of
ethanol was also added to aid in the dissolving of particulates. The viability stain was
stored in an airtight container in a cool dark place.
The viability stain was viewed in the same manner as the neutral red. One drop
each of yeast culture and stain was mixed on a slide and viewed through a cover slip
under a microscope. For the purposes of this experiment the cells that turned blue were
considered dead, and the cells that did not turn blue are were viable. This stain killed 5%
of the cells an hour (Wenrich). Fortunately this did not matter because the slide within 20
minutes the liquid on the slide evaporated. The stain worked as expected, and this stain
was used when the viability of a yeast culture needed to be tested quickly. Other options
available included a plate count, but this would take too much time.
Biomass Absorbance
The absorbance of the broth was tested to determine the overall biomass growth.
An LKB Biochrom NovaSpec II specto-photometer was used at a wavelength of 660nm.
Plastibrand disposable 2.5ml, 12.5mm X 12.5mm X 45mm, cat. # 7591-70 cuvettes were
used. One cuvette was designated for each fermenter, and one for taring the specto-
photometer with distilled water before each measurement. To remove a sample from the
fermenter a syringe was filled with about 5ml of sample, and then the sample was pushed
14
back into the broth. This mixed the fermenter and allowed for a more representative
sample. About 20 seconds later an actual sample was taken and put into a cuvette. Care
had to be taken to not mix the broth too much or the dead cells from the bottom would be
redistributed and result in a higher absorbance. If the sample was pushed back in to the
fermenter too vigorously then it could cause a foam up. A foam up occurs when the
carbon dioxide bubbles are released all at once causing a head to form in, then overflow
from the fermenter, similar to pouring champagne into a glass. This was especially true
during the second and third days of fermentation. Waiting about 20 seconds before taking
the actual sample ensured that the sample itself was not entirely foam. The cuvette was
filled with sample to cover the entire clear region. It was necessary to flick the bottom of
the cuvette immediately before absorbance was measured in order to dislodge bubbles of
carbon dioxide from the sides of the cuvette. The reading was taken within a few seconds
of putting the sample into the specto-photometer. If there was a time delay between
placing the sample and taking the reading, then bubbles would form again and skew the
measurements. After each test the cuvettes were rinsed gently with distilled water and
shaken dry to avoid a sticky residue. A reading was taken every 2 to 3 hours.
Filtering Cells
In order to test for sugar concentrations and alcohol concentrations for the entire
life cycle of the yeast fermentation, it was necessary to halt the fermentation of a small
sample of broth. This was accomplished by removing the yeast cells from a sample of
broth. A syringe was rinsed with tap water, and then pumped a few times to remove
excess water. The syringe was filled to its capacity with broth, and then all but 3ml was

15
returned back to the fermenter. This allowed for the remaining water in the syringe to be
diluted and replaced with the sample. Along with the 3ml of sample in the syringe about
5 ml of air was drawn in. This was forced through a .2 micrometer pore size cellulose
nitrate white plain 25mm diameter Whatman membrane filter. The air buffer aids in
forcing the sample through the filter. A sample was taken every 3 to 4 hours to ensure a
good spread of data results. All samples were placed in a plastic test tube with an airtight
cap, and placed in a refrigerator until they were tested at a later date.
Sugar Concentration
The Anthrone Carbohydrate Method was used to test the concentration of sugar in
the broth. To make the anthrone reagent 400mg of anthrone was dissolved in 10ml of
ethanol. Enough 75% sulfuric acid was added in order to make 200ml of reagent total. At
no point can pure water be introduced to the anthrone. If water contacts the anthrone, the
milky fluid shown in figure 2a results, instead of the desired pale yellow color in figure
2b.
Figure 2a Figure 2b
This means the ethanol-anthrone blend must be made separately form the 75% sulfuric
acid. If 75% sulfuric acid is not already available then it can be made in a vessel that will
not be affected by high temperatures. When the water and acid are combined they release

16
a lot of heat. The anthrone reagent was made fresh the day of or the day before each use
and stored in the refrigerator.
Due to the limitations of the HACH absorbance meter each test tube had to be
very clean. The test tubes were all cleaned normally, then once with diluted sulfuric acid,
then rinsed out with distilled water. If the test tubes were not exceedingly clean then
simply rotating the same sample could register a wide range of values due to residue on
the glass.
The reagent changes colors depending on the sugar concentration. In order to
determine what colors corresponded to which sugar concentrations, a concentration curve
was determined. Sugar was dissolved in distilled water in a series of four different
concentrations. The test is only valid for very small sugar concentrations so much
dilution was necessary. The low end of the range required 10mg per Liter, so this meant a
dilution to 1x10⁻⁵ g of sugar in 1ml of water, and 1x10
-4 g of sugar in 1ml of water for the
upper limit. Below is figure 3, the calibration curve developed for this experiment.
Anthrone Method for Testing Sugar Content
Calibration Curve
y = 0.0056x
R2 = 0.9734
0
0.05
0.1
0.15
0.2
0.25
0.3
0.35
0.4
0.45
0.5
0.55
0.6
0 5 10 15 20 25 30 35 40 45 50 55 60 65 70 75 80 85 90 95 100
mg/L
Absorbance
Figure 3

17
To use the anthrone carbohydrate method 1ml of diluted sample and 4ml of
anthrone reagent were mixed in a test tube, then immediately placed in ice. There caps
were then put on tight and the test tubes were placed into an AQUA LYTIC CSB/COD
Reactor AL31 heating block at 100°C for exactly ten minutes. Then the tubes were
shaken again and put back into the ice bath. After the test tubes were cold enough to
handle they could be put into the HACH. First, to zero out the system, a sample of 4ml
anthrone and 1ml distilled water was used. The samples were then fed through the HACH
and readings were taken.
Magnets
Few past experiments have tested the effect of a magnetic field on the growth of
yeast cells, but the available results are optimistic. In one case exposure to a 220mT static
magnetic field for 24 hours resulted in a 36% increase of CO2 production. In another
experiment utilizing a similar field intensity ethanol production was 1.5 times higher and
glucose consumption increase by 27%. A field of 250mT raised biomass growth 109%
and ethanol production 114%. When a stronger magnetic field was applied the results are
even more impressive. A 520mT field produced a 26% increase of growth rate after only
3 hours (Pons).
The magnets used in this experiment are Calamit brand Neodyme 35 axial
magnetization magnets they have dimensions of 5mm thickness and 9.5mm diameter. A
series of five magnets is encased within a plastic box (figure 4). The center of each
magnet is spaced 2cm away from the next in a straight line, resulting in a total box height

18
of 10.5cm. One of each such boxes is placed on each side of a vessel so that the poles are
aligned. The magnets face in a way so that they pull towards each other.
Figure 4
Vessels
The vessels (figure 5) in which the fermentation takes place have a maximum
volume of 250ml, an inner diameter of 4.6cm, and an outer diameter of 5cm.
Figure 5

19
RESULTS
Effect of Magnet on Growth
The overall biomass growth was determined by measuring the absorbance of the
respective broth. The higher the absorbance the more cells are suspended in the broth.
Figure 6 shows the change in biomass in grape juice through out a four-day fermentation.
Absorbance at 660nm in Fermenting Grape Juice
0.40
0.60
0.80
1.00
1.20
1.40
1.60
1.80
2.00
2.20
0 10 20 30 40 50 60 70 80 90
Hours
Absorbance
Plain Magnetized
Figure 6
Figure 7 shows the growth of cells in molasses over the course of a five-day
fermentation.

20
Absorbance at 660nm in Fermenting Molasses
0.40
0.60
0.80
1.00
1.20
1.40
1.60
0 10 20 30 40 50 60 70 80 90 100
Hours
Absorbance
Plain Magnetized
Figure 7
Effect of Magnet on Sugar
Through the use of the anthrone method, the below figure 8 was developed. This
shows the consumption by the yeast of sugar in grape juice. This graph shows that the
magnetized fermenter consumed sugar at a higher rate.
Grape Juice Sugar Consumption
0
50
100
150
200
250
0 10 20 30 40 50 60 70 80
Hours
g/L
Plain Magnet Log. (Plain) Log. (Magnet)
Figure 8

21
As a visual aid to show the color change due to sugar content the picture below
was taken (figure 9). The vials with a lighter shade have a lower sugar concentration. On
the left are the plain samples with time decreasing from the 75 hour sample, left, to the
initial sample, right. On the right are the magnetized samples, with time decreasing from
left to right in the same fashion as the plain samples.
Figure 9
The difference in sugar concentration between the magnetized fermenter and the
plain fermenter is visible in figure 10. From left to right the samples are as follows:
Magnetized 23, Plain 23, M31, P31, M47, P47, M55, P55, M71, P71
Figure 10

22
The magnetized samples shown have less sugar then the plain samples from the same
time. Times less then 23 hours were not shown in this picture because the samples were
very similar.
The molasses had better results then the grape juice. The sugar consumption for
molasses is shown in figure 11.
Molasses Sugar Consumption
0
10
20
30
40
50
60
0 10 20 30 40 50 60 70 80 90
Hours
g/L
Plain Magnetized Log. (Magnetized) Log. (Plain)
Figure 11

23
DISCUSSION
Microscopy
Microscopy was helpful in viewing changes in cell morphology and gaining a
qualitative understanding of cell growth. However, even when paired with image analysis
software, microscopy was not helpful in producing a quantitative measure of cell growth.
When determining the number of cells in a sample many problems arose. For example,
particulates were often counted as cells. The molasses was a particular problem because
of the quantity of particulates. Actual cells were often disregarded. A representative
sample was not always acquired. Even within the same slide certain sections contained
large quantities of cells, and other areas were barren. The apparent size of the cells
changed depending on how the microscope was focused. Often some cells would be out
of focus while others were in focus so that large black spots would overlap other cells.
During times of peak cell concentration agglomerates of cells prevented the counting of
individual microbes.
Stains
The neutral red stain did not show vacuoles and lysosomes as expected since the
stain moved into the cytoplasm within 3 to 5 minutes, However, it was still helpful in
increasing the contrast between the cells and the background. With this added contrast the
processing software for the microscope pictures was able to register the cells with greater
accuracy. The viability stain was not helpful because the image analysis software did not
distinguish between the respective colors of living and dead cells. A manual count was
possible but not practical due to time constraints.

24
Effect of Magnet on Growth
Fermenting within a magnetic field had a definite impact on the growth of yeast
cells. The increase in yeast cells resulted in more sugar being consumed at a greater rate.
During the first day of growth, absorption was relatively constant or initially fell a small
amount. This could be because of particulates falling to the bottom of the fermenter, or
because the yeast was still in its initial stages of reproduction. During the second day
production was in full swing. Biomass absorbance rose by a third in grape juice and by a
half molasses. By the third day, growth started to level off with a small increase of about
5% in grape juice and 10% in molasses. On the fourth day, the amount of suspended cells
in the broth reached a maximum. This was because the majority of the sugar had already
been consumed, and the ethanol levels were beginning to become toxic for the remaining
cells. By the fifth day, cell biomass fell as cells died off and sank to the bottom of the
fermenter.
Accuracy In Sugar Concentration Determination
There were several problems that played havoc on testing the sugar concentration.
The anthrone method has a 100mg of sugar per liter of water cap. The sugar
concentration of the broth is always much higher this resulting in a problem involving the
samples. For the sugar water it was necessary to dilute the samples 500 times. This means
1mL sugar water in half a liter of distilled water, or 2µL of sample in 0.998mL of
distilled water. The smallest unit of measure was in no way accurate to such a small
quantity. The grape juice had an even higher sugar concentration of 159g/L. The lowest
unit of measure available was 7µL, so this quantity of sample was put into a test tube,

25
diluted by filling the tube to 10ml, then 1ml of this dilution was used to react with the
anthrone. The molasses’ concentration was thought to be the same as the sugar water,
50g/L, but without knowing the actual concentration one can not be sure.
Through all this dilution it is questionable to what accuracy a sample can be
measured. Even with just some water remaining in a test tube due to incomplete drying or
an extra 1µL due to sample on the outside of the micropipette, plus error for all the
dilutions a 30% error can result.
Do to the preparation time and the anthrone reagent’s questionable shelf life, all
readings were left until the end of the respective experiment. On the last day of the
fermentation the samples that had been taken over the course of that week were tested.
This may have caused more problems. If not all of the yeast cells were removed by the
filtering process then a slow fermentation would continue in the sample test tube in the
refrigerator. This explains points with a much lower sugar concentration then expected. It
is suspected that this may have happened because after a few samples warmed back up to
room temperature during testing they popped off there plastic push on tops. This shows a
production of CO2 gas which means a consumption of sugar, and skewed results.
Error was likely introduced from the equipment. The HACH had to be tared often,
because it would start giving different results for the same samples. When two test tubes
of a water and anthrone mix were compared they gave very different results. Many
samples from beyond the fiftieth hour incorrectly gave negative absorbance values,
meaning that there was less sugar in the sample then in the distilled water it had been
diluted with. Another limitation was the heating block. Its maximum capacity was less
then a week’s worth of samples. This meant that the samples from the plain reactor and

26
the magnetized reactor had to be processed separately. The heating block also had layers
of ash burned into the heating wells. This affected the results because the test tubes had to
be very clean in order for the HACH to get an accurate reading. Figure 8 shows the
amount of sugar that had been consumed in the grape juice by the yeast. The error is
visible here with the knowledge that the initial sugar concentration of grape juice is only
159g/L, so at no point could the yeast have consumed over 200g/L as the graph shows.
During the testing of the grape juice something else was learned about the
HATCH. Depending on how well the samples were mixed the resulting absorbencies
would change. The more a sample had been shaken the higher the absorbance would be.
This knowledge was used when processing the molasses samples.
The cleaning process of the inside of the test tubes was also very important; if
there was any residue then the anthrone would have side reactions. Figure 12 shows the
changes in samples depending on how well-mixed and how well -cleaned the test tubes
were. From left to right, clean sample unmixed, clean sample mixed, unclean sample
unmixed, and unclean sample mixed; these four samples have similar sugar
concentrations.
Figure 12
27
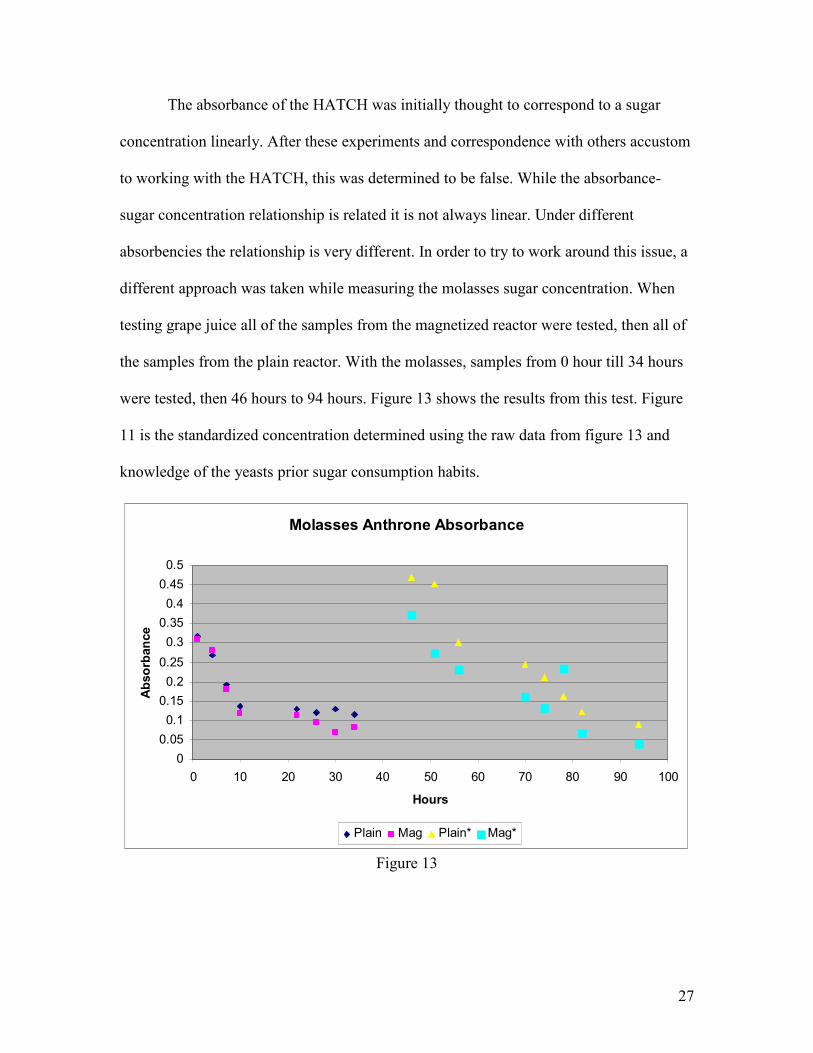
The absorbance of the HATCH was initially thought to correspond to a sugar
concentration linearly. After these experiments and correspondence with others accustom
to working with the HATCH, this was determined to be false. While the absorbance-
sugar concentration relationship is related it is not always linear. Under different
absorbencies the relationship is very different. In order to try to work around this issue, a
different approach was taken while measuring the molasses sugar concentration. When
testing grape juice all of the samples from the magnetized reactor were tested, then all of
the samples from the plain reactor. With the molasses, samples from 0 hour till 34 hours
were tested, then 46 hours to 94 hours. Figure 13 shows the results from this test. Figure
11 is the standardized concentration determined using the raw data from figure 13 and
knowledge of the yeasts prior sugar consumption habits.
Molasses Anthrone Absorbance
0
0.05
0.1
0.15
0.2
0.25
0.3
0.35
0.4
0.45
0.5
0 10 20 30 40 50 60 70 80 90 100
Hours
Absorbance
Plain Mag Plain* Mag*
Figure 13

28
For future experiments, in order to accurately gauge the sugar concentration each
set of samples should also include controls containing known sugar concentrations in the
same range as the samples. Because this range is not known until the experiment is run
this could result in repeating runs several times until the actual concentrations are
determined. The maximum capacity of the heating block is 17, with the 5 spots reserved
for controls in order to develop a new calibration curve for that specific run only 12 spots
remain for actual samples. In the case of the molasses experiment this would of required
3 separate runs, and another 100ml of anthrone reagent.
Hydrometers are another option to test the changes in alcohol and in sugar
concentration by measuring the specific gravity of the broth. I highly recommend that this
piece of equipment is looked into for future experiments in order to completely bypass all
dilutions, many sources of error, and also speed up the return time between sample taking
and getting quantitative results.

29
WORK CITED
Agriculture Online, "New study confronts old thinking on ethanol's net energy value."
Agriculture online. 28 Mar 2005. 26 Feb 2007
<http://www.agriculture.com/ag/story.jhtml?storyid=/templatedata/ag/story/data/a
gNews_050328crETHANOL.xml&catref=ag1001>.
Allchin, F. R. . "India: The Ancient Home of Distillation?."
Man, New Series Vol. 14, No. 1, doi:10.2307/2801640
Mar 1979 55-63. 20 Jan 2007 <http://links.jstor.org/sici?sici=0025-
1496%28197903%292%3A14%3A1%3C55%3AITAHOD%3E2.0.CO%3B2-
0&size=LARGE>.
Argiriou T, Kalliafas A, Psarianos C, Kana K, Kanellaki M, Koutinas AA.,
"New alcohol resistant strains of Saccharomyces cerevisiae species for potable
alcohol production using molasse." Appl Biochem Biotechnol. Sep 1992.
Department of Chemistry, University of Patras, Greece.. 24 Jan 2007
<http://www.ncbi.nlm.nih.gov/entrez/query.fcgi?cmd=Retrieve&db=PubMed&lis
t_uids=1288406&dopt=Abstract>.
Berg, Christoph. WORLD FUEL ETHANOL ANALYSIS AND OUTLOOK.
Apr 2004. F.O. Licht. 5 Feb 2007 <http://www.distill.com/World-Fuel-Ethanol-
A&O-2004.html>.
Case, Christine. "Microbial Fermentations:." Access Excellence. 1999.
The National Health Museum. 22 Jan 2007
<http://www.accessexcellence.org/LC/SS/ferm_background.html>.
Chemexper, "Find chemicals and suppliers by name, molecular formula or cas number:."
chemexper. 5 Feb 2007 <http://www.chemexper.com/index.shtml?main=http:
//www.chemexper.com/search>.
Erowid, "Alcohol Timeline." The Vaults Of Erowid. 09 Jul 2006. Erowid. 20 Jan 2007
<http://www.erowid.org/chemicals/alcohol/alcohol_timeline.php>.
"Ethanol Market." Alternative Fuels Data Center Energy Efficiency and Renewable
Energy. 27 Oct 2006. US Department of Energy. 27 Jan 2007
<http://www.eere.energy.gov/afdc/altfuel/eth_market.html>.
Farabee, MJ. "Glycolysis, the Universal Process." CELLULAR METABOLISM AND
FERMENTATION. 21 June 2001. Estrella Mountain Community College.
15 Jan 2007 <http://www.emc.maricopa.edu/faculty/farabee/biobk/
BioBookGlyc.html>.

30
H2G2, "Rum." bbc.co.uk. 02 Oct 2003. BBC. 20 Jan 2007
<http://www.bbc.co.uk/dna/h2g2/A1155854>.
Hong EL, Balakrishnan R, Christie KR, Costanzo MC, Dwight SS, Engel SR, Fisk DG,
Hirschman JE, Livstone MS, Nash R, Oughtred R, Park J, Skrzypek M, Starr B,
Theesfeld CL, Andrada R, Binkley G, Dong Q, Lane CD, Hitz BC, Miyasato S,
Schroeder M, Weng S, Wong ED, Dolinski K, Botstein D, and Cherry JM.,
"S. cerevisiae Pathway: glucose fermentation." Saccharomyces Genome
Database. 05 Feb 2007. Saccharomyces Genome Database. 15 Jan 2007
<http://pathway.yeastgenome.org:8555/YEAST/new-
image?type=PATHWAY&object=GLUCFERMEN-PWY>.
Hosein1 Shapouri, Andrew McAloon, "THE 2001 NET ENERGY BALANCE OF
CORN-ETHANOL." USDA 30 Jan 2007
<http://www.usda.gov/oce/reports/energy/net_energy_balance.pdf>.
Hosein2 Shapouri, James A. Duffield, and Michael Wang. U.S. Department of
Agriculture, "The Energy Balance of Corn Ethanol: An Update."
USDA Office of the Chief Economist, Office of Energy Policy and New Uses
Agricultural Economic Report No. 814.July 2002 15. 26 Feb 2007
<http://www.usda.gov/oce/reports/energy/aer-814.pdf>.
Kovarik, Bill. Henry Ford, Charles Kettering and the "Fuel of the Future".
1998. Radford. 5 Feb 2007
<http://www.radford.edu/~wkovarik/papers/fuel.html>.
McGovern, P.E., Zhang, J., Tang, J., Zhang, Z., Hall, G.R., Moreau, R.A., and Nunez, A..
"Fermented Beverages of Pre and Protohistoric China." Nature V. 101, NO. 5.
21 Dec 2004 17593-17598. 05 Feb 2007 <http://arsserv0.tamu.edu/research/
publications/publications.htm?SEQ_NO_115=141014>.
Phillips, Tony, Noever David. "Planets in a Bottle More About Yeast." Science@NASA.
03 Nov 2006. NASA. 5 Feb 2007 <http://science.nasa.gov/newhome/headlines/
msad16mar99_1b.htm>.
Pons MN, Da Motta M, Motta MA, "Steady magnetic field induce changes on
Saccharomyces cerevisiae cultivation."
Romanowicz, Goska. Rivers of unwanted wine to turn into biofuel.
08 June 2006. Edie News Centre. 5 Feb 2007
<http://www.edie.net/news/news_story.asp?id=11558&channel=0>.
Siler, C.E., and J.R. Morris. "High Alcohol Fermentation of Grape Juice Concentrate."
ProcCoolClim NY July VI(1996): 97-99.

31
Strand, Gert. "High Alcohol Wine Yeast." Turbo Yeast. Turbo Yeast. 27 Jan 2007
<http://www.distillery-yeast.com/high_alcohol_wine_yeast.htm>.
Wenrich, D.H.. McClung's Handbook of Microscopical Technique.
New York: Paul B. Hoeber, Inc. 1929.
YoBrew, "Alcoholic fermentation by yeast cells." YoBrew. 5 Feb 2007
<http://www.yobrew.co.uk/fermentation.php>.
YoBrew2, " Stuck wine fermentations and how to restart them." YoBrew. 5 Feb 2007
<http://www.yobrew.co.uk/stuck.php>.

32
DATA TABLES
Biomass Absorbance at 660nm
Biomass Absorbance in Fermenting Grape Juice
Hours Plain Magnetized
1 0.51 0.46
3 0.50 0.45
5 0.52 0.44
7 0.50 0.46
8.5 0.52 0.50
23 1.16 1.23
26 1.30 1.33
29 1.46 1.50
32 1.56 1.63
47 1.85 1.89
50 1.85 1.89
53 1.90 1.92
56 1.95 1.94
71 1.98 1.98
74 2.00 2.00
80 1.98 2.00
Biomass Absorbance in Fermenting Molasses
Hours Plain Magnetized
1 0.67 0.66
4 0.64 0.63
7 0.67 0.65
10 0.68 0.68
13 0.73 0.74
22 0.59 0.63
25 0.76 0.80
28 0.89 0.93
30 0.88 0.96
31 1.02 1.10
34 0.98 1.11
46 1.18 1.27
48 1.26 1.34
50 1.26 1.40
53 1.32 1.40
56 1.33 1.36
70 1.35 1.45
73 1.41 1.49
76 1.43 1.49
79 1.41 1.46
82 1.38 1.39
94 1.04 0.99
97 1.03 1.08
100 1.05 1.05

33
Anthrone Absorbance at 625nm
Anthrone Absorbance in Grape Juice
Hours Plain Magnetized
0 0.483
1 1.890 0.507
3 1.417 0.243
6 0.897 0.424
23 0.809 0.144
27 0.716 0.496
31 0.405 0.11
47 0.328 0.033
51 0.249 -0.187
55 0.370 -0.19
71 -0.060 -0.103
75 -0.114 -0.256
Anthrone Absorbance in Molasses
Hours Plain Magnetized
1 0.315 0.309
4 0.269 0.282
7 0.191 0.18
10 0.136 0.117
22 0.130 0.111
26 0.120 0.094
30 0.129 0.069
34 0.114 0.082
46 0.470 0.372
51 0.453 0.274
56 0.302 0.232
70 0.245 0.161
74 0.211 0.131
78 0.162 0.235
82 0.121 0.067
94 0.089 0.04