the effectiveness of state and local regulation of
TRANSCRIPT
THE EFFECTIVENESS OF STATE AND LOCALREGULATION OF HANDGUNS: A
STATISTICAL ANALYSISMARTIN S. GEISEL,* RICHARD ROLL,**
and R. STANTON WETTICK, JR.***
One aspect of the continuing debate over weapons control,apart from Constitutional issues, is whether legislation isinherently capable of reducing crime and deaths by shooting.The opponents of increased control, tacitly admitting thatempirical evidence is one means for measuring the effect ofweapons regulation, have contended that "[expert opinion andcompelling evidence seem to indicate that the amount or kindof crime in a community is not substantially affected by therelative ease with which a person can obtain a firearm. "'NATIONAL.RIFLE ASSOCIATION OF AMERICA, THE GUN LAW
PROBLEM 10. In the following study the authors employ dataanalysis techniques to examine the efficacy of state andmunicipal controls on handguns. They conclude that manylives would be saved if all states increased their level of controlto that of New Jersey, the state having the most stringent guncontrol laws.
T he current controversy over gun control centers on theeffectiveness of stringent gun control legislation. Proponents of
increased statutory control contend that rigorous laws will reducedeath and crime rates by curtailing firearm possession by minors andsuch irresponsible adults as felons, mental incompetents, addictsand alcoholics. They argue that this justifies minor inconveniencesimposed on responsible citizens who use firearms for hunting, target-shooting and protection.
* Research Associate of Economics, Carnegie-Mellon University, B.S. 1963, Case Instituteof Technology; M.B.A. 1965, University of Chicago.
** Assistant Professor of Economics, Carnegie-Mellon University. B.A.E. 1961, AuburnUniversity; M.B.A. 1963, University of Washington; Ph.D. 1968, University of Chicago.
*** Assistant Professor of Law, University of Pittsburgh Law School. B.A. 1960, AmherstCollege; L.L.B. 1963, Yale Law School.
The authors are indebted to James H. Scott, Jr., for data collection and useful suggestions.I For a general background to the gun control controversy see Congress and "Gun

DUKE LA W JOURNAL
Opponents of increased control, however, argue that gun controllegislation is not of sufficient value in the prevention of crime tojustify the restrictions it places on the responsible citizen They con-tend that death and crime rates are not perceptibly reduced throughgun control because such legislation does not prevent the professionalcriminal-the alleged "root" of the problem-from obtaining fire-arms. Furthermore, even if these laws did reduce the number offirearms possessed by professional criminals, other equally lethalweapons are readily available as adequate substitutes0
One possible reason for this polarity of opinion is the lack ofreliable empirical information describing the relationship between guncontrol legislation and death and crime rates. This article willattempt to alleviate this deficiency by presenting an empiricalstudy which correlates gun control with various death and crimerates for 'states and cities, while simultaneously accounting forthe influence of other factors such as per capita income, educationand population density.
DESCRIPTION OF THE STUDY
The study measures the effectiveness of gun control legislation bythe extent to which differences in death- and crime rates among thestates and cities can be explained by the differences in gun controllegislation while accounting for the effects of sevetal other factorsthat may influence death and crime rates. Differences in death andcrime rates among the states and cities were obtained by collectingdata on the rates of homicide by firearm, total homicide, suicide byfirearm, total suicide, aggravated assault by firearm, total aggra-vated assault, accidental death by firearm and robbery (hereinafterreferred to as "death and crime rates") for the fifty states, theDistrict of Columbia and the 129 United States cities whose popula-
Control" Proposals, 45 CON.G. DIG. 289 (1966); Congress and the National Crime Problem,46 CONG. DIG. 193 (1967); Harris, Annals of Legislation-lJ You Lose Your Gius. TimNEW YORKER, Apr. 20, 1968, at 56.
- See THE TRUE FACTS ON FIREARi LEGISLATION THREE STATISTICAL STUDIES (NationalShooting Sports Foundation, Inc., 1968).
' M. VOLFGANG. PATTERNS IN CRIMINAL HOMICIDE (1958). "[F]ew homicides due toshootings could be avoided merely if a firearm were not immediately present .. . theoffender would select some other weapon to achieve the same destructive goal. Probably onlyin those cases where a felon kills a police officer, or vice versa, would homicide be avoided inthe absence of a firearm." Id. at 83.
[Vol. 1969: 647

HANDGUN REGULATION
tion exceeded 100,000 in 1960. Differences in the other factors whichmay account for variations in the death and crime rates were ob-tained by collecting data relating to income, education, sex, police,race, population density, licensed hunters, age and temperature forthe states and cities.
For the gun control legislation of the states and cities it wasnecessary to devise a method to measure the differences in state andcity firearm legislation. Since there is a wide range of differences inweapons regulation among the states and cities, it was impossible tocharacterize adequately these differences by means of a dichotomousvariable such as "weak gun control states" and "strong gun controlstates." It was possible, however, to classify the various guncontrol regulations into eight major categories. This permittedquantification of the gun control provisions of state statutes andcity ordinances by assigning numerical weights to each of the eightcategories in a manner to be explained below. Once gun controllegislation was so quantified, a well-known data analysis technique'was employed to obtain probabilistic estimates of the extent towhich differences in the death and crime rates are related to thedifferences in gun control, while simultaneously accounting forother factors.
Data
The state death and crime data used in this study are 1960 and1965.rates of homicide by firearm, total homicide, suicide by firearm,total suicide and accidental death by firearm and in addition, 1965rates of robbery, aggravated assault by firearm and total aggravatedassault; for cities, only 1960 rates for total homicide and total suicidewere available.5 In all instances the data are in rates per millionpopulation per year.
For states, the following explanatory variables were used: 1960and 1965 income (thousands of dollars per capita); education(median school years completed by persons older than 24); sex(males per 100 females); police employees (employees per 10,000population); race (non-white percentage of total population- 1960,and black males per 50 population- 1965); population density
'The basic statistical technique used in this study was multiple linear regression. Seenotes- 48-51 hijra and accompanying text. See generally A. GOLDBERGER. ECONOMETRICTHIORY (1964).
3 Sources of all data are available from the authors on request.
Vol. 1969: 647] 649

DUKE LA W JOURNAL
(thousands of persons per square mile); age (median age in years)and licensed hunters (number per capita- 1965 only).
For cities, the variables were: 1960 income (thousands of dollarsper capita); education (median school years completed by personsolder than 24); race (non-white percentage of population); populationdensity (thousands of persons per square mile); age (median age inyears); temperature (minus thousands of mean annual degree days-65* base); manufacturing employees (persons per 1000 populationemployed in manufacturing durable goods); and police expenditures(dollars per capita)!
Gun Control Legislation
Federal legislation. Since we are concerned with variations infirearm legislation among states and cities, federal legislation isrelevant oily to the extent that it sets minimum standards whichexist throughout the United States. Prior to 1968, federal control overfirearms was minimal: there were two federal statutes regulating thesale of firearms, both primarily aimed at the criminal purchaser. TheNational Firearms Act, enacted in 1934, restricted trade in machineguns and short-barreled shotguns and rifles by imposing a prohibitivetax on their manufacture and transfer, and by requiring manufac-turers, importers, dealers and transferees of such weapons to register.The Federal Firearms Act of 1938- extended federal control by re-quiring all firearm manufacturers, importers and dealers engaging ininterstate commerce to obtain a federal license and to maintain per-manent records of importation, shipment and other disposal of fire-arms; prohibited dealers and manufacturers from knowingly sellingand delivering firearms to felons or to persons without a license to
6 Mean annual degree days are calculated as follows: If the temperature is below 65* F.,subtract the temperature from 65. If the temperature is above 65% a value or zero isassigned. These daily averages are then added to determine the total number of degree daysfor the year. Thus, the colder the climate the greater is the number of mean annual degree days.
For "States 1965", only 1960 age, education, race and police data were available. Datafor all other explanatory variables were for the same year as the death and crime data.
SCh. 757, 48 Stat. 1236 (1934). Presently codified as Pub. L. No. 90-618. § 201 (1968U.S. CODE CONG. & AD. NEWs 1413-24), amending 26 U.S.C. §§ 5801-5862.
9 Ch. 850, 52 Stat. 850 (repealed in 1968). The basic provisions of the Act are nowcontained in the Gun Control Act of 1968, Pub. L. No. 90-618, §§ 101-302 (1968 U.S.CODE CONG. & AD. NEWs 1397-1424). This Act amended Title IV of the Omnibus CrimeControl & Safe Streets Act of 1968, Pub. L. No. 90-351, 18 U.S.C.A. §§ 921-28 (Supp.1968), which had repealed the Federal Firearms Act of 1938.
[Vol. 1969: 647

HANDGUN REGULATION
purchase where one was required by state or local law; andprohibited felons from receiving firearms and ammunition whichhad moved in interstate commerce. In addition, postal regulationsprohibited shipments of hand guns through the mails, exceptbetween manufacturers and dealers and to certain public officers.?0
In 1968, stronger federal gun control legislation was enacted."1
Aimed at reinforcing state and local gun control regulations bybarring interstate firearm transactions, the basic provisions of thisAct include prohibitions against shipments of firearms in interstatecommerce except between licensed dealers;12 prohibitions againstpersons, except licensed dealers, transporting into or receiving inthe state of their residence any firearms obtained outside the state;13
prohibitions against sales to non-residents with certain exceptionsfor sales of rifles and shotguns to residents of a contiguous state;4
prohibitions against saies to or receipt by persons less than twenty-one years of age (eighteen years of age for rifles and shotguns),convicted criminals, drug users and persons adjudicated as mentallydefective;"5 the imposition of licensing and record-keepingrequirements on manufacturers, importers and dealers; 6 theimposition of controls over the manufacture, importation and saleof highly destructive weapons such as bazookas, mortars, grenadesand bombs; 7 and the imposition of additional controls overweapons covered by the National Firearms Act.?
State and local legislation. There are substantial variations instate and local regulations over the sale, possession and use offirearms. States such as Ohio, 9 Minnesota2' and Kentucky2'
10 39 C.F.R. 125.5 (1968). Prior to 1968 no restrictions were placed on interstate firearmshipments by common carrier. The chief effect of the postal regulations was to send thepurchasers of handguns by mail to the Railway Express Agency rather than the post office.tt Gun Control Act of 1968, Pub. L. No. 90-618 §§ 101-302 (1968 U.S. CODE CONG. &
AD. NEWS 1397-1424), amending 18 U.S.C.A. § 901-28 (Supp. 1968).1 Id. (1968 U.S. CODE CONG. & AD. NEWs at 1404-05) (18 U.S.C.A. §§ 922(d), (1) &
(1i)).13 Id. (1968 U.S. CODE CONG. & AD. NEWS at 1401) (18 U.S.C.A. § 922(a)(3)).1I Id. (1968 U.S. CODE CONG. & AD. NEws at 1401-02) (18 U.S.C.A. § 922(a)(5)).
Is Id. (1968 U.S. CODE CONG. & AD. NEWS at 1404) (18 U.S.C.A. § 922(d)).Is Id. (1968 U.S. CODE CONG. & AD. NEWS at 1406-09) (18 U.S.C.A. § 923).' Id. (1968 U.S. CODE CONG. & AD. NEws at 1402, 1406-07) (18 U.S.C.A. §§ 922(b)(4),
923(a)).z See note 8 supra and accompanying text."OHio REV. CODE ANN. §§ 2923.01-.06 (Page 1954 & Supp. 1968).MIN". STAT. ANN. §§ 609.66-.67 (1964).
II Ky. REV. STAT. ANN. § 435.230 (1963).
Vol. 1969: 647]
652 DUKE LA W JOURNAL [Vol. 1969: 647
impose almost no controls; while New Jersey,.2 Hawaii2 andMichigan?4 strictly regulate such activities.
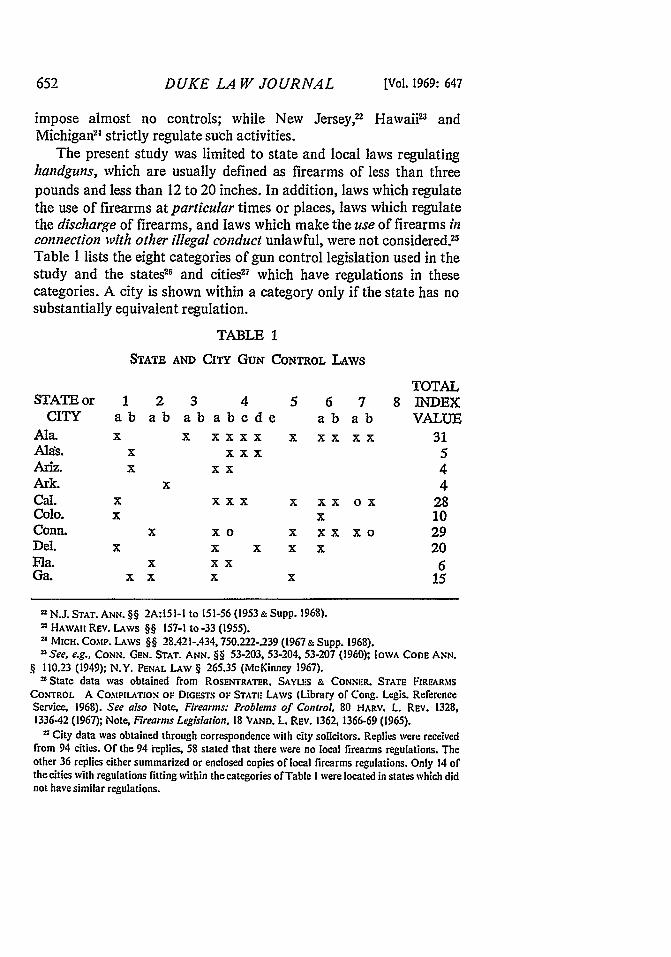
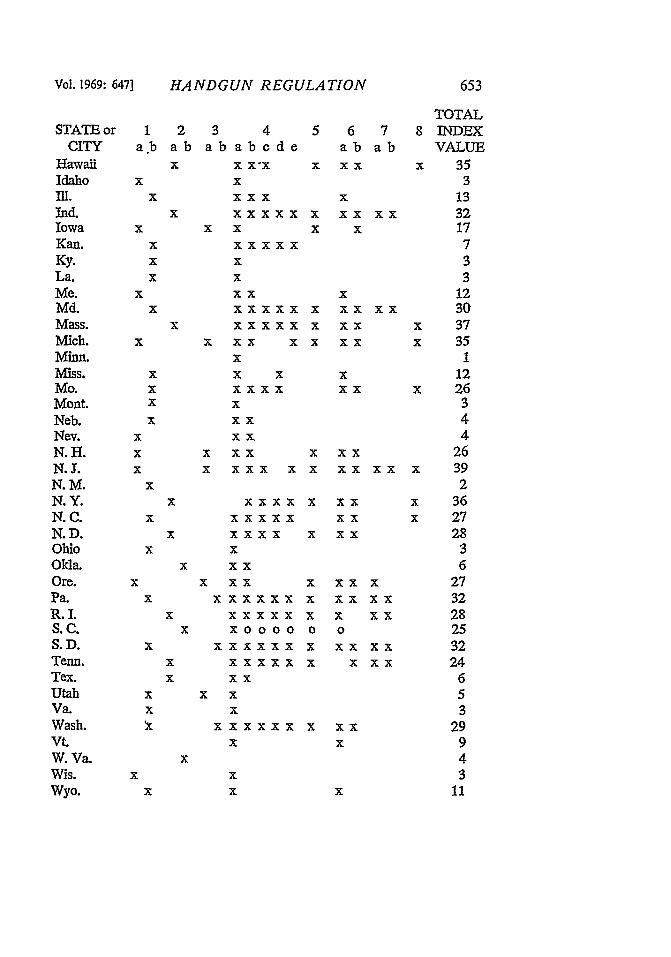
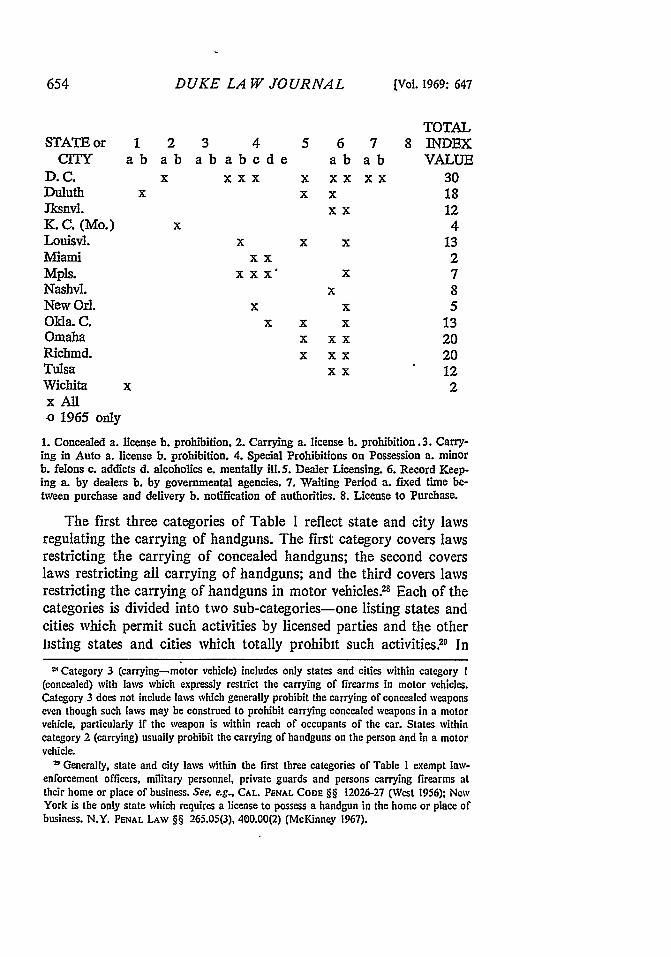
The present study was limited to state and local laws regulatinghandguns, which are usually defined as firearms of less than threepounds and less than 12 to 20 inches. In addition, laws which regulatethe use of firearms at particular times or places, laws which regulatethe discharge of firearms, and laws which make the use of firearms inconnection with other illegal conduct unlawful, were not considered.pTable I lists the eight categories of gun control legislation used in thestudy and the states26 and cities27 which have regulations in thesecategories. A city is shown within a category only if the state has nosubstantially equivalent regulation.
TABLE 1
STATE AND CITY GUN CONTROL LAWS
TOTALSTATE or 1 2 3 4 5 6 7 8 INDEX
CITY ab ab ab abcde ab ab VALUEAla. x x xxxx x xx xx 31Alas. x xxx 5Ariz. x xx 4Ark. x 4Cal. x xxx x xx ox 28Colo. x x 10Conn. x x o x xx x o 29DeI. x x x x x 20Fla. x x x 6Ga. x x x x 15
22 N.J. STAT. ANN. §§ 2A:151-1 to 151-56 (1953 & Supp. 1968).1 HAWAII REV. LAWS §§ 157-1 to-33 (1955).2' MICH. Co.%P. LAWS §§ 28.421-.434, 750.222-.239 (1967 & Supp. 1968).2'See, e.g.. CONN. GEN. STAT. ANN. §§ 53-203, 53-204, 53-207 (1960); loWA CODE ANN.
§ 110.23 (1949); N.Y. PENAL LAW § 265.35 (MeKinney 1967).2 State data was obtained from ROSENTRATER. SAYLES & CONNIER. STATE FIREAR.MS
CONTROL A COMPILATION OF Dim-STS OF STAT- LAWS (Library of Cong. Legis. ReferenceService, 1968). See also Note, Firearms: Problems of Control, 80 HARV. L. REV. 1328,1336-42 (1967); Note, Firearms Legislation, 18 VAND. L. REV. 1362, 1366-69 (1965).
7, City data was obtained through correspondence with city solicitors. Rcplies were receivedfrom 94 cities. Of the 94 'eplies, 58 stated that there were no local firearms regulations. Theother 36 replies either summarized or enclosed copies of local firearms regulations. Only 14 ofthe cities with regulations fitting within the categories ofTable I were located in states which didnot have similar regulations.
Vol. 1969: 647]
STATE orCITY
HawaiiIdahoIll.Ind.IowaKan.Ky.La.Me.Md.Mass.Mich.Minn.Miss.Mo.Mont.Neb.Nev.N.H.N.J.N.M.N.Y.N.C.N.D.OhioOkla.Ore.Pa.R.I.S.C.S.D.Tenn.Tex.UtahVa.Wash.Vt.W. Va.Wis.Wyo.
HANDGUN REGULATION
1 2a.b ab
x
X
3 4 5 6ababode ab
X-X x xxx
xxx XXXXXX x XX
X X x
XXXXx
xX
XxXXXIX
XXXIX
XX
X X
XXXI
XX
x
XX
X
7ab
xx
XX
XX X
XxXX
XXX
xxxx
XXXIX
XXI
X XX
I XX
XXXIXX
XX
X X
X X
XXXIX XX XO000 0
XXXIX X
xx
X X
X X
xXX
xx
XX
XX
XXXX X
TOTAL8 INDEX
VALUEx 35
3133217733
1230
x 37x 35
112
x 26344
26x 39
2x 36x 27
2836
273228253224
653
29943
11
DUKE LA W JOURNAL
STATE orCITY
D.C.DuluthJksnvl.K. C. (Mo.)Louisvl.MiamiMpls.Nashvl.New OrI.Okla. C.OmahaRichmd.TulsaWichitax Allo 1965 only
TOTAL1 2 3 4 5 6 7 8 INDEX
ab ab ab abede ab ab VALUEx xxx x xx xx 30
x x x 18xx 12
XX X
XXX,
X X
X
XX X X
1. Concealed a. license b. prohibition. 2. Carrying a. license b. prohibition. 3. Carry-ing in Auto a. license b. prohibition. 4. Special Prohibitions on Possession a. minorb. felons c. addicts d. alcoholics e. mentally ilL.5. Dealer Licensing. 6. Record Keep-ing a. by dealers b. by governmental agencies. 7. Waiting Period a. fixed time be-tween purchase and delivery b. notification of authorities. 8. License to Purchase.
The first three categories of Table I reflect state and city lawsregulating the carrying of handguns. The first category covers lawsrestricting the carrying of concealed handguns; the second coverslaws restricting all carrying of handguns; and the third covers lawsrestricting the carrying of handguns in motor vehicles 8 Each of thecategories is divided into two sub-categories-one listing states andcities which permit such activities by licensed parties and the otherlisting states and cities which totally prohibit such activities 9 In
Category 3 (carrying-motor vehicle) includes only states and cities within category I(concealed) with laws which expressly restrict the carrying of firearms in motor vehicles.Category 3 does not include laws which generally prohibit the carrying of concealed weaponseven though such laws may be construed to prohibit carrying concealed weapons in a motorvehicle, particularly if the weapon is within reach of occupants of the car. States withincategory 2 (carrying) usually prohibit the carrying of handguns on the person and in a motorvehicle.
Generally, state and city laws within the first three categories of Table I exempt law-enforcement officers, military personnel, private guards and persons carrying firearms attheir home or place of business. See. e.g., CAL. PENAL CODE §§ 12026-27 (%Vest 1956); NewYork is the only state which requires a license to possess a handgun in the home or place ofbusiness. N.Y. PENAL LAW §§ 265.05(3), 400.00(2) (McKinney 1967).
(Vol. 1969: 647
HANDGUN REGULATION
some states within the first sub-category, licenses to carry handgunsare issued to all persons with the exception of felons, addicts, andminors. Other states have requirements that the applicant be of"good moral character";5 t or that he show a need to carry theweapon 32 The issuing authority is usually a law-enforcementofficial, such as the chief of police 3
Category 4, special prohibitions, lists five types of personsagainst whom additional restrictions are frequently imposed: felons,addicts, alcoholics, the mentally ill and minors. 4 These restrictionsusually prohibit transfers of handguns to, and ownership orpossession by such persons.
Dealer licensing, the fifth category, refers to the requirementthat firearms dealers be licensed? Most of the statutes fallingwithin this category impose licensing qualifications based ongood character, age and a permanent business location, 7 and thus
"See. e.g., CAL. PENAL CODE §§ 12021, 12050, & 12072 (West 1956) (license tocarry may be issued to person of good moral character, but restrictions as to minors, addictsand felons); CONN. GEN. STAT. ANN. § 29-29 (1960) (no permit shall be issued if theapplicant has ever been convicted of a felony); IOwA CODE ANN. § 695.26 (Supp. 1968)(sale to minors forbidden).
3t See. e.g.. CAL. PENAL CODE § 12050 (fVest 1956); ME. REV. STAT. ANN. tit. 25, § 2031(Supp. 1967); N.Y. PENAL LAW § 400.00 (McKinney 1967).
"See. e.g.. VAsH. REV. CODE ANN. § 9.41.070 (1961) (for purposes of protection, orwhile engaged in business, sport or while traveling).
"See. e.g., IOWA CODE ANN. § 695.20 (1950); WASH. REV. CoDE ANN. § 9.41.070(1961).
31 Minors, as defined by the various states, range from persons under fourteen to personsunder twenty-one. Also, some states exclude from the law's prohibitions minors withparental consent to purchase and possess firearms. Certain states limit restrictions againstfelons to persons who were convicted of crimes of violence within a specified time;restrictions against addicts to persons convicted under narcotics laws; restrictions againstalcoholics to persons under the influence of alcohol; and restrictions against the mentally ill topersons committed for mental disorder. Other states either do not define these terms or usebroader definitions. See generally Note, Firearms: Problems of Control, 80 HARV. L. REv.1328 (1967).
A state is within a sub-category of category 4 (Table I) if it requires a license topurchase handguns and prohibits the issuance of such a license to persons covered by the sub-category. A state is not included within a sub-category of category 4, however, if it onlyprohibits persons within the sub-category from receiving a license to carry handguns.
"See CAL. PENAL CODE §§ 12021, 12072 (\Vest 1956)." See, e.g., N.Y. PENAL LAW § 400.00(t) & (2) (McKinney 1967). A South Carolina law
repealed in 1965 prohibited the sale but not the possession of handguns within the state.Since South Carolina was the only state to prohibit sales, Table I does not have a separatecategory to cover this type of restriction. Since category 5 appeared to be the mostappropriate category, South Carolina was included therein.
r, See N.Y. PENAL LAW § 400.00(1) (McKinney 1967).
Vol. 1969: 6417]
DUKE LA W JOURNAL
contain more restrictions than were imposed under the FederalFirearms Act.8 Under this Act dealer licenses were granted toanyone submitting a one dollar fee with an application stating thathe was not a felon?
Under category 6, record keeping, are listed the states requiringthe maintenance of records of handgun sales. Sub-category (a) liststhose states which require the dealer to keep such records,"0 and sub-category (b) lists those states which require the dealer to file informa-tion concerning his handgun sales with governmental officials-usually a local law enforcement agency4 The required recordsusually include the name and address of the purchaser, the date ofthe purchase and the description of the handgun, including its serialnumber.
Category 7, waiting period, refers to a prohibition against thedelivery of handguns for a specified time period after an applicationfor purchase has been filed with the dealer. Listed in sub-category(a) are those states which impose any waiting period, the durationof which usually varies between one and fifteen days.A2 Listed in sub-category (b) are those states having waiting periods which requirethe dealer to notify a law enforcement official of the application forpurchase prior to delivery of the handgun4
The final category lists a requirement that the purchaser of ahandgun obtain a license!' Such licenses are usually issued by locallaw enforcement officers 5 and persons are excluded from obtaininglicenses for a wide variety of reasons.46 In several jurisdictions, 7 law
See note 9 supra and accompanying text.Hearings Before the Subconun. to Investigate Juvenile Delinquency of the Senate
Conm. on the Judiciar., 88th Cong., Ist Sess., pt. 14, 3209-10, 3426 (1963).' See. e.g., ILL. Av,4. STAT. ch. 38, § 24-4 (Smith-Hurd 1964); N.C. GE.. STAT. § 14-
406 (1953).='See. e.g., IOWA CODE ANN. § 695.21 (1950).
SSee, e.g.. CONN. GEN. STAT. ANN. § 29-33 (Supp. 1969) (one week waiting periodfollowing mailing of application for purchase); ORE. REV. STAT. § 166A70 (1965) (firearmshall not be delivered to purchaser on the day of the application for its purchase).
nSee. e.g., WASH. REV. CODE ANN. § 9.41.070 (1961)."See. e.g., N.Y. PE AL LAW § 400.00 (McKinney 1967); N.C. GEN. STAT. § 14-402
(Supp. 1967).'!See, e.g., N.C. GE\. STAT. § 14-403 (Supp. 1967).
For an example of a statute which is very specific as to who may obtain a license topurchase, see N.J. STAT. ANN. §§ 2A:151-33 to 2A:151-39 (Supp. 1968). For a more"general" statute, see N.C. GEN. STAT. §§ 14-402, 14-404 (Supp. 1967).
47See. e.g., N.J. STAT. ANN. § 2A:151-36 (Supp. 1968).
[Vol. 1969: 647

HANDGUN REGULATION
enforcement officials have only a limited time to investigate theapplicant.
Having categorized the gun control regulations, the next stepwas to quantify gun control legislation by assigning weights to each ofthe eight categories and summing the weights applicable to each stateor city. Such a weighting procedure was necessary to permit theapplication of the multiple linear regression data-analysis techniqueS-the method used to analyze the differences in death and crime ratesamong the states and cities. Since some knowledge of multiplelinear regression is essential to an understanding of the method ofassigning numerical weights to the eight categories as well as to aninterpretation of results, a brief description of the technique ispresented at this time.
Description of Data Analysis Technique
Statistical methodology. The basic hypothesis of this study isthat the variable of interest (e.g., the homicide rate) is a linearfunction of the selected independent variables (e.g., gun controlindex, income, population density) and a random error term.That is,
i Bo + Blii + B2X2i + BkXki + Ui i-l,2,...,n
where
Y. value of the dependent variable (e.g.., homicide rate)for the ith city or state;
EXliX2i,. .. ,' X = set of values of the k independent
variables (gun control index, etc.) for the ithcity or state;
[B 0 ,Bl,... ,Bk ) = set of unknown coefficients which we wish
to estimate;
U. = random error term for the ith city or state. Thisincludes both truly random (not related to the independent
variables) variation and the effect of any omittedvariables; and
For a description or multiple linear regression, see J. JOHNSTON. ECONOMETRICMETHODS 106-42 (1960).
Vol. 1969: 647]

658 DUKE LA W JOURNAL [Vol. 1969: 647
n = sample size (the number of states or cities in thesample).
The unknown coefficients, [Bo,B1 ,... ,Bk], are estimated by the method
of least squares. That is, that set of estimates is chosen,
02o,1,...,k],which makes the sum of squared errors,
n n nY.Y-#) -B -BX .-BX -k~i3.~ *X_ 1 1 1 0 o li 2X2i-.k' i)i1 i=J. i1l
as small as possible.49
The estimated total variance of Y is defined as
2 n 2n
S= (Y-Y) 2/(n-1) where Y Y. /n.Y =
The estimated unexplained variance is S2 = i U/(n-k-l). Therefore,u i1l2 2u is the fraction of the total variance of Y not explained by the
regression.
An estimate of the uncertainty associated with a particularestimated coefficient may be obtained by computing the ratio of theestimated coefficient to the square root of its estimated variance.From this ratio the probability of sign error (assuming the errorsare normally and independently distributed), which is theprobability that the true coefficient is negative (positive) if theestimated coefficient is positive (negative), is computedYP A relatedmeasure, the 95% confidence interval, is also reported. In non-statistical terms, there is a 95% probability that the true co-efficient falls within this interval.
In addition to information about the individual coefficients, a
4, id. at 108-09.1"Probability of sign error" is not the conventional interpretation of the numbers
given here. They are usually termed "levels of significance," and the interpretation of themis somewhat different. The terminology used herein results from a Bayesian approach to theregression problem in which the parameters are considered random variables. The priordistributions which the authors have implicitly used here are locally uniform probabilitymeasures.

HANDGUN REGULATION
measure of the overall adequacy of the assumed relationship isdesirable. This is provided by
= _
u y
which measures the fractiofi of the variance of Y "explained" by theregressionP1
Quantifying gun control legislation. One may have someintuitive feelings about the relative effectiveness of the variouscategories of gun control regulations listed in Table 1. Sinceopinions of this subject may vary substantially, however, numericalweights should be assigned to these categories on some basis morereliable than intuition. In the present study approximately thirty setsof weights were selected which displayed great variation in therelative importance of the eight different categories. For each deathand crime rate thirty regressions were then computed. Since otherexplanatory variables were held constant for all thirty regressions,the only difference among the regressions was that each had a differ-ent index for gun control as an explanatory variable.
For a given death or crime rate the best index would be thatwhich yielded the maximum value of K2, or, equivalently, thesmallest probability of sign error in the estimated gun controlcoefficient. This index explains the greatest amount of variation inthe death or crime rate, having accounted for other explanatoryvariables.
Selection of the set of weights in this manner does not bias theresults either in favor or against gun control. It simply choosesthose weights which have the highest probability of measuring thetrue relative effects of various gun control laws, whether those trueeffects be positive, negative or null. For example, suppose thatlicense to purchase legislation were twice as effective in reducinghomicides as concealed weapons legislation. This would mean thatpart of the variation in homicide rates among the states is due tosome states having none, some one, and some both of these laws.Our objective is to account for the homicide variation among thestates and cities and, of course, the highest percentage of thevariation will be explained by the set of weights that exactly
51 The number is R! adjusted for degrees of freedom. See A. GOLDBI-RGER. |:CONOM-rRICTHEORY 217 (1964).
Vol. 1969: 647]
DUKE LAW JOURNAL
matches the true cause of the variation. Reasoning backwards, thismeans that the index with the highest R2 is most likely to becomposed of the set of weights that most closely matches the truerelative effect.
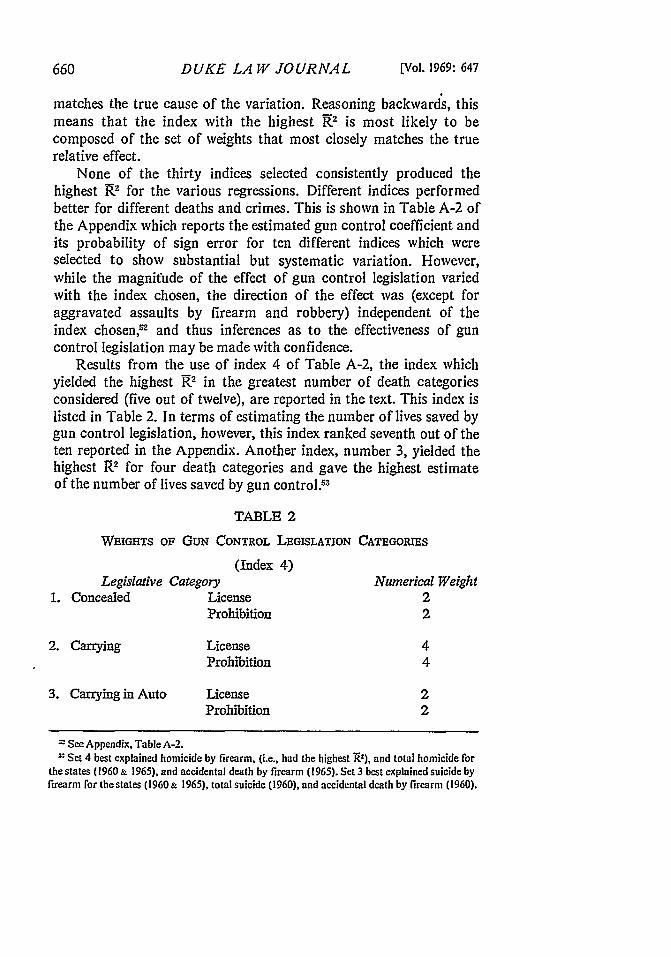
None of the thirty indices selected consistently produced thehighest R2 for the various regressions. Different indices performedbetter for different deaths and crimes. This is shown in Table A-2 ofthe Appendix which reports the estimated gun control coefficient andits probability of sign error for ten different indices which wereselected to show substantial but systematic variation. However,while the magnitude of the effect of gun control legislation variedwith the index chosen, the direction of the effect was (except foraggravated assaults by firearm and robbery) independent of theindex chosen,52 and thus inferences as to the effectiveness of guncontrol legislation may be made with confidence.
Results from the use of index 4 of Table A-2, the index whichyielded the highest R 2 in the greatest number of death categoriesconsidered (five out of twelve), are reported in the text. This index islisted in Table 2. In terms of estimating the number of lives saved bygun control legislation, however, this index ranked seventh out of theten reported in the Appendix. Another index, number 3, yielded thehighest R2 for four death categories and gave the highest estimateof the number of lives saved by gun control? 3
TABLE 2
WEIGHTS OF GuN CONTROL LEGISLATION CATEGORIES
(Index 4)Legislative Category Numerical Weight
1. Concealed License 2Prohibition 2
2. Carrying License 4Prohibition 4
3. Carrying in Auto License 2Prohibition 2
See Appendix, Table A-2.Set 4 best explained homicide by firearm, (i.e., had the highest R2), and total homicide for
the states (1960 & 1965), and accidental death by firearm (1965). Set 3 best explained suicide byfirearm for thestates (1960& 1965), total suicide (1960), and accidental death by firearm (1960).
[Vol. 1969: 647

HANDGUN REGULATION
4. Special Prohibitions Minors 1Felons 1Addicts 1Alcoholics 1Mentally I"1 1
5. Dealer Licensing 8
6. Record Keeping By Dealers 8By Government Agency 4
7. Waiting Period Time 1Notice 2
8. License to Purchase 8
The text also reports the effects of other explanatory variableson death and crime rates. These coefficients do not varysubstantially with different gun control indices.
RESULTS OF THE STUDY5 4
Results of the study are stated in terms of estimated coefficientswhich set forth the relationship between the various independentvariables and the death and crime rates. Each coefficient indicates theestimated extent to which a one unit increment in an independentvariable (e.g., gun control) will affect the dependent variable (adeath or crime rate).
There is some uncertainty associated with the value of theestimated coefficient. As previously indicated, two measures wereutilized to determine the degree of uncertainty: the 95% confidenceinterval and the probability of sign error 5-
Homicide
The relationship between gun control and homicide by firearmand total homicide rates in the states and cities for 1960 and 1965
51 The material appearing in the Results section are based upon the use of the set orweights for the various categories of gun control legislation listed in Table 2 (index 4).
The 95% confidence interval is the range within which there is a .95 probability that thetrue coefficient will lie. The probability of sign error, as previously indicated, reflects thechance that the sign of the estimated coefficient is incorrect.
Vol. 1969: 647]

DUKE LA W JOURNAL
is given in Table 325 The data in Table 3, presented in terms of theeffect which a one unit increment in gun control will have onhomicide rates, indicate that gun control probably has a negativeeffect on homicide by firearm and total homicide rates. In all fivesets of equations the estimated gun control coefficient is negativeand in only one case is there more than a fifteen percent chancethat the coefficient's sign is Iiositive (see total homicide rate for"States- 1965"- Probability of Sign Error).
TABLE 3
EFFECT OF GUN CONTROL ON HOMICIDE
Homicide Rate 95% Confidence Probability(Deaths/million/year) Coefficient Interval of sign error
By FirearmStates--1960 -. 176 -. 464 to .113 .113States-1965 -. 228 -. 518 to .0623 .0602
TotalStates-1960 -. 228 - .647 to .191 .140States-1965 -. 0951 -. 479 to .289 .310Cities-1960 -. 261 -. 758 to .237 .151
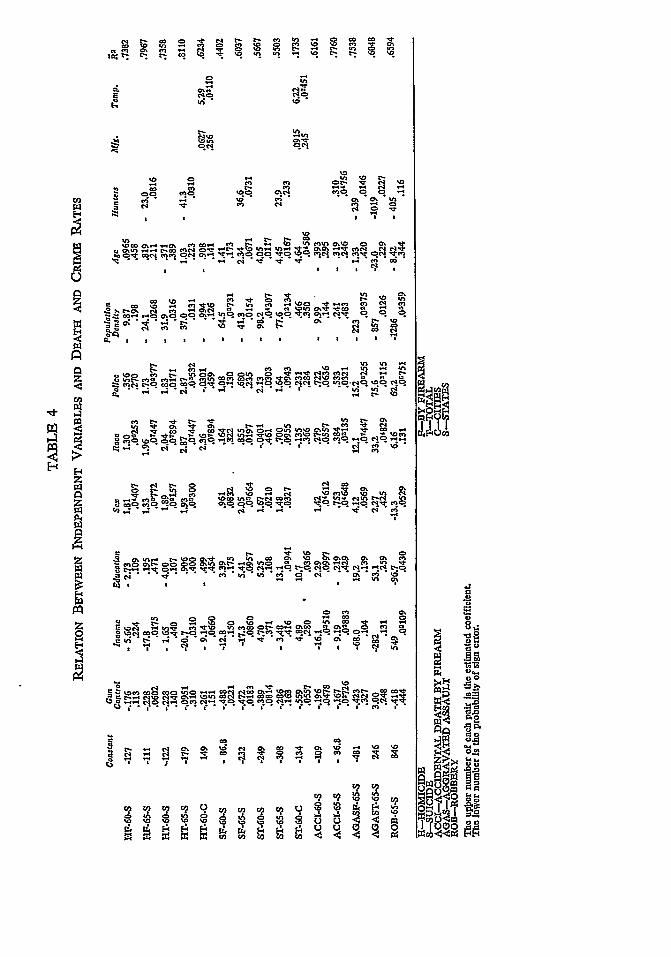
Table 4 presents the relationship of each of the independentvariables to the death and crime rates. The results in Table 4 showthat median income and population density are negatively related tohomicides by firearm and total homicides; that the percentage ofmales, the number of police employees and the percentage of non-whites have strong positive relationships with homicide rates; andthat the correlation between education and homicide was negative in1960 and positive in 1965.
36 All relationships reported in this study are conditional because the effects of otherdemographic variables are taken into account.
[Vol. 1969: 647
W ~ ~ ~ r cn -V-(~0 0 0 ) ' 5 -mm Os m %qt CA 3 S 5 . 5 n 5
E-4n
050 aN %%DCON 'tc. M : P -t n n o c.- rC,1, 0
"R. c!- s ' -
m ~ r InC r o j
c" 05N C505 0 - '4 N '%O(D~O MT0 M8 0* -. m m '-o )
ci %O '3
% n .00 'w z5 s o C0Cn v M n , m T wV~~ ~~~ 0 4 0Cmc~ o
z co M5 " 55
.3 ~ ~ %0 5- .n5 s sO 5g) In
N0 1- CD
'n t C ') Sn 0
t. CDo- 5 0 ' - S 4 S
to -- 5.
~~oi
ta' l scog ' 00 0 ;;C) s-%50 00 s- 4,M;3; %ot mg '3c c
zW u NR1-1 5-8 N 'Zl Os-R R 0F1 C R 5
' 30 to055cSa'30Sn -N505 N S~N~ MN S
'-S ~ 5 N 05 .3. (4en
RW08
V0 0? r9s "S a
%9 t %0 %a '3 0. '3) 61A3 0 n w~. sc
7000
'30550~500SnO-55 *'"30 5-'3~'305. .- *4

DUKE LA W JOURNAL
SuicideTable 5 reports the relationship between gun control and suicide
by firearm and total suicide rates. For all five equations the sign ofthe estimated gun control coefficient is negative, significant andsizeable. For four of the five equations there is a less than ten percentprobability that the sign is incorrect. In comparison with the resultsfor total homicide, there is a much greater probability that the guncontrol coefficient of total suicide is negative and of a greatermagnitude-the estimated gun control coefficients of total suicideare approximately twice as large.
TABLE 5
EFFECT OF GUN CONTROL ON SUICIDE
Suicide Rate 95% Confidence Probability(Deaths/million/year) Coefficient Interval of sign error
By FirearmStates-1960 -. 488 - .962 to -'.0132 .0221States-1965 -. 472 - .913 to -. 0309 .0183
TotalStates-1960 -. 389 - .940 to .163 .0814States-1965 -. 286 - .866 to .295 .163Cities-1960 -. 559 - 1.25 to .131 .0557
Under the heading Suicide-by-Firearm (SF) in Table 4, it canbe seen that the number of years of school completed, median age,the number of licensed hunters, average temperature and thepercentage of males have strong positive relations with suicides byfirearm while population density has a strong negative relation.There is also an indication that median income is negatively relatedto suicides by firearm but not to total suicides.
Accidental Deaths by Firearm
Table 6, which shows the relationship between accidental deathsby firearm and gun control, indicates that the estimated gun controlcoefficients of accidental death by firearm are as significant (interms of confidence interval and probability of sign error) as thesuicide coefficients but only about the size of the homicide coefficients.
(Vol. 1969: 647

HANDGUN REGULATION
TABLE 6
EFFECT OF GUN CONTROL ON ACCIDENTAL DEATH BY FmEARm
Accidental Death Rate 95% Confidence Probability(Deaths/millionlyear) Coefficient Interval of sign error
States-1960 -. 196 -. 429 to .0361 .0478States-1965 -. 167 -. 299 to -. 0349 .0072
The relationship between accidental deaths by firearm and othervariables as shown in Table 4 indicates that the only significantnegative factor is income. Significant positive factors include thepercentage of males, the percentage of non-whites, the number ofpolice employees and the number of licensed hunters.
Aggravated Assaults
In Table 7 the relationship between gun control and aggravatedassault is presented. There is a 67% probability that gun control isassociated with a lower number of aggravated assaults by firearm(since the probability of sign error is .327), and about a 75% proba-bility that gun control is related to a higher total of aggravated as-saults (probability of sign error is less than .25).
Table 4 indicates that low income, a high percentage of non-whites, a high number of police employees, lower population densityand fewer licensed hunters are associated with a higher number ofaggravated assaults.
TABLE 7
EFFECT OF GUN CONTROL ON AGGRAVATED AssAUILT
Aggravated Assault Rate 95% Confidence Probability(Assaults/million/year) Coefficient Interval of sign error
States-1965By Firearm - .423 -2.32 to 1.47 .327
Total 3.00 - 5.82 to 11.8 .248
Robbery
The relation between robbery and gun control is set out inTable 8. The estimated gun control coefficient indicates that oneunit of gun control will reduce the total number of robberies by less
Vol. 1969: 6471

DUKE LA W JOURNAL
than one half robbery per million population per year (or about100 fewer robberies per year in the U.S.) and that there is only a56% chance that the coefficient's sign is correct.
TABLE 8
EFFECT OF GUN CONTROL ON ROBBERY
Robbery Rate 95% Confidence Probability(Robberies/nzillion/year) Coefficient Interval of sign error
States-1965 -. 418 - 6.38 to 5.55 .444
Returning to Table 4, robbery is shown to be negatively related toeducation, population density, licensed hunters and the percentageof males; and positively related to income, the number of policeemployees and the percentage of non-whites.
Observations
The following observations may be drawn from the datapresented in the previous section.
One: The data indicate that gun control legislation is related tofewer total deaths by homicide, suicide and accident by firearm. Theestimated gun control coefficient is negative in the five homicideequations, the five suicide equations and both accidental death byfirearm equations. Moreover, in seven of these twelve equations theprobability of error is less than ten percent and in only one of theequations does it exceed seventeen percent (total homicides-States- 1965-31.0%).
The estimated gun control coefficients of total homicide, totalsuicide and accidental death by firearm for the states in 1960 were-.228, -.389 and -.196, respectively; and for the states in 1965 were-.095, -.286 and -. 167, respectively. On the basis of these results it isestimated that one unit of gun control saves between .548 and .813lives per million population per year. Thus it can be estimated thatthe gun control legislation of New Jersey (39 units) saves between21 and 32 lives per million population per year. On a nationwidebasis such legislation would save between 4200 and 6400 lives peryear57
SThe estimates on lives saved include lives already saved by existing gun controllegislation. In 1965 in the United States there were approximately, per 100,000 population.
[Vol. 1969: 647

HANDGUN REGULATION
The average index value (simple arithmetic mean) of gun controlfor the states in 1965, using the weights contained in Table 2, was17.5. If all 28 states whose indices were below 17.5 were brought up tothat number, an estimate based on the results of this study wouldindicate that about 505 fewer lives per year would be lost due tohomicide, suicide and accidental death by firearm in those states.Furthermore, if all states were raised to the 39-units level of NewJersey, about 1950 lives would be saved.
Two: A comparison of the results of the homicide and suicideby firearm rates with the total homicide and suicide rates providesan indication of the extent to which gun control legislation leads tothe successful substitution of other weapons5 The similarity of theestimated gun control coefficients of homicide by firearm and totalhomicide for 1960 (-.176 and -.228) and of suicide by firearm andtotal suicide for 1960 (-.488 and -.389) would support a conclusionthat other weapons are not successful substitutes for firearms. How-ever, the differences between the estimated gun control coefficientsof homicide by firearm and total homicide for 1965 (-.228 and -.0951)and of suicide by firearm and total suicide for 1965 (-.472 and -.286),would lead one to believe that other weapons are frequently and suc-cessfully substituted for firearms.
The results showing a 75% probability that the gun controlcoefficient of total aggravated assaults is positive give someindication that more stringent gun control laws tend to cause theuse of less effective weapons rather than to discourage homicideattempts. One explanation for the positive relation is that theadditional aggravated assaults which occur in stringent gun controlstates are homicide attempts which are unsuccessful as a result ofthe use of less lethal substitutes. This explanation, however, can onlyaccount for part of the large (3.00) gun control coefficient for totalaggravated assaults.
Another explanation for the positive relation is that the felonarmed with a gun, assuming that he is responsible for a significantportion of the aggravated assaults, has less need to use force to
3.05 homicides by firearm, 5.5 total homicides, 5.02 suicides by firearm, 1 1.1 total suicides,and 1.2 accidental deaths by firearm. See 1967 STATISTICAL ABSTRACT OF THE UNITEDSTATES 59, 168 (U.S. Dep't of Commerce).
-' In Zimring, Is Gun Control Likely to Reduce Violent Killings? 35 U. CHI. L. REV. 721(1968), the author describes a study measuring the etTectivenesk of substituted veapons basedon data from reported homicides and serious assaults.
Vol. 1969: 647]
DUKE LAW JOURNAL
obtain the victim's cooperation and to effect his get-away and thatin stringent gun control states the hardened criminal is less likely tobe armed with a gun and hence more likely to use force. 9
Three:. The evidence indicates that gun control has little effecton "ordinary" crime. As mentioned previously, there is a positiveestimated relation between total aggravated assaults and guncontrol; and while for robbery the estimated gun control coefficientis negative (-.418), there is a forty-four percent chance that thecoefficient's sign is incorrect. Moreover, even if the estimatedcoefficient is correct, the enactment of strict gun control legislationwill not substantially reduce the robbery rate which exceeded sixhundred robberies per million population for the nation in 1965.
Four: Results for other variables show that with the exceptionof robbery and total suicide, there is a negative correlation betweenincome and the death and crime rates considered by this study; thateducation as measured by median school years completed is animportant factor only for suicides (positive correlation) and robbery(negative correlation); that with the exception of robbery therelation between the percentage of males and the death and crimerates is trongly positive; that with the exception of suicide- 1960,there is a strong positive relation between the percent of non-whitesand the death and crime rates; that the relation between populationdensity and the death and crime rates is strongly negative; and thatthe relation between the number of police personnel per capita andthe death and crime rates is generally positive.6°
LIMITATIONS
One: As previously indicated, certain types of state and localgun control legislation were not considered; the comparisonbetween the states did not take into account the additional gunregulations of local governments within the state; and the guncontrol categories of Table 1 contain within the same category laws
51 A third explanation for the direct relationship between gun control and aggravatedassaults is that stringent regulation of weapons increases crime by reducing the number ofpersons possessing firearms for protection. However, the findings on robbery (see Table 8and the textual discussion appurtenant thereto) are not consistent with such an explanation.
6Significant positive coefficients for the number of police personnel is not necessarilyindicative of a causal relationship. Another explanation is that states and cities with highdeath and crime rates employ more police personnel in an attempt to reduce these rates, butthat such additions to police forces are not significantly effective.
[Vol. 1969: 647

HANDGUN REGULATION
which differ to some extent. Since the evidence derived from thisstudy indicates that additional gun control reduces the number ofdeaths, this has probably caused the effects of gun controllegislation to be understated.
Two: The data used by this study do not account for differencesin the enforcement policies of the different states and cities and forinaccurate reporting of deaths and crimes.
Three: The coefficients of certain demographic variables maynot indicate a causal relation. The ecology of crime is morecomplex than this study's simple equations portray. The relationbetween the number of police personnel per capita and the death andcrime rates illustrates this point.
Also, it is possible that important explanatory variables havebeen omitted. Two that are frequently mentioned in FBI reports arethe number of transient residents and the penalty ordinarilyimposed for the crime committed. Others that may be importantinclude regional differences in attitudes towards firearms, regionalreligious differences, differences in levels of frustration anddifferences in racial attitudes.61
Four: Since as of 1965 no state or city had totally prohibitedthe sale and possession of hand guns or imposed strict regulationson the sale and possession of rifles, the study tells little about theeffectiveness of such types of gun control regulation. On the basisof this study's findings that additional controls, meaning increasedunits of gun control, reduce the homicide, suicide and accidentaldeath by firearms rates, it would be expected that more stringentgun control, such as the regulation of rifles and the totalprohibition of sale and possession of hand guns, would lower thesedeath rates-but to what extent it cannot be said.
Also, this study does not indicate whether more stringent typesof gun control would reduce "ordinary" crime. Perhaps measures
61 In a separate tabulation, a dummy variable for the eleven states which formed theConfederacy was included. Results obtained indicated that homicides and aggravated assaultrates are positively related to these eleven states; that accidental death by firearm isnegatively related to these states; and that robbery and suicide are unrelated to these states.
These results do not weaken the conclusions of this paper concerning the effectiveness ofgun control because the stringency of gun control legislation in the eleven Confederate states
and in the remaining states is not dissimilar. The mean index value of gun control legislationfor the fifty states based upon the set of weights reported in the text was 17.5. Incomparison, for the eleven Confederate states the mean index value was 14.2, and for theseven Confederate states with the highest homicide rate the mean index value was 16.6.
Vol. 1969: 647]
DUKE LA W JOURNAL
such as prohibitions against the manufacture, sale and possessionof all or certain types of firearms would disarm the professionalcriminal, and perhaps the disarmed professional criminal would bemore hesitant to engage in criminal activity.
Five: While this study concludes that increases in the units ofgun control decrease rates of homicide, suicide and accidental deathby firearm, it does not show whether all unit increases in theamount of gun control are equally effective. It may be that theextent of the effectiveness of an increased unit of gun control isrelated to the amount of gun control which already exists withinthe state or city, or that certain types of gun control are effectiveonly if other types of gun control are also enacted.
Six: The percentage of explained variation (R2) in the death andcrime rates was very similar for index weights that differedconsiderably from the weights listed in Table 2. Thus uncertaintyremains as to the relative importance of the different types of laws,
CONCLUSION
The finding of the present study that gun control legislationreduces the number of deaths by homicide, suicide and accidents byfirearm is inconsistent with three related research papers by Alan S.Krug which have received important circulation. Each of Krug'spapers has been introduced into the Congressional Record, and thepapers are presently being circulated in pamphlet form by theNational Shooting Sports Foundation under the billing of "thefirst comprehensive study on a national basis ever made on therelationship of firearms to crime in the United States. 6 2
Each of Krug's papers claims to discredit the position that guncontrol legislation reduces crime. In his first paper, Krug reports thatthe homicide by firearm rate has shown a decided downward trendfrom 1910 to 1967 while gun ownership has steadily risen. 3 In asecond paper a simple comparison is developed which shows nosignificant differences between the crime rates of states with andstates without firearm licensing laws 4 The third paper reports a
a THE TRUE FACTS ON FIREARM LEGISLATION-THREE STATISTICAL STUDIES (NationalShooting Sports Foundation, Inc., 1968), 114 CONG. REC. H570 (Jan. 30, 1968) [hereinaftercited as TRUE FACTS]. See Zimring, Games with Guns and Statistics, 1968 Wis. L. REv.1113.
Krug, The Misuse of Firearms in Crime, in TRUE FACTS." Krug, The Relationship Between Firearms Licensing Lawss and Crime Rates, in TRUE
FACTS.
[Vol. 1969: 647

HANDGUN REGULATION
negative correlation between firearm ownership, as measured by thenumber of hunting licenses, and various crime rates for the fiftystates.05
Krug's second study is of primary interest here since it, like thepresent study, compares differences in crime rates among stateswith differences in gun control legislation. In this paper, Krug firstplaces the states into two groups: licensing and non-licensing states.Next, using 1965 data, Krug calculates average (arithmetic mean)homicide, robbery, aggravated assault and serious crime rates forlicensing and non-licensing states and finds that the averagehomicide, aggravated assault and serious crime rates for licensingstates exceeded the non-licensing states' average.
As a vehiicle for discrediting gun control legislation, this studyby Krug has several major deficiencies. First, the only death rateit considered was the homicide rate by firearm, and, as Krug admitsin another section of the same study, this accounts for less than one-third of the nation's deaths by firearm. 6 Thus the conclusion thatlicensing has no effect on the homicide rate does not discredit aposition that licensing reduces death by firearm.
Second, by using only two groupings for the fifty states and byexamining only licensing requirements, the True Facts study failedto account for differences in state licensing requirements or otherstatutory controls over firearms. Moreover, by including within thelicensing group any state which prohibits carrying firearms withouta license, the licensing category included many states with weakgun control legislation. The legislation of six of the thirty-six statesKrug included as licensing states had an index value of seven or lesson the basis of the criteria used in the present study, while four ofthe fourteen states included as non-licensing states had an indexvalue of seven or more.
Finally, although Krug recognized that factors such aspopulation density, geography, per capita income and educationappear to be significantly related to crime rates, these factors werecompletely neglected in his "statistical study." Thus, for thesereasons it is submitted that the evidence presented.in this studyinvalidates conclusions concerning death rates presented in theseearlier papers.
11 Krug. The Relationship Between Firearms Ownership and C'rinte Rates: .A Statistical
Analysis, in TRUE FACTS.
" See note 57 supra.
Vol. 1969: 647]

DUKE LAW JOURNAL
Krug's other studies conclude that there is no relationshipbetween the number of firearms and crime rates. These conclusionsare of dubious merit for the reasons stated in an in-depth analysis ofthe Krug studies by Franklin E. Zimring. 7 Professor Zimringcriticizes the first study, which examines the homicide by firearm andgun ownership trends, because (a) Krug's assertion that the homicideby firearm rate has shown a decided downward trend is questionable;(b) Krug failed to establish that per capita gun ownership isrising-he asserted only that the number of guns owned is rising;and (c) Krug's findings, even if accurate, do not preclude thepossibility that stringent gun control legislation would have furtherreduced the homicide by firearm rate. Krug's third study, whichfinds a negative correlation between gun ownership and variouscrime rates for the fifty states, is criticized by Zimring for the useof hunting licenses as a measure of firearm ownership. Zimringasserts that hunting is not the major use of firearms in many areasof the nation or the major use of handguns, the weapons mostfrequently used in crime.
Nevertheless, even if Krug's conclusion that there is norelationship between the number of guns and crime rates should becorrect, this in itself does not establish that gun control laws areineffective. Most firearm legislation, according to its proponents, isnot aimed at and does not prevent the law-abiding citizen fromacquiring firearms. Rather, the legislation's purpose and effect is tokeep guns out of the hands of minors and irresponsible adults.
This article has made no attempt to explain why gun controllegislation reduces the number of deaths by firearm. To the authors'knowledge there is no reliable data on gun ownership, and hence it isnot possible to agree with or dispute the thesis that there is no rela-tionship between the number of guns and the death and crime rates.The findings here do indicate, however, that gun control legislation ismost effective in reducing the number of suicides and accidents byfirearm, less effective in reducing the number of homicides andgenerally ineffective in reducing the number of other crimes-all ofwhich suggests that stringent gun control legislation reduces thenumber of persons possessing firearms. It seems likely that a highpercentage of suicides, accidents by firearm and homicides arecommitted by adults who have never been convicted of a crime,
6, Zimring, Games ith GunsandStatistics, 1968 Wis. L. REv. 1113.
(Vol. 1969: 647

HANDGUN REGULATION
adjudged mentally incompetent, or designated an addict oralcoholic.68 Thus the most plausible explanation for the effectivenessof gun control in reducing these death rates is that the percentageof adults who could lawfully obtain firearms is reduced by stringentgun control legislation.
The concern of this study is with the effectiveness of gun controllegislation. On this point evidence is presented that stringent guncontrol legislation reduces death by homicide, suicide and accidentsby firearm. For each of ten varying sets of weights reported in theAppendix, the gun control coefficients of homicide, suicide andaccidental deaths by firearm are negative. Thus the conclusions donot depend upon our choice of weights. The choice of weights does,however, make a difference as to the size of the gun control coeffi-cients. Results based on the ten sets of weights reported in the Appen-dix ranged from 1520 to 3340 additional lives saved if all states wereraised to the level of New Jersey.69 Consequently, there is no doubtthat gun control legislation saves lives but there is a question of howmany lives it saves.
"I During 1965, 797f of all murder victims were acquainted with the offender. Killingsresulting from robberies, sex motives, gangland slayings, and other felonious activitiesaccounted for only 16% of the total of reported homicides. See REPORT BY THE PRESIDENT'S
CoMMISSION ON LAW ENFORCE.MENT AND ADMINISTRATION OF JUSticE. THE CHALLENGE
OF CRI E 1N A FREE SoclETY 39 (1967)."1 The index reported in the text, number 4, ranked seventh out of ten in terms of estimated
total lives saved.
Vol. 1969: 647]

DUKE LA W JOURNAL
APPENDIX
Further Results
As mentioned in the text, we tried ten different sets of weights,each set yielding a different gun control index. These weights aregiven in Table A-I. Table A-2 lists for each index the gun controlcoefficient and the probability of its sign error for each crime or deathrate.
TABLE A-I
WEIGHTS FOR THE TEN GUN CONTROL INDICES
Index
Legislative Category
1. Concealeda. Licenseb. Prohibition
2. Carryinga. Licenseb. Prohibition
3. Carryingin Autoa. Licenseb. Prohibition
4. Special Prohibitionsa. Minorsb. Felonsc. Addictsd. Alcoholicse. Mentally Ill
5. Dealer Licensing
6. Record Keepinga. By Dealerb. By Govt. Agency
7. Waiting Perioda. Timeb. Notice
8. License to Purchase
1 2 3 4* 5 6
2 2 2 2 2 52 2 2 2 2 5
4 4 4 4 4 104 4 4 4 4 10
2 2 2 2 2 52 2 2 2 2 5
7 8 9 10
2 5 5 22 5 5 2
4 10 10 44 10 10 4
2 5 52 5 5
1 1 1 1 1 1 8 1 81 1 1 1 1 1 8 1 81 1 1 1 1 1 6 1 61 1 1 1I 1 6 1 61 1 1 1 1 1 6 1 6
2 2 2 8 8 2 2 8 2
2 2 2 8 8 22 2 2 4 4 2
2 8 22 4 2
1 1 1 1 1 1 1 1 12 2 2 2 2 2 2 2 28 4 12 8 4 8 8 88
*This index was reported in the text.
[Vol. 1969: 647674

%0 ~ C4 tra 0'% in m cn co %n%0 000Cflcf t . C rir r 0 00 C4 7% % tOI - I w 0 - 0- aI 0-" 0
w0-.0 qo 8 t - weq in eq0 0.-4m C 0 t"q C)!4* 4
In 0n 0 l*0
C. .0
ell 0 Cl .-4 ' 0 0t%o xn cn C% c4, IDoo 0 t DC' 0 0 ~ 00 0% "tC'0r
o ~~~~ ~ C% 0*cn. Oq .' oi
t- Co ! 0) q !S- !ta ! lc lC lqclc l4q tC
09 CI'nn* N n0 0
%0 \0 a%4n \ a - \0 t , ao a' 0% aq a4 m \q Z o co%
00
ino% 0'r \' C - 4 0 % l -rlt %0 r- -* -0c qttNa 1 CLo 00 C,% 0 N 0 o-0 DS-00~N~(4 04 ~ .
C-4 cl4
o DC - ( \ ' C*O %0 0 0 i r \0 co C -4~ r-0 v*0lm I
C',
000 0000(4a\I0 0coz nt t' a I a 0 St %n en 00 I~ oo.4 I\ I N %I0MW0n 0
0
0 ca
r-i-en f 0o q00 0 o a'~ r, r o 0".I n C .t clt.A' en
z ~.
C000
W C) 0 ap-
C3~ 0
U CIOji
DUKE LA W JOURNAL
The next to last line of Table A-2 gives the mean value of theindex for states in 1965. Some variation among estimated coeffi-cients is due to changes in this average value.
The probabilities of sign error indicate that some of our conclu-sions, viz., gun control cuts down suicide and accidental death byfirearm rates and has little influence on robbery and aggravatedassault by firearm, would have been reached regardless of the indexchosen. Homicides and total aggravated assaults are a differentmatter. For these crimes, the choice of index can make a considerabledifference in the estimated effect of gun control. In total homicides-states- 1960, for example, all the estimated coefficients are negativebut the probability that the true coefficient is negative ranges from .14(index 4) to .42 (index 6).
We attempted to use variations among indices to make inferencesabout the relative effectiveness of different types of laws. Indexes 4and 5, for example, which weight dealer licensing and record keepingrelatively heavily, generally perform well for homicide. On the otherhand, index 3, which weights license to purchase very heavily, seemsto do well with respect to suicides.
Unfortunately, when we employed more refined techniques in anattempt to isolate the effect of each type of law, we could obtain no
significant or even meaningful results.* This failure may have been dueto multicollinearity among individual law categories (a statisticaldifficulty) or to some circumstance such as interactions of laws whichmake combinations more effective than the sum of effects of individ-ual laws.
Finally, we should mention that standard tests of the regressionmodel were made. We checked the assumption of normal disturbanceterms with chi-square tests and normal probability plots of theresiduals. Linearity assumptions were checked with residual plots.The regression assumptions were well approximated in all cases.
* We tried entering each legislative category as a "dummy variable" and we also split thecategories into blocks and attempted to measure the effect of each block independently.
[Vol. 1969: 647