the effects of price regulations of pharmaceutical industry
TRANSCRIPT
WP 12/18
The effects of price regulations of pharmaceutical
industry margins: structural estimates for anti-ulcer
drugs in France
Pierre Dubois & Laura Lasio
September 2012
york.ac.uk/res/herc/hedgwp

The Effects of Price Regulation on Pharmaceutical Industry
Margins: A Structural Estimation for Anti-ulcer Drugs
Pierre Dubois∗ Laura Lasio†
July 2012‡
Comments Welcome
Abstract
The objective of this paper is to study the effects of price regulation on competition in the
pharmaceutical industry. We provide a method allowing to identify margins in an oligopoly price
competition game even when prices may not be freely chosen by firms. We use our identification
strategy to study the effects of regulatory constraints on prices in the pharmaceutical industry which
is heavily regulated in particular in France. We use data from the US, Germany and France to identify
country specific demand models and then recover price cost margins under the regulated price setting
constraints on the French market. To do so, we estimate a structural model on the market for anti-
ulcer drugs in France that allows us to explore the drivers of demand, to identify whether regulation
really affects margins and prices and to relate regulatory reforms to industry pricing equilibrium.
We provide the first structural estimation of price-cost margins on a regulated market with price
constraints and show how to identify unknown possibly binding constraints thanks to three different
markets (US, German and France) with varying regulatory constraints. The identified margins show
that margins have increased over time in France but that firms were specially constrained in price
setting after 2004.
Key words: empirical IO, regulation, price constraints, pharmacy, antiulcer drugs.
JEL Codes: L10, I18
∗Toulouse School of Economics (GREMAQ, IDEI), [email protected]†Toulouse School of Economics (GREMAQ), [email protected]‡We thank IMS Health for giving us access to the data. We also thank seminar participants at Toulouse, Imperial College
Business School for their comments.
1
1 Introduction
The objective of this paper is to study the effects of price regulation on competition in the pharmaceutical
industry. We provide a method allowing to identify margins in an oligopoly price competition game even
when prices may not be freely chosen by firms. We use our identification strategy to study the effects
of regulatory constraints on prices in the pharmaceutical industry, which is heavily regulated in some
countries, and particularly in France. We use data from the US, Germany and France to identify country
specific demand models and then recover price cost margins under the regulated price setting constraints
on the French market. To do so, we estimate a structural model on the market for anti-ulcer drugs
in France that allows us to explore the drivers of demand, to identify whether regulation really affects
margins and prices and to relate regulatory reforms to industry pricing equilibrium. We provide the first
structural estimation of price-cost margins on a regulated market with price constraints and show how
to identify unknown possibly binding constraints thanks to three different markets (US, German and
France) with varying regulatory constraints. The identification strategy relies on the usual conditions for
identification of a flexible demand model for differentiated products, on the assumptions about the price
competition game played by pharmaceutical firms but specifically on the knowledge that some markets
are not price constrained (here US and Germany) while others may be constrained (France). With such
method, we are able to identify whether the price setting regulation mechanism in France really makes
price constraints binding and by how much. We can evaluate the counterfactual pricing equilibrium and
thus identify changes in prices, demand and spending due to the different regulation along time between
1997 and 2007. With data from 1997 to 2007, we find that being branded and some measure of drug
quality matter for the demand, while there is significant consumer heterogeneity and price elasticity in
demand. The identified margins show that margins have increased over time in France but that firms
were especially constrained in price setting after 2004.
Investigating the actual role exerted by regulatory constraints is of major importance in an industry,
like the pharmaceutical one, where regulation is heavily present. The role played by regulation in limiting
and steering firms’and users’behavior comes from the importance of the good this industry is based on,
health. In order to guarantee the safety of the drugs being manufactured and sold, the process of drug
production is standardized everywhere and is required to go through a series of stages, starting from a
set of rigorous clinical trials and ending with the approval of the new drug by national or international
agencies. In several countries, drugs that are subject to prescription also need to go through price
negotiation and reimbursement decisions by the national health system and private insurances.
This is the case of France, which is a clear example of heavily regulated pharmaceutical market.
Due to rising drug expenditures in the 1990s, French pharmaceutical regulation underwent a process of
reform, which since 2003 has introduced major changes: reference pricing of branded drugs to generics,
campaigns to encourage the use of generics, a system of rigorous prescription rules, a new process of price
negotiation. However, the many measures introduced make the actual result of such a complex set of
regulatory changes diffi cult to evaluate. Different reforms may have changed the shape of the demand
2

for drugs, steering preferences and perceptions of patients and physicians, and affecting pharmaceutical
manufacturers behavior on price setting, on cost reduction, or margin squeezing.
To carry out our analysis, we choose to focus on the anti-ulcer drugs market, one of the leading
therapeutic classes worldwide. Its double-digit growth over time was driven by the presence of several
blockbusters and on fierce competition, based on subsequent innovations and on the coexistence of differ-
ent generations of drugs. Recently, the patent of several of these top-selling drugs expired and generics
started to enter the market, inducing originator companies to accelerate the introduction of new prod-
ucts. Interestingly, some (but not all) drugs in this class were subject to some specific regulatory changes
introduced by the French reform. All of these factors make this class especially suited for analyzing the
effects induced by the reform on the demand and supply for anti-ulcer drugs.
Estimate demand precisely for pharmaceutical products is crucial, due to the implications this has
on a number of issues, such as public health, public expenditures for health-related topics, incentives to
innovate by public and private organizations. However, it is not an easy task and poses several challenges.
First, understanding the factors driving preferences and actual purchase decisions is not straightforward
in a market where the decision maker and the buyer/user do not usually coincide (physician vs. pa-
tient). This feature is stronger for prescription drugs, for which the patient is required to consult with a
physician who decides on the appropriate product. In the economic literature, this fact is often blamed
for the emergence of potential agency problems, with the doctor acting as a double agent (Pauly, 1968;
Hellerstein, 1998), often not being aware of the prices of the products she prescribes (Danzon, 1997).
Sometimes the user is neither the actual decision maker nor the payer of the drug. This happens in those
countries where the health insurance system (either private or public) reimburses at least part of the price
of some pharmaceutical products. This fact, plus the actual absence of a real substitute to drugs, has
traditionally made the demand price-inelastic (Crawford and Shum, 2005), though the advent of generics
may be softening this issue. These peculiarities make demand estimation particularly challenging, since
one needs a flexible model to enhance these peculiarities, but such flexibility must not compromise model
tractability or become too burdensome in terms of data needs.
Similarly, when modeling the supply side, the researcher must account for a number of peculiarities of
this market. First, the cost structure of the firms, mainly represented by fixed costs. This originates from
the long and diffi cult process needed to come up with a finished drug. The huge and risky investments
in research contribute to most of the costs and duration of the process of drug innovation, which is
estimated to take at least 10 years for up to 1 billion USD expenses per successful molecule (DiMasi,
Hansen and Grabowski, 2003). The rest of the costs is made up by intellectual property protection and
by compliance to strict rules in terms of safety standard, clinical trials and regulatory approval process.
An additional challenge in supply estimation is posed by regulation of the pricing of pharmaceuticals,
which makes price setting decisions not entirely under the control of the firm. This mechanism aims at
finding a balance between the need for access to drugs by patients (preventing that the little elasticity
3

of demand is exploited with excessive prices) and the necessity for firms to recoup for the investments
made during the R&D phase through a congruous price.
This work structurally estimates demand and supply for anti-ulcer drugs in France in the period 1997-
2007 and investigates the effects exerted by the regulatory reform, trying to overcome the diffi culties
illustrated above. On the demand side, flexibility and tractability are achieved through a model of
discrete choice for differentiated products which places strong emphasis on consumers’heterogeneity. On
the supply side, we allow firms to be constrained in their price setting decisions by regulation and we
identify unknown possibly binding constraints thanks to three different markets (US, German and France)
with varying regulatory constraints. This allows us to quantify the magnitude of such constraints and to
estimate counterfactuals of prices, margins, savings and welfare. With our approach, we are able to show
how regulation limited the increase in margins after 2004.
This paper is structured as follows. Section 2 briefly illustrates the literature on demand estimation in
the pharmaceutical market, especially focusing on the modeling chosen in each work. Section 3 describes
the market for anti-ulcer drugs in France and explains the major points of the reform; it also presents the
data used. Sections 4 and 5 describe, respectively, the models chosen for demand and supply. Results are
discussed in section 6 and we show counterfactual price equilibrium absent the regulation of price setting
in France. Finally, section 7 concludes.
2 Literature
The first group of contributions relevant for this work explores the role played by regulation in shaping
strategic incentives and behavior on the supply side. For instance, Danzon and Chao (2000) investigate
the effect of regulation of manufacturer prices and retail pharmacy margins on price competition. They
find that generic competition is effective in driving prices down only in regimes with limited regulatory
intervention on prices (namely US, UK, Canada and Germany), while in countries with strict price or
reimbursement rules (France, Italy, and Japan) generic competition is ineffective and may be counter-
productive. More recently, Danzon and Epstein (2008) have emphasized the negative effect exerted by
external referencing on launch timing and pricing of new drugs. Both the long process caused by strict
regulation of the price and the cross-country linkages induced by external referencing create spillover
incentives for a firm not to launch in lower-price referenced countries until a higher price is negotiated
somewhere else. The very recent work by Filson (2012) also focuses on the impact of the introduction
or removal of price controls across countries. By using a dynamic equilibrium model of the pharma-
ceutical industry, parametrized using industry facts, he simulates the effect on the introduction of new
drugs, consumer welfare and firm value in different scenarios, where the US and other non-US countries
would change their approach to price regulation of drugs. Its predictions show that price controls that
fail to compensate firms for the introduction of high-quality drugs result in a significant decrease in the
number of new drugs and in large welfare losses at a global scale. However, abandoning price controls
4

especially hurts domestic consumers and this may explain why many countries still use them, despite
their ineffi ciency.
Another branch of the literature which is interesting for the current analysis investigates the de-
terminants of entry in the pharmaceutical market. For example, Scott-Morton (1999) emphasizes the
importance of firms heterogeneity (defined mainly as differences in effi ciency, specialization and experi-
ence), market size and drug characteristics in driving entry of generic drugs (treating a chronic disease
is especially profitable). Kyle (2006) points out a major role played by the interaction between country-
and firm-specific characteristics in the launch of new products: market profitability, competition level,
experience and specialization of the firm are especially important, with a major advantage from being a
domestic company.
In general, this work refers to the literature that estimates demand for pharmaceuticals. Usually these
contributions show some common characteristics. All of them analyze a specific country-class market,
mainly the US market for anti-ulcer drugs, antidepressants and antibiotics. Despite major differences in
the topic under investigation, the approaches followed in modeling demand are often quite similar, all
aimed at emphasizing product differentiation.
Some contributions estimate demand with a simple log-log specification, in which the log of quantity
is regressed over the log of price and on other variables of interest. The estimated coeffi cients in this
approach are interpretable as elasticities. For instance, this specification is applied by Berndt, Bui, Railey
and Urban (1995) in exploring the role played by different forms of marketing in the US market for H2
anti-ulcer treatments in the period 1977-1994. Their analysis emphasizes the effectiveness of detailing
(the practice of visiting physicians to promote the product) and the role played by price and quality
measures (effi cacy, dosage, interactions, side effects, number of indications) in driving demand. A similar
approach is used by Rizzo (1999) and, more recently, Capella et al. (2009) to explore respectively the
role of detailing in decreasing price elasticity and the limited impact of direct-to-consumer advertising on
price elasticity in five therapeutic classes.
Most works use discrete choice models to estimate demand. Some apply a logit specification. For
instance, Azoulay (2002) uses a logit with instrumental variables for price to show how product market
competition in the H2 subclass in the period 1977-1993 was shaped by advertising efforts and quality
of scientific information. The same model is used in Berndt, Pindyck and Azoulay (2003) to explore
whether consumption externalities were among the success factors of Zantac (the second mover in the H2
anti-ulcer class). Their methodology is quite peculiar and involves three stages to estimate a dynamic
demand model: for the estimation of market shares they use a multinomial logit. A logit is also used by
Crawford and Shum (2005), who show the role played by uncertainty about the effectiveness of a drug
and by experience and learning in the Italian market for prescription anti-ulcer drugs.
Other contributions apply a nested logit model, in order to emphasize product differentiation and
estimate more precisely substitution patterns among drugs sharing common characteristics. The nesting
structure tries to reflect a prescription process in which the physician chooses to prescribe a specific drug
within a class or subclass; lately, at the dispensing phase, the pair pharmacist-patient decides on generic
5

substitution. Donohue and Berndt (2004) especially focus on the prescription phase, to investigate how
direct-to-consumer advertising and detailing affect the choice of antidepressant medications. Ellison,
Cockburn, Griliches and Hausman (1997) model demand and compute elasticity between branded and
generic versions of four antibiotics (cephalosporins). Their nested logit specification has the choice of
the molecule as the top nest and the decision about generic substitution as the bottom nest. They show
how elasticity is higher between generic substitutes than between therapeutic substitutes and how price
sensitivity is higher at the dispensing than at the prescribing stage. Despite using a very similar model,
different findings are reported by Stern (1996) for four therapeutic categories (gout therapies, sedatives,
minor tranquilizers and oral antidiabetics). His results display how branded drugs of the same category
are relatively strong substitutes but are often substantially differentiated from their generic competitors,
though major differences arise across therapeutic classes.
A more recent approach to demand estimation has emphasized the role of consumer heterogeneity
through random coeffi cient logit models. Seminal works in this literature are those by Berry (1994), Berry,
Levinsohn and Pakes (1995), hereafter BLP, and Nevo (2000, 2001). Random coeffi cient logit models, also
called mixed logit, are especially tempting to use due to their ability to emphasize consumer heterogeneity
and provide richer and more plausible substitution patterns than logit and nested logit models. However,
their flexibility comes to the cost of increased computational diffi culty. They have been successfully
applied to estimate the demand for cars (BLP and, more recently, Verboven, 2011), for ready-to-eat
cereals (Nevo, 2000 and 2001), for mineral water (Bonnet and Dubois, 2010), among others. To the
best of our knowledge, this approach has not been used to estimate demand for pharmaceuticals yet.
More recently, the work by Knittel and Metaxoglou (2008) has pointed out some problems with mixed
logit numerical performance and has suggested to use a large number of starting values and different
minimization algorithms. Similarly, Dubé, Fox and Su (2011) have provided an alternative method
to the estimation of these models, by replacing BLP’s nested fixed point algorithm with a constrained
minimization, where the market share condition constraint takes the place of BLP’s contraction mapping.
When modeling the supply side, this work accounts for the role of regulation in limiting and steering
the price setting decisions of the firms. This is reflected in a supply model where firms are not free to
maximize their profit function as in usual oligopolistic models, but are subject to a price cap, which is
unknown: the magnitude of this ceiling and the fact that it is binding or not are allowed to change across
drugs, depending on drug characteristics. To the best of our knowledge, such approach is new to the IO
literature and has never been employed either in the drug pricing literature, or in works studying the role
of regulation in other industries. The very recent paper by Salvo (2010) has followed a similar approach
in the estimation of market power in the Brazilian cement industry. In his work, the constraint is not
imposed by regulation, but it is the threat of entry by foreign producers that poses a ceiling to the price
that domestic competitors can set. Ignoring this constraint leads to biased and inconsistent estimates of
market power, which is always found to be lower than in reality.
6

3 Market, Data and Regulation
3.1 Regulatory Framework In France
The pharmaceutical market in France shares some characteristics with other industrialized countries,
especially with those characterized by heavy regulation. Some French specificities are however noteworthy.
France has historically displayed high levels of pharmaceutical expenses. A reason for it is often found in
a traditionally strong preference, by French patients and physicians, for branded drugs at the detriment
of generic equivalents, considered for long as mere inferior or even unsafe substitutes. Such behavior
was presumably encouraged by a welfare system, covering nearly the whole French population, which
reimburses at least a part of the price of the drugs (the so called ticket modérateur). However, it is
reported that more than 90% of the population has supplementary insurance, which usually covers the
whole price (Nguyen-Kim, Oz, Paris and Sermet, 2005). In addition, the late introduction of generic
substitutability at the pharmacy level (only in 1999) has encouraged the perpetuation of a strongly
branded-oriented system of prescription and purchase. All of these factors are said to be the cause for a
very low demand elasticity to price. Nevertheless, French prices for drugs have remained for long below
the level displayed in other European markets, especially Germany and UK (Nguyen-Kim et al., 2005).
In the early 2000s, the level of pharmaceutical expenses in France doubled with respect to the pre-
vious decade (reaching 30 billion euros in 2004), increasing more rapidly than anywhere else in Europe
(Nguyen-Kim et al., 2005). This situation accelerated the project of a reform of the pharmaceutical
regulatory system, aimed at reducing public expenditures for drugs, which represented a fifth of total
public expenditures on health.
Drug prices in France were historically regulated, but the reform started in 2003 introduced a number
of major changes, partially liberalizing some prices and rationalizing the process for others (especially
hospital prices). The process of drug commercialization starts by obtaining an authorization of market
entry (Autorisation de mise sur le marché, AMM) granted by the Agency for the Safety of Health Products
(Agence française de sécurité sanitaire des produits de santé, AFSSAPS). This step is enough for OTC
drugs and for some prescription drugs, which are immediately available for purchase once the AMM is
granted at a price decided by the producer.
In order to obtain reimbursement by social insurance, two additional steps must be performed. The
first is the evaluation of the reimbursement suitability and level of the drug; the second is the actual price
setting, which is regulated. The final step is the publication in the Journal Offi ciel, after which the drug
can be readily commercialized.
Reimbursable drugs are those included in the so-called positive list and the decision on their suitability
is taken by the Ministry of Health, after considering the advice from the "Transparency Commission".
Evaluation by this Commission, which is part of the High Authority of Health (Haute Autorité de la
Santé, HAS) since August 2004, is based on two indicators of the drug therapeutic value. The first,
the SMR (Service Médical Rendu) measures the absolute medical benefit of the drug and is based on
considerations on both drug characteristics and disease class characteristics. The second, the ASMR
7

(Amélioration de Service Médical Rendu) refers to the progress in treatment, if any, brought by the drug
in terms of effi cacy, side effects and/or ease of use as compared to existing products in its class. If the
SMR attributed by the Transparency Commission is high enough, the drug is included in the positive list
and reimbursement is set at 35%, 65% or 100%, depending on SMR level and on the severity of the illness
the drug is aimed at treating. Since 2004, a major role in the decision on the rate of reimbursement has
been played by UNCAM (National Union of Sickness Insurance Funds). The positive list is reviewed on
a 5-year basis and last revision occurred in 2007.
The information on the SMR and ASMR is also used as a criterion for the negotiation of the price of
the drug between its manufacturer and the ministerial agency in charge of it, the Economic Committee
for Health Products (Comité économique des produits de santé, CEPS), established in 2000. The CEPS
establishes the price based on the ASMR level, the anticipated volume of sales and the price of comparable
drugs present on the list. In 2003 reference pricing of branded drugs to generics was established (Tarif
forfaitaire de responsabilité, TFR), linking the reimbursement of originator drugs to the price of their
generic counterparts. In 2004 external referencing was also introduced, forcing drug companies to set
prices in line with those in neighboring countries, Italy, Germany, UK and Spain. Finally, since 2006,
the price of all drugs in a class must be reduced when the patent of one reimbursable drug expires and
generics become available. The purpose of all of these measure was to reduce the price level of drugs
approved as reimbursable, hence creating savings for the welfare system.
The usage of generics was promoted by the reform not only as a tool to reduce public expenses, but
also as a major goal in itself, in line with recommendations of the European Commission (Pharmaceutical
sector inquiry, 2009). First, some campaigns were launched, addressed to patients, to increase aware-
ness and convey the idea that generics are perfect equivalents of branded drugs and there is no danger
from their use. In addition, due to the limited application of generic substitution, introduced in 1999,
some agreements were signed between doctors and the Statutory Health Insurance in order to increase
prescription of generics. The first attempt was the 2001 commitment to use the international chemical
name of the medicine in prescriptions (INN, International Nonproprietary Name). However, since only
8.5% of all prescriptions showed the INN (Grandfils and Sermet, 2006), in 2006 another agreement was
signed, encouraging physicians to prescribe those drugs for which generic alternatives are available.Date Event
September 2003 Introduction of TFR for some presentations of cimetidine and ranitidine.March 2004 Revision of TFR: decrease of 0.02-0.04 $ per box.April 2005 Revision of TFR: decrease of 0.5 $ for ranitidine.
Revision of TFR: decrease for ranitidine and cimetidine.Introduction of TFR on famotidine.
December 2007 Introduction of TFR for another presentation of cimetidine.
3.2 The Anti-Ulcer Drugs Market
The analysis focuses on the French anti-ulcer prescription drugs market in the period 1997-2007. The
market is defined at the therapeutic class level, using the international ATC classification up to the third
digit: anti-ulcer drugs are defined as all drugs classified in the A02B category, which comprises three
8

subclasses, defined by the fourth digit (A02B.A-C). For this market, each subclass can be thought of as a
generation of drugs treating ulcer and ulcer-related conditions (for example, the gastroesophageal reflux
disease, aka GORD). The subclass of histamine antagonists (H2) gathers anti-ulcer treatments of the
first big generation, introduced between the 1970s and 1980s, which treat ulcer symptoms by blocking
the action of histamine in the stomach. H2 drugs are based on a number of molecules, the most common
of which are cimetidine, famotidine, ranitidine and nizatidine. H2 had a great success in many countries,
driven by SmithKline’s Tagamet (cimetidine) and Glaxo’s Zantac (ranitidine); they remained top sellers
until the late 1980s, when a new generation of ulcer treatments was introduced, proton-pump inhibitors
(PPI). These drugs, instead of blocking the reception of histamine, act at the source of acid secretion,
inhibiting it for a prolonged time. This subclass includes several derivatives of benzimidazole (omeprazole,
lansoprazole, pantoprazole and rabeprazole among the most diffused) and, since its introduction, has been
considered to be superior to H2 and other existing drugs. Astra Zeneca’s omeprazole compound, Losec,
was the world top-selling drug during several years. Finally, the third subclass is a residual category,
which in France includes prostaglandins, mainly used for prevention and treatment of peptic ulcer in the
elderly.
The anti-ulcer market is a good candidate for the study of this work. First, it has long been one of the
top selling therapeutic classes worldwide (leading from 1990 to 2003). This was driven by the presence
of blockbusters and a competition based on subsequent innovations. Also, as highlighted in previous
studies (Crawford and Shum, 2005), the absence of real substitutes to these drugs (hospitalization and
surgery are aimed at different conditions) make the market easily identifiable in the A02B category,
without the worry of having to include among the competitors drugs belonging to other therapeutic
classes. Another interesting peculiarity of this market is the coexistence of products of different types and
generations, namely H2 versus PPI. In addition, during the period under study, the market experienced
patent expiration of major blockbusters and subsequent entry waves of generics, which started really
populating the market in early 2000s. Some of these reasons explain why it was analyzed in previous
contributions in the economic literature, which represent an interesting comparison for the results of this
work.
3.3 Data and Descriptive Statistics
Most data for this analysis come from IMS Health, providing a dataset with information on wholesale
transactions for the period 1997-2007. The revenues and the quantity sold from each drug in a country-
year are available, reported respectively in thousand US$ and in standard units. In the dataset, one
observation (drug-country-year triplet) is uniquely identified by detailed information: the name of the
medicine and the firm manufacturing it, the active ingredient and the ATC classification up to the fourth
digit, the therapeutic form and information on its brand type (originator, licensed or generic drug).
The IMS data do not include details on price of the drugs. Since reported transactions are at the
wholesale level, there is no way to identify to which segment (pharmacies or hospital) the drug was sold.
Hence, only the average wholesale price can be derived from the figures on quantity and revenues per
9

year. Data were aggregated at the therapeutic form level, in order to avoid that the different method of
administration of exactly the same drug (say, tablet and effervescent capsules, for instance) be considered
as substitutes.
Additional information on drugs belonging to the French anti-ulcer market was retrieved on the
website www.theriaque.org : its reliability is guaranteed by its approval by the HAS. The website was
used to gather information on indications and counter-indications of each drug in the sample, as well as
its SMR and ASMR level for each indication and the resulting reimbursement level (the anti-ulcer class
is included in the positive list and is usually reimbursed at 65%).
IMS data are also used to retrieve the prices in Germany, Italy, Spain and UK, which are used as
instruments for the price of French drugs (see section 4 below). The countries chosen are those on which
the external referencing is based on. Using these prices, however, is not straightforward, but requires a
process of adaptation, as explained more in detail in the Appendix.
Add stat on market expansion (total revenue on this market in France over time)
During the eleven years under study (1997-2007), a total of 69 different drugs were commercialized by
31 different companies: among them, 11 are branded firms, the remaining 20 are generic manufacturers.
Out of them, only 5 are French firms, where the nationality is identified by the country in which the
headquarters are located. More than half of the drugs, 36, belong to the PPI subcategory (A02B-C),
which represent the bulk of sales, followed by H2 (A02B-A), with 32 products; prostaglandins (A02B-B)
are present with only one drug, Pfizer’s Cytotec. French anti-ulcer drugs in this period are based on
10 active ingredients: five PPI (omeprazole, esomeprazole, lansoprazole, pantoprazole and rabeprazole),
four H2 (cimetidine, famotidine, nizatidine and ranitidine) and one prostaglandin (misoprostol). For five
out of these ten, generic substitutes were or became available: misoprostol, nizatidine, esomeprazole,
pantoprazole and rabeprazole were always sold only under their branded version.
In general, there is not much variation in the levels of SMR (Service Medical Rendu, the medical
benefit) and ASMR (Amelioration de Service Medical Rendu, the improvement in medical benefit), which
are respectively II (important) and V (inadequate) for most of the drugs in the class. The SMR, in
addition to the severity of the illness, defines the reimbursement level, which is set at 65% for all drugs
in the class (except for some old drugs in 2007, due to revision of the positive list).
Other quality-related measures refer to the number of formats, indications and side effects. A higher
number of formats under which a drug is commercialized is a measure of the quality in that it allows to
better suit the needs of heterogeneous patients: this figure varies between one and four different formats
in the sample. Not many drugs are sold in a liquid form, which is more common among branded drugs.
The number of indications and side effects differs significantly across drugs, from a minimum of two to a
maximum of nine indications (Losec and Nexium) and eight counter-indications (Nexium’s peculiarity).
10

Year ndrugs nbranded ngeneric Quantity sbranded sgeneric p Revenue( 1 0 0 0 s t d u n i t s ) ( $ / s t d u n i t )
1997 13 11 2 604038 99.97% 0.03% 1.72 1 038 9451998 13 11 2 612932 99.97% 0.03% 1.63 999 0791999 14 11 3 706451 99.96% 0.04% 1.62 1 144 4512000 27 12 15 809615 99.82% 1.18% 1.10 890 5772001 27 12 15 918680 99.00% 1.00% 0.95 872 7462002 29 13 16 1064382 99.02% 0.98% 0.97 1 032 4512003 30 13 17 1179154 98.43% 1.57% 0.95 1 120 1962004 47 13 34 1285490 86.73% 13.27% 0.87 1 118 3762005 47 13 34 1391362 78.30% 21.70% 0.87 1 210 4852006 51 13 38 1523885 74.10% 25.90% 0.82 1 249 5862007 63 13 50 1593450 71.11% 28.89% 0.74 1 179 153
Table 1: Descriptive Statistics
Two pieces of evidence are especially noteworthy at a first analysis of the data (Table 1). The first is
the significant increase in the number of drugs marketed during the period, from less than 15 during the
initial three years (1997-1999), to almost seventy in 2007. This increase is driven by entry of generics,
whose market share rises significantly during the period. Only two generics are on the market during
the initial part of the sample period, with a negligible market share. During the first entry wave of early
2000s, several ranitidine- and cimetidine-equivalents hit the market (Zantac and Tagamet lost patent
protection in the ’90s), but generics still represent a residual category in terms of volumes and revenues.
Finally, in 2004 generics start becoming real competitors of their branded rivals: after patent expiration
of the world top-selling drug, Losec (Astra Zeneca’s omeprazole), a second entry wave takes place and in
2007 generics represent between a fourth and a third of the whole A02B anti-ulcer drugs market.
The second interesting consideration is that generic entrants do not appear to have cannibalized sales
of their branded competitors, but have instead created a new segment of past non-users, increasing the
size of the market. This is clear by observing the pattern of evolution of aggregate quantity, which
more than doubles during the period. Much of the increase is due to generic entry, but sales of branded
products increase even more (not shown). The evolution of revenues is slightly different: from 1997 to
2007 revenues increase by 60%, but this increase is not steady, with a peak in 2004 (1.72 billion dollars),
the year in which most of the measures included in the reform are introduced. Conversely, the average
price decreases steadily over the period. This is likely to be due to the subsequent entry waves of generics.
4 Demand Model
4.1 Random utility model
In order to identify the demand shape for pharmaceutical drugs in each market, we estimate a random
utility discrete choice model which has the advantage of being flexible and allow product differentiation.
The first layer of product differentiation occurs at the sub-class level. The drugs under study belong
to the same therapeutic class, the A02B anti-ulcer category, but to different subclasses, which refer to
different generations of products. Older H2 drugs are still widely used, but PPI are usually considered
11

superior products, while prostaglandins are mainly prescribed for elderly patients. Differences emerge also
within a subclass, at the active ingredient level. For instance, H2 anti-ulcer drugs are easily substitutable
among each other, but there exist differences between, say, cimetidine and ranitidine. These two levels of
differentiation stem from objective differences that make one drug more appropriate to treat one condition
or more suitable for one type of patients. The third level of product differentiation is the one between
branded and generic drugs. This is not justified by a difference in the curative effects: the two are perfect
therapeutic equivalents. However, despite being (nearly) perfect substitutes (besides potential differences
in excipients, shape and color of the drug that do not compromise effi cacy or its curative effects for most
of the patients), for long they have not been perceived as being so. These three types of differentiation
may define specific patterns of product interdependence and substitutability and the demand model must
be flexible enough to capture them.
We thus use a random coeffi cient logit model à la Berry, Levinsohn and Pakes (1995). Contrary to
the standard logit model, it is not constrained by the IIA assumption, thus allowing to obtain consistent
estimates of the demand parameters required for computation of price-cost margins.
Utility is specified as additive separable between an observed and an unobserved part, with
Uijt = αitXjt − βitpjt + ζjt + εijt
for j = 1, .., J . The model is completed by the inclusion of an outside good, denoted good zero, allowing
for the possibility of consumer i not buying any of the marketed products J , and whose indirect utility
is normalized to zero: Ui0t = 0.
Heterogeneity of preferences is captured by random coeffi cients on all or on a subset of variables,
which emphasizes consumer heterogeneity and varies according to (αit, βit) = (α+ σανit, β + σβνit) ,
where νit summarizes all the unobserved consumer characteristics, and σα, σβ characterize how con-
sumer marginal utilities vary according to these unobserved characteristics. Indirect utility can then
be redefined as the sum of mean utility δjt = αXjt − βpjt + ζjt and deviations from the mean utility
µijt = (σαXjt − σβpjt) νit:
Vijt = δjt + µijt
Under the assumptions that εijt is independently and identically distributed according to Gumbel (ex-
treme value type I) distribution, the choice probability of alternative j by consumer i is
sijt =exp
(δjt + µijt
)1 +
∑k exp (δkt + µikt)
Assuming that νit is normally distributed with p.d.f. ϕ, the market share of product j, sjt is given
by
sjt =
∫Ajt
sijtϕ (νit) dνit
where Ajt denotes the set of consumers that purchase product j in period t.
12

Then, the own-and cross-price elasticities of the market share sj are :
∂sjt∂pkt
pktsjt
= −pjtsjt
∫Ajt
βitsijt (1− sijt)ϕ (νit) dνit if j = k
=pktsjt
∫Ajt
βitsijtsiktϕ (νit) dνit otherwise
4.2 Identification and Estimation
Based on Berry, Levinsohn and Pakes (1995) and Nevo (2000), the identification of such random coeffi cient
logit model can be done on aggregate data with instrumental variables. To do so, one needs instrumental
variables supposed to be correlated with prices but not with random demand shocks ζjt. Actually,
one has to take into account the problem of endogeneity of prices. The unobserved demand factors ζjt
are correlated with prices (Berry, 1994; Berry et al., 1995). Ignoring this simultaneity leads to biased
results and upward-sloping demand functions. Previous literature has used measures of the degree of
competition (Stern, 1996), of costs (Azoulay, 2002), prices for different markets or segments (Azoulay,
2002, and Berndt et al., 2003) as instruments. Other approaches use the characteristics of competing
products, excluding those produced by the same firm (Berry et al., 1995). Then, the estimation can be
done with Generalized Method of Moments using aggregate data on market shares per product and per
period, prices and drug characteristics.
To construct instrumental variables, we regress the price of drugs in Germany, Italy, Spain and
UK (countries on which external referencing has been based in France since 2004) on active ingredient
dummies, country and year fixed effects. The residuals of this regression are used as instrumental variables
for the price in France. The idea is to control for country and time effects and isolate the quality of each
drug, proxied by molecule dummies, which is the part of the price more likely to be correlated with
demand unobservable. What remains is an approximation of the marginal cost of each drug.
If pcjt is the price of drug j in country c at period t, we use residuals εcjt of the linear regression
pcjt = Xjtγc + εcjt
and make the following identification assumption:
E(ζjtε
cjt
)= 0
The variables used as regressors capture the most important product characteristics that influence
demand (Table 2). Drug-specific variables include the brand type (branded or generic), active ingredient
dummies, the number of side effects and formats. Additional dummies are used to indicate whether the
drug is still under patent protection and whether it has an indication for the eradication of helicobacter
pylori (the major bacterial cause of ulcer) and for co-prescription with non-steroidal anti-inflammatory
drugs (NSAID). Interactions between generic and formats and side effects are also used.
13

Variables Description Exp. sign Mean Std Dev.market share sjt market share by year / 0.02 0.04price pjt average price by year (−) 0.96 0.86Variables Xjt
branded dummy: 0=generic, 1=branded (+) 0.37 0.48formats number of therapeutic presentations (+) 1.60 0.90
side effects number of side effects (−) 3.24 1.69helicobacter dummy: 0=no indication, 1=indication (+) 0.75 0.44
nsaid dummy: 0=no indication, 1=indication (+) 0.24 0.43Table 2: Variables and descriptive statistics
Our structural model allows to interpret the estimated sign of the coeffi cients as the way drug char-
acteristics affect utility. For example, one would expect the two measures of indications, formats and
branded to affect positively demand. Conversely, a large number of side effects is expected to reduce
demand.
5 Supply Model and Identification of Margins
We consider an oligopoly model with a given market structure, taking entry decisions as exogenous. Indeed
pharmaceutical innovation involves long R&D delays, decided many years in advance, and generic entry
is constrained by patent protection. We can thus consider that pricing decisions are "static" compared
to entry decisions and that these two levels of decisions can be analyzed separately. We thus focus on
pricing with an exogenously given market structure.
Then, even if price setting is regulated in France, pharmaceutical companies may manage to choose
prices that maximize profit. Actually, lobbying and negotiations between the regulator (CEPS) and
companies may lead to price equilibrium not far from profit maximization equilibria. In particular, the
fact that the price approved by the CEPS is in most cases set at the level proposed by the manufacturer
seems to be a signal that, despite regulation, the price remains a decision mainly taken by the company.
We thus consider first the case of free price setting, which will be the most relevant one for US and
Germany but could also be for France.
5.1 Profit Maximization Equilibrium
Denote Πi the profit of multiproduct firm i in a given period (the time subscript t is dropped for ease of
presentation). This variable profit (fixed costs and other R&D costs are not affecting pricing decisions)
can be written as
Πi =∑
j∈Si(pj − cj) qj(p)
where pj is the price of drug j, cj is the marginal cost of product j, qj(p) is the quantity of drug j
demanded given the vector p of all drug prices, and Si is the set of drugs owned by firm i.
We consider that firms maximize profits by choosing prices simultaneously after observing the de-
mand factors (and in particular also the demand shocks ζj unobserved by the econometrician). As the
assumption on the demand specification imply no dynamic effects in the demand, assuming that the cost
14

function of the drug manufacturer does not have any dynamic effects too, maximizing the expected sum
of intertemporal profits by choosing each period the prices of drugs is thus equivalent to maximizing
profit period by period.
Then, each firm i chooses the prices of all its drugs in order to maximize profit. Assuming that
technical conditions for a pure-strategy Bertrand-Nash equilibrium in prices to exist are satisfied and
that equilibrium prices are strictly positive, the price of any product j sold by firm i must satisfy the
first-order condition
qj +∑
k∈Si(pk − ck)
∂qk (p)
∂pj= 0, for all j ∈ Si
which can be written as
qj1j∈Si +∑
k∈Si(pk − ck)
∂qk (p)
∂pj= 0, for all j, i
Then, with the following matrix and vector notations
q =
q1...qJ
, p =
p1...pJ
, c =
c1...cJ
Di =
11∈Si 0 0
0. . . 0
0 0 1J∈Si
, Qp =
∂q1(p)∂p1
... ∂qJ (p)∂p1
. . .∂q1(p)∂pJ
. ∂qJ (p)∂pJ
we have in matrix form
Diq +DiQp (p− c) = 0
and the usual formula for all i :
Dip− cp
= − [DiQp]−1Diq
p
giving price cost margins for all products as a function of demand shape, prices and quantities.
Remark that in the case of monopoly pricing, which amounts to assume that one firm would own all
drugs and choose all prices to maximize total profit, we would have:
p− cp
= −Q−1pq
p
where Qppq is the price elasticity of demand.
Also, if firms choose prices in order to maximize profits product by product, drug by drug independent
profit maximization would lead to the following price-cost margins:
Dipi − cipi
= −(
[Qp]i,i
)−1 qipi
Thus, given demand estimates and the observation of prices and market shares, one can obtain price-
cost margins per product and per year, just by solving the system of first order conditions obtained
above.
15

5.2 Regulation and constrained profit maximization equilibrium
Let’s now consider that price regulation amounts to impose implicitly some price-ceiling on drugs, either
because of explicit constraints on prices (like the TFR rules in France) or because of implicit constraints
coming from price negotiation between the regulator and the industry. These price ceilings are such that
for each drug in a set of potentially constrained price R, the price pj must be lower than a maximum
price pj , such that the firm i constrained maximization program is:
max{pj}j∈Si
Πi =∑
j∈Si(pj − cj) qj(p)
s.t. pj ≤ pj ∀j ∈ Si ∩R
Assuming that technical conditions for a pure-strategy Bertrand-Nash equilibrium in prices to exist
are satisfied and that equilibrium prices are strictly positive, the price of any product j sold by firm i
must satisfy the first-order condition
qj +∑
k∈Si(pk − ck)
∂qk (p)
∂pj= λj1{j∈R}, for all j ∈ Si
where λj is the Lagrange multiplier of price constraint.
These first order conditions can be written as we have in matrix form
Di (q − λ) +DiQp (p− c) = 0
and then
Dip− cp
(λ) = − [DiQp]−1Di
(q − λ)
p
Thus, λ being unknown, even with demand estimates, prices and market shares, one cannot identify
price-cost margins. We know that
λj > 0⇒ pj = pj and λj = 0⇒ pj < pj
but pj also unknown.
Theoretically, net effect on prices of regulation is ambiguous and will depend on all own and cross
price elasticities of demand. Price reduction of a drug can affect other drugs not explicitly constrained
because of cross price elasticity of demand
However, for each vector λt, from first order conditions, we have price-cost margins or marginal cost
cjt (λt) as a known function of λt (depending on demand, prices and quantities demanded).
Then, identifying restrictions can be used to reduce the degree of underidentification. For example,
one can assume that
cjt = Z ′jtδ for some vector Zjt
Then, the identified set of Lagrange multipliers λt = (λ1t, .., λJt) is the set solution to the following
minimization:
min{λt}t=1,..,T
∑j,t
[cjt (λt)− Z ′jt
(Z ′jtZjt
)−1Z ′jtcjt (λt)
]2
16

where(Z ′jtZjt
)−1Z ′jtcjt (λt) is the OLS estimate of δ.
Some of these cost restrictions, depending on Zjt, will simply make use of restrictions across markets
t of marginal costs of drugs. The identification power in our application will come form the fact that
there can be relevant and robust cost restrictions across products whose price is constrained (j ∈ R)
and other whose price is not constrained (j /∈ R). Here it can be either because of restrictions on the
marginal costs of the same drug across periods (before and after some regulatory changes), or because of
restrictions on costs of drugs across countries, some regulated (France) and others not price constrained
(US or Germany).
Then, each λ̂jt allows to infer if the price constraint is binding for drug jt and λ̂t allows to obtain the
marginal costs cjt(λ̂t
)under the constrained equilibrium.
Among the different possible cost restrictions of the form cjt = Z ′jtδ, that we could be willing to
impose, we can consider the following special cases to reduce the degree of underidentification of marginal
costs. We can assume that marginal costs be the sum of a drug effect and a time effect cjt = γj + δt.
We can assume that marginal costs depend only on the characteristics m(j) of drug j at period t(this
characteristic can be the molecule), cjt = γm(j)t.
Finally, one could also consider inequality restrictions like imposing that marginal costs be positive
or zero and below price
0 ≤ cjt ≤ pjt
Then, we could identify the following set{{λt}t=1,..,T |0 ≤ cjt (λt) ≤ pjt : t = 1, .., T
}
Once we have obtained cjt(λ̂t
), we will see that we can identify the counterfactual equilibrium prices
without the regulatory constraint by simulating cjt (0).
6 Estimation Results
6.1 Demand Estimation Results
Results of the mixed logit model are reported in Table 3. Time and active ingredient dummies were
included in the estimation but are not reported in Table 3. Year dummies are not always significant, but
their sign captures a positive trend (negative coeffi cients are associated to earlier years, while positive
and increasing coeffi cients are estimated after 2000). Active ingredient dummies are usually significant
and their sign reflects perceived quality of different drugs. Branded drugs show a competitive advantage,
even though the effect is not always significant. Similarly, having an indication for the eradication of
helicobacter pylori and for co-prescription with NSAID has a positive effect, as well as being sold under
several presentations. Surprisingly, the number of side effects does not seem to discourage purchase, but
it does so for generic drugs. This result may be driven by the simplistic way side effects are defined, by
just their number, without accounting for their seriousness.
17
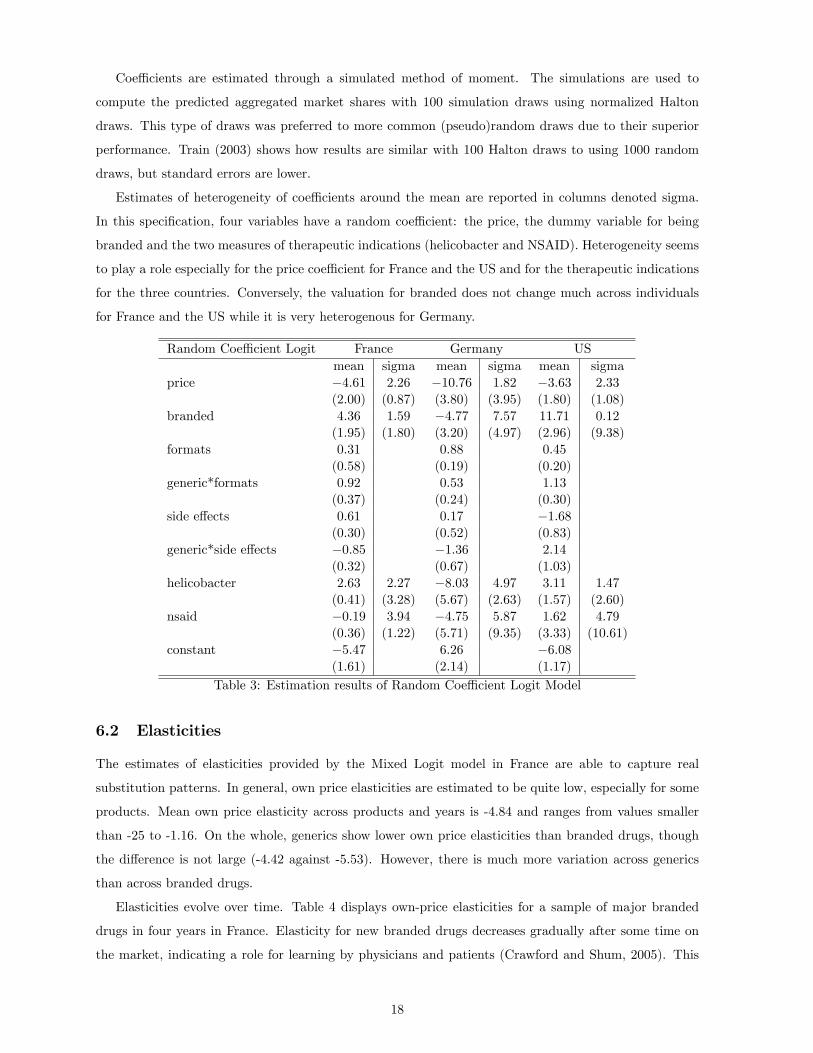
Coeffi cients are estimated through a simulated method of moment. The simulations are used to
compute the predicted aggregated market shares with 100 simulation draws using normalized Halton
draws. This type of draws was preferred to more common (pseudo)random draws due to their superior
performance. Train (2003) shows how results are similar with 100 Halton draws to using 1000 random
draws, but standard errors are lower.
Estimates of heterogeneity of coeffi cients around the mean are reported in columns denoted sigma.
In this specification, four variables have a random coeffi cient: the price, the dummy variable for being
branded and the two measures of therapeutic indications (helicobacter and NSAID). Heterogeneity seems
to play a role especially for the price coeffi cient for France and the US and for the therapeutic indications
for the three countries. Conversely, the valuation for branded does not change much across individuals
for France and the US while it is very heterogenous for Germany.
Random Coeffi cient Logit France Germany USmean sigma mean sigma mean sigma
price −4.61 2.26 −10.76 1.82 −3.63 2.33
(2.00) (0.87) (3.80) (3.95) (1.80) (1.08)
branded 4.36 1.59 −4.77 7.57 11.71 0.12
(1.95) (1.80) (3.20) (4.97) (2.96) (9.38)
formats 0.31 0.88 0.45
(0.58) (0.19) (0.20)
generic*formats 0.92 0.53 1.13
(0.37) (0.24) (0.30)
side effects 0.61 0.17 −1.68
(0.30) (0.52) (0.83)
generic*side effects −0.85 −1.36 2.14
(0.32) (0.67) (1.03)
helicobacter 2.63 2.27 −8.03 4.97 3.11 1.47
(0.41) (3.28) (5.67) (2.63) (1.57) (2.60)
nsaid −0.19 3.94 −4.75 5.87 1.62 4.79
(0.36) (1.22) (5.71) (9.35) (3.33) (10.61)
constant −5.47 6.26 −6.08
(1.61) (2.14) (1.17)
Table 3: Estimation results of Random Coeffi cient Logit Model
6.2 Elasticities
The estimates of elasticities provided by the Mixed Logit model in France are able to capture real
substitution patterns. In general, own price elasticities are estimated to be quite low, especially for some
products. Mean own price elasticity across products and years is -4.84 and ranges from values smaller
than -25 to -1.16. On the whole, generics show lower own price elasticities than branded drugs, though
the difference is not large (-4.42 against -5.53). However, there is much more variation across generics
than across branded drugs.
Elasticities evolve over time. Table 4 displays own-price elasticities for a sample of major branded
drugs in four years in France. Elasticity for new branded drugs decreases gradually after some time on
the market, indicating a role for learning by physicians and patients (Crawford and Shum, 2005). This
18

fact is clear at inspection of the elasticities for Inipomp and Nexium: their pattern suggests that it took
time to physicians and patients to know their availability and quality. Conversely, older drugs display
pretty stable own price elasticities (Zantac, Tagamet and Cytotec).
Drug 1997 2000 2004 2007Losec -12.85 -7.80 -8.01 -7.53
Nexium - - -8.63 -5.22Inipomp -7.73 -7.67 -5.83 -5.01Zantac -3.12 -4.43 -3.00 -2.88
Tagamet -2.62 -2.26 -2.77 -2.30Cytotec -1.37 -1.75 -1.80 -1.65
Table 4: Own-price elasticities of a sample of branded drugs (France)
Table 5 displays cross-price elasticities in France for a sample of drugs for the year 2004. Some of its
results are expected, others instead are quite surprising. First, these drugs do not seem to be very close
substitutes, as for a 1% price increase of any of these drugs, the highest benefit is an increase by 1.5%
in sales. The fact that this figure is found between Losec and Nexium is in line with expectations, given
that Nexium and Losec are based on very similar molecules. Similarly, the benefit in sales increase is
proportional for drugs based on the same active ingredient (Omeprazole Serv and Losec) and is relatively
high also for drugs belonging to the same ATC category (Losec, Nexium and Inipomp). However, the
Mixed Logit uncovers substitutability relationships that go beyond ATC subclass or active ingredient
and show how, for example, patients are quite willing to switch to Losec if the price of Zantac increases,
instead of buying the closest alternative, i.e. Ranitidine Myla. Other cross price elasticities for France ,
US and Germany are given in Tables A1, A2, A3, A4 in appendix A.2.
Losec Nexium Inipomp Zantac Tagamet Cytotec Ome. Serv Ran. Myla
Losec -8.01 0.72 0.70 0.19 0.04 0.04 0.20 0.03Nexium 1.49 -8.63 0.69 0.19 0.04 0.01 0.20 0.03Inipomp 1.00 0.48 -5.83 0.13 0.03 0.03 0.02 0.02Zantac 0.49 0.23 0.22 -3.00 0.01 0.01 0.06 0.01Tagamet 0.44 0.21 0.20 0.06 -2.77 0.01 0.06 0.01Cytotec 0.29 0.14 0.13 0.04 0.01 -1.80 0.04 0.01Ome. Serv 1.00 0.48 0.46 0.13 0.03 0.03 -6.15 0.02Ran. Myla 0.49 0.24 0.23 0.06 0.01 0.01 0.07 -3.10
Table 5: Cross elasticities for a sample of drugs, 2004 (France)
6.3 Margins and Costs
After estimating own- and cross-price elasticities, we can estimate price-cost margins under the two
different supply models considered. Inspection of the evolution of price-cost margins and the differences
obtained using different models should shed some light on the actual role played by regulation in price-
setting decisions of the firms.
6.3.1 Unconstrained price-setting
Although marginal costs for drugs have been estimated to be small and to decrease after patent expiration
(see, for example, Berndt et al., 2003)
19

First, no markups are estimated to be above 1 (see Table 6 below) and the mean across drugs and
years is 28%. Thus, there seems to be some degree of market power. Half of the values are below 25%
and, except for a few generics of cimetidine showing very high levels of markups in later years (between 80
and 90%), the rest of the drugs show margins below 50%. Generics systematically show higher margins
than branded versions, with a mean of 33% against 22%. Similarly, some molecules appear to be more
profitable than others to sell, as they repeatedly display higher levels of markups, both for branded and for
generic manufacturers (cimetidine is a clear example in Table 6). However, for some active ingredients
generic firms display a significant comparative advantage in their production. It is again the case of
cimetidine and, to a less extent, omeprazole and lansoprazole. This fact is not surprising: it is common
wisdom in the industry that generic firms display lower marginal costs than branded manufacturers and
this is especially true for older molecules, such as cimetidine.
Molecule Average Branded GenericCimetidine 54% 38% 58%Ranitidine 28% 25% 29%Famotidine 29% 25% 38%Omeprazole 20% 11% 22%Lansoprazole 16% 14% 35%
Average price-cost margins by moleculeTable 6
Interestingly, average markups are estimated to increase over time, as suggested by previous models.
The increase is significant, from 24% in 1997 to 33% in 2007, and mainly occurs in 2006. This effect is
driven by an increase in the margins for generics, while branded drugs show more stable markups.
6.3.2 Constrained price-setting
We now assume that regulation may impose some price cap to some drugs in France. This has been
implemented since 2004 in France through reference pricing, which links the reimbursement level of some
branded drugs to the price of their generic versions. In 2004 and 2005 only two anti-ulcer drugs were
affected by this measure (Tagamet and Zantac), and a third was added in 2006 (Pepcidine). In addition,
since 2006 the price for all drugs in a subclass is imposed to decrease once generic drugs enter or when
they have been on the market for at least 24 months. This amounts in our model to an additional price
constraint on three drugs (Losec, Lanzor and Takepron). Thus, we impose that the price of these drugs
only can be capped and we test our hypothesis by estimating the Lagrange multiplier for each of them.
In order to recover it, we assume that the marginal cost depends on the active ingredient of the drug.
We estimate them through non-linear least squares.
20

Year Average Branded GenericUnconst. Constr. Unconst. Constr. Unconst. Constr.
1997 24% 24% 24% 24% 25% 24%1998 22% 22% 19% 19% 36% 37%1999 21% 21% 21% 21% 21% 21%2000 28% 29% 22% 22% 33% 34%2001 29% 30% 22% 23% 34% 36%2002 28% 30% 22% 23% 33% 36%2003 28% 30% 21% 22% 33% 35%2004 26% 25% 21% 16% 29% 29%2005 26% 25% 21% 15% 29% 30%2006 33% 32% 26% 18% 37% 32%2007 33% - 25% - 37% -Average price-cost margins
Table 7
Table 7 reports a comparison of average margins by year estimated with each of the two models.
Markups do not differ significantly depending on the model used: the average is slightly below 28%
as in the unconstrained model, and the evolution over time reflects an increasing pattern. However,
since 2004 margins estimated using the price-constrained model are always below those obtained by
the unconstrained model. This is more obvious when comparing results for branded drugs. Since 2004
margins for branded drugs are systematically lower than in the model ignoring regulation and the effect is
quite strong. However, even margins for generics are estimated to be lower than with the unconstrained
model for year 2006.
Molecule Unconstr. Constr.Cimetidine 54% 54%Ranitidine 28% 26%Famotidine 29% 28%Nizatidine 18% 18%Omeprazole 20% 19%
Esomeprazole 14% 13%Lansoprazole 16% 14%Pantoprazole 14% 13%Rabeprazole 16% 16%Misoprostol 56% 59%
Average price-cost margins by moleculeTable 8
It is interesting to note how margins by active ingredient reflect the constraints. Margins for famo-
tidine, ranitidine, omeprazole and lansoprazole are estimated to be slightly lower than with the uncon-
strained model (see Table 8), while for other molecules there is not a clear pattern. Inspection of margins
drug by drug (not reported) further confirms that drugs subject to reference pricing and to price decreases
are correctly estimated to enjoy lower margins than when ignoring regulation after 2004.
Drug 2003 2004 2005 2006Un. Con. Un. Con. Un. Con. Un. Con.
Tagamet 41% 44% 34% 30% 31% 29% 41% 36%Pepcidine 20% 20% 20% 20% 19% 19% 22% 16%Losec 14% 13% 12% 11% 11% 11% 13% 13%2003-2006 margins for regulated drugs
21

Table 9Year Average Branded Generic
Unconst. Constr. Unconst. Constr. Unconst. Constr.1997 24% 24% 24% 24% 25% 24%2000 28% 29% 22% 22% 33% 34%2003 28% 30% 21% 22% 33% 35%2004 26% 25% 21% 16% 29% 29%2005 26% 25% 21% 15% 29% 30%2006 33% 32% 26% 18% 37% 32%Average price-cost margins
Table 10
On the whole, these results seem to suggest that our model is capturing some effects on the drugs
subject to reference pricing and to price decreases. Accounting for regulation is thus important when
estimating market power and our results, though far from estimating a binding constraint, are indicative
of the fact that firms are not completely free to choose the price.
Year Average Branded GenericUnconst. Constr. Unconst. Constr. Unconst. Constr.
1997 22.8% - 22.7% - 23.4% -1998 26.1% - 22.9% - 43.9% -1999 22.0% - 22.0% - 21.7% -2000 32.7% - 25.2% - 38.7% -2001 32.6% - 24.7% - 39.0% -2002 31.7% - 24.5% - 37.6% -2003 32.0% - 24.3% - 38.0% -2004 30.9% 30.6% 25.1% 22.4% 33.4% 34.2%2005 31.9% 31.2% 25.4% 21.1% 34.9% 35.9%2006 34.2% 33.2% 26.1% 19.3% 37.5% 38.8%2007 35.5% 34.9% 27.2% 22.0% 39.6% 41.1%
Table 11: Average price-cost margins
Molecule France US GermanyBranded Generic Branded Generic Branded Generic
Cimetidine 42.1% 66.1% 24.6% 109% 23.4% 21.9%Famotidine 27.1% 40.6% 10.1% 214% 13.8% 18.7%Nizatidine 19.6% - 13.5% 47.5% 13.5% -Ranitidine 27.5% 32.8% 15.8% 283% 27.9% 12.5%
Esomeprazole 15.1% - 8.5% - 28.7% -Lansoprazole 16.0% 38.1% 9.1% - 15.7% 0.05%Omeprazole 13.0% 23.8% 8.2% 22.5% 17.0% 14.5%Pantoprazole 15.1% - 11.7% 9.5% 17.0% -Rabeprazole 18.3% - 10.6% - 26.0% -Misoprostol 61.8% - 36.2% 58.3% 15.8% -
Table 12: Average price-cost margins by molecule in the 3 countries
Drug 2004 2005 2006 2007Un. Con. Un. Con. Un. Con. Un. Con.
Tagamet 40% 42% 38% 37% 42% 39% 44% 39%Zantac 37% 6% 37% 5% 35% 6% 35% 29%Raniplex 25% 12% 29% 0.5% 34% -22% 35% -22%Pepcidine 23% - 23% - 23% 21% 24% 22%
22

Table 13: 2004-2007 margins for regulated drugs
Drug 2004 2005 2006 2007Un. Con. Un. Con. Un. Con. Un. Con.
Tagamet 40% 41% 38% 37% 42% 39% 44% 39%Zantac 37% 2% 37% 1% 35% 2% 35% 30%Raniplex 25% 11% 29% 1% 34% -24% 35% -21%Pepcidine 23% - 23% - 23% 21% 24% 22%Losec 14% - 13% - 13% - 14% -11%Lanzor 18% - 18% - 19% - 20% 9%Takepron 18% - 18% - 29% - 20% 5%
Table 14: 2004-2007 margins for regulated drugs
Drug 2004 2005 2006 2007Un. Con. Un. Con. Un. Con. Un. Con.
Tagamet 0.31 0.30 0.33 0.34 0.28 0.29 0.27 0.29Zantac 0.36 0.53 0.34 0.34 0.37 0.54 0.39 0.42Raniplex 0.61 0.72 0.52 0.72 0.39 0.72 0.38 0.72Pepcidine 0.68 - 0.68 - 0.68 0.70 0.64 0.66
Table 15: 2004-2007 marginal costs for regulated drugs - in USD per standard unit
Drug 2004 2005 2006 2007Un. Con. Un. Con. Un. Con. Un. Con.
Tagamet 0.31 0.30 0.34 0.34 0.28 0.29 0.27 0.29Zantac 0.36 0.56 0.35 0.56 0.37 0.56 0.39 0.42Raniplex 0.61 0.73 0.52 0.72 0.39 0.73 0.38 0.71Pepcidine 0.68 - 0.68 - 0.68 0.70 0.64 0.66Losec 1.51 - 1.55 - 1.45 - 1.37 1.75Lanzor 1 - 1 - 0.95 - 0.86 0.98Takepron 1.02 - 1.02 - 0.96 - 0.86 1.04
Table 16: 2004-2007 marginal costs for regulated drugs - in USD per standard unit
7 Conclusion
We have estimated models of demand for anti-ulcer drugs in France, US and Germany in the period
1997-2007, so as to identify the effects exerted by the regulation of prices in France on margins, industry
structure and, on the whole, welfare. Models of discrete choice for differentiated products are applied to
data on wholesale transactions provided by IMS Health, with an emphasis on consumers’heterogeneity.
On the supply side, we assume firms may be constrained by regulation in their price setting decisions on
some markets (France).
The analysis of the demand side finds out that being branded and quality of the drug are the major
drivers of demand in the period under study, but consumers heterogeneity matters quite significantly.
Interestingly, cross price elasticities capture a still imperfect perceived substitutability of generics: as the
price of the drug used increases, consumers are predicted to rather switch to a branded competitor than
to the generic version of their preferred drug.
On the supply side, our results suggest that price regulation measures introduced after 2003 in France
act as a price cap for some drugs, which are estimated to display lower margins than with a model
23

that ignores regulation. Both models show that margins increased over time, suggesting that firms
in this market have some degree of market power. Generics display higher markups along the whole
period and regardless of the active ingredient. Moreover, they show a particular competitive advantage
in the production of some old molecules. This is not surprising, as it is common wisdom that generic
manufacturers have lower costs than their branded competitors. Our constrained profit maximization
model uncovers some role played by price regulation in France, focusing on reference pricing and on
generic-related price decreases. Results suggest that firms subject to these measures are indeed not
completely free to choose the price besides their intense negotiation in price setting with the regulator.
Thus, accounting for regulation is crucial to estimate market power and welfare.
We are able to show evidence on which drugs are truly affected by regulation and which constraints
are more or less binding (on-patent versus off-patent drugs, branded versus generics, etc.). We finally
perform some counterfactual analysis, by simulating price with and without constraint and test what
would happen to prices and margins if, for example, price regulation had not existed in France.
8 References
Arronson, T., M.A. Bergman et N. Rudholm (2001), The impact of generic drug competition on brand
name market shares: Evidence from micro data, Review of Industrial Organization 19, 455-435.
Azoulay, P. (2002), “Do pharmaceutical sales respond to scientific evidence?”, Journal of Economics
and Management Strategy, Volume 11, No. 4, Winter 2002, 551-594
Berndt, Ernst R. and Murray L. Aitken (2011), “Brand Loyalty, Generic Entry and Price Competition
in Pharmaceuticals in the Quarter Century After the 1984 Waxman-Hatch Legislation”, International
Journal of the Economics of Business 18(2):177-201, July 2011.
Berndt, E.R., Bui, L., Reiley, D.R. and Urban, G.L. (1995),“Information, Marketing and Pricing in
the US anti-ulcer drug market”, American Economic Review, Vol. 85, No. 2, Papers and Proceedings
of the Hundredth and Seventh Annual Meeting of the American Economic Association Washington, DC,
January 6-8, 1995 (May, 1995), 100-105
Berndt, E.R., Cockburn, I.M. and Griliches, Z. (1996), “Pharmaceutical innovations and market
dynamics: tracking effects of price indexes for antidepressant drugs”, Brookings Papers: Microeconomics,
1996
Berndt, E.R., Kyle, M.K. and Ling, D.C. (2003), “The long shadow of patent expiration: Generic
entry and Rx-to-OTC switches”, in: Feenstra, R.C. and Shapiro, M.D. (2003), Scanner Data and Price
Indexes, University of Chicago Press
Berndt, E.R., Pindyck, R.S. and Azoulay, P. (2003),“Consumption Externalities and diffusion in
pharmaceutical markets: anti-ulcer drugs”, The Journal of Industrial Economics, Vol. 51, No. 2, June
2003, 243-270
24

Berry, S. T. (1994),“Estimating discrete-choice models of product differentiation”, The RAND Journal
of Economics, Vol. 25, No. 2, Summer 1994, pp.
Berry, S. T., Levinsohn, J. and Pakes, A. (1995),“Automobile prices in market equilibrium”, Econo-
metrica, Vol. 63, No. 4, July 1995, 841-890
Blundell, L. W. and Powell, J. L. (2004),“Endogeneity in semiparametric binary response models”,
The Review of Economic Studies, Vol. 71, No. 3, 655-679
Bonnet, C. and Dubois, P. (2010),“Inference on vertical contracts between manufacturers and retailers
allowing for nonlinear pricing and resale price maintenance”, RAND Journal of Economics, Vol. 41, No.
1, Spring 2010 139—164
Brekke, K.R., T.H. Holmås, et O.R. Straume (2008), Regulation, generic competition and pharma-
ceutical prices: Theory and evidence from a natural experiment, NIPE Working Papers 01/2008, NIPE
- Universidade do Minho.
Brekke, K.R., A.L., Grasdal, et T.H. Holmås (2007), Regulation and Pricing of Pharmaceuticals:
Reference Pricing or Price Cap Regulation?, CESifo Working Paper, CESifo GmbH.
Capella, M.L., Taylor, C.R., Campbell, R.C. and Longwell, L.S. (2009), “Do pharmaceutical marketing
activities raise prices? Evidence from five major therapeutic classes”, Journal of Public Policy and
Marketing, Fall 2009
Ching, A. “A Dynamic Oligopoly Structural Model for the Prescription Drug Market after Patent
Expiration.”International Economic Review, Vol. 51 (2010), 1175—1207
Crawford, G. S. and Shum, M. (2005), “Uncertainty and Learning in Pharmaceutical Demand”,
Econometrica, Vol. 73, No. 4, 1137-1173
Danzon, P. M. (1997), “Price discrimination for pharmaceuticals: welfare effects in the US and the
EU”, International Journal of the Economics of Business, Vol. 4, No. 3 (Nov., 1997), 301-322
Danzon, P. M. and Chao, L-W. (2000),“Does Regulation Drive out Competition in Pharmaceutical
Markets?”, Journal of Law and Economics, Vol. 43, No. 2 (Oct., 2000), 311-357
Danzon, P. M. and Epstein, A. J. (2008),“Effects of regulation on drug launch and pricing in interde-
pendent markets”, NBER Working Paper 14041, National Bureau of Economic Research, Inc.
DiMasi, J. A., Hansen, R. W. and Grabowski, H. G. (2003),“The price of innovation: new estimates
of drug development costs”, Journal of Health Economics, Vol. 22, No. 3 (March 2003), 151-185
Donohue, J. and Berndt, E.R. (2004), “Effects of direct-to-consumer advertising on medication choice:
the case of antidepressants”, Journal of Public Policy and Marketing, Fall 2004
Ellison, S. F., Cockburn, I., Griliches, Z. and Hausman, J. (1997) “Characteristics of demand for
pharmaceutical products: an examination of four cephalosporins”, RAND Journal of Economics
European Commission (2009), Pharmaceutical sector inquiry, Final Report, July 2009, available at
http://ec.europa.eu/competition/sectors/pharmaceuticals/inquiry/index.html
Filson D. (2012) "A Markov-perfect equilibrium model of the impacts of price controls on the perfor-
mance of the pharmaceutical industry" RAND Journal of Economics Volume 43, Issue 1, pages 110—138,
Spring 2012
25

Golec, J.H., et J.A. Vernon (2006), European pharmaceutical price regulation, firm profitability and
R&D spending, NBER Working Paper 12676.
Grandfils, N. (2008), “Drug price setting and regulation in France”, IRDES Working Paper, September
2008 (available at www.irdes.fr)
Grandfils, N. and Sermet, C. (2006), “Pharmaceutical policy in France: a mosaic of reforms”, Euro-
health, Volume 12 Number 3, 2006 (WHO)
IMS Health, Press releases 2001-2010, available at www.imshealth.com
Grignolon L. and F. Verboven (2011) "Nested Logit or random coeffi cients logit? A comparison of
alternative discrete choice models of product differentiation" mimeo
Kyle, M. K. (2006), “The Role of Firm Characteristics in Pharmaceutical Product Launches”, RAND
Journal of Economics, Vol. 37, No. 3 (Autumn, 2006), 602-618
Lakdawalla, D. and Sood, N. “Innovation and the Welfare Effects of Public Drug Insurance.”Journal
of Public Economics, Vol. 93 (2009), 541—548.
Nevo, A. (2000),“A practitioner’s guide to estimation of random coeffi cients logit models of demand”,
Journal of Economics & Management Strategy, Vol. 9, No. 4, Winter 2000, 513-548
Nevo, A. (2001),“Measuring Market Power in the Ready-to-Eat Cereal Industry”, Econometrica, Vol.
69(2), pages 307-342
Nguyen-Kim, L., Or, Z., Paris, V. and Sermet, C. (2005),“The politics of drug reimbursement in
England, France and Germany”, Questions d’Economie de la sante, IRDES No. 99. 2005/10, (available
at www.irdes.fr)
Rizzo, J. A. (1999),“Advertising and competition in the ethical pharmaceutical industry: the case of
antihypertensive drugs”, Journal of Law and Economics
Salvo, A. (2010), “Inferring Market Power under the Threat of Entry: The Case of the Brazilian
Cement Industry”, The RAND Journal of Economics, Vol. 41, No. 2, 326-350.
Scott-Morton, F. M. (1999), “Entry Decisions in the Generic Pharmaceutical Industry”, The RAND
Journal of Economics, Vol. 30, No. 3 (Autumn, 1999), 421-440
Scott-Morton, F. M. (2000), “Barriers to entry, brand advertising, and generic entry in the US phar-
maceutical industry”, International Journal of Industrial Organization, 18 (2000), 1085-1104
Sood, N., De Vries, H., Gutierrez, I., Lakdawalla, D.N., and Goldman, D.P. “The Effect of Regulation
on Pharmaceutical Revenues: Experience in Nineteen Countries.”Health Affairs, Vol. 28 (2009), W125—
W137
Train, K. E. (2003), Discrete Choice methods with simulation, Cambridge University Press
USDC (2004) "Pharmaceutical Price Controls in OECD Countries Implications for U.S. Consumers,
Pricing, Research and Development, and Innovation"
Verboven, F. (1996), “International Price Discrimination in the European Car Market”, The RAND
Journal of Economics, Vol. 27, No. 2, Summer 1996, 240-268
26

A Appendix
A.1 Data
After adaptation and manipulation of the data, 361 observations were left. One observation is defined as
a drug-year pair: Zantac in 1997 is a different observation from Zantac in 1998.
Recovering prices of drugs in other countries proved sometimes to be diffi cult, due to a number of
reasons. First, not all medicines are sold in all countries. Even when a medicine exists abroad, sometimes
it is not exactly the same as the one in France or that it is called differently. Also, the patentee may
be the manufacturer in its country, but may decide to license it to other firms in other countries: this
translates into different names of the medicine and of the company, even though the two drugs coincide.
Often, it is easy to identify the same medicine in different countries in the database, but it is present
under different therapeutic forms. Even though data are aggregated at the therapeutic form level, this
imperfect matching requires additional steps of data checking.
A drug is identified by the matching in France and in the other country of five pieces of information
present in the dataset: the name of medicine and/or the name it is given in the company, the active
ingredient, the brand type (branded vs. generic) and the patent registration date. The manufacturer was
not used as a major criteria, but it was often used for double checking.
When a matching based on these criteria could be found, but the drug in the two countries was not
exactly the same, some proxies where used. When a drug is sold under different presentations in different
countries, then it is considered to be the same when at least two out of three digits in the code defining
the therapeutic form coincide: this criterion guarantees that the main characteristics of each form are
preserved (and hence the price abroad is a good instrument for the price in France). When matching for
a drug in France and any of the other four countries could not be found, the price used as a proxy was
that of a drug showing as many characteristics as possible in common with the French medicine, namely
the active ingredient, therapeutic form, brand type. For a couple of products even such correspondence
could not be found: the price was then instrumented with the weighted average price in the other three
countries.
For generics, it was sometimes very diffi cult to identify the same drug in France and abroad. In
this case, the price of a French unbranded generic was instrumented by averaging the price of all the
unbranded generics with the same molecule in the other country.
27

A.2 Additional TablesTagamet Zantac Losec Nexium Inipomp Cytotec Ran. Myla Ome. Serv
Tagamet -2.35 0.04 0.41 0.19 0.17 0.02 0.01 0.05Zantac 0.02 -2.57 0.45 0.21 0.19 0.02 0.01 0.05Losec 0.06 0.14 -6.73 0.66 0.60 0.05 0.03 0.16Nexium 0.06 0.14 1.37 -7.32 0.59 0.05 0.03 0.16Inipomp 0.04 0.09 0.92 0.44 -4.97 0.04 0.02 0.11Cytotec 0.01 0.03 0.27 0.13 0.11 -1.53 0.01 0.03Ran. Myla 0.02 0.05 0.46 0.22 0.19 0.02 -2.64 0.05Ome. Serv 0.04 0.09 0.92 0.44 0.39 0.04 0.02 -5.25
Table A1: Cross elasticities for a sample of drugs, 2004 (France)
Tagamet Zantac Losec Nexium Pariet Cytotec Ran. Novt Ome. Novt
Tagamet -2.35 0.04 0.41 0.19 0.18 0.02 0.0 0.03Zantac 0.02 -2.57 0.45 0.21 0.20 0.02 0.0 0.04Losec 0.06 0.14 -6.73 0.66 0.63 0.05 0.01 0.12Nexium 0.06 0.14 1.37 -7.32 0.62 0.05 0.01 0.11Pariet 0.04 0.10 0.95 0.45 -5.09 0.04 0.01 0.08Cytotec 0.01 0.03 0.27 0.13 0.12 -1.53 0.0 0.02Ran. Novt 0.02 0.05 0.51 0.24 0.23 0.02 -2.95 0.04Ome. Novt 0.04 0.09 0.92 0.44 0.41 0.04 0.01 -5.28
Table A2: Cross elasticities for a sample of drugs, France 2004
Tagamet Zantac Losec Nexium Pariet Cytotec Ran. Novt Ome. Novt
Tagamet -4.93 0.06 0.11 0.19 0.70 0.01 0.14 0.05Zantac 0.0 -7.30 0.16 1.05 0.51 0.01 0.20 0.08Losec 0.01 0.14 -11.13 1.68 0.83 0.01 0.33 0.13Nexium 0.01 0.15 0.28 -11.61 0.90 0.01 0.36 0.14Pariet 0.0 0.11 0.22 1.41 -9.26 0.01 0.28 0.11Cytotec 0.0 0.04 0.07 0.46 0.23 -3.25 0.09 0.04Ran. Novt 0.0 0.01 0.02 0.11 0.05 0.0 -0.76 0.01Ome. Novt 0.0 0.07 0.13 0.87 0.43 0.01 0.17 -6.09
Table A3: Cross elasticities for a sample of drugs, US 2004
Tagamet Zantac Losec Nexium Pariet Cytotec Ran. Novt Ome. Novt
Tagamet -4.36 0.01 0.04 0.43 0.02 0.0 0.05 0.09Zantac 0.0 -6.13 0.06 0.61 0.03 0.01 0.06 0.13Losec 0.01 0.07 -26.34 2.65 0.14 0.03 0.28 0.55Nexium 0.01 0.05 0.17 -15.71 0.09 0.02 0.18 0.36Pariet 0.01 0.05 0.18 1.80 18.01 0.02 0.19 0.38Cytotec 0.0 0.01 0.04 0.44 0.02 -4.36 0.05 0.09Ran. Novt 0.0 0.01 0.03 0.31 0.02 0.0 -3.11 0.07Ome. Novt 0.01 0.04 0.14 1.40 0.07 0.02 0.15 -13.71
Table A4: Cross elasticities for a sample of drugs, Germany 2004
28