the effects of sediment discharge by rivers on coral reef ... · reefs in sogod bay, southern...
TRANSCRIPT

1
The Effects of Sediment Discharge by Rivers
on Coral Reef Systems in Sogod Bay,
Southern Leyte, Philippines.
By
Thomas Woolger
BSc Environmental Science Research Project 2009
University of Southampton

2
Contents
1. Acknowledgements...................................................................3
2. Abstract.....................................................................................4
3. List of Tables and Figures.........................................................5
4. Introduction...............................................................................6
5. Literature Review......................................................................12
6. Method......................................................................................15
7. Results.......................................................................................20
8. Discussion.................................................................................27
9. References & Bibliography......................................................32
10. Appendix I
11. Appendix II
12. Appendix III
13. Appendix IV
14. Appendix V

3
Acknowledgements
The author of this study would wish to thank the following organisations and people for their
guidance and help with this project:
Coral Cay Conservation for allowing the author to travel out to the Philippines with
them, and allowing the use of the previously collected data set. Specifically Kai
Schiefelbein and Dr Simon Harding of CCC London, as well as Annelies Ghesquiere,
Jessica Campbell, Tristan Brown the science team at Napantao CCC base and also
every other member of the CCC Philippines Expedition.
Prof. Robert Nicholls
Mr John Jones.
Dr Antony Jensen
Dr C Patrick Doncaster
4
Abstract
A coral reef is an ocean habitat which covers less than a quarter of a percent of the world‟s
oceans, but hold up to 25% of the world‟s total marine life. It is a very delicate ecosystem
which needs very specific conditions to survive. If any of these conditions are upset slightly
than the reef system will falter and die. One of the major ways in which this system is upset is
by the influx of sediment. An increase in sediment means that the coral cannot photosynthesis
and as such it will die. The focus of the study was on sedimentation and its effects on coral
reefs in Sogod Bay, Southern Leyte, Philippines. This study looked 82 sections of reef spread
out over 27km and measured distance from the nearest river mouth, and the average DAFOR
value (hard coral & filter feeders) for each section of coast. The study found that there was a
significant relationship between the distance from the nearest river mouth and the average
DAFOR value for both hard coral and for filter feeders. And that when the distance was
decreased the average DAFOR value also decreased. Though there where slight differences
between the results for the hard coral and the results for the filter feeders. More research is
needed to increase the significance of these findings, and to make the findings more useful in
protecting the Sogod Bay reef systems.

5
List of Tables and Figures
Table 1: Table showing DAFOR values for CCC survey method
Table 2: Table showing the correlation coefficient values and their relation to the strength of
correlation
Table 3a and 3b: Tables to showing the data summery of Appendix 4 for both hard corals and
filter feeders respectively.
Figure 1: Diagram of a coral poly
Figure 2: Location Map of Eastern Visayas Region.
Figure 3: Topographic map of Sogod Bay showing the 26 survey sectors.
Figure 4: Graph showing average coral DAFOR value per section versus distance in metres
for all sections.
Figure 5: Graph showing average coral DAFOR value per section against distance in metres
for all sections <500m from a river mouth.
Figure 6: Graph showing average filter feeder DAFOR value per section against distance in
metres for all sections.
Figure 7: : Graph showing the average hard coral DAFOR value against the average filter
feeder DAFOR value.

6
Introduction
A coral reef is an ocean habitat which cover less than a quarter of a percent of the world‟s
oceans, but hold up to 25% of the world‟s total marine life. They are formed by colonial
organisms called Cnidarians, which secrete calcium carbonate to form an exoskeleton. This
exoskeleton grows over time producing large forms, as well as breaking and piling up, which
covers the sea bed and creates an extremely good habitat for a large variety of both plant and
animal life.
Cnidarians themselves are a phylum which contains over 9000 species which are found
exclusively in marine environments. This phylum contain 4 main classes; Hydrozoa,
Scyphoza, Cuboza, and Anthoza. Hydrozoa contain such species as the Portuguese Man o'
War (Physalia physalis ). Scyphoza species are all jellyfish (around 200 species), while
Cuboza contain all the species of box jellyfish. Anthoza contain sea anemones, sea pens, and
corals. The Anthoza species differ from the rest of the Cnidarians as they do not contain a
medusa stage in their development. Anthoza are divided into two sub-classes; Hexacorallia (6
fold symmetry) and Octocorallia (8-fold symmetry). Octocorallia contain all soft coral, sea
pens and sea fans while Hexacorallia contain sea anemones, zoanthids, and reef building
coral.
Reef building coral (Scleractinia) are multicellular coral polyps which are generally found in
communities of multiple identical individuals. Polyps are usually only a few millimetres
across, and have an outer layer of epitheluim, which surrounds an inner layer of tissue called
the mesoglae. They are radically symmetrical with tentacles which surround a central mouth.
This mouth both ingests food and excretes the waste. This mouth leads to a stomach which
closes off at the base of the polyp, where a basal plate is formed by the epitheluim. This plate
is formed by the excretion of calcium carbonate, which forms a ring. These rings grow
vertically and surround the polyp. The polyp grows by extending these vertical calices, and
over time these separate and form a new higher basal plate. Over many generations of growth
these excretions of calcium carbonate forms large coral structures and leads to the formation
of coral reefs. The rate of deposition of this calcium carbonate, while varying greatly between
species and environmental conditions, can be as much as 10 g / m² of polyp / day (0.3 ounce /
sq yd / day). This is light dependent, with night-time production 90% lower than that during
the middle of the day (Marine Reef 2006).
Polyps also have stinging cells called nematocysts, which are used to capture and immobilise
prey such as plankton. Aside from feeding on small organisms such as plankton, most corals
from a symbiotic relationship with a class of algae called zooxanthellae. This alga is supplied
with the nutrients (carbon dioxide nitrogenous waste) to photosynthesis, and in turn it will
provide energy for the coral polyp. If under stress the coral has the ability to eject the algae
(losing its colour in the process) and survive for a short time without the algae, but if the
coral does not have any algae for an extended period of time it will die. This is known as
coral bleaching.

7
Figure 1: Diagram of a coral poly
These reef systems can only be found in tropical seas, with the indo-pacific region (Red Sea,
Indian Ocean, South East Asia, and the Pacific) accounting for around 90% of all the worlds
reef systems. The other 10% of coral reefs can be found in the Atlantic and Caribbean
(Spalding et al 2001). Shallow-water reefs systems are the focus of this study, and these can
only be found in a zone extending at most from 30ON to 30
OS of the equator. This
explanation for this is that coral cannot survive in water below 18OC (Achituv & Dubinsky
1990). Temperature is not the only environmental variable that must be controlled to ensure
the growth of coral reefs; other variables include salinity, light levels, nutrient levels, pH
levels and water clarity. If these conditions are changed even slightly, the reef will cease to
grow, and may even die out. That is why reefs are usually found to grow best in sunny,
shallow, clear water. The water must be clear and shallow so that the reef can get lots of
sunlight. They rarely grow deeper than 40m and they prefer salt water. The best temperature
for coral reefs is between 25 and 31 oC and the best salinity is between 34 and 37 parts per
1000. The appropriate temperatures and salinities are most often found in the tropics.

8
The current status of reefs is one of severe peril. Ten percent of the world's reefs have been
completely destroyed. In the Philippines (the focus of this study), where coral reef destruction
is the worst, over 70% have been destroyed and only 5% can be said to be in good condition
(Ocean World 2004). This can be attributed to mostly anthropogenic effects. These effects
can include over use of the reef for food, and other such sources of income, pollution, Global
warming, and ocean acidification.
Sedimentation is also a major problem for reef systems, and will be the focus of this study. If
there is an influx of sediment into the reef systems, it can cause huge amounts of damage to
both the coral, and to the ecosystem that the coral supports. McLaughlin et al (2003) back this
up with their study on sedimentation and its effects on coral reef system on a global, regional,
and local scale. They used a combination of geospatial analysis and a database of reported
coral reef locations. They found that on a global scale, areas with large potential run off coral
systems were severely depleted. There have been many different studies done on how
sedimentation affects coral reef system, for example Dutra et al (2006) did a study on coral
reef systems in the Abrolhos area on the southern coast of Brazil. They set sediment traps at
five coral stations along the reef, where they also measured species size and diversity. They
found that there was a significant relationship between the sedimentation rate and coral cover.
Another study by Victor et al (2006) on river plumes in Pohnpei, Micronesia and they effects
on reef systems found that when the river discharged large amounts of sediment (exceeding
35 mg cm(-2) d(-1)) over the coral reefs this lead to a high mortality rate in the coral. Though
it‟s not just river plumes that cause and increase in sediment, Torres et al (2001) did
Reconnaissance surveys and benthic community mapping in Parque Nacional del Este,
southeastern Dominican Republic, and found that due to episodic sedimentation there was
low coral cover (<10%) and that this was a naturally occurring effect. They said that due to
an increase in tourism in the area, the problems that occur due to sedimentation are increased.
This shows that human impacts can compound problems and cause more damage than what
was already occurring. Though some studies such as the study by Sofonia and Anthony
(2008) have shown that some corals can be more resistant to sediment than other species of
coral, and it does depend on the makeup of the reef system, as to whether it is damaged by
are large degree or a smaller degree.
Sedimentation has also been found to hamper the actual settling of coral larvae and the
building of new reef areas. Fabricius et al (2003) found that sediment can have a extremely
adverse effect on marine snow (mostly organic detritus which contain coral larvae and other
microorganisms). They said that if the sediment level is tripled there is an increase of over
80% mortality in coral larvae.
The study itself will look at the effect of river discharge of sediment and how it effect‟s coral
reef systems. Rivers are one of the main causes of sediment influx into marine environments.
The sediment transport is dependent on the strength of the flow that carries it and its on size,
volume, density, and shape. Stronger flows will increase the lift and drag on the particle,
causing it to rise, while larger or denser particles will be more likely to fall through the flow.
Weber et al (2006) found that sediment grain size, nutrient and organic related factors were
all key in working out rates of mortality. They found that silt-sized and nutrient-rich
sediments can stress corals after short exposure, while sandy sediments or nutrient-poor silts

9
affect corals to a lesser extent. The sediment discharged by rivers is usually Terrigenous
material. This material is generally high in both nutrient levels and usually has quite a small
particle size. This means that the sediment discharge from river mouths is more harmful to
coral habitats that sediment taken from deeper water, and other sand particles moved along
the coast by such processes as long shore drift.
The focus of this study will be in the Philippines, specifically Sogod bay in Southern Leyte.
The Philippine archipelago of approximately 7100 islands forms part of the Wallacea
triangle, an area renowned for its high terrestrial and marine biodiversity. Some 499 hard
coral species (Chou 1998) and more than 2500 fish species (Lieske and Myers 2001) have
been recorded to date. The coastline is fringed with approximately 25,000 km2 of coral reefs,
about 10% of the land area of the whole archipelago (Spalding et al 2001).
Sogod Bay itself is surrounded by 131.67 km of coastline and is bordered by 11
municipalities: Padre Burgos, Malitbog, Bontoc, Sogod, Libagon, Liloan, San Francisco,
Limasawa, Pintuyan, San Ricardo and Tomas Oppus (Calumpong et al 1994). The islands of
Panaon and Limasawa also form part of Sogod Bay. The bay is characterised by naturally
limited mangrove areas, narrow coral reefs, limited seagrass beds and narrow intertidal areas
and beaches (Calumpong et al 1994). Depths in the bay reach a maximum of approximately
800 metres. There are two major rivers entering the north of Sogod Bay; the Divisoria River
in Bontoc and the Subang Daku River in Sogod. This area has been subjected to high
sediment loadings and subsequent marine life mortality (Calumpong et al 1994). There are
also numerous smaller rivers entering the bay dotted all around the bay. The population of the
surrounding area is very dependent on the coral reefs for their livelihoods through
aquaculture, fishing and tourism. Also many Filipino coastal communities only source of
protein is reef fish. With the population of Philippines (around 70 million) focused in coastal
areas this puts large amounts of pressure on the coastal environment. The greatest
anthropogenic impacts of these populations are liquid and solid pollution, overfishing, habitat
degradation, and increased sedimentation.
The study will take place on the west side of the bay, from the middle of section seven, to the
very beginning of section twelve. Below is a map of the bay and the surrounding area to give
an idea of what the bay actually looks like:

10
Figure 2: Location Map of Eastern Visayas Region.
This study was done in conjunction with research done by Coral Cay Conservation (CCC).
CCC is a non-for profit organisation founded in 1989. “This organisation is dedicated to
providing resources to protect livelihoods and alleviate poverty through the protection,
restoration and sustainable use of coral reefs and tropical forests in collaboration with
government and non-governmental organisations within a host country” (Coral Cay
Conservation 2006). CCC does not charge for this service and is funded by the volunteer
divers and fund raising activities. The actual CCC Southern Leyte reef conservation project
(SLRCP) started in 2002 and the objectives of this project are four-fold. Firstly the project
aims to undertake a comprehensive survey of the coastal marine resources, secondly the
project looks to collect quantitative data on the ecologically and commercially important
species, thirdly this project undertakes community education and capacity building to help
increasing understanding of the marine environment, and finally the project aims to produce
detailed habitat maps for us as an educational and planning tool in the designation of marine
protected areas (MPA).

11
The first study of the marine resources in the Southern Leyte area was done by Koch (1993).
This study looked at the physical and biological conditions of the near-shore environment of
Southern Leyte. The study interviewed local people and found that the fish catches had been
decreasing. These interview results were backed up by extensive marine surveys which found
that the coral reefs of the area were extensively damaged as well as other key marine habitats.
Koch (1993) said that this was due to anthropogenic effects both on land and in the sea. Koch
recommended that due to the damage that the reef had sustained, protected marine reserves
must be established to promote recovery and protection of the reef. From the survey data it
was estimated that 50% of the reef had been totally destroyed. Another 30% of the reef had
been heavily damaged with only 25% of the reef itself remaining in a natural state. This state
of reef health is the norm for most of the Philippines reef systems, with 97% of it predicted to
be under treat (Spalding et al 2001).
As stated before there has been a lot of research done into sedimentation and its effect on
coral systems. There have been many studies done around the world, each focusing on
different things, some focusing on coral reactions, and some focusing on the distance of the
coral from the sedimentation source. These studies though, look at well known areas of coral
such as the Caribbean, and Australia. There has been little research done in the actual
Philippine area, with only a few studies done in Southern Leyte as to the state of the coral
reefs and what is actually causing coral degradation in the area. The rationale for this study is
that it will increase the understanding of the coral systems in the Sogod Bay area, and also
wishes to address the effects of the discharge of sediment into the surrounding bay area. This
study is essential because only an in-depth, on-site study can be used to analysis the effects of
the sediment on coral health in the Sogod Bay area. As Spalding et al (2001) has said, 97% of
the Philippines reef system is under threat, and any research giving new information that can
be used to protect and conserve these reef systems can only be a useful and worthwhile
endeavour.
The aims and objectives of this study are to look at the discharge of sediment into Sogod bay
area and to look at the effects of this sediment in the coral eco-system. Also to see if there is a
high amount of sediment being discharged into this bay area, what effects that will have on
the coral systems around it, and if you move further away from the source of the sediment
does the effect of the sediment dissipate, and if so, by how much.
The Alternate Hypothesis for this study is that if reef health is related to distance from a river
mouth, then the average DAFOR value for Hard Coral and Filter Feeders will significantly
decrease the closer the reef gets to a river mouth. The Null hypothesis for this study is that
the average DAFOR value for both hard coral and filter feeders will not significantly
decrease the closer the reef gets to a river mouth.

12
Literature Review
As stated before a big factor affecting coral reefs is sedimentation. Coral reef researchers
recognized that coral reefs were strongly inhibited wherever muddy freshwater enters the sea
by realizing that gaps in continuous fringing and offshore reefs faced the river mouths.
Goibuu et al ( 2008) and Victor et al (2006) both did a studies in Pohnpei, Micronesia on how
the coral community changed along a gradient which gradually increased its exposure to a
muddy river discharge plumes (which was worked out at exceeding 35 mg cm(-2) d(-1) by
Victor et al (2006)), and their results found that the most river impacted site had low coral
cover and diversity and high amounts of mud. This shows that the negative impacts of rivers
include effects of sediments. This was much the same in the Dutra et al (2006) study in
which the results were the same.
Corals differ greatly in their ability to resist sedimentation, with most species being highly
intolerant of even small amounts while a minority are able to tolerate extremely muddy
conditions, and a few are even able to live directly in muddy bottoms. Another study to show
this is the study by Ochoa-Lopez et al (1998) where following an event of excessive
terrigenous sediment input into the marine system. This input had occurred due to over-
grazing and meant large amounts of sediment ran into the rivers. The sediment primarily
damaged the coral colonies and caused a decrease in the amount of rocky shores for coral to
settle on, this study was the first recorded sedimentation damage to the coral reefs in the
islands in the Mexican Pacific. Restrepo et al (2006) looked at the sediment discharge from
The Magdalena River, and found that due to the fact that there has been a constant and
prolonged exposure of the coral reefs to sediment has contributed greatly to partial decay of
coral formations and sea grass beds, it has also lead to a rise in algal percentage cover, though
the author has stated that there were other effects such as anthropogenic and sea temperature
rise.
McLaughlin et al (2003) looked at sediment run off on a regional- global scale, they uses a
geospatial clustering of a coastal zone database of river and local runoff identified with 0.5
degrees grid cells to identify areas of high potential runoff effects, and combined this with a
database of reported coral reef locations and they found that on a global scale areas with a
high potential run off had significantly less reef systems. Another study done in the
Dominican Republic by Torres et al (2001) looked at sedimentation in the area and found that
it was episodic. This meant there was low coral cover (<10%) and that this was a naturally
occurring effect due to the episodic sedimentation. They said that due to an increase in
tourism in the area, the problems that occur due to sedimentation were being increased.
Sofonia and Anthony (2008) did a study on Turbinaria mesenterina one of the baseline data
set target coral species. They found that in a lab situation T.mesenterina could survive
sediment one order of magnitude higher than any sediment load recorded in the field. The
sediment tolerant corals are able to push sediment off their surface through a variety of
mechanisms, but these all require expenditure of metabolic energy and when sedimentation is
excessive they eventually reach the point where they can no longer spare the energy to keep
themselves clean, and the affected tissue dies back. Though it not just the coral itself that can

13
clear sediment, Stewart et al (2006) found that coral with symbiotic crabs living with it
survived high sediment loads as well, which shows that it not just the coral itself that decides
the mortality rate. Though sediment does not just affect established hard coral. Fabricius et al
(2003) found that sediment introduction into marine snow, which contains the coral larvae,
increased the mortality by >80% when the sediment level was tripled.
Another factor that affect the rate of mortality of coral from sedimentation is the type of
sedimentation. Weber et al (2006) found that sediment grain size, nutrient and organic related
factors were all key in working out rates of mortality. They found that silt-sized and nutrient-
rich sediments can stress corals after short exposure, while sandy sediments or nutrient-poor
silts affect corals to a lesser extent. This means that the different types of sediment being
discharged onto the reef will affect it to different degrees.
Human impacts also have an impact on the level of sedimentation in coral reefs. Guzman et al
(2008) looked at the historic effects that the construction of the Panama Canal had on the
surrounding reef systems, they found that as construction continued and more sediment was
discharged into the system, the mortality rate of the coral also increased. Ryan et al (2008)
did a similar study but looked at a coastal village that had received significant development
over the last few decades. They found that there had been a significant increase in sediment
and a decrease in coral cover. A third study that looks at anthropogenic impacts was Meng et
al (2008) in which they found that due to high amounts of runoff from Nanwan Bay there was
an increase in nutrients and suspended particles which caused a decrease in coral cover. This
shows that it doesn‟t always have to be singular events which cause coral mortality there can
just be a high urban density which causes an increase in sediment and coral death.
The sediment may just not affect the coral itself, but also the area in which the coral settles.
As coral need a rocky substrate to grow and without it, it cannot settle. Airoldi (2003) found
that increase in sediment discharge causes scourging, burial and profound changes to the
coast, which can lead to stress and disturbance. This can cause less coral to settle here and
coral coverage to decrease.
Sedimentation does also affect fish numbers. Hawkins et al (2008) found that during a set
period of time coral cover declined by 46% in reserves and 35% in fishing grounds in St.
Lucia. Multiple regression showed that 28% of the variance of biomass build up in the
reserves and fishing ground was explained by sedimentation, a process known to stress reef
invertebrates, significantly reducing the rate of biomass build-up. Though this does not seem
like a high percentage it does show that sedimentation does also have an effect on different
types of organism not just fish. Sediment can also affect bi-valves Thomsen and McGlathery
(2006) found that accumulations of sediments and drift algae have an adverse impact on
sessile temperate reef organisms (specifically oysters), reducing richness and abundance, but
favouring a few small opportunistic taxa. As the reef-generating oysters themselves
performed poorly under these stressors, the long-term impact of the causes of these stressors,
eutrophication and urbanization, is likely to be diminished reefs with cascading adverse
effects on sessile reef organisms.

14
Though if there is a decrease in coral cover it means that the reef system finds it very hard to
return to what it was. Chazottes et al (2008) looked at sediment effect on three different areas
of reef at Reunion Island. They found that the composition of reef bottom sediments and
suspended particles showed that in locations where algal communities prevailed over corals
as a result of nutrification, a shift from coral to coralline algae dominated sediments could be
observed. In addition, a decrease in sediment production and a prevalence of very fine sand to
mud sized gains over medium to fine sands existed in the nutrient-enriched areas. This grain-
size difference probably is caused by a decrease in grazing activity in the enriched areas.
High proportions of coralline algal debris and sponge spicules were specifically found in the
sediments within areas receiving high nutrient input. This high proportion could mean that as
the coral has died everything else beings to die with it.

15
Method
The method for this project follows the following outline. The area of Sogod Bay is
approximately 131 km in length, with the bay itself being a maximum distance of 15km
across. To make surveying this area easier, it has been split into 26 survey sectors each
approximately 5km in length. This can be seen in map below:
Figure 3: Topographic map of Sogod Bay showing the 26 survey sectors.
For this project only sectors 7 to 12 were used, which covers the west coast of Sogod Bay,
approximately 28 km in length. In these sectors transects were placed firstly at 1km intervals,
with some sectors having follow up transects done at either 250m or 500m intervals.
For the actual data collection and surveying, volunteers were used. Each volunteer went
through a training program lasting two weeks, which included both lectures, dives, and tests
which are coordinated by the project scientist (PS) and a science officer (SO). This training
program ends with a series of tests which include computer slide tests, and in-water pointer

16
exercises to make sure that the volunteers have to appropriate knowledge of the survey
subject. To also make sure that the volunteers have the ability to collect quality data while
surveying they also undertake two validation exercises. These exercises are done on a pre-set
30m transect under the supervision of the PS and SO. The transect is surveyed by both the
volunteers and the PS and SO, and their data is then entered into a spreadsheet and compared
using the Bray-Curtis similarity coefficient (Bray and Curtis, 1957):
In this equation Xij is the abundance of the ith species in the jth sample and where there are p
species overall.
Using this equation the PS and SO survey results are compared with the volunteers survey
and if the results match the volunteers are then allowed on actual surveys. CCC have also
done a study (Mumby et al., 1995) to critically assess the accuracy of volunteer divers
conducting baseline transect surveys, to make sure that this method of data collection in valid
and accurate.
The actual survey method itself involved a team of divers who undertake a transect survey
from 18m depth (28m if the reef extends below 18m) to the reef crest. The surveys that were
done along these transects included a fish and benthic survey which focus on life-forms and
families as well as certain target species, which are abundant, ecologically or commercially
significant, or easily identifiable. Hard corals were also surveyed, and recorded as life-forms
as described by English et al (1997), as well as 36 target corals which were identified to a
species or genus level. Fish were generally identified to family level (45 families of fish) with
a total of 104 important target species also being identified. Also algae was classified to three
groups‟: red, green and brown algae, and identified to life form, genera, or species. Sponges
and soft corals were also identified in various life form categories.
Most transects did require more than two dives to complete so they are divided up into sub-
transects, with each of these sub transects being covered by a team of four trained divers,
each divided up into buddy pairs (A and B). At the start of the sub-transect buddy pair B
remained at the beginning of the transect, with diver 3 holding the end of a 10m rope, buddy
pair A then proceeded to swim away from buddy pair B navigating up the reef slope on a set
bearing until the rope becomes taught. This was repeated until the end of the dive profile or
until the desired transect length had been reached. A Surface Marker Buoy (SMB) is then
placed to show the next team of divers where to begin their own sub-transect. Once this has
been done surveying can begin.
Diver 1 was responsible for leading the dive, taking depth measurements at the beginning and
end of the dive and at every 10m interval, and he/she was also responsible for noting down
signs of anthropogenic impacts on the reef, as well as describing the substratum by recording
the presence of six substratum categories (dead coral, dead coral with algae, bedrock, rubble,
sand and mud) in a 2.5m area either side of the transect line. Diver 2 was responsible for the
fish survey, which entails surveying the area 2.5m either side of the transect and also 5m

17
above the transect, and noting down numbers, families, and target species. Diver 3 was
responsible for the hard coral survey. This is where all coral life forms (Acropora and Non-
Acropora) are noted down 1m either side of the transect and the percentage cover is also
noted down. Also all target species found were noted down and their percentage cover was
also noted down. Diver 4 surveyed benthic organisms, algae, and other reef organisms
(including sponges, soft corals etc). This survey was done on a 2.5m area either side of the
transect line. During the course of the sub-transect survey divers may come across more than
one habitat type, based upon either geo-morphological or biological differences. As such the
survey was then split and the data gathered from the two separate habitat types was recorded
separately.
After the data from these surveys was collected it was assigned an abundance rating taken
from the ordinal scale below:
Table 1: Table showing DAFOR values for CCC survey method.
For the coral and other colonial invertebrates and macroalgae the following measurements
were used: None = 0% coverage, Rare = 1-10%, Occasional = 11-25%, Frequent = 26-50%,
Abundant = 51-75% and Dominant = 76-100%.
During the survey certain readings were also taken, these included water temperature at the
surface and at the start of the survey, salinity samples were also taken at both the surface and
depth (using water bottles carried by divers), and also horizontal visibility was measured by
diver estimation. Vertical visibility was measured by seechi disc reading, taken from the boat
at the end of the dive. Survey divers also noted down current direction and estimated its
strength („None‟, „Weak‟, „Medium‟, „Strong‟). Also wind strength and direction was taken
from the boat at the end of the dive using the Beaufort scale, and the direction marked down
as one of 8 compass points.
The anthropogenic factors were also assessed on the surface as well as underwater by Diver
1. Surface impacts were classified as „litter‟, „sewage‟, „driftwood‟, „algae‟, „fish nets‟ and
„other‟. Sub-surface impacts were categorised as „litter‟, „sewage‟, „coral damage‟, „lines and
nets‟, „sedimentation‟, „coral disease‟, „coral bleaching‟, „fish traps‟, „dynamite fishing‟,
„cyanide fishing‟ and „other‟. All information was assessed as presence/ absence and then
converted to binary data for analysis. Any boats seen during a survey were recorded, along
with information on the number of occupants and its activity. The activity of each boat was
categorised as „diving‟, „fishing‟, and „pleasure ‟or „commercial‟. Finally the divers recorded
a general impression of the site during each survey. These ratings were completed for
biological (e.g. benthic and fish community diversity and abundance) and aesthetic (e.g.
topography) parameters. Both parameters are ranked on a scale. The survey form for this
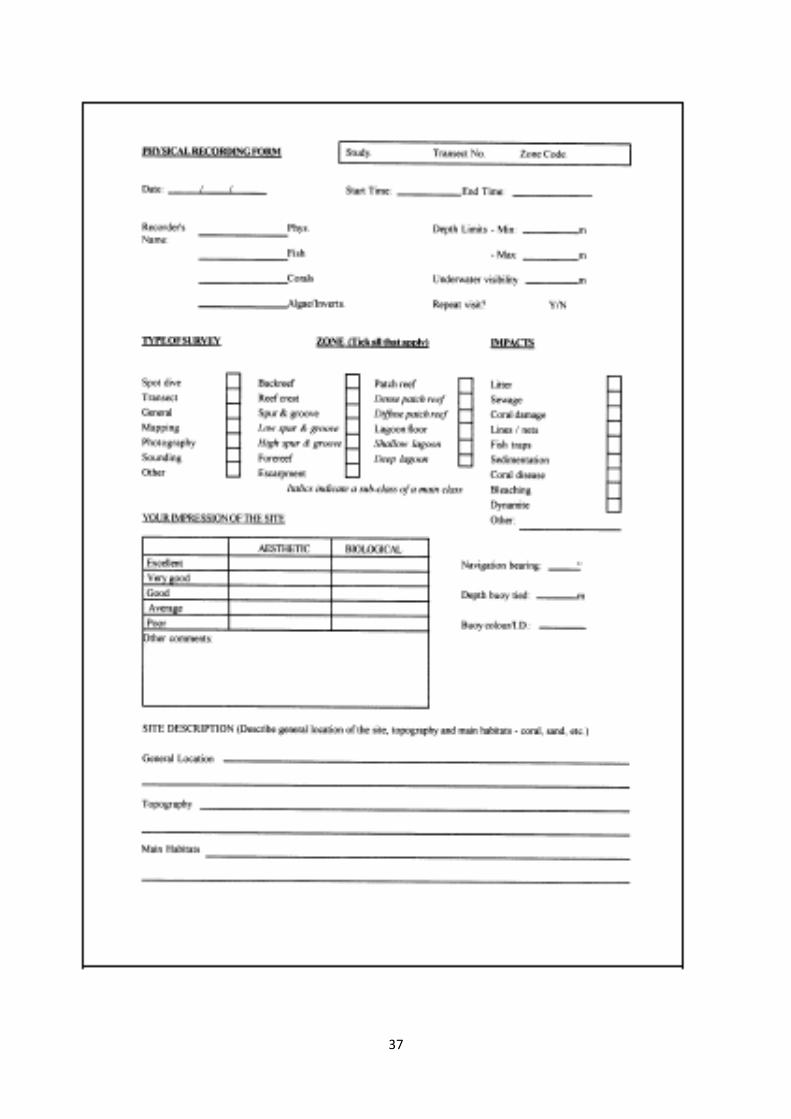
method can been found in Appendix 1.

18
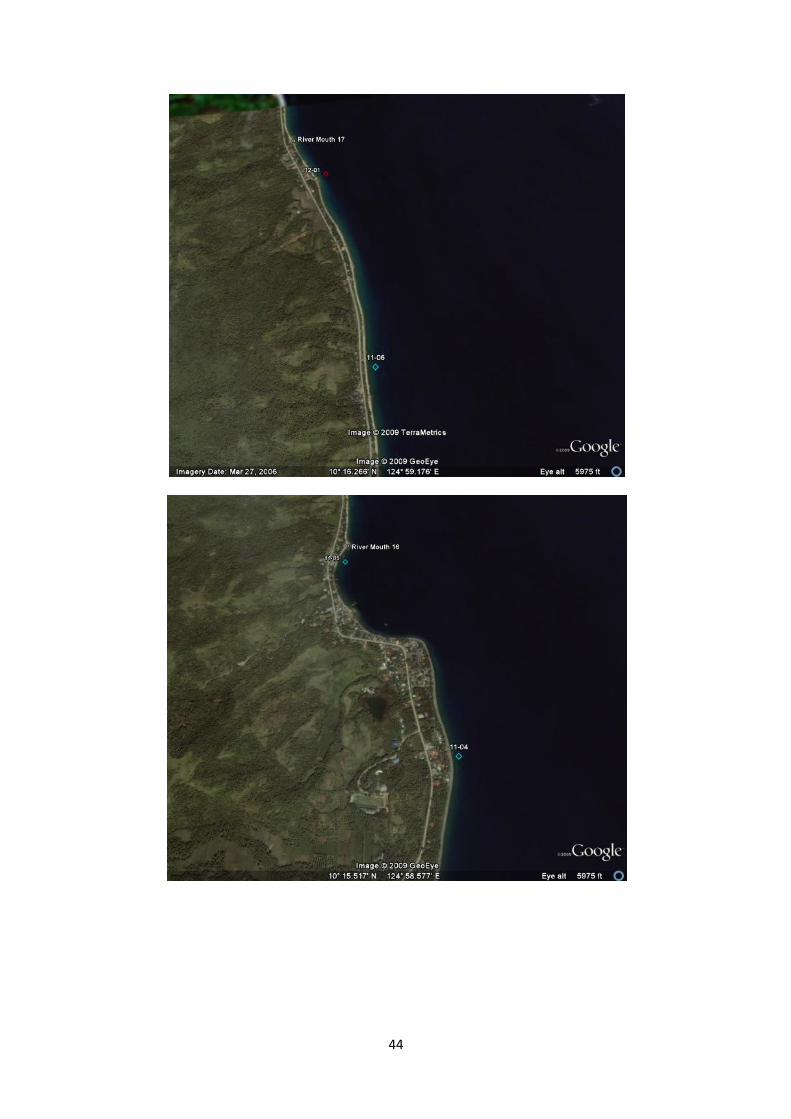
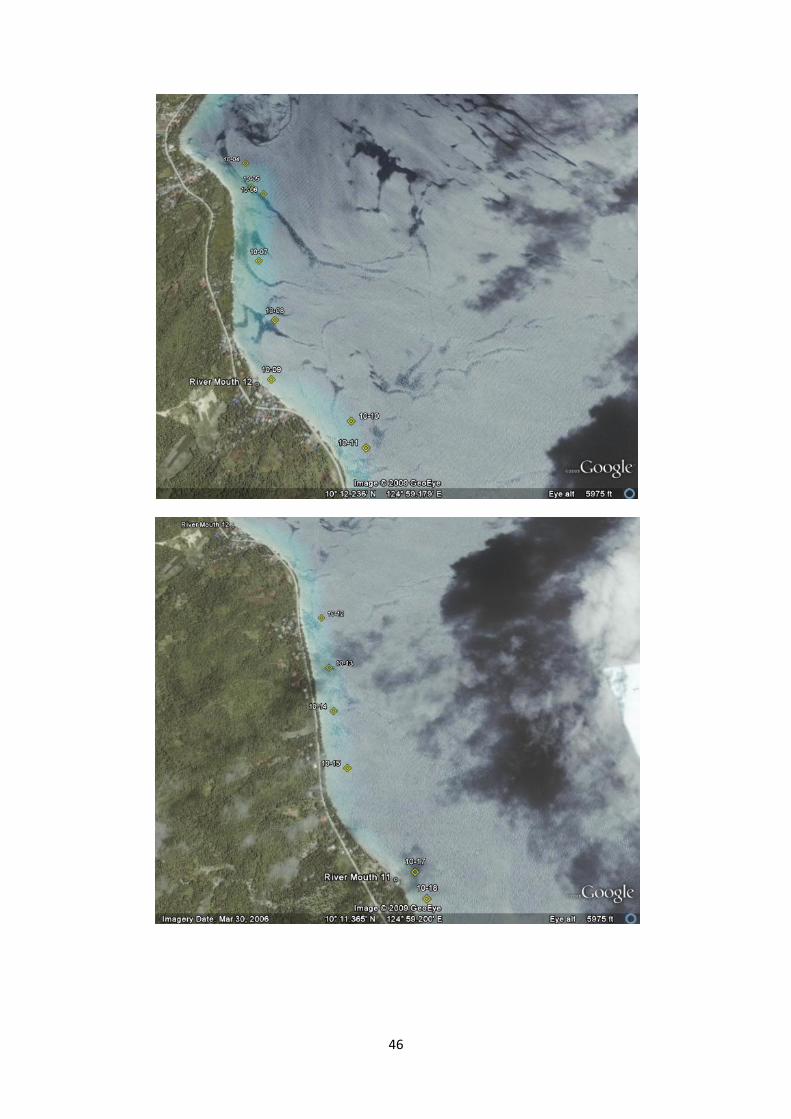
The data used in this study was recorded as follows. All section locations (7-01, 7-02, 7-03,
etc) were first plotted into Google Earth using their GPS locations (Appendix 2). Also using
Google Earth‟s satellite images all river mouths in the study area were found and their GPS
locations noted down for later use. The distance between the transect locations and the river
mouths was then measured using Google Earth‟s in-built ruler. These distances were then
plotted on the results table.
Next the average DAFOR readings for each section were recorded in the results table. These
average readings were taken for both the hard coral and for the filter feeders. Only the
DAFOR values for hard coral target species and for target species that are filter feeders (soft
corals, sponges, and
Corallimorphs) were used with the list of actual species used in these two groups found in
Appendix 3. To get these readings, the average for all the individual surveys in each transect
section was taken and these readings were then recorded in the results table.
To analyse the data linear regression was used, specifically the Pearson Product Moment
Correlation Coefficient (Pearson r). This statistical analysis is used for interval or ratio data
(The study data being ratio in nature). This analysis was used to show if there was a
correlation between the two variables (this studies variables being distance from the nearest
river mouth (in metres) and the average DAFOR value for each section) and if so how strong
the correlation was. This correlation was shown using the correlation coefficient (r). This
coefficient was used to indicate the strength of the relationship, where a higher positive
correlation indicates a stronger relationship; this is shown on the table below:
Correlation Coefficient r (positive /negative) Strength of Correlation
0.0 to 0.19 Very Weak
0.20 to 0.39 Weak
0.40 to 0.69 Moderate
0.70 to 0.89 Strong
0.90 to 1.00 Very Strong
Table 2: Table showing the correlation coefficient values and their relation to the strength of
correlation.
Also the Coefficient of Determination (r2) was used, which is a useful measure to show the
strength of association between the two variables. The range of this value is 0 to 1 and is
never negative. The coefficient of determination (r2) gives the proportion of the variation
observed in the „y‟ variable explained by the variation in the „x‟ variable. It is also multiplied
by 100 to express the %r2 which then gives the percentage of the data that is explained
through other variables and phenomena.
The only problem with using this test is that the correlation between the two variables does
not necessarily mean causation, but this will be covered in the discussion.
Next after the correlation between the two variable of distance and DAFOR average, the data
was analysed to see if the correlation is actually significant. To do this we used the most
common approach, which is to test whether a sample correlation coefficient (r) could have
come from a population of correlation coefficients with a parametric correlation coefficient

19
(ρ) equal to zero. This can be done by using a t-test with two degrees of freedom, which
would be shown as this; with r being the correlation coefficient, n being the number of
sections, and r2
is the coefficient of determination:
21
2
r
nrt

20
Results
The following sections outlines the results gained from the study of the effect of
sedimentation on coral reef systems in Sogod Bay in Southern Leyte, Philippines. The data
for section 7 to 12 can be found in Appendix 4. This table contains both the data for the hard
coral and for the filter feeders. Below is the data summary for both sets of data:
Hard Coral
Mean distance (x) 468.854
Mean DAFOR (y) 0.329
Sum of distance (∑x) 38466
Sum of DAFOR (∑y) 26.975
Sum of both (∑xy) 16219.495
Sum of distance squared (∑x2) 27109580
Sum of DAFOR squared (∑y2) 11.592
Table 3a and 3b: Tables to show the data summery of Appendix 4 for both hard corals and
filter feeders respectively.
The following calculation was used to find the Regression Equation for the hard coral data:
xxx
yxxyb
2 and )(xbya
Hence:
xxx
yxxyb
2
)38466468.854(27109580
)26.975468.854(16219.495
b
036.9074642
158.3572b
000394.0b
and
)(xbya
)854.468000394.0(329.0 a
144.0a
Filter Feeders
Mean distance (x) 468.854
Mean DAFOR (y) 0.467
Sum of distance (∑x) 38466
Sum of DAFOR (∑y) 38.306
Sum of both (∑xy) 21900.737
Sum of distance squared (∑x2) 27109580
Sum of DAFOR squared (∑y2) 23.885

21
Hence the Regression Equation is:
y = 0.144 + 0.000394(x)
The corresponding plot of average Hard Coral DAFOR value against distance from source is:
Figure 4: Graph showing average coral DAFOR value per section versus distance in metres
for all sections.
The Pearson Product Moment Correlation Coefficient (Pearson r) for the hard coral data was:
))(( 22 yyyxxx
yxxyr
)975.26329.0(592.11)(38466854.468(27109580(
)975.26854.468(495.16219
r
717.2036.9074642
158.3572
r
41.24655802
158.3572r
0.000
0.100
0.200
0.300
0.400
0.500
0.600
0.700
0.800
0 200 400 600 800 1000 1200 1400 1600 1800
Ave
rage
DA
FOR
val
ue
Distance /m
Graph Showing Average Coral DAFOR Value Per Section versus Distance /m. (All Sections)

22
461.4965
158.3572r
719.0r
This high positive correlation coefficient (r = 0.719) indicates that a strong relationship exists
between the average DAFOR value and distance from the nearest river mouth. Since „r‟ is
positive we assume that the relationship between the average DAFOR value and distance
from the nearest river mouth is positively correlated, that is, as distance increases we would
expect to see a corresponding increase in the DAFOR average.
The Coefficient of Determination (%r2) is in this case r = 0.719 and r
2 = (0.719)
2 = 0.517
hence % r2 is 51.7%. As such 51.7 % of the variation observed in the average DAFOR scale
(y variable) is explained by the variation in distance from river mouth(x variable). Therefore
100 – 51.7 = 48.3 % of the variation in DAFOR average is not accounted for by variation in
distance and thus attributable to other phenomenon. This will be looked at later in the
discussion and analysed in more detail.
The next part of the data analysis is the Student t-test to see if the results are significant. This
is carried out be tested by a t-test with n-2 degrees of freedom. If we apply this to the hard
coral data we obtain:
21
2
r
nrt
870.12719.06.165719.0483.0
80719.0
719.01
282719.0
2
t
254.9t
Inspection of the critical value table (Appendix 5) reveals that the critical t-value for
significance level probability = 0.005 with 80 degrees of freedom (t 0.05[80]) is ± 2.639. The
calculated t = 9.254 > the critical-t (t 0.05[80]) = 2.639. This means that observed correlation
coefficient is not drawn from a population with a parametric correlation coefficient of zero.
This means that the correlation coefficient in this case (r = 0.719) is significant and is
therefore meaningful.
This then concludes the fact that the correlation between the average DAFOR value and the
distance from the nearest river mouth (r = 0.719) is significant (P<0.005). In fact the critical
value table revels that the critical t-value for significance level probability = 0.0005 with 80
degrees of freedom (t 0.0005[80]) is ± 3.416 so it can be concluded that the correlation between
the average DAFOR value and the distance from the nearest river mouth (r = 0.719) is
significant (P<0.0005) and that the confidence level in this data is 99.9%.
This data‟s trends show the following things. First you can see from the graph of average
hard coral DAFOR value against distance /m (Fig. 1) that there is a positive correlation

23
between distance and average DAFOR value. This is reiterated in the Person r value. Though
it is interesting to note that after around 200m from a river mouth, the range of the average
DAFOR value begins to increase with a low of 0.208 and a high of 0.705. In Figure 2 below
of average hard coral DAFOR value against distance /m for all sections which are less than
500m from a river source, you can see that there is a very strong positive correlation between
distance and the DAFOR value:
Figure 5: Graph showing average coral DAFOR value per section against distance in metres
for all sections <500m from a river mouth.
The data used in this graph can be found in Appendix 4 and it covers each point along the
coastline of Sogod bay that is 500m or less from a river mouth.
The following Regression Equation is for the filter feeder data:
xxx
yxxyb
2
)38466468.854(27109580
)306.83468.854(737.19002
b
036.9074642
816.3940b
0.000
0.100
0.200
0.300
0.400
0.500
0.600
0.700
0 100 200 300 400 500 600
Ave
rage
DA
FOR
val
ue
Distance /m
Graph Showing Average Coral DAFOR Value Per Section versus Distance /m. (<500m)

24
000434.0b
and
)(xbya
)854.468000434.0(467.0 a
264.0a
Hence the Regression Equation is:
y = 0.264 + 0.000434(x)
The corresponding plot of average Filter Feeder DAFOR value against distance from source
is:
Figure 6: Graph showing average filter feeder DAFOR value per section against distance in
metres for all sections.
The Pearson Product Moment Correlation Coefficient (Pearson r) for the filter feeder data is:
))(( 22 yyyxxx
yxxyr
)306.38467.0(885.23)(38466854.468(27109580(
)306.38854.468(737.21900
r
0.000
0.200
0.400
0.600
0.800
1.000
1.200
0 200 400 600 800 1000 1200 1400 1600 1800
Ave
rage
DA
FOR
val
ue
Distance /m

25
996.5036.9074642
816.3940
r
65.54411553
816.3940r
419.7376
816.3940r
534.0r
This positive correlation coefficient (r = 0.534) indicates that a moderate relationship exists
between the average filter feeder DAFOR scale and distance from the nearest river mouth.
Since „r‟ is positive we can assume that the relationship between the average filter feeder
DAFOR value and distance from the nearest river mouth is positively correlated, that is, as
distance increases we would expect to see a corresponding increase in the DAFOR average.
The Coefficient of Determination (%r2) is in this case r = 0.534 and r
2 = (0.534)
2 = 0.290
hence % r2 is 29%. As such 29% of the variation observed in the average filter feeder
DAFOR value (y variable) is explained by the variation in distance from river mouth(x
variable). Therefore 100 – 29 = 71% of the variation in DAFOR average is not accounted for
by variation in distance and thus attributable to other phenomenon. Like the hard coral
coefficient of determination this will be discussed and analysed in greater detail in the
discussion.
The Student t-test for the filter feeder data is also carried out be tested by a t-test with n-2
degrees of freedom. The results of this test are as follows:
21
2
r
nrt
578.10534.09.111534.0715.0
80534.0
534.01
282534.0
2
t
649.5t
Inspection of the critical value table (Appendix 5) reveals that the critical t-value for
significance level probability = 0.005 with 80 degrees of freedom (t 0.05[80]) is ± 2.639. The
calculated t = 5.649 > the critical-t (t 0.05[80]) = 2.639. This means that observed correlation
coefficient is not drawn from a population with a parametric correlation coefficient of zero.
This means that the correlation coefficient in this case (r = 0.534) is significant and is
therefore meaningful.
This then concludes the fact that the correlation between the average filter feeder DAFOR
value and the distance from the nearest river mouth (r = 0.534) is significant (P<0.005). In
fact the critical value table revels that the critical t-value for significance level probability =
0.0005 with 80 degrees of freedom (t 0.0005[80]) is ± 3.416 so it can be concluded that the

26
correlation between the average DAFOR value and the distance from the nearest river mouth
(r = 0.534) is significant (P<0.0005) and that the confidence level in this data is 99.9%.
The trends in the filter feeder data is as follows. The graph (Fig. 3) shows that there is less of
a positive correlation between the average DAFOR value and distance from the nearest river
mouth and that the actual DAFOR values are a lot more scattered than in the hard coral data.
The DAFOR values range from 0.000 to 1.111 and both these values are the lowest and
highest respectively. The sections with these values though, are not the sections which are the
closest and farthest away from river mouths. This is confirmed in the Pearson r value of
0.534. This value shows that there is only a moderate correlation between the two variables,
unlike in hard coral where there is a strong correlation between the two variables. This is also
backed up by the Coefficient of Determination which states that only 29% of the actual data
is due to distance and that the rest is down to other variables and phenomena.

27
Discussion
The fact that both results are significant with the calculated t value for hard coral being 9.254,
and the calculated t value for the filter feeder data being 5.649 both being greater than the
critical t value of ± 3.416 (p<0.0005) we can answer the hypothesis posed in the introduction.
In relation to the hypothesis of this study we reject the null hypothesis in favour of the
alternate hypothesis which states that that if reef health is related to distance from a river
mouth, then the average DAFOR value for Hard Coral and Filter Feeders will significantly
decrease the closer the reef gets to a river mouth. This is relationship can be seen both the
graphs of the hard coral and the filter feeder DAFOR average values against distance from
the nearest river mouth (Fig. 4 and Fig. 6). These graphs show a positive correlation between
the average DAFOR values and the distance from the nearest river mouth.
This statement is supported by a whole range of studies and supports what was said in the
introduction. We now know that much like the rest of the worlds reef systems sedimentation
does have an adverse effect on hard corals and complete reef systems in the Philippines,
much like the trends laid out by Victor et al (2006) and Torres et al (2001). This proves that
sedimentation is having huge effect on the reef health in the Sogod Bay area. With only a
small section of the bay area covered by this study, we can see correlations between distance
from river mouths and the reef health measured by the average DAFOR values.
Though there is an interesting trend in the data which shows that the hard coral DAFOR
value seem to increase in range after around 200m from a river mouth, the range of the
average DAFOR value having a low of 0.208 and a high of 0.705 (Fig.1). After looking at the
scatter graph we can see that if the distance is less than 200m there is a very definite trend
line and the points are all tightly grouped together. This tightly grouped trend has a high
positive correlation, which backs up the fact that within around 500m of the nearest river
mouth, the main factor that affects reef health is sedimentation (Fig.2). An explanation of
this trend could be that the sedimentation has a very drastic effect in the radius of 200m
around the river mouth but after that begins to become diffuse as the distance increases. This
small size of river plume could be because the rivers found in sections 7 to 12 are not the
largest rivers found draining into Sogod bay, or that the rivers themselves do not carry as
much sediment as many of the larger northern river found in Sogod bay. This means that the
larger variation in DAFOR values after around 200m- 500m may be due to different variables
or that these readings are the general hard coral variations for a healthy reef system. This
value of 200m-500m as that maximum distance in which river discharge seems to have the
greatest effect, needs more research done and the recommendations for this research will be
discussed later one.
Though there is a slight difference in the strength of these correlations, with the hard coral
having a strong relationship (r value = 0.719) and the filter feeder only having a moderate
relationship (r value = 0.534). This difference in the strength of the correlations could be
explained with a multitude of reason. One of the strong possibilities that due to the fact that
filter feeders such as sponges and Corallimorphs do not rely on photosynthesis for the
generation of most of their energy, the more nutrients discharged from rivers onto the reef

28
can only be a good thing. It has been proven that rivers do discharge more nutrients into
marine habitats (Meng et al 2008) and as such this could mean more food for filter feeders,
while killing of hard coral species as hard corals cannot survive in areas of high nutrient
content. This would explain why there is always a higher DAFOR value average for filter
feeders in all sections compared to hard coral DAFOR values, but not why there seems to be
less change in the DAFOR values of filter feeders over the whole range of distances.
This smaller variation in DAFOR values and the fact that only a moderate correlation found,
could be because the filter feeders are more reliant on other variables, and that sedimentation
level is not such a big factor in filter feeder abundance than it is in hard coral abundance
level. This can be seen in the fact that the Coefficient of Determination (%r2) is only 29%.
Instead the filter feeder abundance could be more related to hard coral abundance than first
thought. It could be because hard coral abundance decreases the closer to river mouth the reef
gets, that the filter feeder abundance decreases. The scatter plot below (Fig. 7) shows
Average Hard Coral DAFOR value against Filter Feeder DAFOR value (data taken from
Appendix 4):
Figure 7: Graph showing the average hard coral DAFOR value against the average filter
feeder DAFOR value.
As can be seen in the above scatter plot there seems to be a greater relationship between hard
coral and filter feeders than what was previously thought. The Coefficient of Determination
(%r2) for this graph is 43.4% which is greater than coefficient of determination of the graph
of filter feeders against distance. This means there is a greater correlation between the two
groups of organisms. This could mean that the reef building coral is not just depended on by
fish and other organisms (Hawkins et al 2008) but also by sessile organisms like sponges, soft
R² = 0.4342
0.000
0.200
0.400
0.600
0.800
1.000
1.200
0.000 0.100 0.200 0.300 0.400 0.500 0.600 0.700 0.800
Ave
rage
Filt
er
Fee
de
r D
AFO
R v
alu
e
Average Hard Coral DAFOR value
Graph of Average Hard Coral DAFOR value against Filter Feeder DAFOR value

29
corals, and Corallimorphs. The problem is that only 43.4% of the filter feeder DAFOR
values can be explained by the abundance of hard coral (Fig. 7). If we combine the two
coefficients of determinations of Figures 6 and 7, we still only get a total of 72.4% of this
data explained. This means that there are still other variables unaccounted for in this study.
These could be such things as anthropogenic effects, current, depth, etc.
This problem of unexplained variables is the main drawback of using linear regression and
the “Pearson r” method as a statistical analysis. The drawback is the fact that correlation
between the two variables does not always explain causality. This is seen in the fact that we
can conclude that as distance from a river mouth decreases the average DAFOR value of the
hard coral also decreases. But we cannot conclude that this decrease in the DAFOR value is
caused by the decrease in distance. And as we cannot conclude the fact that one variable
causes the other, the fact that another variable such as amount of fishing in the area could be
the cause of this relationship could be a possibility. The fact that this drawback can be solved
by more research done on different variables will be covered when further research is
proposed.
Though carrying on from the other variables as a factor, if we look at the anthropogenic
factors we can see there seems to be less of a trend with villages and towns having an effect
on the health of the coral system. We can use the satellite data gained from Google Earth to a
certain degree. If we look at Appendix 2 we can see that Sections 9-09 and 9-08 are right by a
rather large town on the coast. These two sections are right in the middle of two rivers
(Rivers 8 and 9), but if we look at the results table found in Appendix 4 we can see that they
have comparatively the same DAFOR values as other sections along the coastline which are
nowhere near villages or towns, and in some cases such as section 10-23 which has a average
hard coral DAFOR value of 0.312 the DAFOR values of sections 9-09 and 9-08 are in fact
higher. This comes into contest with previous studies which have stated that anthropogenic
factors increase sedimentation, and harm to coral (Thomsen and McGlathery 2006; Restrepo
et al 2006). This phenomena could be explained by the fact that as the area surrounding the
coast is not very developed. As such the normal pollution levels, population levels, and other
such anthropogenic factors that you would expect to find in a normal town or village do not
apply to this area (levels that were found in the two previous studies mentioned). This would
mean that if the anthropogenic effects are lower in this part of the world, the reef systems are
not so damaged and as such healthy. Also if the anthropogenic effects are having less of an
impact on corals, it may give the reef time to become acclimatised to the anthropogenic
effects and gain a bit of a resistance to the greater variability in the environment. This is one
of the more interesting points to come out of the study, even if it is not the main focus of the
study itself. More research into the area surround the Sogod Bay coastline should be done, so
that more of an idea of the actual anthropogenic impacts the towns and small fishing villages
can be established. Also it would be recommended that the study done by Koch (1993) should
be updated, so that new data on the locals opinion on the reef, and the actual fishing catches,
can be created which would give more of an idea of how the reef provides for the locals in
the area.

30
Another point to look at is the fact that some sections within around 160m of the nearest river
mouth have a higher DAFOR value than the other sections with the same distance (sections
8-09, 8-15, 9-12, 9-19, 10-09, and 10-17). It could be because these rivers are discharging
less sediment, but other sections which are near the same rivers as the sections mentioned
before seem to have the normal and expected readings. As stated in the introduction some
coral species are able to survive much greater sediment levels than other species (Sofonia &
Anthony 2008). It‟s also not just inbuilt resistance to coral, sometimes symbiotic relationships
can help protect the coral from damage such as small crabs which live on the coral and help
clean sediment and other harmful particles away in exchange for a place to live (Stewart et al
2006). These higher readings should be investigated further, and a more in-depth study of the
sections concerned (looking at topography, species found , and other such variables) is
recommended to help understand why a reef area is more healthy than other at the same
distance.
This study shows that there is a sedimentation problem in the Sogod Bay area, and it is
causing a decrease in coral reef health, but more research must be done to increase
knowledge and understanding of the balance of factors in Sogod bay which allows some
areas to thrive and others to die out. One of the main down falls of this study was that it could
only be done on a small area of the coast. If a more detailed map is required of Sogod Bay a
larger area must be covered. This study was severally limited by the amount of satellite data
available and as such can only show what is happening on a small section of coast. If more
satellite images are made, more rivers can be mapped using the same method as this study,
and as such more data can become available as to the effects of river discharge of sediment
into Sogod bay on coral reef systems.
Another problem with the methodology of this study is that the actual amount of sediment
discharged by each of the rivers was not known, due to time constraints and insufficient data.
If sediment traps were laid in each of the rivers and a few years of monitoring took place we
would have a more detailed picture of the rivers impact on the bay and of the sedimentation
pattern, and what areas of the bay are under the most amount of threat. Sarin et al (2000) and
Timothy et al (2003) both used sediment traps in their multi-year studies to good effect,
gaining accurate and concise data for the settlement and discharge rates of sediment by these
rivers. This could be useful not just form a scientific point of view, but also would help in
location potential marine protected areas, and helping local fisherman with locating the best
fishing areas. Also the use of sediment traps would help with understanding what is
discharged by the rivers. This could give us more information on the size of the sediment
particle, and the types of nutrients discharged by the rivers surrounding Sogod Bay.
In conclusion this study has found that there is a significant relationship between the distance
from a river mouth and the health of the coral reef system, in that if the distance decreases so
does the health of the reef. This study though has also shown that the relationship in some
cases (namely filter feeders) is not as strong as first thought, and that more research is needed
to find out why there seems to be less of relationship concerning organisms that are filter
feeders and more of the typical reef building hard coral organisms. Also this study has found
that there seems to be a cut off distance from a river mouth, in which the sediment discharged

31
begins to have less of an effect, though more research done on the remainder of the bay is
needed to confirm this.

32
References
Achituv, Y. and Dubinsky, Z. (1990). Evolution and Zoogeography of Coral Reefs.
Ecosystems of the World. Vol. 25:1-8
Airoldi, L. 2003. The effects of sedimentation on rocky coast assemblages. Oceanography
and Marine Biology 41: 161-236
Bray, J.R; Curtis, J.T. (1957). An ordination of the upland forest communities
of Southern Wisconsin. Ecological Monographs 27: 325-349.
Calumpong H.P., L.J. Raymundo, E.P. Solis- Duran, M.N.R. Alava and R.O. de Leon (Eds.).
(1994). Resource and Ecological Assessment of Sogod Bay, Leyte, Philippines- Final Report.
Chazottes, V; Reijmer, JJG; Cordier, E. 2008. Sediment characteristics in reef areas
influenced by eutrophication-related alterations of benthic communities and bioerosion
processes. Marine Geology 250: 114-127
Chou, LM (1998). Status if Southeast Asian coral reefs. In: Wilkinson CR (Ed.) Status of
coral reefs of the world: 1998. Australian Institute of Marine Science. 184 pp
Crabbe, MJC; Smith, DJ. 2005. Sediment impacts on growth rates of Acropora and Porites
corals from fringing reefs of Sulawesi, Indonesia. Coral Reefs 24: 437-441
Coral Cay Conservation. 2006. Results Of Community and Scientific Work. Available at:
http://www.coralcay.org/component/option,com_docman/task,cat_view/gid,117/Itemid,393/
[Last Accessed: 10/04/09]
Dutra, LXC; Kikuchi, RKP; Leao, ZMAN. 2006. Effects of sediment accumulation on reef
corals from Abrolhos, Bahia, Brazil. Journal of Coastal Research 2: 633-638
English, S., C.R. Wilkinson and V. Baker (1997). Survey manual for tropical marine
resources. Australian Institute of Marine Science. 2nd edition.
Fabricius, KE; Wild, C; Wolanski, E, et al. 2003. Effects of transparent exopolymer particles
and muddy terrigenous sediments on the survival of hard coral recruits. Estuarine Coastal
and Shelf Science 57: 613-621
Goibuu, YM; Fabricius, K; Victor, S, et al. 2008. Gradients in coral reef communities
exposed to muddy river discharge in Pohnpei, Micronesia. Estuarine Coastal and Shelf
Science 76: 14-20
Guzman, HM; Cipriani, R; Jackson, JJB. 2008. Historical decline in coral reef growth after
the Panama Canal. AMBIO 37: 342-346.
Hawkins, JP; Roberts, CM; Dytham, C, et al. 2006. Effects of habitat characteristics and
sedimentation on performance of marine reserves in St. Lucia. Biological Conservation 127:
487-499

33
Koch, S.L. (1993). A survey of the marine resources of Southern Leyte. R.A.N.A
Consultancy.
Latypov, Yu. Ya.; Dautova, T. N. 2005. Species composition of corals in the silty shallows of
the Baitylong Archipelago (Gulf of Tonkin, South China Sea). Biologiya Morya
(Vladivostok) 31: 311-318
Lieske E and Myers R (2001) Coral reef fishes: Indo Pacific and Caribbean. Harper Collins
London.
Marine Reef (2009). Anatomy of Coral. Available
at:http://www.marinereef.org/reports.php?reportid=2. [Last Accessed: 24/03/09].
McLaughlin, CJ; Smith, CA; Buddemeier, RW, et al. 2003. Rivers, runoff, and reefs. Global
and Planetary Change 39: 191-199
Meng, Pei-Jie; Lee, Hung-Jen; Wang, Jih-Terng, et al. 2008. A long-term survey on
anthropogenic impacts to the water quality of coral reefs, southern Taiwan. Environ Pollut
156: 67-75.
Mumby, P.J., A.R. Harborne, P.S. Raines and J.M. Ridley (1995). A critical assessment of
data derived from Coral Cay Conservation volunteers. Bulletin of Marine Science 56: 737-
751.
Ocean Services (2000). Diagram of a Coral Polyp. Available at:
http://oceanservice.noaa.gov/education/kits/corals/media/coral01a_462.jpg [Last Accessed
24/3/09]
Ocean World (2004)Coral Reef Destruction and Conservation. Available at:
http://oceanworld.tamu.edu/students/coral/coral5.htm [Last Accessed 20/03/09]
Ochoa-Lopez, E; Reyes-Bonilla, H; Ketchum-Mejia, J. 1998. Effects of sedimentation on
coral communities of southern Socorro Island, Revillagigedo Archipelago, Mexico. Ciencias
Marinas 24: 233-240
Restrepo, JD; Zapata, P; Diaz, JA, et al. 2006. Fluvial fluxes into the Caribbean Sea and their
impact on coastal ecosystems: The Magdalena River, Colombia. Global and Planetary
Change 50: 33-49
Ryan, KE; Walsh, JP; Corbett, DR, et al. 2008. A record of recent change in terrestrial
sedimentation in a coral-reef environment, La Parguera, Puerto Rico: A response to coastal
development? Marine Pollution Bulletin 56: 1177-1183.
Sarin, MM; Krishnaswami, S; Dalai, TK; Ramaswamy, V; Ittekkot, V. 2000. Settling fluxes
of U- and Th-series nuclides in the Bay of Bengal: results from time-series sediment trap
studies. Deep-Sea Research Part 1 – Oceanographic Research Papers 47: 1961-1985

34
Sofonia, JJ; Anthony, KRN. 2008. High-sediment tolerance in the reef coral Turbinaria
mesenterina from the inner Great Barrier Reef lagoon (Australia). Estuarine Coastal and
Shelf Science 78: 748-752.
Spalding, Mark, Corinna Ravilious, and Edmund Green. (2001). World Atlas of Coral Reefs.
Berkeley, CA: University of California Press and UNEP/WCMC
Spalding, M.D., Ravilious, C. and E.P. Green (2001). World Atlas of coral reefs. Prepared at
the UNEP World Conservation Monitoring Centre. University of California Press, Berkeley,
USA.
Stewart, HL; Holbrook, SJ; Schmitt, RJ, et al. 2006. Symbiotic crabs maintain coral health by
clearing sediments. Coral Reefs 25: 609-615
Thomsen, MS; McGlathery, K. 2006. Effects of accumulations of sediments and drift algae
on recruitment of sessile organisms associated with oyster reefs. Journal of Experimental
Marine Biology and Ecology 328: 22-34
Timothy, DA; Soon, MYS; Calvert, SE. 2003. Settling fluxes in Saanich and Jervis Inlets,
British Columbia, Canada: sources and seasonal patterns. Progress In Oceanography 59: 31-
73
Torres, R; Chiappone, M; Geraldes, F, et al. 2001. Sedimentation as an important
environmental influence on Dominican Republic reefs. Bulletin of Marine Science 69: 805-
818
Victor, S; Neth, L; Gobuu, Y, et al. 2006. Sedimentation in mangroves and coral reefs in a
wet tropical island, Pohnpei, Micronesia. Estuarine Coastal and Shelf Science 66: 409-416
Weber, M; Lott, C; Fabricius, KE. 2006. Sedimentation stress in a scleractinian coral exposed
to terrestrial and marine sediments with contrasting physical, organic and geochemical
properties. Journal of Experimental Marine Biology and Ecology 336: 18-32
Bibliography
Beach Processes and Sedimentation by Paul D. Komar. Prentice Hall; 2 edition (28 Nov
1997)
Coral Reef Conservation (Conservation Biology) by Isabelle M. Côté, John D. Reynolds.
Cambridge University Press; 1 edition (17 Aug 2006)
Life and Death of Coral Reefs by Charles Birkeland. Springer; illustrated edition edition (31
Jan 1997)
World Atlas of Coral Reefs by MD Spalding. University of California Press (31 Aug 2001)

35

36
37

38

39

40

41

42

43
Appendix 2
44

45
46

47

48

49

50

51
Appendix 3
List of Hard Coral Target Species:
Brain large (Wall depth of >1.0cm)
Brain medium (Wall depth of 0.5 < x < 1.0cm)
Brain small (Wall depth of <0.5cm)
Ctenactis echinata
Diploastrea heliopora
Echinopora spp.
Euphyllia
Favia
Favites
Galaxea
Goniopora/Alveopora
Herpolitha limax
Hydnophora spp.
Lobophyllia
Massive Porites
Millepora intricata
Millepora platyphyllia
Montipora digitata
Montipora foliose
Mycedium elephantotus
Pachyseris rugosa
Pacyseris speciosa
Pavona clavus
Pectinia lactuca
Plerogyra
Pocillopora large (>2.5 cm diameter branches)
Pocillopora meduium (1.5cm < x < 2.5cm diameter branches)
Pocillopora small (<1.5cm diameter branches)
Polyphyllia talpina
Porites cylindric
Porites nigrescens
Seriatopora hystrix
Stylophora pistillata
Tubastrea micrantha
Turbinaria spp.
Upsidedown bowl
Blue Coral
Fire Coral
Organ Pipe

52
List of Filter Feeder Target Species:
Tube sponge
Barrel sponge
Elephant Ear sponge
Branching sponge
Encrusting sponge
Lumpy sponge
Rope sponge
Vase sponge
Deadman's fingers Soft Coral
Leather Soft Coral
Tree Soft Coral
Pulsing Soft Coral
Sea Fan
Sea whip
Bamboo Soft Coral
Flower Soft Coral
Sea Pen
Black Coral
Corallimorpharia

53
Appendix 5

54