the effects of teach for america on students: findings
TRANSCRIPT
Contract No.: CAPE 2001-004-01/Carnegie B7302; DB7302-R01
MPR Reference No.: 8792-750
The Effects of Teach For America on Students: Findings from a National Evaluation June 9, 2004 Paul T. Decker Daniel P. Mayer Steven Glazerman
Prepared for:
The Smith Richardson Foundation The William and Flora Hewlett Foundation The Carnegie Corporation
Prepared by:
Mathematica Policy Research, Inc. P.O. Box 2393 Princeton, NJ 08543-2393 Telephone: (609) 799-3535 Facsimile: (609) 799-0005
Project Director:
Paul Decker
Survey Director: Pat Nemeth

iii
ACKNOWLEDGMENTS
This study was jointly sponsored by the Smith Richardson Foundation, the William and Flora Hewlett Foundation, and the Carnegie Corporation. We thank the staff at these foundations, including Phoebe Cottingham, Marshall Smith, Karin Egan, and Mark Steinmeyer, for outstanding support throughout the study.
We also thank everyone whose participation made the study possible. In the school districts
that participated in the study, the superintendents, principals, teachers, and other district officials and school staff were enormously patient and generous with their time. We also thank staff from the Teach For America (TFA) national organization including Wendy Kopp, Abigail Smith, Nicole Baker, and Ashindi Maxton who provided us with information about the TFA program and the regions in which they place teachers. Regional TFA staff also played a key role in providing information and facilitating our discussions with district and school staff. At Mathematica, data for this study were collected under the careful guidance of Patricia Nemeth, the survey director, and Kathy Sonnenfeld. Margo Salem, Betty Friedman, and Irene Crawley communicated with the schools included in the study and assisted in managing and conducting the data collection. Mary Grider managed the data processing and was assisted by Beth Brown. Ms. Grider also provided essential feedback to the research team throughout the project.
Finally, we thank several people who reviewed and commented on our research. At
Mathematica, Mark Dynarski reviewed and commented on the project design and on various project documents, including this report. David Myers also reviewed and commented on the original design and provided guidance on project management. Mary Moore, Allen Schirm, Peter Schochet, and Amy Johnson reviewed and commented on a draft of this report. Outside Mathematica, we received comments on a draft of this report from the foundation staff mentioned above, as well as from Richard Murnane of Harvard University and Jeffrey Smith of University of Maryland.
Paul T. Decker Daniel P. Mayer
Steven Glazerman

v
CONTENTS
Chapter Page
EXECUTIVE SUMMARY........................................................................................... xi
I INTRODUCTION ..........................................................................................................1 II HOW TFA WORKS .......................................................................................................3
A. APPLICATION .......................................................................................................3 B. TRAINING AND SUPPORT..................................................................................3 C. COMPENSATION AND CERTIFICATION .........................................................5
III STUDY DESIGN............................................................................................................7 IV WHO TEACHES IN THE SCHOOLS WHERE TFA PLACES TEACHERS?..........11
A. CONTROL TEACHERS HAD DIVERSE BACKGROUNDS............................11 B. NOVICE CONTROL TEACHERS HAD DIVERSE BACKGROUNDS
AND MOST WERE NOT TRADITIONALLY TRAINED .................................14 C. TFA TEACHERS’ BACKGROUNDS REFLECTED THE PROGRAM’S
STRUCTURE ........................................................................................................16 D. TFA AND CONTROL TEACHERS HAD SIMILAR INSTRUCTIONAL
PRACTICES, DIFFERENT PHILOSOPHIES .....................................................18 V WHAT DOES OUR SAMPLE OF STUDENTS LOOK LIKE? .................................23
A. TFA WORKS WITH SCHOOLS THAT SERVE A DISADVANTAGED,
LARGELY MINORITY, POPULATION.............................................................24 B. RANDOM ASSIGNMENT PRODUCED EQUIVALENT GROUPS .................25 C. RESPONSE RATES WERE HIGH.......................................................................26
CONTENTS (continued) Chapter Page
vi
VI WERE TFA TEACHERS EFFECTIVE IN THE CLASSROOM?..............................29 A. STUDENTS OF TFA TEACHERS PERFORMED BETTER IN
MATH AND THE SAME IN READING COMPARED TO CONTROL TEACHERS.......................................................................................29
B. IMPACTS WERE SIMILAR FOR DIFFERENT TYPES OF TEACHERS ........31 C. IMPACT FINDINGS SIMILAR FOR DIFFERENT SUBGROUPS
OF STUDENTS.....................................................................................................34 D. IMPACT FINDINGS NOT SENSITIVE TO DIFFERENT ASSUMPTIONS.....37
VII DID TFA HAVE AN IMPACT ON OTHER STUDENT OUTCOMES?...................43
A. NO SUBSTANTIAL IMPACTS ON GRADE PROMOTION OR SUMMER
SCHOOL ATTENDANCE....................................................................................43 B. NO CLEAR IMPACTS ON BEHAVIORAL OUTCOMES ................................44
VIII CONCLUSION.............................................................................................................47
REFERENCES..............................................................................................................51 APPENDIX A: SUPPLEMENTARY TABLES........................................................A.1
APPENDIX B: ESTIMATION APPROACH ...........................................................B.1
vii
TABLES
Table Page
III.1 STUDY SAMPLE ......................................................................................................... 9
IV. 1 EDUCATION AND DEMOGRAPHIC CHARACTERISTICS OF TEACHERS..... 12
IV.2 COMMITMENT TO TEACHING AS A CAREER ................................................... 14
IV. 3 INSTRUCTIONAL MODES....................................................................................... 19
IV.4 INSTRUCTIONAL PHILOSOPHIES AND PRACTICES ........................................ 20
V.1 BACKGROUND CHARACTERISTICS OF STUDENTS IN THE TFA STUDY ... 23
V.2 BASELINE MATHEMATICS AND READING SCORES ....................................... 24
V.3 BASELINE DIFFERENCES BETWEEN TFA AND CONTROL GROUPS............ 25
V.4 MOBILITY RATES OF CONTROL AND TFA STUDENTS................................... 26
V.5 SPRING TEST SCORE COMPLETION RATES ...................................................... 28
VI.1 IMPACTS ON AVERAGE TEST SCORES............................................................... 32
VI.2 IMPACTS ON TEST SCORES, TEACHER SUBGROUPS (NCEs)......................... 33
VI.3 IMPACTS ON TEST SCORES, STUDENT SUBGROUPS (NCEs)......................... 35
VI.4 IMPACTS ON TEST SCORES, SENSITIVITY ANALYSES (NCEs) ..................... 39
VII.1 IMPACTS ON OTHER ACADEMIC OUTCOMES.................................................. 43
VII.2 IMPACTS ON SCHOOL-REPORTED ABSENTEEISM AND DISCIPLINE ......... 44
VII.3 IMPACTS ON TEACHER-REPORTS OF CLASSROOM PROBLEMS ................. 45

ix
FIGURES
Figure Page
IV.1 EDUCATION AND TEACHER TRAINING, CONTROL AND TFA TEACHERS .........................................................................................................17
VI.1 FALL-TO-SPRING CHANGE IN ACHIEVEMENT: MATH ...................................30
VI.2 FALL-TO-SPRING CHANGE IN ACHIEVEMENT: READING.............................31
VI.3 IMPACTS ON STUDENT TEST SCORES, BY REGION .........................................40
VI.4 DISTRIBUTION OF TEST SCORE IMPACTS BY BLOCK, MATH .......................41
VI.5 DISTRIBUTION OF TEST SCORE IMPACTS BY BLOCK, READING.................41

xi
EXECUTIVE SUMMARY
Teach For America (TFA) was founded in 1989 to address the educational inequities facing children in low-income communities across the United States by expanding the pool of teacher candidates available to the schools those children attend. TFA recruits seniors and recent graduates from colleges around the country, people who are willing to commit to teach for a minimum of two years in low-income schools.
TFA focuses its recruitment on people with strong academic records and leadership
capabilities, whether or not they have planned to teach or have taken education courses. TFA is particularly interested in candidates that have the potential to be effective in the classroom but in the absence of TFA would not consider a teaching career. Consequently, most TFA recruits do not have education-related majors in college and therefore have not received the same training that traditional teachers are expected to have.
Although the teacher training TFA provides its recruits is limited in duration, it is quite
intensive. Once recruits are accepted into the program, they participate in a five-week TFA summer institute to prepare them for placement in the classroom at the start of the school year. The institute includes courses on teaching practice, classroom management, diversity, learning theory, literacy development, and leadership. During the institute, groups of participants also take full teaching responsibility for four weeks of a class of summer school students. Participants also meet regularly with subject- and grade-specific learning teams and attend various evening workshops, with their progress evaluated through regular assessment and feedback provided by institute faculty. The institute has established a rigorous process for participants. According to TFA, the typical attendee must carry out a number of preliminary assignments and then spend 70 hours a week on institute-related activities during the five weeks. Furthermore, for most TFA corps members, their training continues after they are placed in their classrooms, partly because many states and districts require it.
TFA has been highly successful in attracting applicants that meet its standards, and its
numbers have expanded rapidly in recent years. Between 2000 and 2003, the TFA applicant pool grew almost fourfold (from 4,068 to 15,706), and the number of new corps members nearly doubled (from 868 to 1,656). In 2004, the program plans to place corps members in 22 urban and rural regions, an increase from 15 regions served in 2000.
OBJECTIVE AND DESIGN
Despite TFA’s rapid recent expansion, little evidence exists regarding the impact of TFA teachers on student achievement. This report addresses this issue directly by answering the question, Do TFA teachers improve (or at least not harm) student outcomes relative to what would have happened in their absence? Our approach to addressing this question is to compare the outcomes among students taught by TFA teachers with the outcomes of students taught by other teachers in the same schools and at the same grades, whom we refer to as “control teachers.” We refine this comparison by randomly assigning students to their classrooms prior to
xii
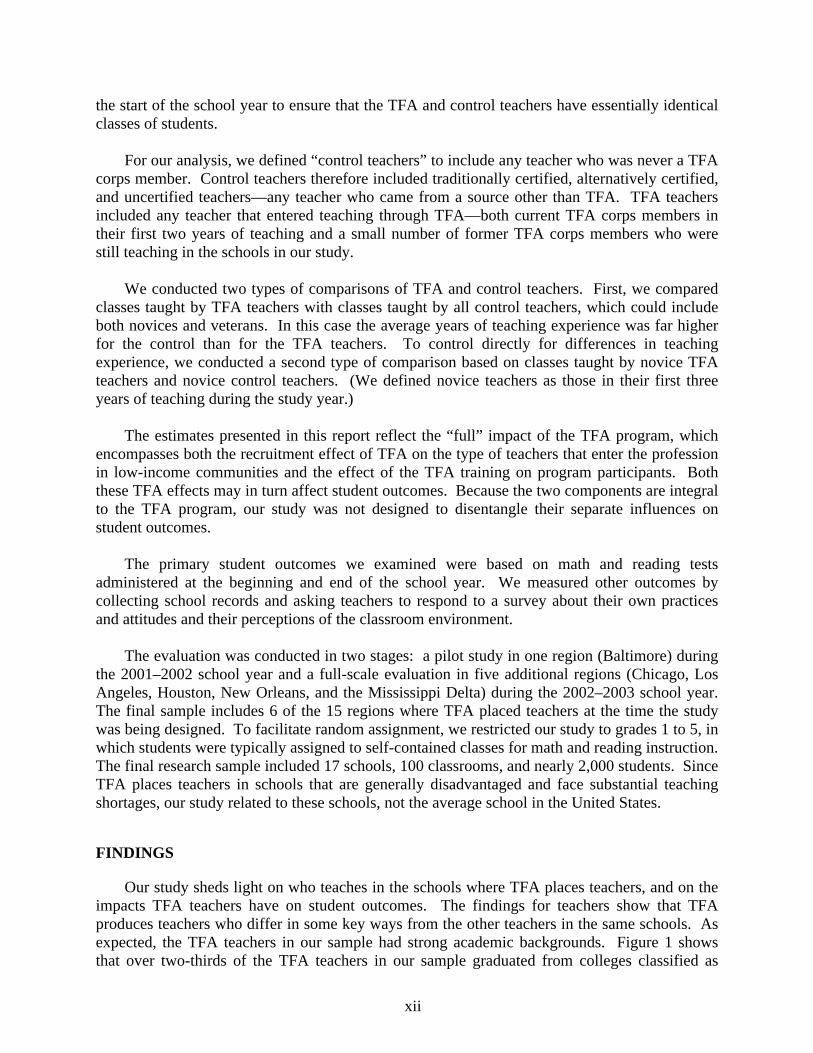
the start of the school year to ensure that the TFA and control teachers have essentially identical classes of students.
For our analysis, we defined “control teachers” to include any teacher who was never a TFA
corps member. Control teachers therefore included traditionally certified, alternatively certified, and uncertified teachers—any teacher who came from a source other than TFA. TFA teachers included any teacher that entered teaching through TFA—both current TFA corps members in their first two years of teaching and a small number of former TFA corps members who were still teaching in the schools in our study.
We conducted two types of comparisons of TFA and control teachers. First, we compared
classes taught by TFA teachers with classes taught by all control teachers, which could include both novices and veterans. In this case the average years of teaching experience was far higher for the control than for the TFA teachers. To control directly for differences in teaching experience, we conducted a second type of comparison based on classes taught by novice TFA teachers and novice control teachers. (We defined novice teachers as those in their first three years of teaching during the study year.)
The estimates presented in this report reflect the “full” impact of the TFA program, which
encompasses both the recruitment effect of TFA on the type of teachers that enter the profession in low-income communities and the effect of the TFA training on program participants. Both these TFA effects may in turn affect student outcomes. Because the two components are integral to the TFA program, our study was not designed to disentangle their separate influences on student outcomes.
The primary student outcomes we examined were based on math and reading tests
administered at the beginning and end of the school year. We measured other outcomes by collecting school records and asking teachers to respond to a survey about their own practices and attitudes and their perceptions of the classroom environment.
The evaluation was conducted in two stages: a pilot study in one region (Baltimore) during
the 2001–2002 school year and a full-scale evaluation in five additional regions (Chicago, Los Angeles, Houston, New Orleans, and the Mississippi Delta) during the 2002–2003 school year. The final sample includes 6 of the 15 regions where TFA placed teachers at the time the study was being designed. To facilitate random assignment, we restricted our study to grades 1 to 5, in which students were typically assigned to self-contained classes for math and reading instruction. The final research sample included 17 schools, 100 classrooms, and nearly 2,000 students. Since TFA places teachers in schools that are generally disadvantaged and face substantial teaching shortages, our study related to these schools, not the average school in the United States.
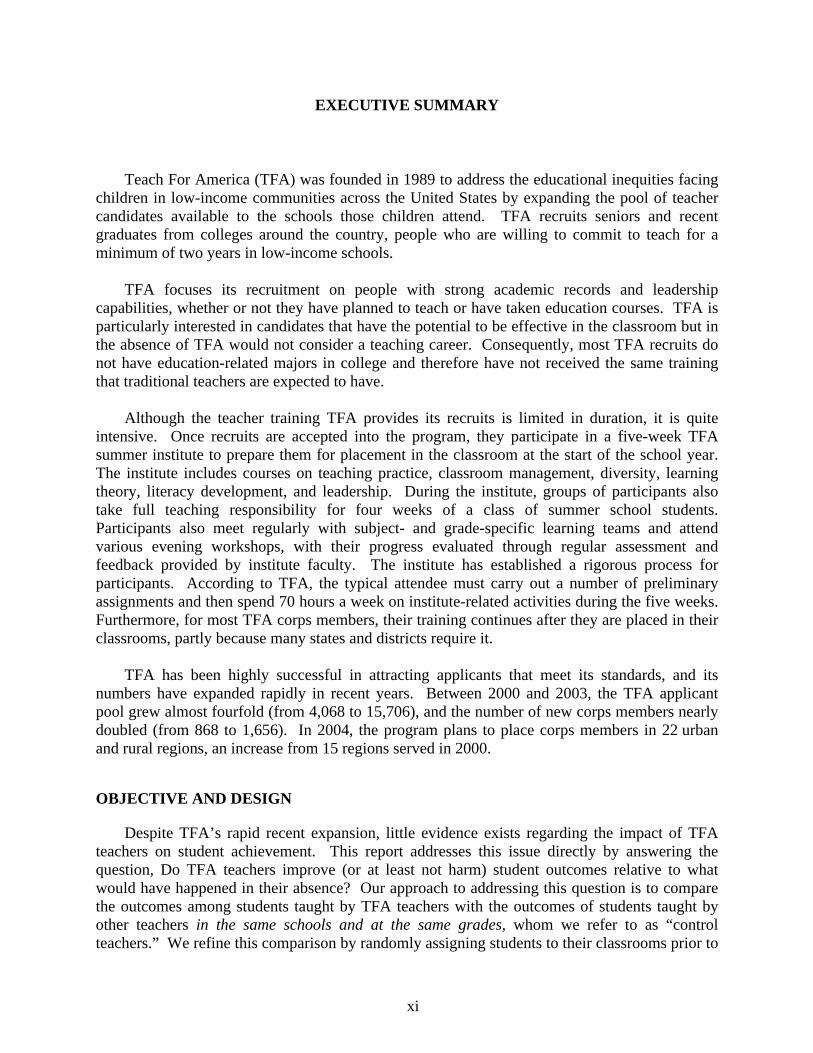
FINDINGS
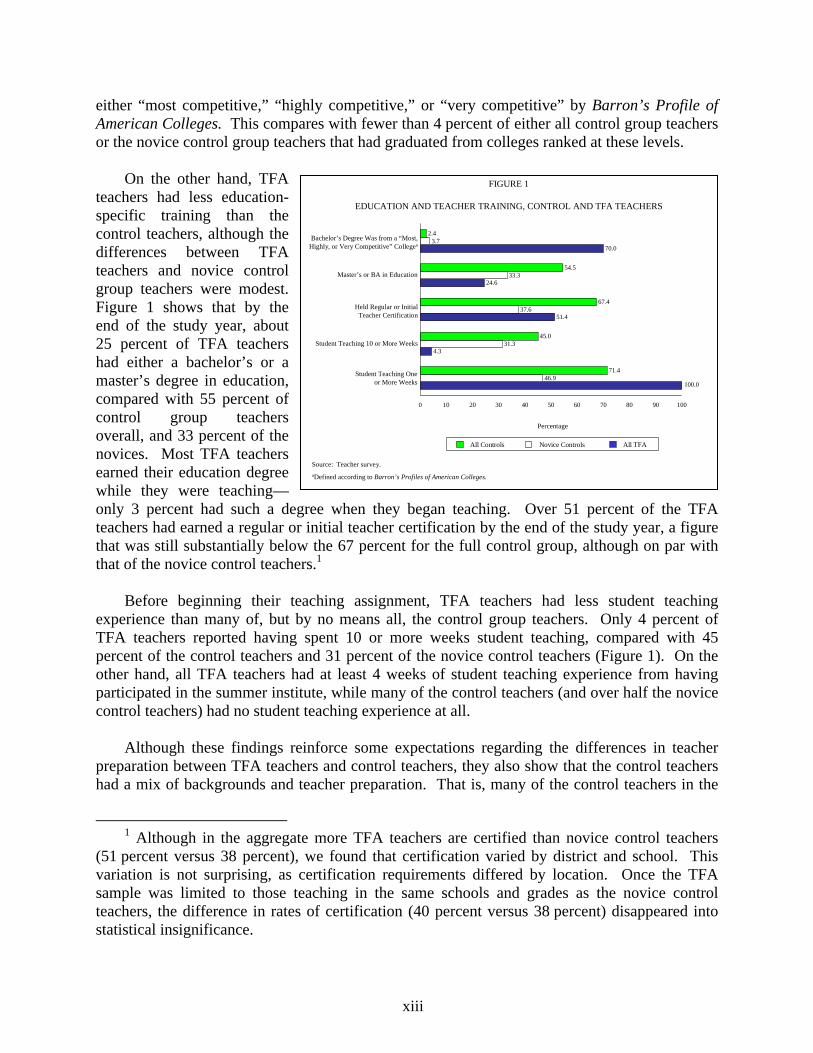
Our study sheds light on who teaches in the schools where TFA places teachers, and on the impacts TFA teachers have on student outcomes. The findings for teachers show that TFA produces teachers who differ in some key ways from the other teachers in the same schools. As expected, the TFA teachers in our sample had strong academic backgrounds. Figure 1 shows that over two-thirds of the TFA teachers in our sample graduated from colleges classified as
xiii
either “most competitive,” “highly competitive,” or “very competitive” by Barron’s Profile of American Colleges. This compares with fewer than 4 percent of either all control group teachers or the novice control group teachers that had graduated from colleges ranked at these levels.
On the other hand, TFA
teachers had less education-specific training than the control teachers, although the differences between TFA teachers and novice control group teachers were modest. Figure 1 shows that by the end of the study year, about 25 percent of TFA teachers had either a bachelor’s or a master’s degree in education, compared with 55 percent of control group teachers overall, and 33 percent of the novices. Most TFA teachers earned their education degree while they were teaching—only 3 percent had such a degree when they began teaching. Over 51 percent of the TFA teachers had earned a regular or initial teacher certification by the end of the study year, a figure that was still substantially below the 67 percent for the full control group, although on par with that of the novice control teachers.1
Before beginning their teaching assignment, TFA teachers had less student teaching
experience than many of, but by no means all, the control group teachers. Only 4 percent of TFA teachers reported having spent 10 or more weeks student teaching, compared with 45 percent of the control teachers and 31 percent of the novice control teachers (Figure 1). On the other hand, all TFA teachers had at least 4 weeks of student teaching experience from having participated in the summer institute, while many of the control teachers (and over half the novice control teachers) had no student teaching experience at all.
Although these findings reinforce some expectations regarding the differences in teacher
preparation between TFA teachers and control teachers, they also show that the control teachers had a mix of backgrounds and teacher preparation. That is, many of the control teachers in the
1 Although in the aggregate more TFA teachers are certified than novice control teachers
(51 percent versus 38 percent), we found that certification varied by district and school. This variation is not surprising, as certification requirements differed by location. Once the TFA sample was limited to those teaching in the same schools and grades as the novice control teachers, the difference in rates of certification (40 percent versus 38 percent) disappeared into statistical insignificance.
FIGURE 1
EDUCATION AND TEACHER TRAINING, CONTROL AND TFA TEACHERS
Source: Teacher survey.aDefined according to Barron’s Profiles of American Colleges.
4.3
51.4
24.6
70.0
46.9
31.3
37.6
33.3
3.7
71.4
45.0
67.4
54.5
100.0
2.4
0 10 20 30 40 50 60 70 80 90 100
Bachelor’s Degree Was from a “Most, Highly, or Very Competitive” Collegea
Master’s or BA in Education
Held Regular or InitialTeacher Certification
Student Teaching 10 or More Weeks
Percentage
All Controls Novice Controls All TFA
Student Teaching Oneor More Weeks
xiv
schools in our study, particularly the novice teachers, had not entered teaching through a traditional route in which they were fully trained prior to their entry into the classroom. This finding reflects the situation in the poor schools where TFA places teachers rather than the situation in all schools across the country. Compared with a nationally representative sample of teachers, the control teachers in the schools in our study had substantially lower rates of certification and formal education training.
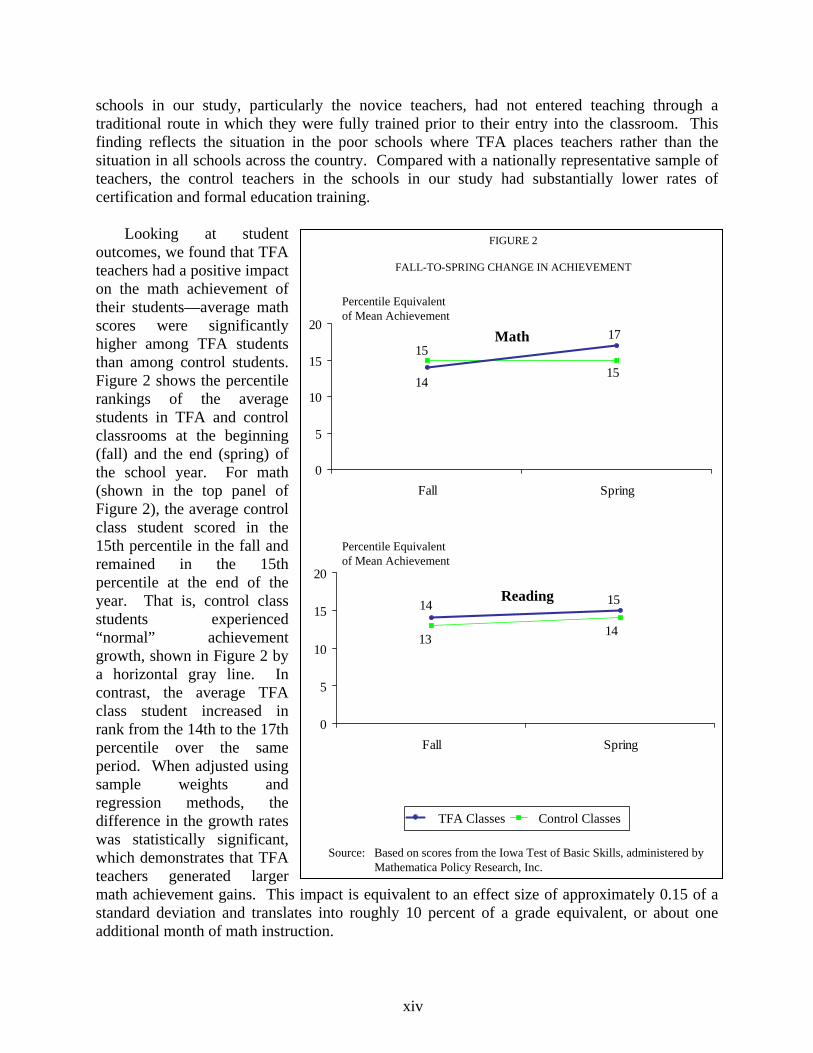
Looking at student
outcomes, we found that TFA teachers had a positive impact on the math achievement of their students—average math scores were significantly higher among TFA students than among control students. Figure 2 shows the percentile rankings of the average students in TFA and control classrooms at the beginning (fall) and the end (spring) of the school year. For math (shown in the top panel of Figure 2), the average control class student scored in the 15th percentile in the fall and remained in the 15th percentile at the end of the year. That is, control class students experienced “normal” achievement growth, shown in Figure 2 by a horizontal gray line. In contrast, the average TFA class student increased in rank from the 14th to the 17th percentile over the same period. When adjusted using sample weights and regression methods, the difference in the growth rates was statistically significant, which demonstrates that TFA teachers generated larger math achievement gains. This impact is equivalent to an effect size of approximately 0.15 of a standard deviation and translates into roughly 10 percent of a grade equivalent, or about one additional month of math instruction.
FIGURE 2
FALL-TO-SPRING CHANGE IN ACHIEVEMENT
15
1514
17
0
5
10
15
20
Fall Spring
Percentile Equivalent of Mean Achievement
14 15
1413
0
5
10
15
20
Fall Spring
Percentile Equivalent of Mean Achievement
Math
Reading
TFA Classes Control Classes
Source: Based on scores from the Iowa Test of Basic Skills, administered byMathematica Policy Research, Inc.
xv
TFA teachers did not have an impact on average reading achievement. Students in TFA and control classrooms experienced the same growth rate in reading achievement—an increase equivalent to one percentile. The nearly parallel lines in Figure 2 reflect the similarity in these growth rates. The regression-adjusted impact estimate was not statistically significant.
When we restricted the analysis to novice teachers, the impacts of TFA were the same or larger than those reported for the comparison with all teachers. Compared with their novice counterparts, novice TFA teachers generated math test scores that were 0.26 standard deviations higher, on average. The impact on reading scores remained statistically insignificant based on the novice comparisons. We also found that impacts were similar, although slightly lower, when TFA teachers were compared with control teachers with regular teaching certificates. In general, the sample sizes for all the teacher subgroup comparisons were too small to determine whether the impacts for the subgroup comparison were significantly different from the overall impacts.
The TFA impacts were similar across different subgroups of students. For example, the impacts were similar for boys and girls and for different racial/ethnic groups. They were also similar for students with different baseline achievement scores and for those in different grades.
The conclusions regarding the positive impact of TFA teachers on math scores and no
impact on reading scores were not sensitive to the assumptions underlying our estimation model. In extensive sensitivity tests, we found that the estimated test score impacts varied within a fairly narrow range. For example, estimated impacts of TFA teachers on average math scores based on alternative specifications hovered around the benchmark estimate described above, ranging from 0.13 to 0.18 standard deviation units, and were always statistically significant. We found similar stability in the estimated impacts of TFA teachers on average reading scores—all the estimates were small and not statistically significant. Finally, the impacts on both math and reading scores were reasonably similar across locations—the overall impacts were not attributable to any particular region, school, or grade.
TFA teachers had no substantial impact on the probability that students were retained in
grade or assigned to summer school. The findings on student discipline, absenteeism, and behavior varied somewhat by data source. Estimates based on data from student records showed that TFA teachers had no impact on these outcomes. However, data from the teacher survey showed that the TFA teachers were more likely than the control teachers to report having had problems with student disruptions and physical conflicts among students in their classrooms. Since these measures were based on teacher reports, the differences may simply reflect differences between TFA and control teachers’ expectations and perceptions regarding student behavior rather than actual differences between the classrooms.
IMPLICATIONS
Our findings have important implications for a variety of stakeholders. Program funders, program operators, and policymakers at the state and federal levels have an enduring interest in finding ways to attract and retain high-quality teachers in low-income communities. District officials and school staff in such areas have an especially practical interest in the same question, particularly in the short term, with federal requirements under No Child Left Behind to place a highly qualified teacher in every classroom. Finally, parents and children in low-income
xvi
communities are most directly affected by decisions about who will teach in their schools. We consider the implications of our findings for each of these groups.
From the perspective of a community or a school faced with the opportunity to hire TFA
teachers, our findings suggest that TFA offers an appealing pool of candidates. First, the positive impacts on math scores suggest that by hiring TFA teachers, a school can expect to increase the average math achievement of its students (without lowering their reading achievement). Second, the consistent pattern of positive or zero impacts on test scores across grades, regions, and student subgroups suggests that there is little risk that hiring TFA teachers will reduce achievement, either for the average student or for most subgroups of students. Finally, since TFA teachers are paid the same as other teachers, the schools pay no direct costs for the achievement increase and school districts typically contribute only $1,500 per corps member to offset recruiting costs. This contrasts with other interventions that have been shown to increase achievement, such as class size reduction, but that can entail substantial direct costs.
One could expand this reasoning to conduct a larger assessment of whether, from society’s perspective, TFA is a cost-effective way to attract teachers to low-income schools. However, a full cost-effectiveness assessment would require information on a number of factors our study does not address directly. For example, although TFA teachers are paid on the same salary scale as their counterparts, they may create hidden costs if they leave their jobs sooner—for example, at the end of their two-year commitment—and have to be replaced more frequently than their non-TFA peers. Measuring such costs would be difficult, because the retention rates of TFA and non-TFA teachers are not well documented. Our data showed no difference in within-year attrition rates, but because they cover only a single school year, they cannot be used to compare attrition rates over time between our TFA and control teachers. Hanushek et al. (2004) show that teacher attrition rates are particularly high in schools that serve large numbers of academically disadvantaged students—exactly the types of schools where TFA places teachers. Therefore, there is no strong reason to presume that TFA teachers have an attrition rate higher than that of other new teachers in the same schools.
From the perspective of TFA and its funders, our findings clearly show that the organization
is making progress toward its primary mission of reducing inequities in education—it supplies low-income schools with academically talented teachers who contribute to the academic achievement of their students. The success of TFA teachers is not dependent on their having extensive exposure to teacher practice or training. Even though TFA teachers generally lack any formal teacher training beyond that provided by TFA, they produce higher student test scores than the other teachers in their schools—not just other novice teachers or uncertified teachers, but also veterans and certified teachers.
Finally, our study provides important information to policymakers who are working to
improve the educational opportunities for children in poor communities. The finding that many of the control teachers in our study were not certified or did not have formal pre-service training highlights the need for programs or policies that can attract good teachers to schools in the most disadvantaged communities. Our findings show that TFA is one such program.
1
I. INTRODUCTION
Teach For America (TFA) was founded in 1989 to address the educational inequities facing children in low-income communities across the United States by expanding the pool of teacher candidates available to schools in those communities. TFA recruits seniors and recent graduates from about 320 colleges around the country, people who are willing to commit to teach for a minimum of two years in low-income schools.
In its recruitment efforts, TFA focuses on individuals who possess strong academic records
and leadership capabilities, regardless of whether or not they have exposure to teaching practice prior to entry into TFA. TFA is particularly interested in candidates that have the capability of being effective teachers but in the absence of TFA would not consider a teaching career. Consequently, most TFA recruits do not have education-related majors in college and therefore have not received the training that is typical of teachers before they enter the classroom. However, TFA recruits do stand out as high academic achievers. For example, the new corps members in 2003 had an average SAT score of 1310 and an average grade point average of 3.5. In addition, 92 percent of these corps members were defined by TFA as holding “a leadership role on a college campus” prior to joining TFA.
Once recruits are accepted into the program, they are required to participate in a five-week
TFA summer institute to prepare them for placement in the classroom at the end of the summer. The TFA summer institute includes courses covering teaching practice, classroom management, diversity, learning theory, literacy development, and leadership. During the institute, groups of participants also take full teaching responsibility for a class of summer school students. Participants’ progress is evaluated through regular assessment and feedback provided by institute faculty.
TFA has been highly successful in attracting individuals that meet its standards and its
numbers have expanded rapidly in recent years. Between 2000 and 2003, the TFA applicant pool grew almost fourfold (from 4,068 to 15,706) and the number of new corps members nearly doubled (from 868 to 1,656). Since the program began, more than 10,000 TFA corps members have taught more than 1.5 million students. In 2004, the program plans to place corps members in 22 urban and rural regions, an increase from 15 regions served in 2000.
Despite TFA’s rapid expansion, there is little evidence whether teachers with strong
academic backgrounds, but limited exposure to teaching practice, can be effective. Some critics argue that programs such as TFA are “loopholes” that permit unlicensed and under-trained teachers into the classroom simply as a way to address teacher shortages. Darling-Hammond (1994, 1996) has argued that TFA teachers “often have difficulty with curriculum development, pedagogical content knowledge, students’ different learning styles, classroom management, and student motivation.” Other researchers are more optimistic about the potential benefits of hiring teachers through programs such as TFA. Ballou and Podgursky (1998) argue that there is no evidence that formal teacher certification produces more qualified teachers and that certification policies may discourage talented individuals from entering the profession. Two recent studies (Raymond et al. 2001; and Laczko-Kerr and Berliner 2002) attempted to assess the impact of
2
TFA using nonexperimental methods on samples drawn from single regions, and generated mixed findings regarding the effectiveness of TFA teachers. Our study extends beyond these previous studies by using a unique experimental methodology and by working with a nationwide sample.
This study examines the impact of TFA teachers on the students in their classrooms
compared with what would have happened in the absence of the TFA teachers. To estimate this impact, we therefore need to know what would have happened to students in the absence of the TFA teachers. In Chapter III of this report, we describe in detail our approach to estimating this hypothetical outcome. We characterize our estimate of the impact of TFA teachers on their students as the “full” impact of the TFA program, which encompasses both the recruitment effect of TFA on the type of teacher that enters teaching in low-income communities and the effect of TFA on the training provided to these teachers. Both of these TFA effects may in turn affect student outcomes. Because both of these components are integral to the TFA program, our study was not designed to disentangle their separate influences on student outcomes.
3
II. HOW TFA WORKS
In the introduction to this report, we stated that TFA can affect both the types of teachers that enter teaching in low-income communities and the training received by these entering teachers. In this chapter we briefly describe the process by which TFA recruits, prepares, and supports teacher candidates.
A. APPLICATION
TFA recruits graduating college seniors or recent graduates from all academic majors. Applicants are required to have a minimum cumulative undergraduate GPA of 2.50 at the time of their application and when they graduate. To apply, candidates complete an online application, including a letter of intent, a resume, and an essay. The most promising applicants are invited to participate in a day-long interview, which includes a sample teaching lesson, a group discussion, a written exercise, and a personal interview. Applicants who are invited to interview are also required to provide transcripts and have the option of providing a reference. Using information collected through the application and interview, TFA bases their selection of candidates on a model that accounts for multiple criteria that they believe are linked to success in the classroom, including: achievement, personal responsibility, critical thinking, organizational ability, motivational ability, respect for others, and commitment to the TFA mission. TFA conducts ongoing research on their selection criteria, focusing on the link between the selection criteria and observed single-year gains in student achievement in TFA classrooms. Over the years, they have adjusted the selection model based on this research.
At the time of their interview, applicants establish their preferences regarding the location of
their placement, as well as the grade level and subjects they want to teach; and TFA works to balance these preferences with the needs and requirements of the regions where they place teachers. With respect to location, applicants rank each TFA region as highly preferred, preferred, or less preferred and indicate any special considerations, such as the need to coordinate location with a spouse. According to TFA, over 90 percent of the TFA applicants accepted are matched to one of their “highly preferred” regions.
TFA also attempts to match applicants to preferred grade levels and subjects, although
applicants’ ability to do this depends on their academic backgrounds, district needs, and state and district certification requirements. Because requirements vary from region to region, applicants may not be qualified to teach the same subjects and grade levels in all regions. Furthermore, it is difficult for school regions to predict in the spring the exact openings they will have in the fall, and changes in subject or grade-level assignments following initial placement are not uncommon.
B. TRAINING AND SUPPORT
The centerpiece of the teacher training provided by TFA is the five-week summer institute in which TFA corps members must participate prior to beginning their teaching assignments. The summer institute is designed to help new TFA corps members understand the approach TFA
4
believes is needed to be a successful teacher in a low-income community. Before attending the institute, participants are expected to have completed assigned readings, engaged in classroom observations, and completed exercises based on their readings and observations so as to lay the foundation for their institute training. Once at the institute, corps members are required to participate in four institute activities:1
1. Six formal education courses: Teaching as Leadership; Instructional Planning and Delivery; Classroom Management and Culture; Literacy Development; Diversity, Community, and Achievement; and Learning Theory. These courses provide the educational foundation to prepare corps members to enter the classroom. Corps members’ performance in these courses is evaluated based on weekly written assessments of their knowledge.
2. Full teaching responsibility for a class of summer school students. Corps members work collaboratively in groups of three or four to set academic goals for their students, plan lessons, deliver instruction, assess students, and communicate with parents. The classes, which begin in the second week of the institute, meet for several hours a day and last four weeks. In handling their classroom responsibilities, corps members are mentored by experienced teachers and are observed and evaluated by TFA staff and veteran teachers from the local school districts.
3. Weekly meetings of institute learning teams focused on teaching methods. The institute learning teams are organized according to subject and grade level. The teams meet one evening per week and are led by institute staff, with a focus on content- and grade-specific teaching methods.
4. Content- and grade-specific workshops. Workshops are conducted by institute faculty, TFA alumni, and other experienced educators and generally expand on the objectives of the six institute courses.
The institute also provides an orientation to TFA culture, including the organization’s beliefs, core values, and mission. The typical corps member who participates in the institute works about 70 hours per week on institute-related activities.
In addition to the TFA summer institute, corps members take part in a one- to two-week,
TFA-led induction in their assigned region. Beyond that, corps members often participate in local teacher induction programs conducted by the school regions. These induction programs are used to orient all new teachers, not just TFA corps members, to local factors that may affect students’ academic experience and their school’s culture.
Once TFA corps members are in their assigned regions, they receive ongoing support from
TFA staff and faculty located in each community, as well as from TFA national staff. TFA
1This description is based on the current TFA summer institute, which differs somewhat from the institute which most study participants attended. Since 2002, for example, TFA has revised the literacy curriculum and has added a separate course on diversity.
5
prefers to place corps members in schools with other corps members and alumni, so that they can collaborate on projects and support each other’s professional growth. Last year, 90 percent of TFA corps members were placed in a school with at least one other corps member. Local TFA staff conduct classroom observations of corps members, identify corps members’ professional development needs, and connect corps members to resources that are helpful, given their particular needs. These resources include relevant books and articles, professional development workshops, and exemplary teachers in particular grades or content areas. Finally, corps members stay connected to TFA colleagues in their region and across the country through organized social activities, seasonal retreats, discussion groups, the TFA website, and inter-regional conferences.
C. COMPENSATION AND CERTIFICATION
TFA corps members are paid directly by the school districts for which they work and generally receive the same salaries and health benefits as other beginning teachers. Most districts pay a fee to TFA, $1,500 per corps member, to offset screening and recruiting costs. TFA gives corps members various additional financial benefits not related directly to their district compensation. For example, corps members historically have been part of AmeriCorps, entitling them to an “education award” of $4,725 for each year of service, which they can use toward past or future educational expenses, as well as forbearance of qualified student loans. TFA also offers transitional grants and no-interest loans to help corps members make it to their first paycheck. Applicants may apply for transitional packages that range from $1,000 to $5,000, based on an applicant's demonstrated need and the cost of living in the assigned region. Aid may be used for travel to the summer institute and regional orientations, as well as for personal and moving expenses (for example, deposits on apartments) and necessary coursework, testing, and district processing fees.
TFA corps members are hired to teach in local school districts through alternative routes to
certification. Typically, they must take and pass exams required by their districts before they begin teaching. Corps members may also be required to take additional courses to meet state certification requirements or to comply with the requirements for highly qualified teachers under the No Child Left Behind Act (NCLB). Although corps members ultimately are responsible for meeting the certification requirements in their states, TFA works with school districts, states, and schools of education to help ensure that corps members have access to coursework, test information, and preparation tools to meet these requirements. To acquire their teacher certification, corps members often pursue a master’s degree in education after they have begun teaching; and TFA has established partnerships with graduate schools in most areas to facilitate this process.

7
III. STUDY DESIGN
This report addresses the question: Do TFA teachers improve (or, at least, not harm) student outcomes relative to what would have happened in their absence? To measure the impact of TFA teachers on students, ideally we would compare the experience of students assigned to TFA teachers with the same students’ experiences in the absence of TFA. Since this counterfactual could not be directly observed, we approximated it by using a comparison sample of non-TFA teachers teaching similar students in the same environment. Specifically, our estimation strategy was to compare outcomes of students taught by TFA teachers with outcomes of students taught by non-TFA, or control, teachers in the same schools and at the same grades.
The cornerstone of our design was the use of random assignment. We randomly assigned students to classrooms in order to ensure that the TFA and control teachers have essentially identical classes of students. Without random assignment, school principals might have given the most challenging students to specific teachers, making classroom comparisons more a reflection of student differences than teacher performance. Details of the random assignment procedure are discussed below, and evidence of the procedure’s overall success is presented in Chapter V.
For our analysis, we defined “control teachers” to include any teacher in the study who was
not a TFA corps member either at the time of the study or at any time in the past. “Control teachers” therefore included traditionally certified, alternatively certified, and uncertified teachers—any active teacher who came from any source other than TFA. “TFA teachers” included any teacher who entered the profession through TFA—both current TFA corps members in their first two years of teaching and alumni (former corps members) who were still teaching.
We conducted two types of comparisons of TFA and control teachers. First, we compared
classes taught by TFA teachers with classes taught by all control teachers, which could include both novice and veteran teachers. In this case, the average years of teaching experience was far higher for the control teachers than for the TFA teachers. To control for differences in teaching experience, we conducted a second type of comparison based on classes taught by novice TFA teachers with novice control teachers. We defined “novice teachers” as including teachers in one of their first three years of teaching during the study year.
Which of these two comparisons is most relevant is a matter of some debate. In the absence
of TFA, the students in our sample would have been taught by a mix of novices and veterans found in their schools. However, one might assume that if a TFA teacher were not hired, then some other, presumably novice, non-TFA teacher would be hired in his or her place. Rather than try to identify which comparison is most relevant from an empirical perspective, we simply examined both the “all teachers” and “novice only” comparisons.
Before the start of the academic year, we randomly assigned all students entering the
targeted grades to their classes. Throughout the year we conducted roster checks to monitor and enforce the original assignments. Randomization ensured that the classes in the targeted grades
8
were essentially identical with respect to the average characteristics of students assigned to the classes; consequently any differences in average outcomes can be attributed to differences in the teachers. In effect, this approach represents a series of mini-experiments at each school and grade, which are replicated across all the schools and grades in the study. Throughout this report, we refer to the TFA and control teachers in the same school and at the same grade—those making up one of the mini-experiments—as a comparison block.
To facilitate the use of random assignment, our study included only elementary students (grades 1 to 5). Elementary classes are generally structured to be similar within any given grade, so random assignment—which will generate essentially identical classes—is consistent with the class structure. Furthermore, students at these grade levels typically are assigned to homeroom teachers that teach both reading and math. As a result, we expected that students would receive reading and math instruction from the same teacher to whom they were randomly assigned. Elementary schools where students switched teachers for reading or math instruction, or “looped” students (who stay together with the same teacher from one grade to the next), were excluded from our study.
The evaluation was conducted in two stages. We first conducted a pilot study in one
region—Baltimore—during the 2001-2002 school year; then conducted a full-scale evaluation during the 2002-2003 school year in five additional regions—Chicago, Los Angeles, Houston, New Orleans, and the Mississippi Delta. The sample includes 6 of the 15 regions where TFA placed teachers at the time the study was being designed.2 The regions were selected after stratifying the regions according to the dominant race/ethnicity of students served (African American/Hispanic) by the schools and whether the region is an urban or rural one. To avoid arbitrary selection of regions, we randomly selected regions within strata when possible. Within the selected regions, a total of seven school districts participated in the study, since one region—the Mississippi Delta—had two districts included in the study. In Los Angeles, we selected the Compton district to participate in the study. Within each of the seven school districts, we randomly selected schools from those that had the staffing needed to support our design.3 The final research sample, which is summarized in Table III.1, consisted of 17 schools, 100 classrooms, and nearly 1,800 students.
The schools in our study were chosen to be broadly representative of the schools where TFA
placed teachers at the time of the evaluation. Since TFA places teachers in schools that are generally disadvantaged and face substantial teacher shortages, our study focused on these disadvantaged schools, not the average school in the United States. For example, across the 17 schools in our study, the average rate of student eligibility for free or reduced-price lunches was over 95 percent, compared with about 41 percent nationwide.
2We distinguish between regions and school districts. In some cases, mostly in the large urban regions, TFA works with a single district in a region. In other cases, particularly in the rural regions, TFA works with multiple districts in a region.
3Only schools with both TFA and control teachers at the same grade were candidates for the study. Given this requirement, our sample may be tilted somewhat toward larger schools and schools with greater teacher turnover, since these schools were probably more likely to have TFA and control teachers at the same grades.
9
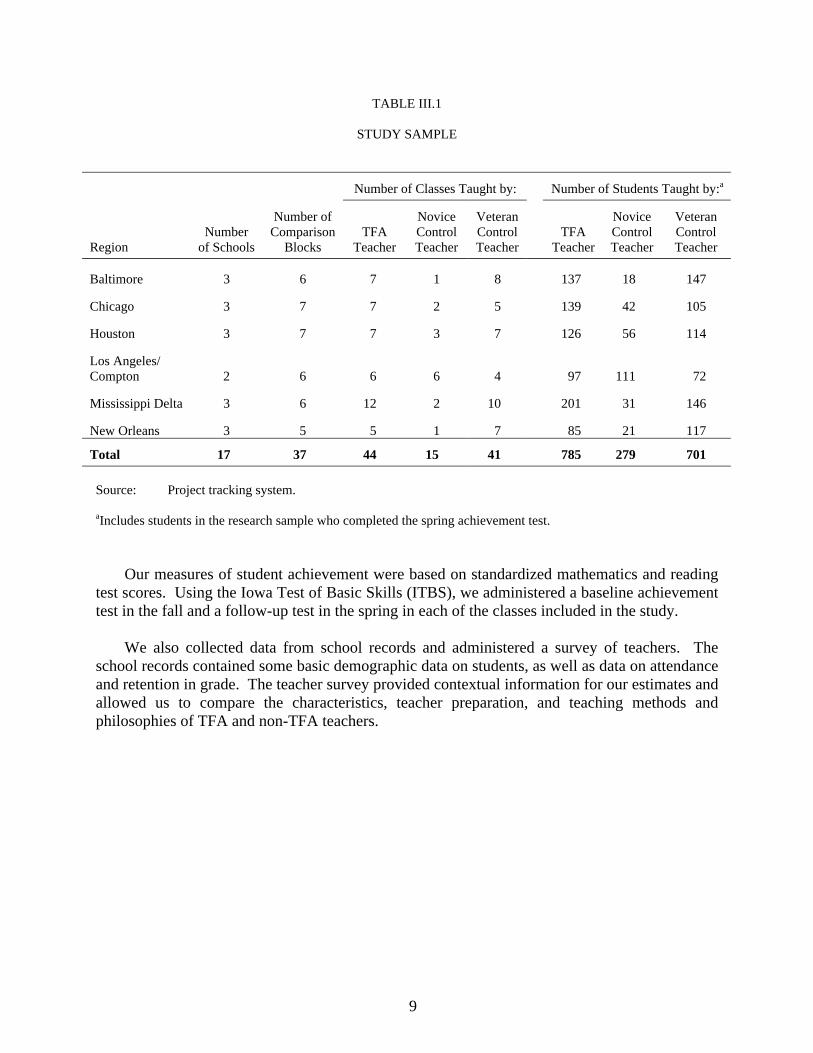
TABLE III.1
STUDY SAMPLE
Number of Classes Taught by: Number of Students Taught by:a
Region Number
of Schools
Number of Comparison
Blocks TFA
Teacher
Novice Control Teacher
Veteran Control Teacher
TFA
Teacher
Novice Control Teacher
Veteran Control Teacher
Baltimore 3 6 7 1 8 137 18 147
Chicago 3 7 7 2 5 139 42 105
Houston 3 7 7 3 7 126 56 114
Los Angeles/ Compton 2 6 6 6 4 97 111 72
Mississippi Delta 3 6 12 2 10 201 31 146
New Orleans 3 5 5 1 7 85 21 117
Total 17 37 44 15 41 785 279 701 Source: Project tracking system.
aIncludes students in the research sample who completed the spring achievement test.
Our measures of student achievement were based on standardized mathematics and reading
test scores. Using the Iowa Test of Basic Skills (ITBS), we administered a baseline achievement test in the fall and a follow-up test in the spring in each of the classes included in the study.
We also collected data from school records and administered a survey of teachers. The
school records contained some basic demographic data on students, as well as data on attendance and retention in grade. The teacher survey provided contextual information for our estimates and allowed us to compare the characteristics, teacher preparation, and teaching methods and philosophies of TFA and non-TFA teachers.

11
IV. WHO TEACHES IN THE SCHOOLS WHERE TFA PLACES TEACHERS?
The TFA program works with schools that serve disadvantaged students, have limited resources, and typically face substantial teacher shortages. Therefore, it is important to understand who normally teaches in those schools and how the TFA corps members compare in terms of background, experience, and teaching practices. We examine the characteristics of our control teachers who, by design, provide a picture of the teachers who would have been teaching in those schools in the absence of the TFA program, as well as the characteristics of the TFA teachers themselves.
We collected data on teachers by administering a survey late in the school year. The survey measured personal characteristics, preparation for teaching, teaching experience, career expectations, professional development, mathematics pedagogy, reading pedagogy, receipt of help in the classroom, and student behavior. Teachers in 98 of the 100 classrooms in our study completed a survey. Of those, 41 were TFA teachers and 57 were control teachers (18 novice teachers and 39 veterans).4
A. CONTROL TEACHERS HAD DIVERSE BACKGROUNDS
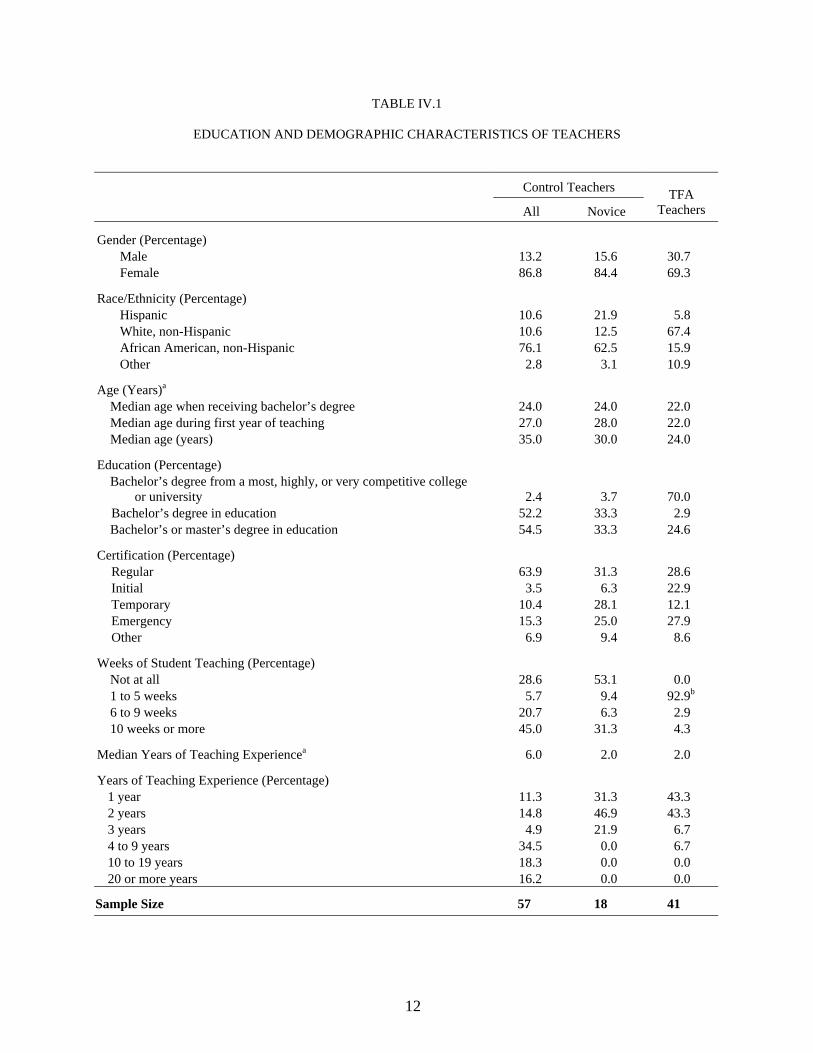
Most control teachers in our sample were female and non-white. Table IV.1 shows that nearly 9 out of 10 of the control teachers were women. About 76 percent of these teachers were African American, 11 percent were Hispanic, and 11 percent were white.
A majority of the control teachers in our sample (55 percent) had a bachelor’s or master’s degree in education (most were bachelor’s degrees), but 45 percent had no education degree at all (Table IV.1). In earning their bachelor’s degrees, only one control teacher in our sample attended a college classified as either “most competitive,” “highly competitive,” or “very competitive,” by the 2003 edition of Barron’s Profile of American Colleges.
Many, but not all, of the control teachers entered teaching through a traditional teacher certification route—they received their teacher training from an institution of higher education and possessed both a regular teaching certificate and student teaching experience prior to entering the classroom. Just over two-thirds (67 percent) of the control teachers held either a regular or an initial teaching certification in elementary education at the time of the survey, and nearly all of these certified teachers reported entering teaching through a traditional certification route. The remaining one-third of the control teachers had a temporary certification (10 percent), an emergency certification (15 percent), or some other type of provisional certification (7 percent). Surprisingly, although 45 percent of the control teachers had substantial student teaching experience (10 weeks or more) before they formally entered teaching, almost 30 percent had no student teaching experience.
4Eight classrooms experienced turnover of teachers during the school year, so the numbers
of novice controls, veteran controls, and TFA teachers who completed our spring questionnaire differed slightly from the numbers of whose who began the school year.
12
TABLE IV.1
EDUCATION AND DEMOGRAPHIC CHARACTERISTICS OF TEACHERS
Control Teachers
All Novice TFA
Teachers
Gender (Percentage) Male 13.2 15.6 30.7 Female 86.8 84.4 69.3
Race/Ethnicity (Percentage) Hispanic 10.6 21.9 5.8 White, non-Hispanic 10.6 12.5 67.4 African American, non-Hispanic 76.1 62.5 15.9 Other 2.8 3.1 10.9
Age (Years)a Median age when receiving bachelor’s degree 24.0 24.0 22.0 Median age during first year of teaching 27.0 28.0 22.0 Median age (years) 35.0 30.0 24.0
Education (Percentage) Bachelor’s degree from a most, highly, or very competitive college
or university 2.4 3.7 70.0 Bachelor’s degree in education 52.2 33.3 2.9 Bachelor’s or master’s degree in education 54.5 33.3 24.6
Certification (Percentage) Regular 63.9 31.3 28.6 Initial 3.5 6.3 22.9 Temporary 10.4 28.1 12.1 Emergency 15.3 25.0 27.9 Other 6.9 9.4 8.6
Weeks of Student Teaching (Percentage) Not at all 28.6 53.1 0.0 1 to 5 weeks 5.7 9.4 92.9b 6 to 9 weeks 20.7 6.3 2.9 10 weeks or more 45.0 31.3 4.3
Median Years of Teaching Experiencea 6.0 2.0 2.0
Years of Teaching Experience (Percentage) 1 year 11.3 31.3 43.3 2 years 14.8 46.9 43.3 3 years 4.9 21.9 6.7 4 to 9 years 34.5 0.0 6.7 10 to 19 years 18.3 0.0 0.0 20 or more years 16.2 0.0 0.0
Sample Size 57 18 41
TABLE IV.1 (continued) _____________________________________________________________________________________________
13
Source: Teacher survey. Note: The p-values for the treatment-control differences are presented in Appendix A along with separate
analyses that compare novice controls to only the TFA teachers in their grades and schools. aWe report the median age and experience because the means are affected by a small number of outliers. The mean age and experience are slightly higher than the medians reported here.
bWhile a number of TFA teachers responded that they had no student teaching at all, we set their value to “1 to 5 weeks” because all TFA teachers practice-teach for four weeks at the TFA summer institute.
14
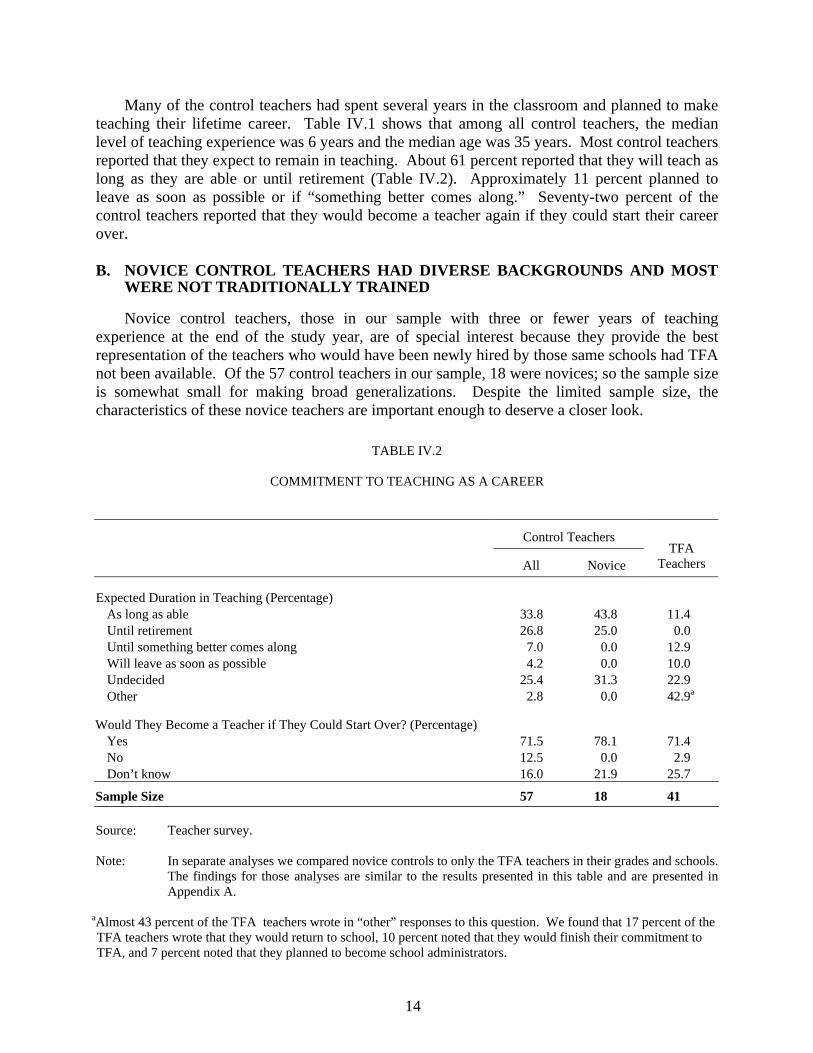
Many of the control teachers had spent several years in the classroom and planned to make teaching their lifetime career. Table IV.1 shows that among all control teachers, the median level of teaching experience was 6 years and the median age was 35 years. Most control teachers reported that they expect to remain in teaching. About 61 percent reported that they will teach as long as they are able or until retirement (Table IV.2). Approximately 11 percent planned to leave as soon as possible or if “something better comes along.” Seventy-two percent of the control teachers reported that they would become a teacher again if they could start their career over.
B. NOVICE CONTROL TEACHERS HAD DIVERSE BACKGROUNDS AND MOST WERE NOT TRADITIONALLY TRAINED
Novice control teachers, those in our sample with three or fewer years of teaching experience at the end of the study year, are of special interest because they provide the best representation of the teachers who would have been newly hired by those same schools had TFA not been available. Of the 57 control teachers in our sample, 18 were novices; so the sample size is somewhat small for making broad generalizations. Despite the limited sample size, the characteristics of these novice teachers are important enough to deserve a closer look.
TABLE IV.2
COMMITMENT TO TEACHING AS A CAREER
Control Teachers
All Novice TFA
Teachers
Expected Duration in Teaching (Percentage) As long as able 33.8 43.8 11.4 Until retirement 26.8 25.0 0.0 Until something better comes along 7.0 0.0 12.9 Will leave as soon as possible 4.2 0.0 10.0 Undecided 25.4 31.3 22.9 Other 2.8 0.0 42.9a
Would They Become a Teacher if They Could Start Over? (Percentage) Yes 71.5 78.1 71.4 No 12.5 0.0 2.9 Don’t know 16.0 21.9 25.7
Sample Size 57 18 41 Source: Teacher survey. Note: In separate analyses we compared novice controls to only the TFA teachers in their grades and schools.
The findings for those analyses are similar to the results presented in this table and are presented in Appendix A.
aAlmost 43 percent of the TFA teachers wrote in “other” responses to this question. We found that 17 percent of the TFA teachers wrote that they would return to school, 10 percent noted that they would finish their commitment to TFA, and 7 percent noted that they planned to become school administrators.
15
As with the full control group, the novice control teachers tended to be female and non-white. The novice group was 84 percent female (Table IV.1). About 63 percent of the novices in our sample were African American, 22 percent were Hispanic, and 13 percent were white. (The novice teachers in our sample were found to be somewhat disproportionately in regions with large Hispanic populations.)
Not surprisingly, novices were younger than the full sample and, by definition, inexperienced. They were not as young as typical college graduates, however. Their median age was 30 years, with 3 of the 18 teachers being over 40 years old. In other words, the pool of novice teachers in these schools includes some who enter the profession later in life. Numbers presented in Table IV.1 suggest that part of the reason for this is that the control teachers, on average, earned their bachelor’s degrees relatively late—the median age of the control teachers at college graduation was 24.
Most of the novice control teachers did not have substantial teaching-related training. Table IV.1 shows that only one-third of the novice control teachers possessed a bachelor’s degree in education, and none possessed a master’s degree in education at the time of the survey. Prior to entering teaching, only 31 percent had spent 10 or more weeks student teaching, and 53 percent had no student teaching experience at all. Less than 38 percent of the novice control teachers reported having a regular or initial teacher certification, and more than 50 percent reported having a temporary or emergency certification. Only one of the novice non-TFA teachers attended a college classified as “most competitive,” “highly competitive,” or “very competitive,” according to Barron’s Profile of American Colleges.
Most novice control teachers appeared committed to long careers in teaching. A substantial proportion of them reported that they expect to teach indefinitely. According to Table IV.2, more than 68 percent said that they will teach as long as they were able or until retirement. Furthermore, none of the novice control teachers expect to leave as soon as possible or when something better comes along, although almost one-third say they are undecided about how long they will teach. Finally, most reported that they would become a teacher if they could start their career over again.
These findings reinforce what we learned in our discussions with principals and other school
staff and what we learned from reviewing national data on teacher training—that the control teachers have a broad mix of backgrounds and teacher preparation and that they have different training than the average elementary school teacher. The survey findings suggest that the control teachers in the schools in our study, particularly the novice teachers, did not all enter teaching through a strictly traditional, education-based preparation route in which they were fully trained prior to their entry into the classroom. National data also suggest that the control teachers are less likely to have education-specific training and less likely to have gone to competitive colleges than the average elementary school teacher in the county. For example, the 1999–2001 Schools and Staffing Survey (SASS) documents that more than 76 percent of the nation’s public elementary school teachers either majored or minored in elementary education when earning their bachelor’s degrees. In contrast, only 61 percent of the control teachers had majored or minored in elementary education. In addition, according to SASS, 95 percent of the country’s elementary teachers, and 84 percent of the country’s novice elementary teachers, had regular or initial certification in elementary education. This stands in sharp contrast to the full group of control teachers, and the novice control teachers, of whom only 67 and 38 percent, respectively,
16
had regular or initial certification in elementary education. Finally, 22 percent of all public elementary teachers in the nation had attended colleges classified as “most competitive,” “highly competitive,” or “very competitive” by the 2003 edition of Barron’s Profile of American Colleges, while only 3 percent of the control teachers attended colleges that were that competitive.
C. TFA TEACHERS’ BACKGROUNDS REFLECTED THE PROGRAM’S STRUCTURE
The TFA teachers in our sample generally had characteristics consistent with the nature and structure of the TFA program. With respect to demographics, TFA teachers in our sample were more likely to be female than male, although the proportion who were female was substantially lower than for the control group. A majority (67 percent) of the TFA teachers were white, which contrasts sharply with the control teachers. Most TFA teachers began teaching immediately after receiving their bachelor’s degree.5
Relative to the control teachers, TFA teachers in our sample stand out in terms of the
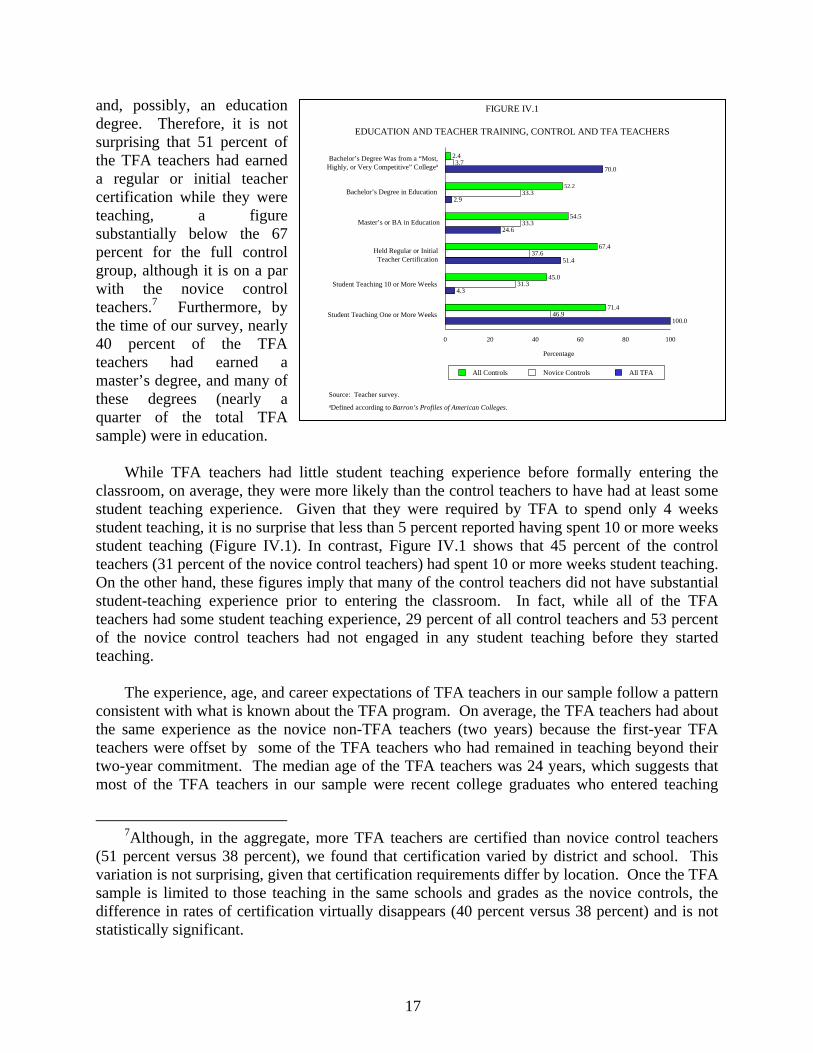
competitiveness of their undergraduate institutions.6 Figure IV.1 highlights the differences between the preparation of the TFA and control teachers. More than two-thirds of the TFA teachers in our sample graduated from undergraduate colleges classified as “most competitive,” “highly competitive,” or “very competitive,” by Barron’s Profile. As shown in Figure IV.1, TFA teachers were more likely than control teachers to have graduated from colleges ranked at these levels. This finding is not surprising, since TFA generally targets their recruitment to the most competitive undergraduate institutions.
Although the TFA teachers went to highly competitive colleges, most TFA teachers did not
have substantial education-related training prior to entering the classroom. Figure IV.1 shows that only 3 percent of the TFA teachers had a bachelor’s degree in education, which is consistent with the program’s strategy of generally targeting candidates with non-education majors. However, as noted in the description of the TFA program in Chapter II, once TFA teachers begin teaching in a region, they must meet the state and district teacher preparation requirements. Meeting these requirements usually entails taking education courses toward teaching certification
5Our sample of TFA teachers is broadly representative of TFA corps members nationwide.
For example, 69 percent of our sample and 76 percent of the 2000–2002 TFA corps were female. Our sample was 67 percent white, 16 percent black and 6 percent Hispanic, while the national TFA corps was 64 percent white, 18 percent black, and 6 percent Hispanic. Seventy percent of our TFA corps members, versus 80 percent nationally in the 2000–2002 cohorts, graduated from colleges that were “most competitive,” “highly competitive,” or “very competitive.”
6We tested whether TFA and control teachers had statistically significant differences on each of the characteristics presented in Tables IV.1 through IV.4. The p-values associated with these tests are presented in Appendix A. Unless it is stated in the text that a relationship is not statistically significant, all TFA/control differences referred to in the text are statistically significant with a p-value of 0.10 or less.
17
and, possibly, an education degree. Therefore, it is not surprising that 51 percent of the TFA teachers had earned a regular or initial teacher certification while they were teaching, a figure substantially below the 67 percent for the full control group, although it is on a par with the novice control teachers.7 Furthermore, by the time of our survey, nearly 40 percent of the TFA teachers had earned a master’s degree, and many of these degrees (nearly a quarter of the total TFA sample) were in education.
While TFA teachers had little student teaching experience before formally entering the classroom, on average, they were more likely than the control teachers to have had at least some student teaching experience. Given that they were required by TFA to spend only 4 weeks student teaching, it is no surprise that less than 5 percent reported having spent 10 or more weeks student teaching (Figure IV.1). In contrast, Figure IV.1 shows that 45 percent of the control teachers (31 percent of the novice control teachers) had spent 10 or more weeks student teaching. On the other hand, these figures imply that many of the control teachers did not have substantial student-teaching experience prior to entering the classroom. In fact, while all of the TFA teachers had some student teaching experience, 29 percent of all control teachers and 53 percent of the novice control teachers had not engaged in any student teaching before they started teaching.
The experience, age, and career expectations of TFA teachers in our sample follow a pattern
consistent with what is known about the TFA program. On average, the TFA teachers had about the same experience as the novice non-TFA teachers (two years) because the first-year TFA teachers were offset by some of the TFA teachers who had remained in teaching beyond their two-year commitment. The median age of the TFA teachers was 24 years, which suggests that most of the TFA teachers in our sample were recent college graduates who entered teaching
7Although, in the aggregate, more TFA teachers are certified than novice control teachers
(51 percent versus 38 percent), we found that certification varied by district and school. This variation is not surprising, given that certification requirements differ by location. Once the TFA sample is limited to those teaching in the same schools and grades as the novice controls, the difference in rates of certification virtually disappears (40 percent versus 38 percent) and is not statistically significant.
FIGURE IV.1
EDUCATION AND TEACHER TRAINING, CONTROL AND TFA TEACHERS
Source: Teacher survey.aDefined according to Barron’s Profiles of American Colleges.
100.0
4.3
51.4
24.6
2.9
70.0
46.9
31.3
37.6
33.3
33.3
3.7
71.4
45.0
67.4
54.5
2.4
52.2
0 20 40 60 80 100
Bachelor’s Degree Was from a “Most, Highly, or Very Competitive” Collegea
Master’s or BA in Education
Held Regular or InitialTeacher Certification
Student Teaching 10 or More Weeks
Percentage
All Controls Novice Controls All TFA
Bachelor’s Degree in Education
Student Teaching One or More Weeks
18
directly from college. This is consistent with the observation that the TFA program largely begins recruiting students in their senior year of college.
Furthermore, as expected, few of the TFA teachers anticipated a long career in teaching. As
with the control teachers, most of the TFA teachers reported that they would enter teaching if they could start their career over again, but only 11 percent reported that they expect to remain in teaching as long as they are able, and none expected to teach until retirement (Table IV.2),. This is substantially lower than the 69 percent of novice control teachers who gave either response. The responses suggest that many of the TFA teachers expect to leave teaching once their two-year commitment is complete. However, despite being less committed to a teaching career than non-TFA teachers, almost a quarter of the TFA teachers are undecided about their future and thus may be at least considering remaining beyond two years. A survey conducted by TFA in 2003 shows that TFA teachers do not completely exit the profession when their formal commitment to TFA ends. The survey indicates that 34 percent of the alumni were still teaching in primary or secondary schools. In addition, 25 percent of the alumni were working in the field of education either in administrative positions, at non-profits, or at some other type of educational setting.
D. TFA AND CONTROL TEACHERS HAD SIMILAR INSTRUCTIONAL PRACTICES, DIFFERENT PHILOSOPHIES
Teachers hired and trained through the TFA program may teach differently than the control teachers in our sample; and this, in turn, could help explain any observed differences in the math and reading scores of their students. We asked teachers to report the amount of time they spent using different instructional modes such as lecturing, placing students in small groups, or asking them to work independently. In addition, we asked them questions about their philosophy and approach to mathematics and reading instruction. As we will illustrate below, there were no meaningful differences in instructional modes, but there were differences in philosophy.
In both math and reading, the TFA and control teachers utilized each instructional mode for
similar amounts of time (Table IV.3). In both subjects, the most popular mode was teacher-directed whole-class activities. Teacher-directed small-group activities, students working independently in small groups, and students working individually on class assignments were the next most popular modes. The mode used least often was allowing students to select their own activities.
Although the general modes for delivering instruction were similar, the teachers differed in
mathematics and reading philosophies. We measured teacher’s philosophical orientation by gauging their beliefs and their actual practices, which are shown in Table IV.4. We measured both concepts because teachers’ beliefs and practices may not always be consistent.
Survey responses from teachers suggest that the control teachers were more likely than TFA
teachers to embrace a phonics orientation (Table IV.4). Based on teachers’ responses to 28 statements contained in Deford’s Theoretical Orientation to Reading scale, the control teachers’ responses indicate that they are closer to a phonics orientation than the TFA teachers.
19
TABLE IV. 3
INSTRUCTIONAL MODES
Control Teachers
All Novice TFA Teachers
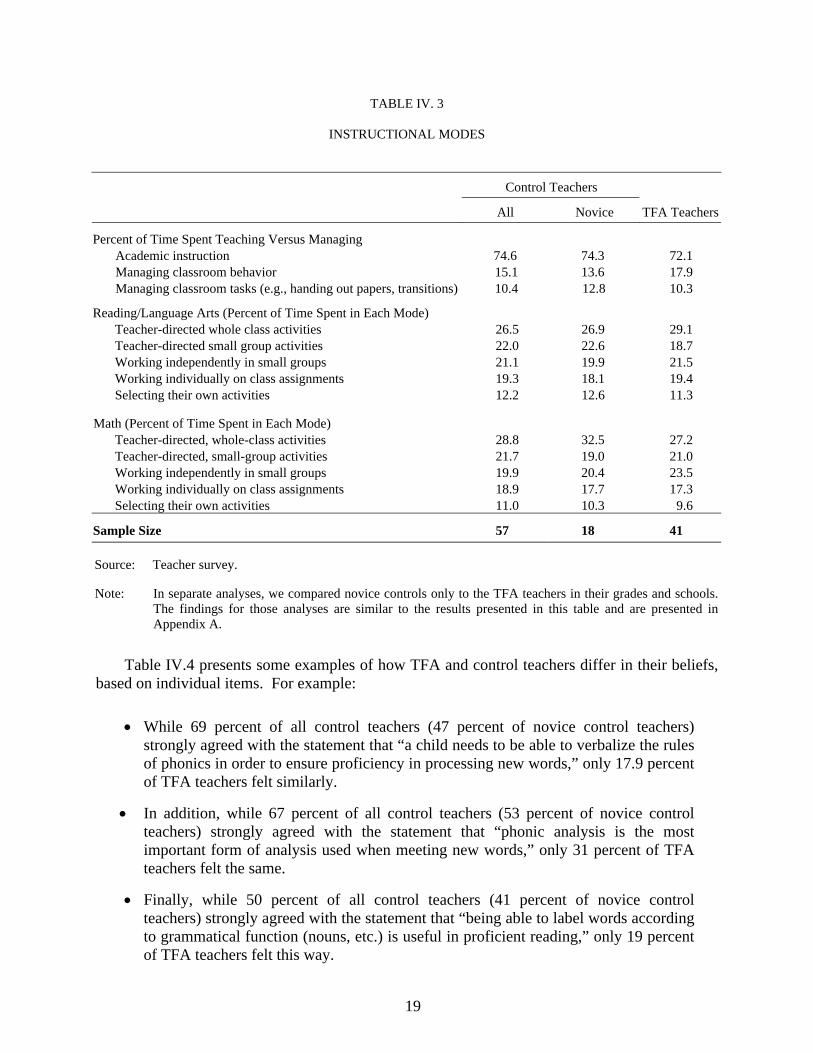
Percent of Time Spent Teaching Versus Managing Academic instruction 74.6 74.3 72.1 Managing classroom behavior 15.1 13.6 17.9 Managing classroom tasks (e.g., handing out papers, transitions) 10.4 12.8 10.3
Reading/Language Arts (Percent of Time Spent in Each Mode) Teacher-directed whole class activities 26.5 26.9 29.1 Teacher-directed small group activities 22.0 22.6 18.7 Working independently in small groups 21.1 19.9 21.5 Working individually on class assignments 19.3 18.1 19.4 Selecting their own activities 12.2 12.6 11.3
Math (Percent of Time Spent in Each Mode)
Teacher-directed, whole-class activities 28.8 32.5 27.2 Teacher-directed, small-group activities 21.7 19.0 21.0 Working independently in small groups 19.9 20.4 23.5 Working individually on class assignments 18.9 17.7 17.3 Selecting their own activities 11.0 10.3 9.6
Sample Size 57 18 41 Source: Teacher survey. Note: In separate analyses, we compared novice controls only to the TFA teachers in their grades and schools.
The findings for those analyses are similar to the results presented in this table and are presented in Appendix A.
Table IV.4 presents some examples of how TFA and control teachers differ in their beliefs, based on individual items. For example:
• While 69 percent of all control teachers (47 percent of novice control teachers) strongly agreed with the statement that “a child needs to be able to verbalize the rules of phonics in order to ensure proficiency in processing new words,” only 17.9 percent of TFA teachers felt similarly.
• In addition, while 67 percent of all control teachers (53 percent of novice control teachers) strongly agreed with the statement that “phonic analysis is the most important form of analysis used when meeting new words,” only 31 percent of TFA teachers felt the same.
• Finally, while 50 percent of all control teachers (41 percent of novice control teachers) strongly agreed with the statement that “being able to label words according to grammatical function (nouns, etc.) is useful in proficient reading,” only 19 percent of TFA teachers felt this way.
20
TABLE IV.4
INSTRUCTIONAL PHILOSOPHIES AND PRACTICES
Control Teachers
All Novice TFA Teachers
Reading/Language Arts
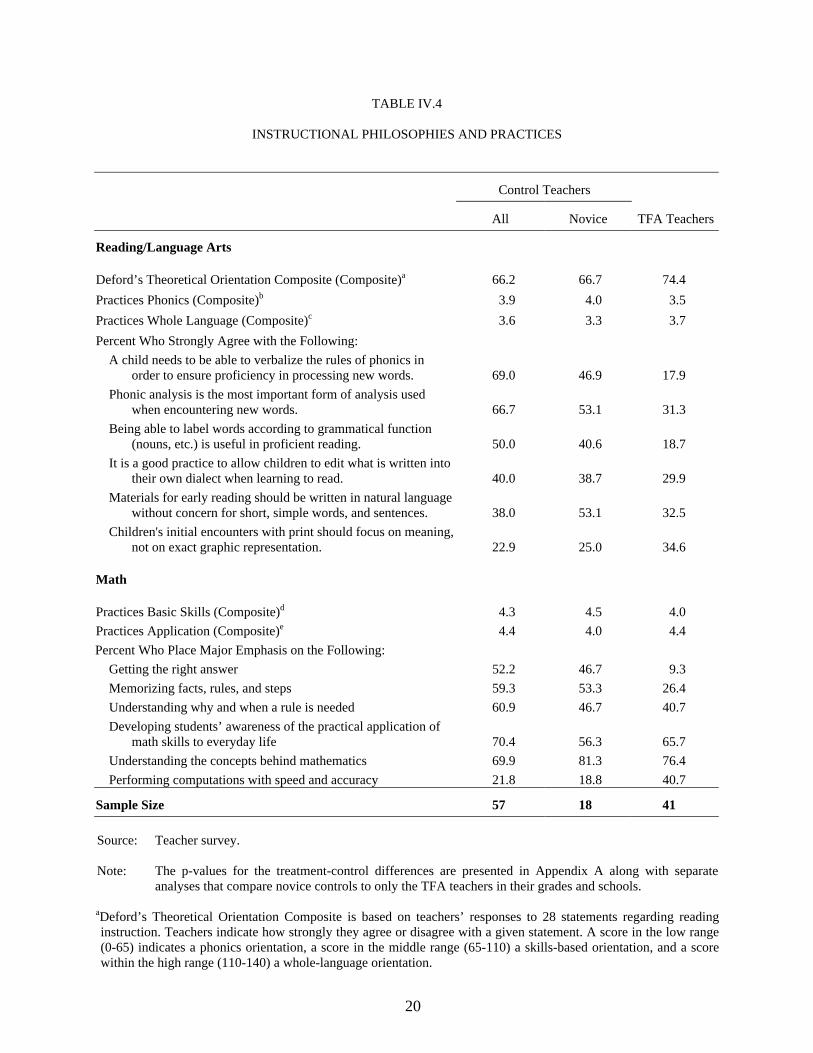
Deford’s Theoretical Orientation Composite (Composite)a 66.2 66.7 74.4 Practices Phonics (Composite)b 3.9 4.0 3.5 Practices Whole Language (Composite)c 3.6 3.3 3.7 Percent Who Strongly Agree with the Following:
A child needs to be able to verbalize the rules of phonics in order to ensure proficiency in processing new words. 69.0 46.9 17.9
Phonic analysis is the most important form of analysis used when encountering new words. 66.7 53.1 31.3
Being able to label words according to grammatical function (nouns, etc.) is useful in proficient reading. 50.0 40.6 18.7
It is a good practice to allow children to edit what is written into their own dialect when learning to read. 40.0 38.7 29.9
Materials for early reading should be written in natural language without concern for short, simple words, and sentences. 38.0 53.1 32.5
Children's initial encounters with print should focus on meaning, not on exact graphic representation. 22.9 25.0 34.6
Math
Practices Basic Skills (Composite)d 4.3 4.5 4.0 Practices Application (Composite)e 4.4 4.0 4.4 Percent Who Place Major Emphasis on the Following:
Getting the right answer 52.2 46.7 9.3 Memorizing facts, rules, and steps 59.3 53.3 26.4 Understanding why and when a rule is needed 60.9 46.7 40.7 Developing students’ awareness of the practical application of
math skills to everyday life 70.4 56.3 65.7 Understanding the concepts behind mathematics 69.9 81.3 76.4 Performing computations with speed and accuracy 21.8 18.8 40.7
Sample Size 57 18 41 Source: Teacher survey. Note: The p-values for the treatment-control differences are presented in Appendix A along with separate
analyses that compare novice controls to only the TFA teachers in their grades and schools. aDeford’s Theoretical Orientation Composite is based on teachers’ responses to 28 statements regarding reading instruction. Teachers indicate how strongly they agree or disagree with a given statement. A score in the low range (0-65) indicates a phonics orientation, a score in the middle range (65-110) a skills-based orientation, and a score within the high range (110-140) a whole-language orientation.
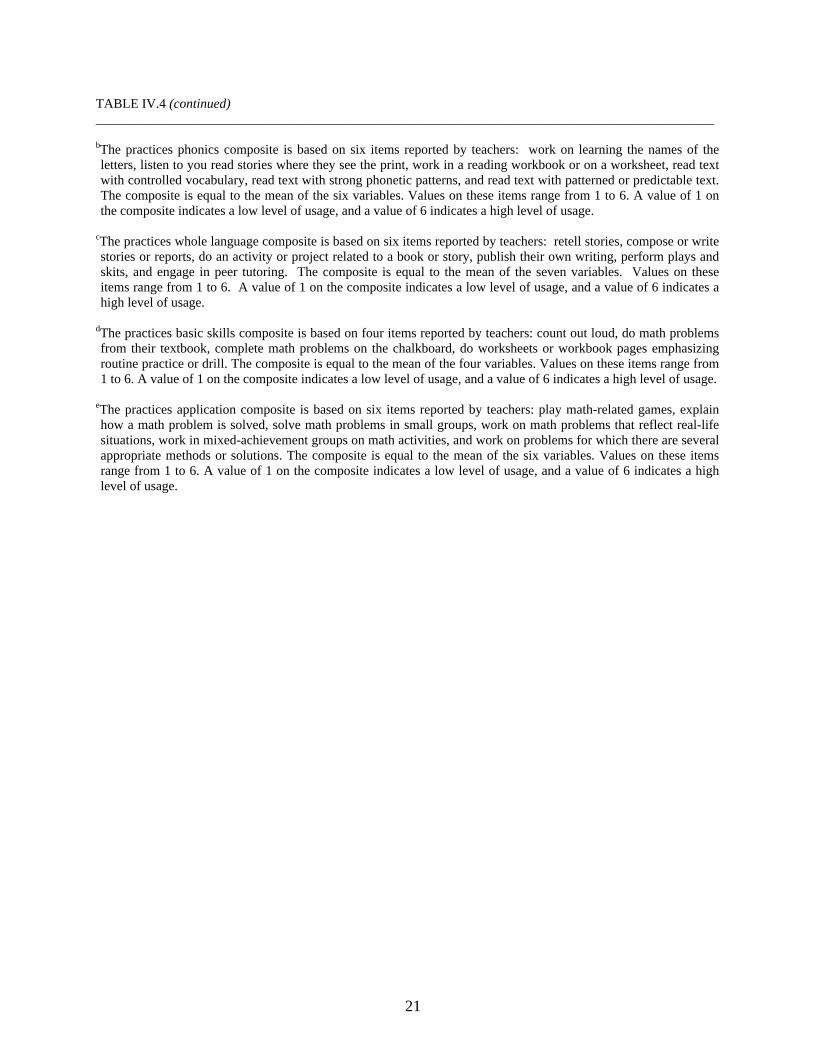
TABLE IV.4 (continued) _____________________________________________________________________________________________
21
bThe practices phonics composite is based on six items reported by teachers: work on learning the names of the letters, listen to you read stories where they see the print, work in a reading workbook or on a worksheet, read text with controlled vocabulary, read text with strong phonetic patterns, and read text with patterned or predictable text. The composite is equal to the mean of the six variables. Values on these items range from 1 to 6. A value of 1 on the composite indicates a low level of usage, and a value of 6 indicates a high level of usage.
cThe practices whole language composite is based on six items reported by teachers: retell stories, compose or write stories or reports, do an activity or project related to a book or story, publish their own writing, perform plays and skits, and engage in peer tutoring. The composite is equal to the mean of the seven variables. Values on these items range from 1 to 6. A value of 1 on the composite indicates a low level of usage, and a value of 6 indicates a high level of usage.
dThe practices basic skills composite is based on four items reported by teachers: count out loud, do math problems from their textbook, complete math problems on the chalkboard, do worksheets or workbook pages emphasizing routine practice or drill. The composite is equal to the mean of the four variables. Values on these items range from 1 to 6. A value of 1 on the composite indicates a low level of usage, and a value of 6 indicates a high level of usage.
eThe practices application composite is based on six items reported by teachers: play math-related games, explain how a math problem is solved, solve math problems in small groups, work on math problems that reflect real-life situations, work in mixed-achievement groups on math activities, and work on problems for which there are several appropriate methods or solutions. The composite is equal to the mean of the six variables. Values on these items range from 1 to 6. A value of 1 on the composite indicates a low level of usage, and a value of 6 indicates a high level of usage.
22
The differences in how the TFA and control teachers reported teaching their classes was not as pronounced as what they reported about their beliefs. While results based on a phonics practices composite suggests that the TFA teachers may be less likely to use a phonics-based approach than the control teachers, the difference is not statistically significant (p-value 0.12). On the other hand, when the novice control teachers are compared to the TFA teachers teaching in the same schools the novice control teachers are significantly more likely to use a phonics approach (p-value 0.04).
In mathematics, a comparison of the control and TFA teachers revealed both similarities and
differences. Both types of teachers placed a major emphasis on understanding mathematics in an applied fashion, but control teachers were more likely than TFA teachers to believe that emphasizing getting the answer right and memorizing mathematical rules are important. TFA teachers were more likely than control teachers to believe that computational speed and accuracy are important. For example, Table IV.4 shows the following:
• 52 percent of all control teachers (47 percent of novice controls) place a major emphasis on “getting the answer right,” compared to only 9 percent of TFA teachers.
• While 59 percent of control teachers (53 percent of novice control teachers) placed a major emphasis on memorizing facts, rules and steps, only 26 percent of TFA teachers placed a major emphasis on these skills.
• Only 22 percent of control teachers (19 percent of novice control teachers) placed a major emphasis on performing computations with speed and accuracy, but 41 percent of TFA teachers emphasized these skills.
As with reading, the TFA/control differences in reported practices are not as strong as the
differences in reported beliefs. Findings based on a mathematics practices composite suggests that the TFA teachers may be less likely to use a basic skills approach than the control teachers, but the difference is not statistically significant (p-value 0.12). On the other hand, when the novice control TFA teachers are compared to the TFA teachers teaching in the same schools, the novice control teachers are significantly more likely to use a basic skills approach (p-value 0.07).
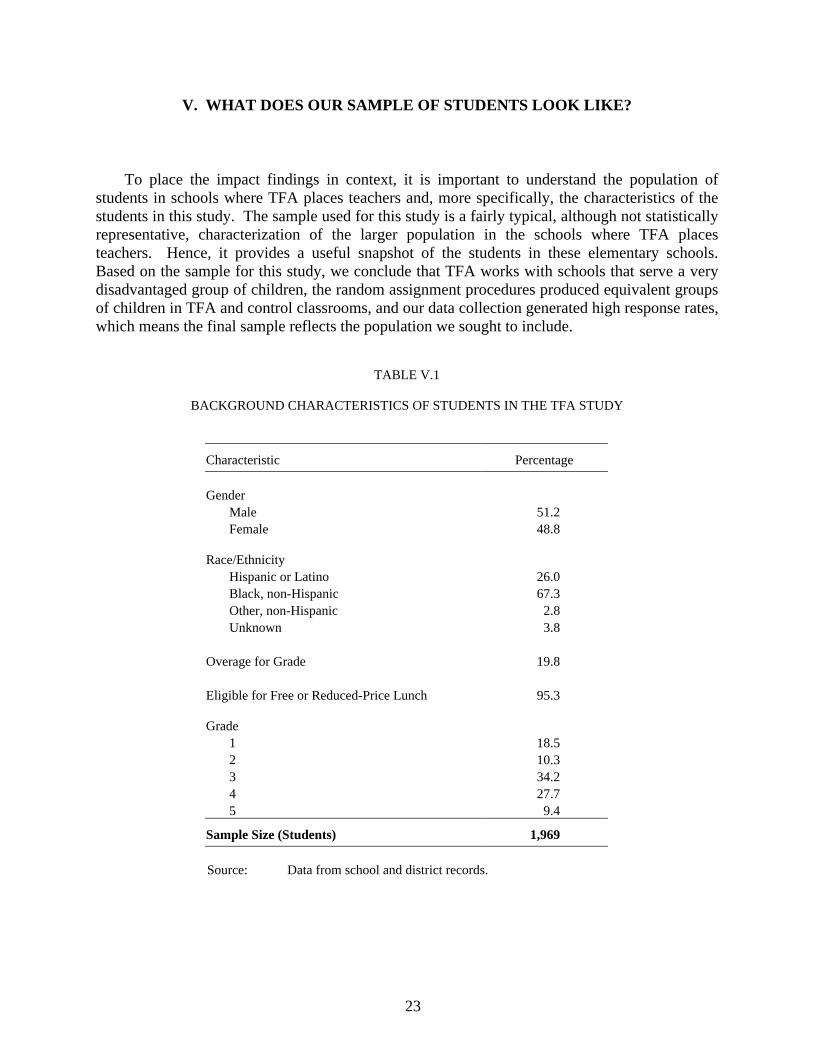
23
V. WHAT DOES OUR SAMPLE OF STUDENTS LOOK LIKE?
To place the impact findings in context, it is important to understand the population of students in schools where TFA places teachers and, more specifically, the characteristics of the students in this study. The sample used for this study is a fairly typical, although not statistically representative, characterization of the larger population in the schools where TFA places teachers. Hence, it provides a useful snapshot of the students in these elementary schools. Based on the sample for this study, we conclude that TFA works with schools that serve a very disadvantaged group of children, the random assignment procedures produced equivalent groups of children in TFA and control classrooms, and our data collection generated high response rates, which means the final sample reflects the population we sought to include.
TABLE V.1
BACKGROUND CHARACTERISTICS OF STUDENTS IN THE TFA STUDY
Characteristic Percentage Gender
Male 51.2 Female 48.8
Race/Ethnicity
Hispanic or Latino 26.0 Black, non-Hispanic 67.3 Other, non-Hispanic 2.8 Unknown 3.8
Overage for Grade 19.8 Eligible for Free or Reduced-Price Lunch 95.3 Grade
1 18.5 2 10.3 3 34.2 4 27.7 5 9.4
Sample Size (Students) 1,969 Source: Data from school and district records.
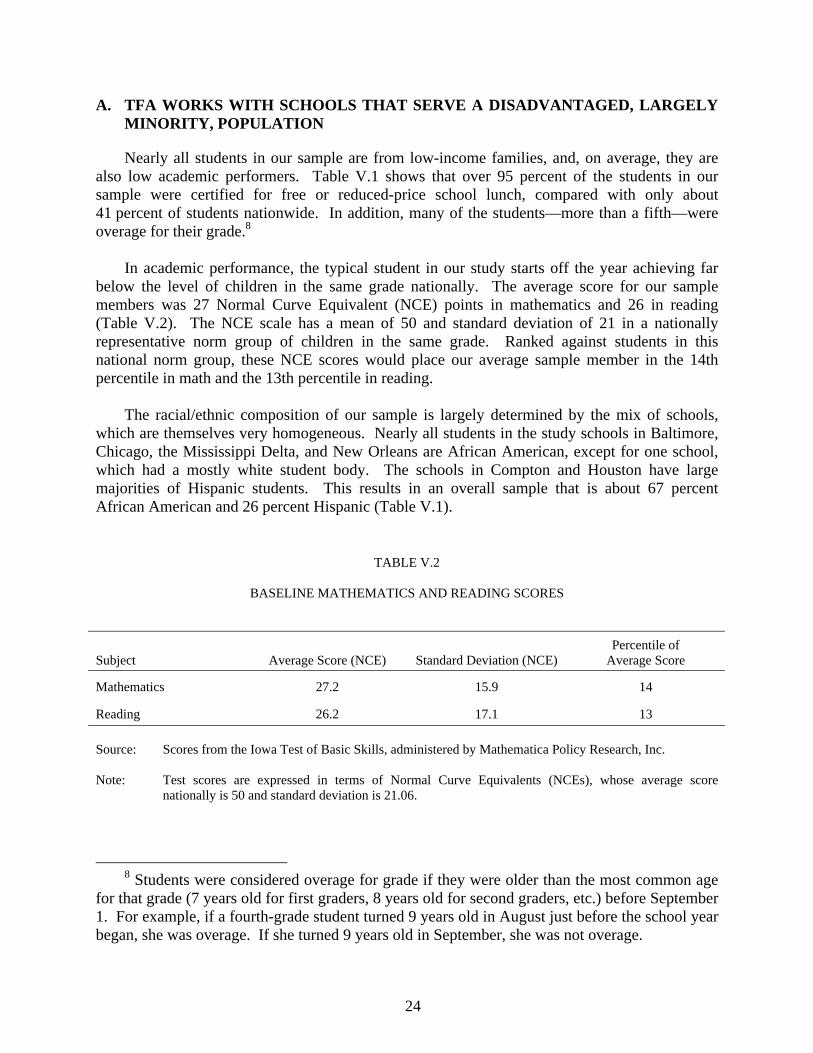
24
A. TFA WORKS WITH SCHOOLS THAT SERVE A DISADVANTAGED, LARGELY MINORITY, POPULATION
Nearly all students in our sample are from low-income families, and, on average, they are also low academic performers. Table V.1 shows that over 95 percent of the students in our sample were certified for free or reduced-price school lunch, compared with only about 41 percent of students nationwide. In addition, many of the students—more than a fifth—were overage for their grade.8
In academic performance, the typical student in our study starts off the year achieving far
below the level of children in the same grade nationally. The average score for our sample members was 27 Normal Curve Equivalent (NCE) points in mathematics and 26 in reading (Table V.2). The NCE scale has a mean of 50 and standard deviation of 21 in a nationally representative norm group of children in the same grade. Ranked against students in this national norm group, these NCE scores would place our average sample member in the 14th percentile in math and the 13th percentile in reading.
The racial/ethnic composition of our sample is largely determined by the mix of schools,
which are themselves very homogeneous. Nearly all students in the study schools in Baltimore, Chicago, the Mississippi Delta, and New Orleans are African American, except for one school, which had a mostly white student body. The schools in Compton and Houston have large majorities of Hispanic students. This results in an overall sample that is about 67 percent African American and 26 percent Hispanic (Table V.1).
TABLE V.2
BASELINE MATHEMATICS AND READING SCORES
Subject Average Score (NCE) Standard Deviation (NCE) Percentile of
Average Score
Mathematics 27.2 15.9 14
Reading 26.2 17.1 13 Source: Scores from the Iowa Test of Basic Skills, administered by Mathematica Policy Research, Inc. Note: Test scores are expressed in terms of Normal Curve Equivalents (NCEs), whose average score
nationally is 50 and standard deviation is 21.06.
8 Students were considered overage for grade if they were older than the most common age
for that grade (7 years old for first graders, 8 years old for second graders, etc.) before September 1. For example, if a fourth-grade student turned 9 years old in August just before the school year began, she was overage. If she turned 9 years old in September, she was not overage.
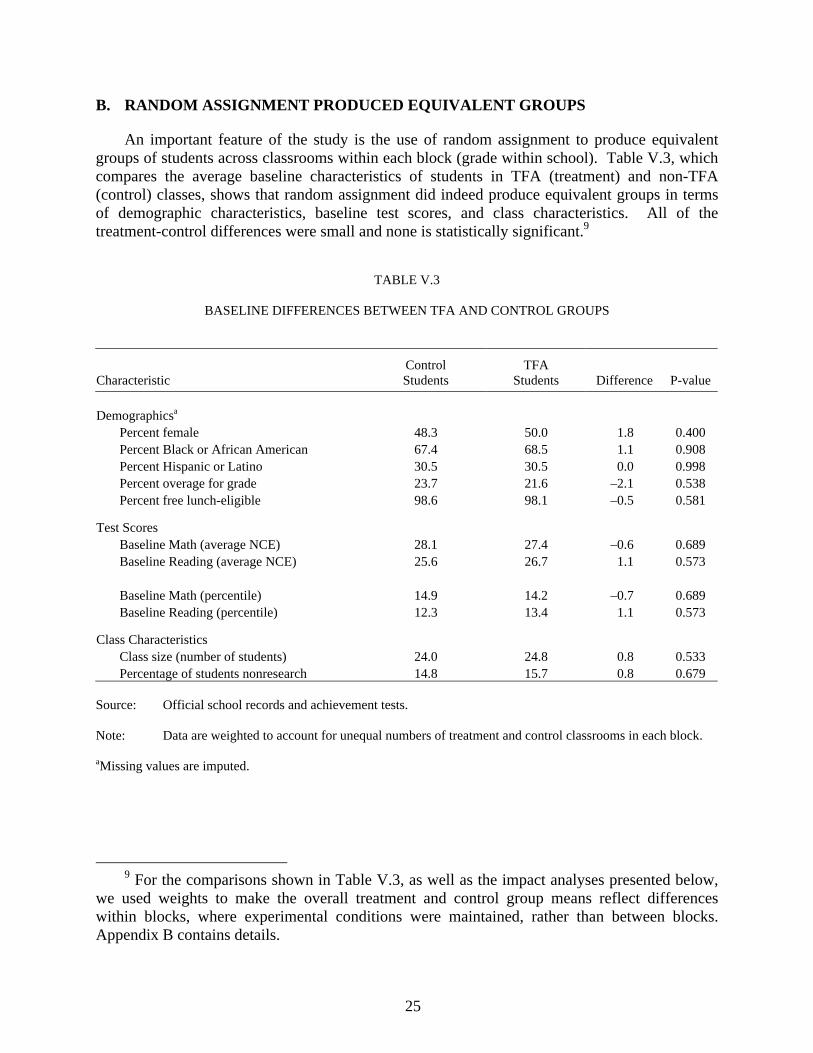
25
B. RANDOM ASSIGNMENT PRODUCED EQUIVALENT GROUPS
An important feature of the study is the use of random assignment to produce equivalent groups of students across classrooms within each block (grade within school). Table V.3, which compares the average baseline characteristics of students in TFA (treatment) and non-TFA (control) classes, shows that random assignment did indeed produce equivalent groups in terms of demographic characteristics, baseline test scores, and class characteristics. All of the treatment-control differences were small and none is statistically significant.9
TABLE V.3
BASELINE DIFFERENCES BETWEEN TFA AND CONTROL GROUPS
Characteristic Control Students
TFA Students Difference P-value
Demographicsa
Percent female 48.3 50.0 1.8 0.400 Percent Black or African American 67.4 68.5 1.1 0.908 Percent Hispanic or Latino 30.5 30.5 0.0 0.998 Percent overage for grade 23.7 21.6 –2.1 0.538 Percent free lunch-eligible 98.6 98.1 –0.5 0.581
Test Scores Baseline Math (average NCE) 28.1 27.4 –0.6 0.689 Baseline Reading (average NCE) 25.6 26.7 1.1 0.573 Baseline Math (percentile) 14.9 14.2 –0.7 0.689 Baseline Reading (percentile) 12.3 13.4 1.1 0.573
Class Characteristics Class size (number of students) 24.0 24.8 0.8 0.533 Percentage of students nonresearch 14.8 15.7 0.8 0.679
Source: Official school records and achievement tests. Note: Data are weighted to account for unequal numbers of treatment and control classrooms in each block. aMissing values are imputed.
9 For the comparisons shown in Table V.3, as well as the impact analyses presented below,
we used weights to make the overall treatment and control group means reflect differences within blocks, where experimental conditions were maintained, rather than between blocks. Appendix B contains details.
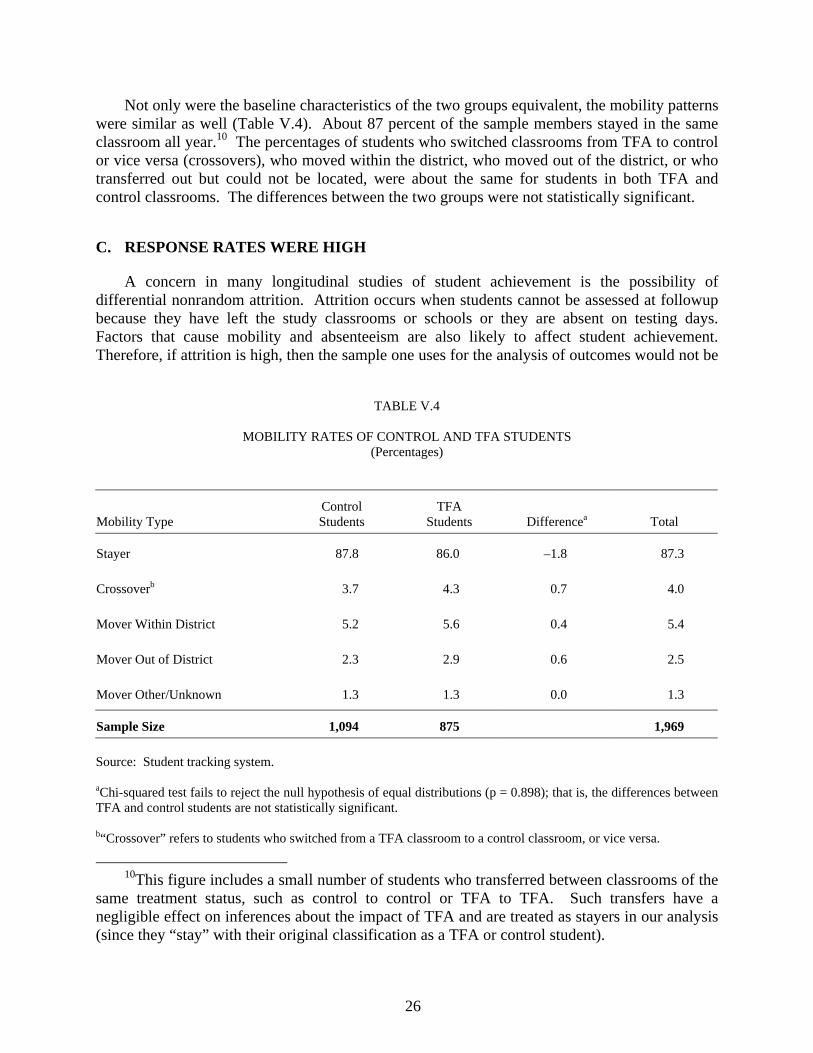
26
Not only were the baseline characteristics of the two groups equivalent, the mobility patterns were similar as well (Table V.4). About 87 percent of the sample members stayed in the same classroom all year.10 The percentages of students who switched classrooms from TFA to control or vice versa (crossovers), who moved within the district, who moved out of the district, or who transferred out but could not be located, were about the same for students in both TFA and control classrooms. The differences between the two groups were not statistically significant.
C. RESPONSE RATES WERE HIGH
A concern in many longitudinal studies of student achievement is the possibility of differential nonrandom attrition. Attrition occurs when students cannot be assessed at followup because they have left the study classrooms or schools or they are absent on testing days. Factors that cause mobility and absenteeism are also likely to affect student achievement. Therefore, if attrition is high, then the sample one uses for the analysis of outcomes would not be
TABLE V.4
MOBILITY RATES OF CONTROL AND TFA STUDENTS (Percentages)
Mobility Type Control Students
TFA Students Differencea Total
Stayer 87.8 86.0 –1.8 87.3
Crossoverb 3.7 4.3 0.7 4.0
Mover Within District 5.2 5.6 0.4 5.4
Mover Out of District 2.3 2.9 0.6 2.5
Mover Other/Unknown 1.3 1.3 0.0 1.3
Sample Size 1,094 875 1,969 Source: Student tracking system. aChi-squared test fails to reject the null hypothesis of equal distributions (p = 0.898); that is, the differences between TFA and control students are not statistically significant. b“Crossover” refers to students who switched from a TFA classroom to a control classroom, or vice versa.
10This figure includes a small number of students who transferred between classrooms of the
same treatment status, such as control to control or TFA to TFA. Such transfers have a negligible effect on inferences about the impact of TFA and are treated as stayers in our analysis (since they “stay” with their original classification as a TFA or control student).
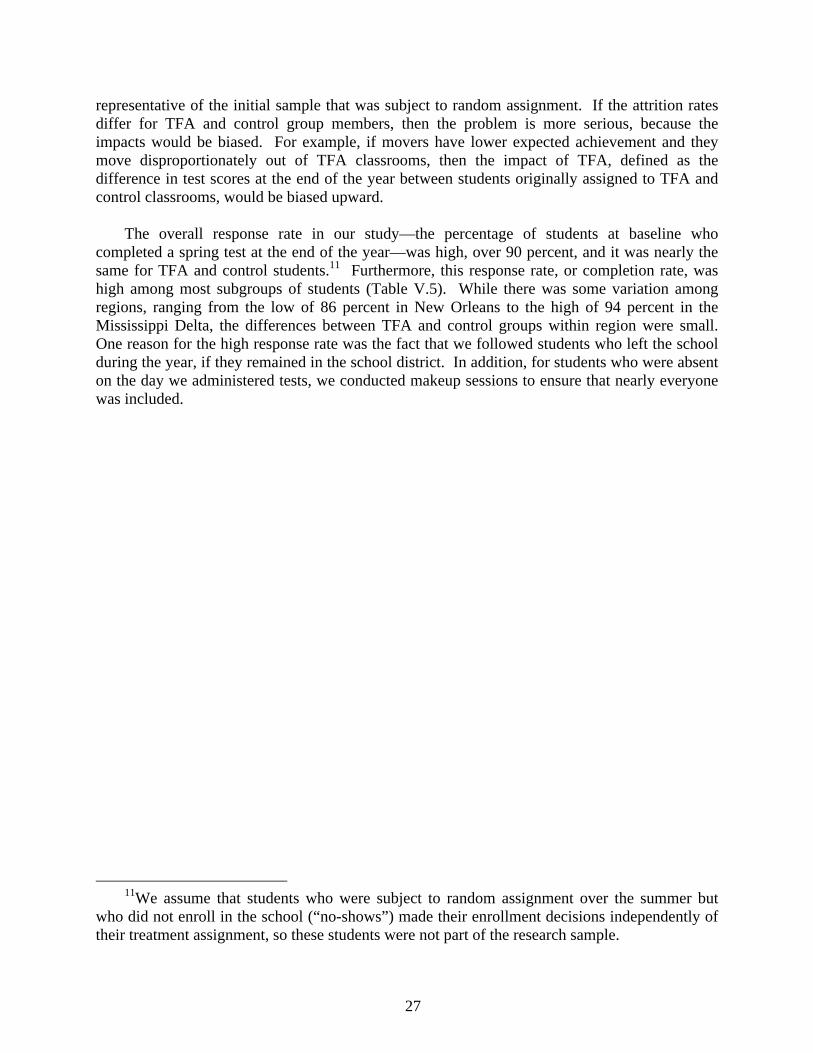
27
representative of the initial sample that was subject to random assignment. If the attrition rates differ for TFA and control group members, then the problem is more serious, because the impacts would be biased. For example, if movers have lower expected achievement and they move disproportionately out of TFA classrooms, then the impact of TFA, defined as the difference in test scores at the end of the year between students originally assigned to TFA and control classrooms, would be biased upward.
The overall response rate in our study—the percentage of students at baseline who
completed a spring test at the end of the year—was high, over 90 percent, and it was nearly the same for TFA and control students.11 Furthermore, this response rate, or completion rate, was high among most subgroups of students (Table V.5). While there was some variation among regions, ranging from the low of 86 percent in New Orleans to the high of 94 percent in the Mississippi Delta, the differences between TFA and control groups within region were small. One reason for the high response rate was the fact that we followed students who left the school during the year, if they remained in the school district. In addition, for students who were absent on the day we administered tests, we conducted makeup sessions to ensure that nearly everyone was included.
11We assume that students who were subject to random assignment over the summer but
who did not enroll in the school (“no-shows”) made their enrollment decisions independently of their treatment assignment, so these students were not part of the research sample.
28
TABLE V.5
SPRING TEST SCORE COMPLETION RATES
Completion Rate (Percentages)
Subgroup Control Students TFA Students All Sample Size (Students)a
Full Sample 90 91 91 1,893 Gender
Male 89 90 90 972 Female 92 92 92 921
Race
Black, non-Hispanic 92 92 92 1,283 Other 91 90 91 548
Ethnicity
Hispanic or Latino 91 91 91 490 Other 92 92 92 1,188
Free and Reduced-Price Lunch
Eligible 92 92 92 1,453 Not eligible 100 100 100 27
Region
Baltimore 88 88 88 319 Chicago 93 93 93 305 Compton 89 87 88 316 Houston 93 92 93 296 Mississippi Delta 94 95 94 400 New Orleans 85 88 86 257
Grade
Grade 1 92 89 91 352 Grade 2 83 92 86 198 Grade 3 92 92 92 626 Grade 4 89 90 90 535 Grade 5 92 95 93 182
Mobility Type
Stayer 97 98 98 1,663 Crossover 82 71 77 64 Mover, within district 40 44 42 98 Mover, outside district 0 5 2 45 Mover, other 14 0 9 23
Source: Student tracking system. aCompletion rates are based on students who completed the baseline test in the fall.
29
VI. WERE TFA TEACHERS EFFECTIVE IN THE CLASSROOM?
The most important question this study addressed is whether students taught by TFA teachers performed at least as well on achievement tests as students taught by other teachers, and we found that they did. We refer to this difference between TFA and control students’ performance as the “impact” of TFA on student achievement, the central criterion we used to judge the effectiveness of TFA teachers relative to their peers. The impact estimates are based on scores from tests we administered at the end of the school year, accounting for any preexisting differences based on the test we administered at the beginning of the school year. Because students were randomly assigned to the two types of teachers, such preexisting differences were very small. Therefore, differences in achievement test score levels between TFA and control students in the spring and differences between the two groups in score gains (change in scores from fall to spring) were about the same.
By the end of the school year, average student test scores in TFA classrooms were higher than in control classrooms in mathematics and were about the same as control classrooms in reading. These results are found broadly across subgroups of teachers and students and are robust to a variety of tests and assumptions.
A. STUDENTS OF TFA TEACHERS PERFORMED BETTER IN MATH AND THE SAME IN READING COMPARED TO STUDENTS OF CONTROL TEACHERS
Students in TFA classrooms outperformed control students in mathematics, as Figure VI.1 shows. The figure shows the math percentile ranking of the average student in TFA and control classrooms in the fall and again in the spring, at the end of the school year.12 The average control class students scored in the 15th percentile in the fall and remained in the 15th percentile at the end of the year. That is, control class students experienced typical achievement growth, shown in Figure VI.1 by the light-gray line.13 In contrast, the average TFA class students increased their ranking from the 14th percentile to the 17th percentile over the same period. The difference in growth rates is statistically significant.
For reading achievement, we found that the average student in TFA and control classrooms
experienced the same growth rate. The average sample member increased by the equivalent of about one percentile point during the study year. The nearly parallel lines in Figure VI.2 demonstrate the similarity in these growth rates.14
12All calculations in this report used normal curve equivalent (NCE) scores, which are
translated into percentile rankings for ease of interpretation. 13A flat line is a sign of normal growth because all rankings are expressed relative to a
nationally representative norm group, which also experienced fall-to-spring achievement growth. 14The initial treatment-control difference of a single percentile point is not statistically
significant.
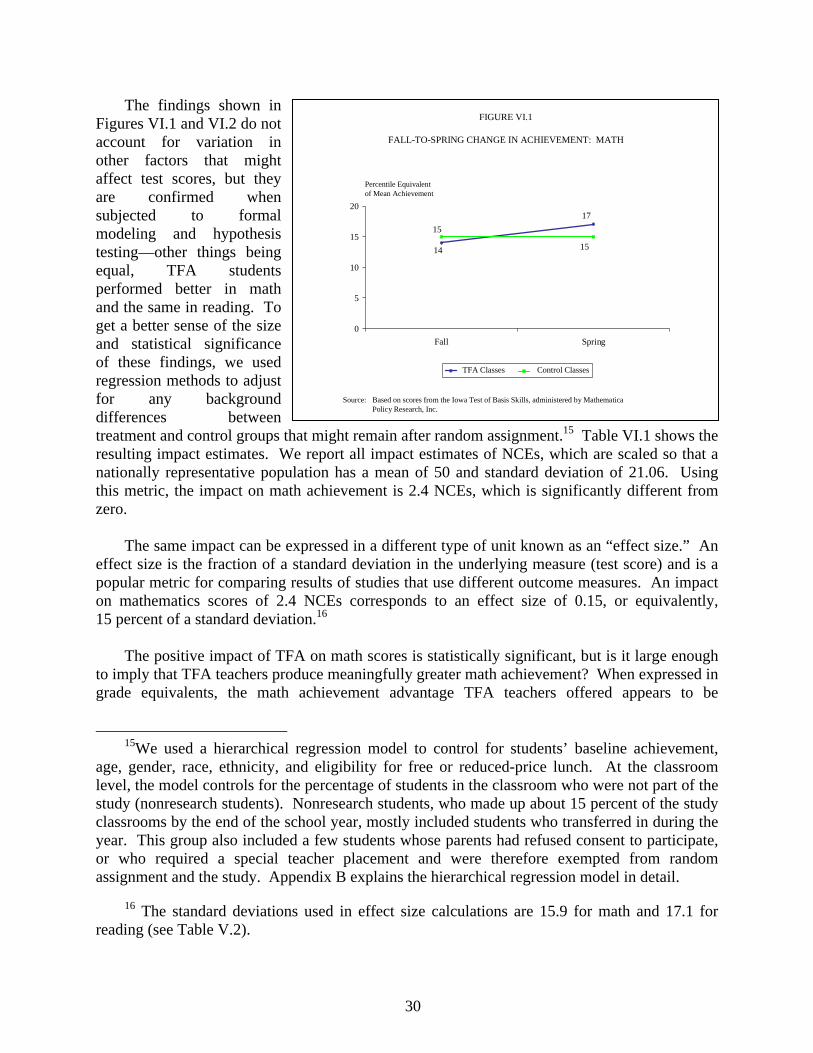
30
The findings shown in Figures VI.1 and VI.2 do not account for variation in other factors that might affect test scores, but they are confirmed when subjected to formal modeling and hypothesis testing—other things being equal, TFA students performed better in math and the same in reading. To get a better sense of the size and statistical significance of these findings, we used regression methods to adjust for any background differences between treatment and control groups that might remain after random assignment.15 Table VI.1 shows the resulting impact estimates. We report all impact estimates of NCEs, which are scaled so that a nationally representative population has a mean of 50 and standard deviation of 21.06. Using this metric, the impact on math achievement is 2.4 NCEs, which is significantly different from zero.
The same impact can be expressed in a different type of unit known as an “effect size.” An effect size is the fraction of a standard deviation in the underlying measure (test score) and is a popular metric for comparing results of studies that use different outcome measures. An impact on mathematics scores of 2.4 NCEs corresponds to an effect size of 0.15, or equivalently, 15 percent of a standard deviation.16 The positive impact of TFA on math scores is statistically significant, but is it large enough to imply that TFA teachers produce meaningfully greater math achievement? When expressed in grade equivalents, the math achievement advantage TFA teachers offered appears to be
15We used a hierarchical regression model to control for students’ baseline achievement,
age, gender, race, ethnicity, and eligibility for free or reduced-price lunch. At the classroom level, the model controls for the percentage of students in the classroom who were not part of the study (nonresearch students). Nonresearch students, who made up about 15 percent of the study classrooms by the end of the school year, mostly included students who transferred in during the year. This group also included a few students whose parents had refused consent to participate, or who required a special teacher placement and were therefore exempted from random assignment and the study. Appendix B explains the hierarchical regression model in detail.
16 The standard deviations used in effect size calculations are 15.9 for math and 17.1 for reading (see Table V.2).
14
17
15
15
0
5
10
15
20
Fall Spring
Percentile Equivalent of Mean Achievement
TFA Classes Control Classes
FIGURE VI.1
FALL-TO-SPRING CHANGE IN ACHIEVEMENT: MATH
Source: Based on scores from the Iowa Test of Basis Skills, administered by MathematicaPolicy Research, Inc.
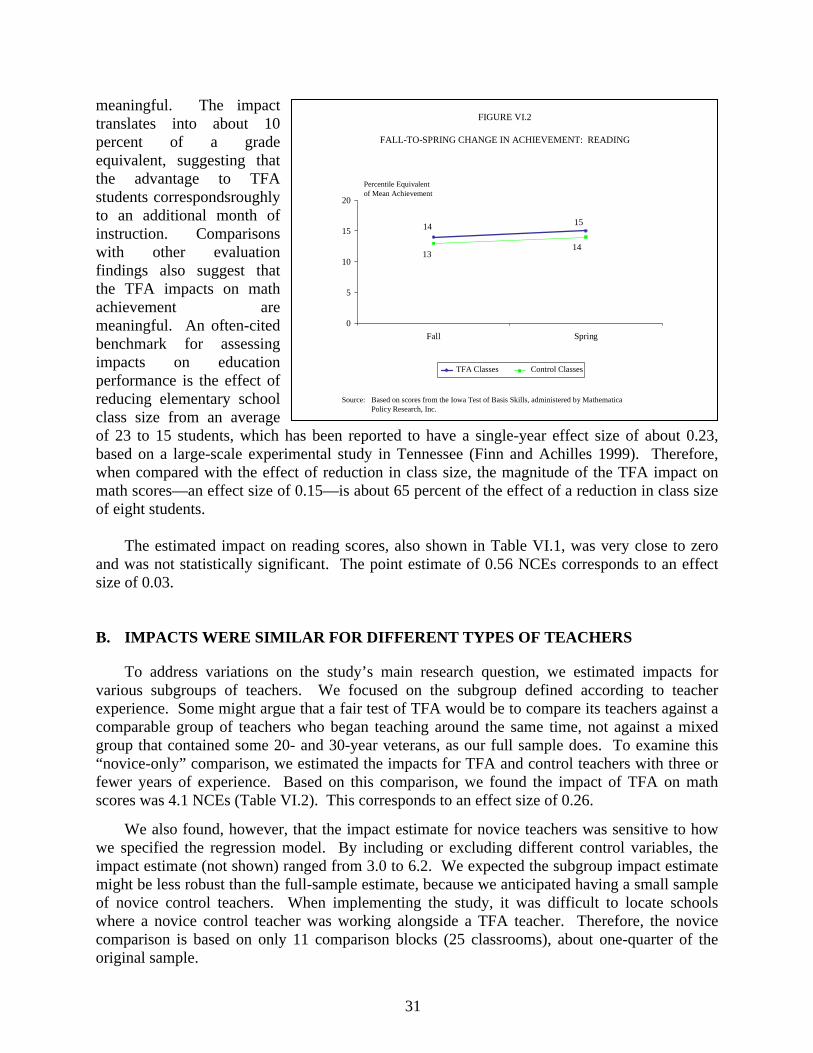
31
meaningful. The impact translates into about 10 percent of a grade equivalent, suggesting that the advantage to TFA students correspondsroughly to an additional month of instruction. Comparisons with other evaluation findings also suggest that the TFA impacts on math achievement are meaningful. An often-cited benchmark for assessing impacts on education performance is the effect of reducing elementary school class size from an average of 23 to 15 students, which has been reported to have a single-year effect size of about 0.23, based on a large-scale experimental study in Tennessee (Finn and Achilles 1999). Therefore, when compared with the effect of reduction in class size, the magnitude of the TFA impact on math scores—an effect size of 0.15—is about 65 percent of the effect of a reduction in class size of eight students.
The estimated impact on reading scores, also shown in Table VI.1, was very close to zero
and was not statistically significant. The point estimate of 0.56 NCEs corresponds to an effect size of 0.03.
B. IMPACTS WERE SIMILAR FOR DIFFERENT TYPES OF TEACHERS
To address variations on the study’s main research question, we estimated impacts for various subgroups of teachers. We focused on the subgroup defined according to teacher experience. Some might argue that a fair test of TFA would be to compare its teachers against a comparable group of teachers who began teaching around the same time, not against a mixed group that contained some 20- and 30-year veterans, as our full sample does. To examine this “novice-only” comparison, we estimated the impacts for TFA and control teachers with three or fewer years of experience. Based on this comparison, we found the impact of TFA on math scores was 4.1 NCEs (Table VI.2). This corresponds to an effect size of 0.26.
We also found, however, that the impact estimate for novice teachers was sensitive to how we specified the regression model. By including or excluding different control variables, the impact estimate (not shown) ranged from 3.0 to 6.2. We expected the subgroup impact estimate might be less robust than the full-sample estimate, because we anticipated having a small sample of novice control teachers. When implementing the study, it was difficult to locate schools where a novice control teacher was working alongside a TFA teacher. Therefore, the novice comparison is based on only 11 comparison blocks (25 classrooms), about one-quarter of the original sample.
14 15
1413
0
5
10
15
20
Fall Spring
Percentile Equivalent of Mean Achievement
TFA Classes Control Classes
FIGURE VI.2
FALL-TO-SPRING CHANGE IN ACHIEVEMENT: READING
Source: Based on scores from the Iowa Test of Basis Skills, administered by MathematicaPolicy Research, Inc.
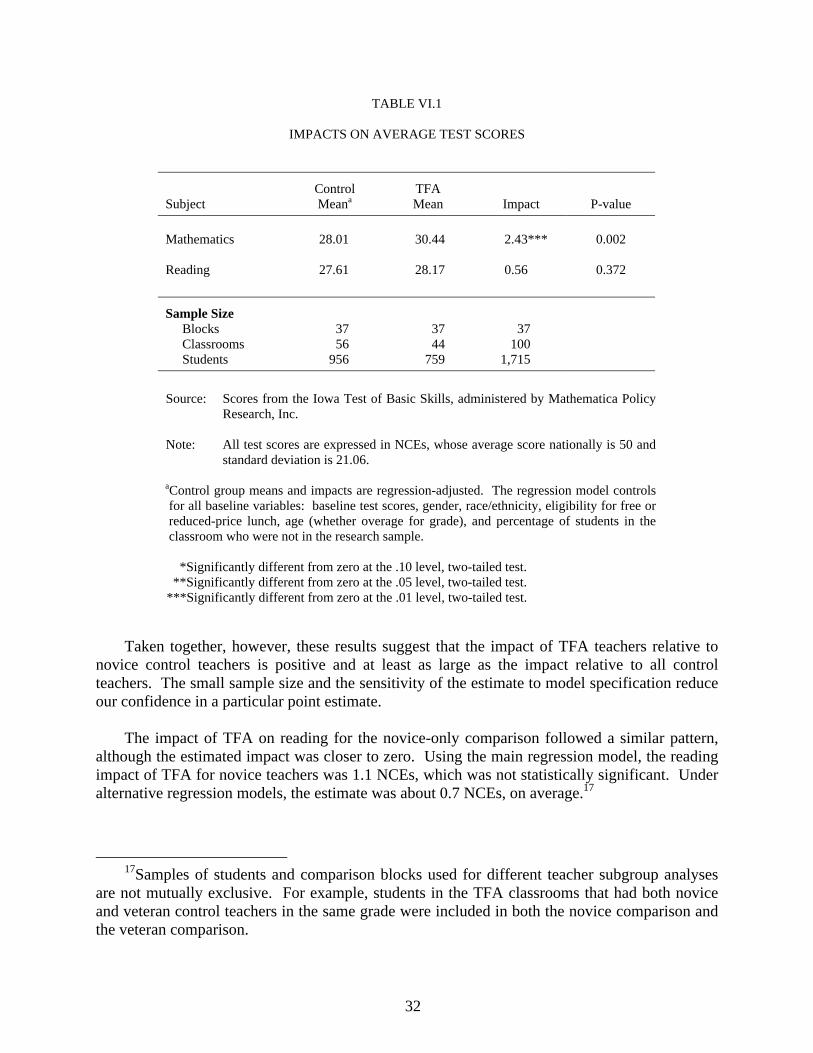
32
TABLE VI.1
IMPACTS ON AVERAGE TEST SCORES
Subject Control Meana
TFA Mean Impact P-value
Mathematics 28.01 30.44 2.43*** 0.002 Reading 27.61 28.17 0.56 0.372
Sample Size Blocks 37 37 37 Classrooms 56 44 100 Students 956 759 1,715
Source: Scores from the Iowa Test of Basic Skills, administered by Mathematica Policy
Research, Inc. Note: All test scores are expressed in NCEs, whose average score nationally is 50 and
standard deviation is 21.06.
aControl group means and impacts are regression-adjusted. The regression model controls for all baseline variables: baseline test scores, gender, race/ethnicity, eligibility for free or reduced-price lunch, age (whether overage for grade), and percentage of students in the classroom who were not in the research sample. *Significantly different from zero at the .10 level, two-tailed test. **Significantly different from zero at the .05 level, two-tailed test. ***Significantly different from zero at the .01 level, two-tailed test.
Taken together, however, these results suggest that the impact of TFA teachers relative to novice control teachers is positive and at least as large as the impact relative to all control teachers. The small sample size and the sensitivity of the estimate to model specification reduce our confidence in a particular point estimate.
The impact of TFA on reading for the novice-only comparison followed a similar pattern,
although the estimated impact was closer to zero. Using the main regression model, the reading impact of TFA for novice teachers was 1.1 NCEs, which was not statistically significant. Under alternative regression models, the estimate was about 0.7 NCEs, on average.17
17Samples of students and comparison blocks used for different teacher subgroup analyses
are not mutually exclusive. For example, students in the TFA classrooms that had both novice and veteran control teachers in the same grade were included in both the novice comparison and the veteran comparison.
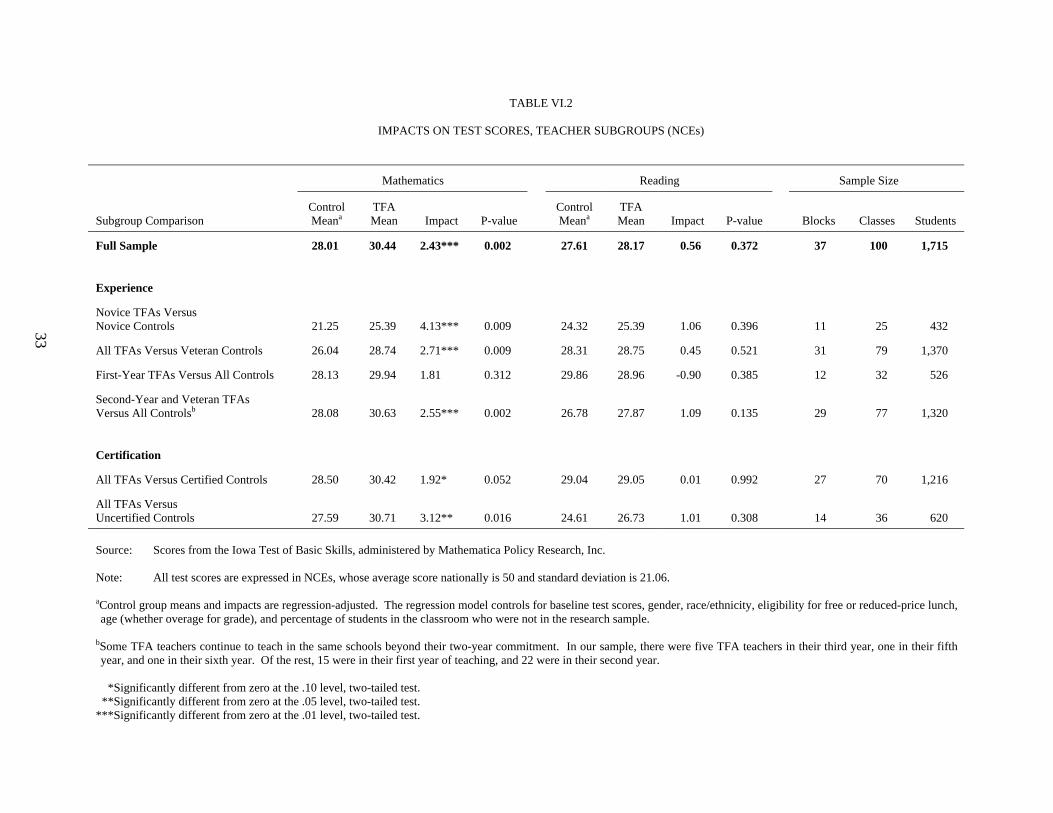
33
TABLE VI.2
IMPACTS ON TEST SCORES, TEACHER SUBGROUPS (NCEs)
Mathematics Reading Sample Size
Subgroup Comparison Control
Meana TFA Mean Impact P-value
Control Meana
TFA Mean Impact P-value Blocks Classes Students
Full Sample 28.01 30.44 2.43*** 0.002 27.61 28.17 0.56 0.372 37 100 1,715
Experience
Novice TFAs Versus Novice Controls
21.25 25.39 4.13*** 0.009 24.32 25.39 1.06 0.396 11 25 432
All TFAs Versus Veteran Controls 26.04 28.74 2.71*** 0.009 28.31 28.75 0.45 0.521 31 79 1,370
First-Year TFAs Versus All Controls 28.13 29.94 1.81 0.312 29.86 28.96 -0.90 0.385 12 32 526
Second-Year and Veteran TFAs Versus All Controlsb
28.08 30.63 2.55*** 0.002 26.78 27.87 1.09 0.135 29 77 1,320
Certification
All TFAs Versus Certified Controls 28.50 30.42 1.92* 0.052 29.04 29.05 0.01 0.992 27 70 1,216
All TFAs Versus Uncertified Controls
27.59 30.71 3.12** 0.016 24.61 26.73 1.01 0.308 14 36 620
Source: Scores from the Iowa Test of Basic Skills, administered by Mathematica Policy Research, Inc. Note: All test scores are expressed in NCEs, whose average score nationally is 50 and standard deviation is 21.06. aControl group means and impacts are regression-adjusted. The regression model controls for baseline test scores, gender, race/ethnicity, eligibility for free or reduced-price lunch, age (whether overage for grade), and percentage of students in the classroom who were not in the research sample.
bSome TFA teachers continue to teach in the same schools beyond their two-year commitment. In our sample, there were five TFA teachers in their third year, one in their fifth year, and one in their sixth year. Of the rest, 15 were in their first year of teaching, and 22 were in their second year.
*Significantly different from zero at the .10 level, two-tailed test. **Significantly different from zero at the .05 level, two-tailed test. ***Significantly different from zero at the .01 level, two-tailed test.
34
We also estimated the impact for first-year TFA teachers only to see if there was a difference from an extra year on the job for these teachers. We found the impact for first-year TFA teachers in math was lower than the full-sample impact—1.8 compared to 2.4. The precision of this new estimate is also very low, because of the smaller number of first-year teachers from which to generalize (standard error is 1.7 NCEs), so this impact is not significantly different from zero. Not surprisingly, the impact on math scores at 2.5 NCEs was slightly higher for second-year TFAs than it was for the full sample. In addition to having one more year of experience in the classroom, many second-year TFAs had earned a master’s degree in education (see Chapter IV).
To examine the role of certification, we repeated the exercise, this time comparing all TFA
teachers with certified teachers only. We found the math impact was 1.9 NCEs. It was 3.1 when we compared TFA teachers to their uncertified counterparts. These findings imply that certified teachers outperformed uncertified ones, on average. However, the difference in impacts for the two groups is small, and the standard errors are large, so these different estimates between the subgroup of certified teachers and the full sample are as likely due to chance as they are to a real certification effect. Our data cannot distinguish.
For all the teacher subgroup comparisons above, the impact on reading changes in a similar
pattern, but the impacts were consistently small, no more than 1.2 NCE points in absolute value, and were not statistically significant.
C. IMPACT FINDINGS SIMILAR FOR DIFFERENT SUBGROUPS OF STUDENTS
We examined the hypothesis that the TFA teachers might have more success with some types of students than with others and found little evidence to support such a claim. Instead, the impact of TFA appeared across a broad spectrum of subgroups. A key constraint in testing the hypothesis is that the study was not designed specifically for subgroup analysis. As one begins to look at subgroup impacts, it becomes difficult to distinguish true differences from chance differences, because the size of subgroups is often small. For most subgroups of students, however, the pattern of impacts was similar to that of the full sample.
The impacts of TFA were similar across boys and girls and across racial/ethnic groups. Table VI.3 shows that the impacts on math scores were positive and significant for both boys and girls, and the impacts on reading were not significantly different from zero for both groups. The impacts on math scores for the race/ethnic groups that were large enough to estimate separate impacts—African American and Hispanic students—were 1.8 and 1.9 NCE points, respectively.18 The estimate of the impact for African American students was highly sensitive to inclusion of a few comparison blocks that consisted of just two or three students. These were classrooms in largely Hispanic schools. Removing the outlier blocks resulted in an impact on
18One limitation in estimating impacts by race/ethnicity is that the groups are not similarly distributed across regions. Hence, we cannot effectively isolate variation in impacts by race/ethnicity from variation in impacts by region, and these estimates should be interpreted cautiously.
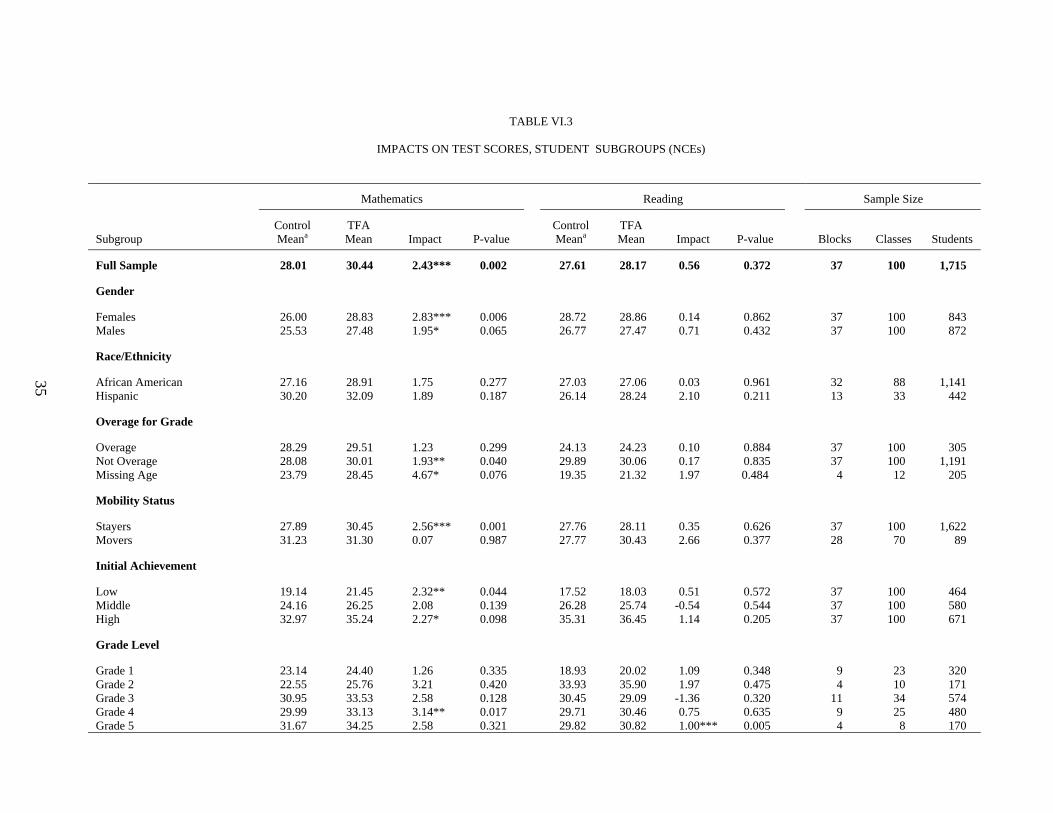
35
TABLE VI.3
IMPACTS ON TEST SCORES, STUDENT SUBGROUPS (NCEs)
Mathematics Reading Sample Size
Subgroup Control
Meana TFA Mean Impact P-value
Control Meana
TFA Mean Impact P-value Blocks Classes Students
Full Sample 28.01 30.44 2.43*** 0.002 27.61 28.17 0.56 0.372 37 100 1,715
Gender
Females 26.00 28.83 2.83*** 0.006 28.72 28.86 0.14 0.862 37 100 843 Males 25.53 27.48 1.95* 0.065 26.77 27.47 0.71 0.432 37 100 872
Race/Ethnicity
African American 27.16 28.91 1.75 0.277 27.03 27.06 0.03 0.961 32 88 1,141 Hispanic 30.20 32.09 1.89 0.187 26.14 28.24 2.10 0.211 13 33 442
Overage for Grade
Overage 28.29 29.51 1.23 0.299 24.13 24.23 0.10 0.884 37 100 305 Not Overage 28.08 30.01 1.93** 0.040 29.89 30.06 0.17 0.835 37 100 1,191 Missing Age 23.79 28.45 4.67* 0.076 19.35 21.32 1.97 0.484 4 12 205
Mobility Status
Stayers 27.89 30.45 2.56*** 0.001 27.76 28.11 0.35 0.626 37 100 1,622 Movers 31.23 31.30 0.07 0.987 27.77 30.43 2.66 0.377 28 70 89
Initial Achievement
Low 19.14 21.45 2.32** 0.044 17.52 18.03 0.51 0.572 37 100 464 Middle 24.16 26.25 2.08 0.139 26.28 25.74 -0.54 0.544 37 100 580 High 32.97 35.24 2.27* 0.098 35.31 36.45 1.14 0.205 37 100 671
Grade Level
Grade 1 23.14 24.40 1.26 0.335 18.93 20.02 1.09 0.348 9 23 320 Grade 2 22.55 25.76 3.21 0.420 33.93 35.90 1.97 0.475 4 10 171 Grade 3 30.95 33.53 2.58 0.128 30.45 29.09 -1.36 0.320 11 34 574 Grade 4 29.99 33.13 3.14** 0.017 29.71 30.46 0.75 0.635 9 25 480 Grade 5 31.67 34.25 2.58 0.321 29.82 30.82 1.00*** 0.005 4 8 170
TABLE VI.3 (continued) ______________________________________________________________________________________________________________
36
Source: Scores from the Iowa Test of Basic Skills, administered by Mathematica Policy Research, Inc. Note: All test scores are expressed in NCEs, whose average score nationally is 50 and standard deviation is 21.06.
aControl group means and impacts are regression-adjusted. The benchmark regression model controls for baseline test scores, gender, race/ethnicity, eligibility for free or reduced-price lunch, age (whether overage for grade), and percentage of students in the classroom who were not in the research sample. *Significantly different from zero at the .10 level, two-tailed test. **Significantly different from zero at the .05 level, two-tailed test. ***Significantly different from zero at the .01 level, two-tailed test.
37
African American students’ math scores of 2.4 to 2.5 NCEs, depending on the threshold used. The corresponding impacts on reading scores differed. The impact on African American students’ reading scores was less than one point. For Hispanic students, it was more than two points (although not statistically significant). Interestingly, the impact on African American students’ reading scores in regions with a majority of Hispanic students was also high, more than 3.4 NCE points (not presented in the table). These findings that the impacts on the reading scores in regions with a majority of Hispanic students were higher than the full sample are based on only 10 comparison blocks but could provide a lead for further research.
Estimates of separate impacts by age-within-grade were hampered somewhat by sample size considerations. Those who are not overage were in the majority, and the impacts for this group are similar to the full-sample estimates. Those who were older than their classmates or whose age was unknown formed smaller groups, for whom it is difficult to estimate the impacts precisely. The same was true for impacts by student mobility—most students remained in the school where they took the baseline achievement test. Estimated TFA impacts were similar across students with different baseline achievement scores and students in different grades. We divided the student population into three groups based on their level of initial achievement and found the impacts on math scores for the three subgroups fell in a narrow range—between 2.1 and 2.3 NCE points. The estimated impacts on reading varied more widely—from –0.5 for the middle achievers to 1.1 for the high achievers, with an impact of 0.5 for the low achievers—although all of the estimates were fairly close to zero. The fact that these estimates did not ascend or descend uniformly according to achievement level is consistent with the idea that the range of estimates reflects random fluctuation in estimates that one would expect when examining subgroups that are one-third the size of the overall sample. Similarly, the grade-level impacts shown in Table VI.3 do not show any patterns but fluctuate randomly around the impact estimates for the overall sample. Except for grade 1, the estimates of the math impact are more than two NCE points for each grade level. The estimates of the reading impact are less than two NCE points in absolute value for every grade level.
D. IMPACT FINDINGS NOT SENSITIVE TO DIFFERENT ASSUMPTIONS
To examine the sensitivity of the impact findings, we tested alternative specifications. The goal was to determine whether the findings would change if we had made different assumptions about the statistical model or if certain groups of students, teachers, schools, or districts had been excluded. For example, we eliminated the schools where the test was administered in Spanish and reestimated the impacts to see if the findings would change, and we eliminated the classrooms and districts with the most extreme outcomes to see if the findings would change. We also tried estimating the impacts with a different set of variables in the regression models to see if the results were sensitive to model specification.
Based on our sensitivity analyses, we found that the impact of TFA on mathematics achievement, estimated under various assumptions, ranged from 2.0 to 3.0 NCEs (which corresponds to a range of 0.13 to 0.19 standard deviation units) and was always statistically significant. The estimated impact on reading achievement ranged from –0.4 to 0.8 NCEs (which corresponds to a range of effect sizes from –0.03 to 0.05), with none of the estimates being statistically significant. All the values within each range led to the same general conclusion—
38
students in TFA classrooms outperformed students in control classrooms in math, and they performed about the same, on average, in reading.
Table VI.4 shows some illustrative results of the sensitivity analyses. They include the
following tests for each subject area:
• In Alternative Specification (1) in Table VI.4, we used test score gains between the fall and spring as the outcomes, as opposed to the model from the previous sections, which used the spring test scores as the outcome with the fall test as a control variable. The score gain model is more restrictive than the more general model, which allows baseline test scores to have a varying effect on achievement in the spring. Using the score gain model, the estimated impact on math scores was 2.87 and on reading scores was –0.35.
• In Alternative Specification (2), we included binary variables for each school to account for school fixed effects—school-specific effects on test scores that are fixed over time. Under this specification, the impact estimate for math was 2.00 with a standard error of 0.89, which makes it significant at the 0.05 level. The impact estimate for reading was –0.08.
• We also estimated the model with and without Spanish-language test takers. A number of classrooms in our sample (accounting for 8.7 percent of the students) provided instruction in Spanish, so we administered a Spanish-language version of the test to these students. To see whether these Spanish-language scores (which had to be adjusted to be comparable to the English-language scores) were influencing the results, we estimated the impacts separately with these classes excluded (Alternate Specification [3] in Table IV.4). The math impact excluding the Spanish-language test takers was 2.43, and the impact on reading was 0.22.
• We used different methods to correct for floor effects, which occurred because some students received the minimum possible test score. About seven percent of the sample members received the minimum test score in math, and a similar number did so in reading, suggesting that the test itself was unable to discriminate between low and very low achievers. We used a censored regression model to account for these cases (Alternate Specification [4] in Table IV.4), and the resulting impacts were 2.01 for math and 0.75 for reading.
• Finally, in Alternate Specification (5), we estimated impacts for stayers only. This test removes the effects of students who left their assigned classrooms during the school year to transfer to another school or to cross over from a treatment to a control classroom or vice versa. There is always a concern that including crossovers might bias the impacts toward zero by attributing performance gains from better teachers to worse teachers and vice versa. (For analysis, we classified mobile students according to the classroom to which they were randomly assigned.) Noting that the crossover rates both out of and into TFA classrooms were about the same (four percent), we estimated the impact on just those students who stayed in their designated classroom. The TFA impact on math for stayers was 2.56, and the impact on reading was 0.35.
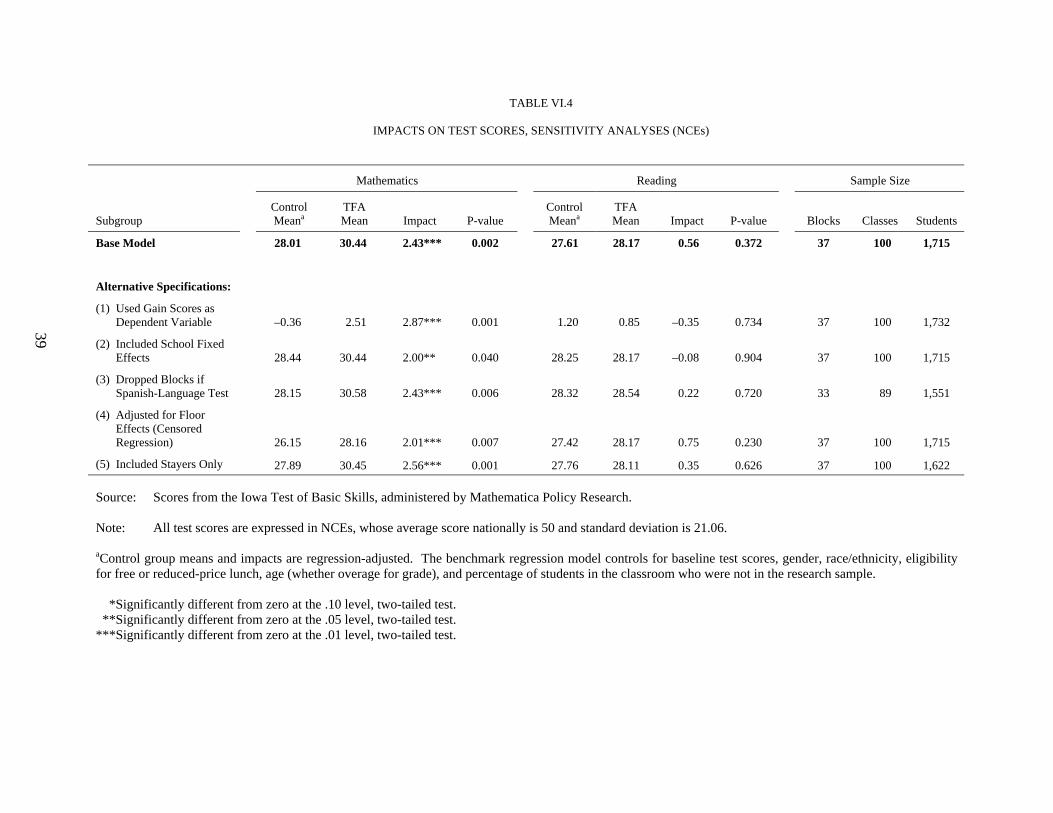
39
TABLE VI.4
IMPACTS ON TEST SCORES, SENSITIVITY ANALYSES (NCEs)
Mathematics Reading Sample Size
Subgroup Control
Meana TFA Mean Impact P-value
Control Meana
TFA Mean Impact P-value Blocks Classes Students
Base Model 28.01 30.44 2.43*** 0.002 27.61 28.17 0.56 0.372 37 100 1,715
Alternative Specifications:
(1) Used Gain Scores as Dependent Variable
–0.36 2.51 2.87*** 0.001 1.20 0.85 –0.35 0.734 37 100 1,732
(2) Included School Fixed Effects
28.44 30.44 2.00** 0.040 28.25 28.17 –0.08 0.904 37 100 1,715
(3) Dropped Blocks if Spanish-Language Test
28.15 30.58 2.43*** 0.006 28.32 28.54 0.22 0.720 33 89 1,551
(4) Adjusted for Floor Effects (Censored Regression)
26.15 28.16 2.01*** 0.007 27.42 28.17 0.75 0.230 37 100 1,715
(5) Included Stayers Only 27.89 30.45 2.56*** 0.001 27.76 28.11 0.35 0.626 37 100 1,622 Source: Scores from the Iowa Test of Basic Skills, administered by Mathematica Policy Research. Note: All test scores are expressed in NCEs, whose average score nationally is 50 and standard deviation is 21.06. aControl group means and impacts are regression-adjusted. The benchmark regression model controls for baseline test scores, gender, race/ethnicity, eligibility for free or reduced-price lunch, age (whether overage for grade), and percentage of students in the classroom who were not in the research sample. *Significantly different from zero at the .10 level, two-tailed test. **Significantly different from zero at the .05 level, two-tailed test. ***Significantly different from zero at the .01 level, two-tailed test.
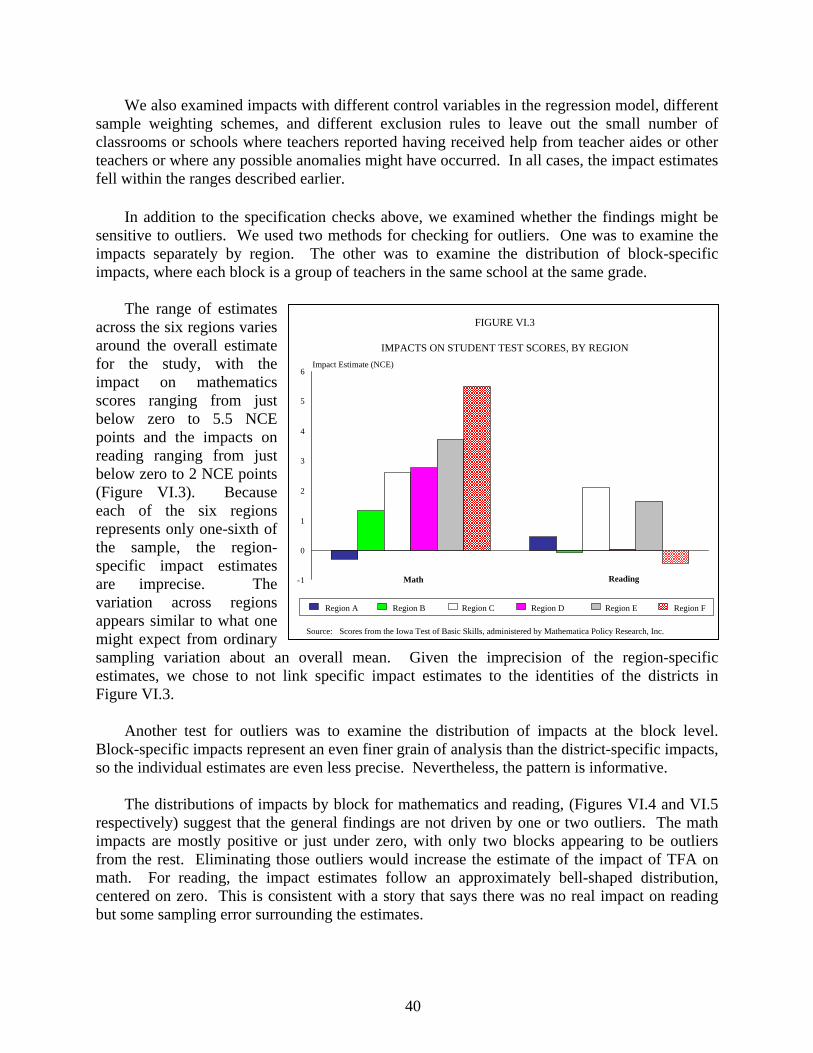
40
We also examined impacts with different control variables in the regression model, different sample weighting schemes, and different exclusion rules to leave out the small number of classrooms or schools where teachers reported having received help from teacher aides or other teachers or where any possible anomalies might have occurred. In all cases, the impact estimates fell within the ranges described earlier.
In addition to the specification checks above, we examined whether the findings might be sensitive to outliers. We used two methods for checking for outliers. One was to examine the impacts separately by region. The other was to examine the distribution of block-specific impacts, where each block is a group of teachers in the same school at the same grade.
The range of estimates
across the six regions varies around the overall estimate for the study, with the impact on mathematics scores ranging from just below zero to 5.5 NCE points and the impacts on reading ranging from just below zero to 2 NCE points (Figure VI.3). Because each of the six regions represents only one-sixth of the sample, the region-specific impact estimates are imprecise. The variation across regions appears similar to what one might expect from ordinary sampling variation about an overall mean. Given the imprecision of the region-specific estimates, we chose to not link specific impact estimates to the identities of the districts in Figure VI.3.
Another test for outliers was to examine the distribution of impacts at the block level.
Block-specific impacts represent an even finer grain of analysis than the district-specific impacts, so the individual estimates are even less precise. Nevertheless, the pattern is informative.
The distributions of impacts by block for mathematics and reading, (Figures VI.4 and VI.5 respectively) suggest that the general findings are not driven by one or two outliers. The math impacts are mostly positive or just under zero, with only two blocks appearing to be outliers from the rest. Eliminating those outliers would increase the estimate of the impact of TFA on math. For reading, the impact estimates follow an approximately bell-shaped distribution, centered on zero. This is consistent with a story that says there was no real impact on reading but some sampling error surrounding the estimates.
-1
0
1
2
3
4
5
6
FIGURE VI.3
IMPACTS ON STUDENT TEST SCORES, BY REGION
Region A Region B Region C Region D Region E Region F
Math Reading
Impact Estimate (NCE)
Source: Scores from the Iowa Test of Basic Skills, administered by Mathematica Policy Research, Inc.
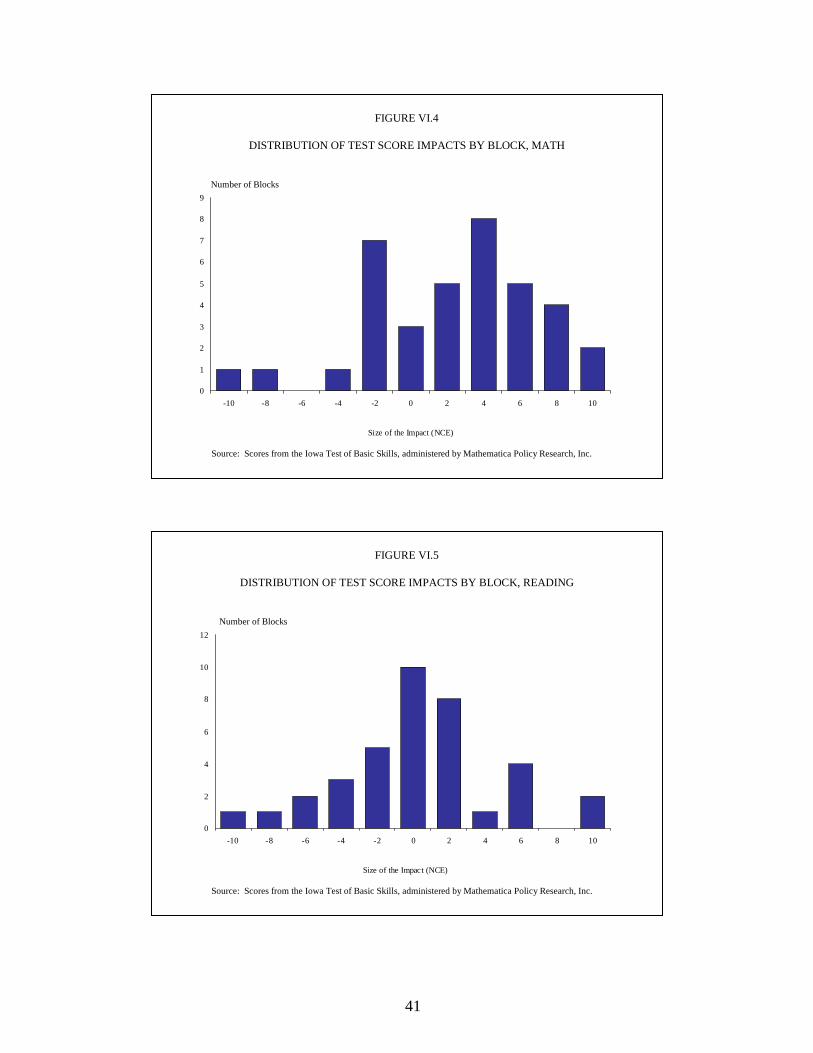
41
0
1
2
3
4
5
6
7
8
9
-10 -8 -6 -4 -2 0 2 4 6 8 10
Size of the Impact (NCE)
FIGURE VI.4
DISTRIBUTION OF TEST SCORE IMPACTS BY BLOCK, MATH
Number of Blocks
Source: Scores from the Iowa Test of Basic Skills, administered by Mathematica Policy Research, Inc.
0
2
4
6
8
10
12
-10 -8 -6 -4 -2 0 2 4 6 8 10
Size of the Impact (NCE)
FIGURE VI.5
DISTRIBUTION OF TEST SCORE IMPACTS BY BLOCK, READING
Number of Blocks
Source: Scores from the Iowa Test of Basic Skills, administered by Mathematica Policy Research, Inc.

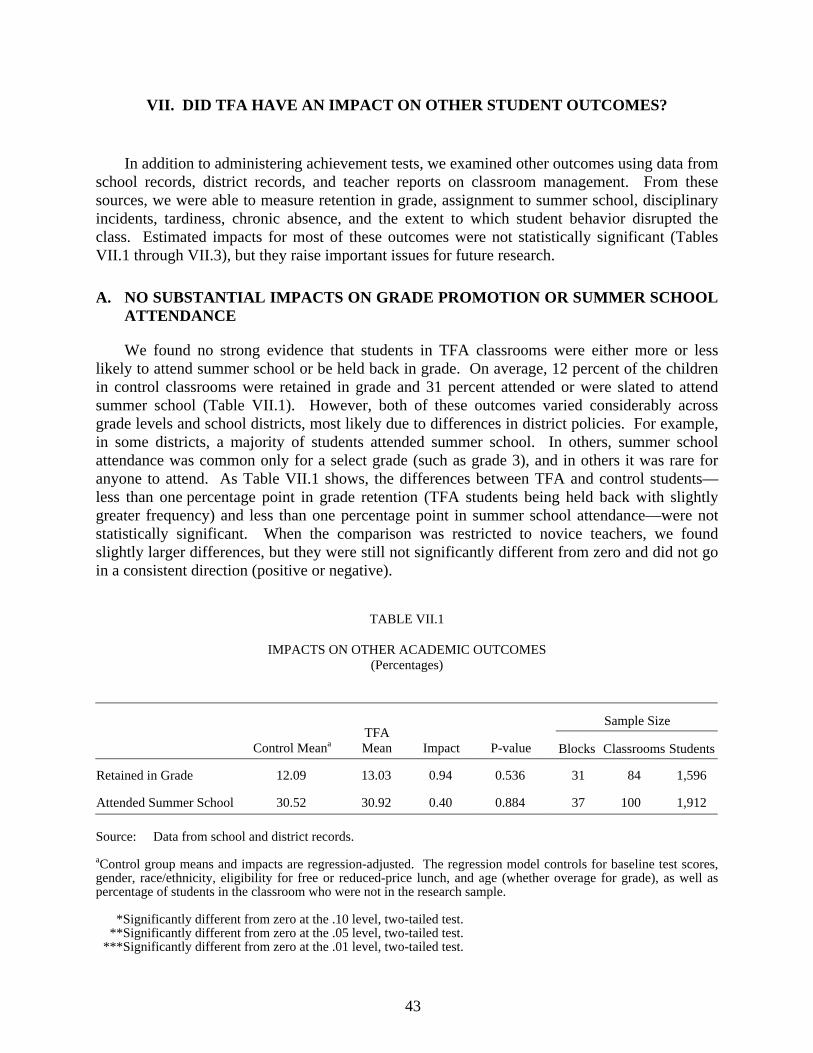
43
VII. DID TFA HAVE AN IMPACT ON OTHER STUDENT OUTCOMES?
In addition to administering achievement tests, we examined other outcomes using data from school records, district records, and teacher reports on classroom management. From these sources, we were able to measure retention in grade, assignment to summer school, disciplinary incidents, tardiness, chronic absence, and the extent to which student behavior disrupted the class. Estimated impacts for most of these outcomes were not statistically significant (Tables VII.1 through VII.3), but they raise important issues for future research.
A. NO SUBSTANTIAL IMPACTS ON GRADE PROMOTION OR SUMMER SCHOOL ATTENDANCE
We found no strong evidence that students in TFA classrooms were either more or less likely to attend summer school or be held back in grade. On average, 12 percent of the children in control classrooms were retained in grade and 31 percent attended or were slated to attend summer school (Table VII.1). However, both of these outcomes varied considerably across grade levels and school districts, most likely due to differences in district policies. For example, in some districts, a majority of students attended summer school. In others, summer school attendance was common only for a select grade (such as grade 3), and in others it was rare for anyone to attend. As Table VII.1 shows, the differences between TFA and control students—less than one percentage point in grade retention (TFA students being held back with slightly greater frequency) and less than one percentage point in summer school attendance—were not statistically significant. When the comparison was restricted to novice teachers, we found slightly larger differences, but they were still not significantly different from zero and did not go in a consistent direction (positive or negative).
TABLE VII.1
IMPACTS ON OTHER ACADEMIC OUTCOMES (Percentages)
Sample Size
Control Meana TFA Mean Impact P-value Blocks Classrooms Students
Retained in Grade 12.09 13.03 0.94 0.536 31 84 1,596
Attended Summer School 30.52 30.92 0.40 0.884 37 100 1,912 Source: Data from school and district records. aControl group means and impacts are regression-adjusted. The regression model controls for baseline test scores, gender, race/ethnicity, eligibility for free or reduced-price lunch, and age (whether overage for grade), as well as percentage of students in the classroom who were not in the research sample.
*Significantly different from zero at the .10 level, two-tailed test. **Significantly different from zero at the .05 level, two-tailed test. ***Significantly different from zero at the .01 level, two-tailed test.
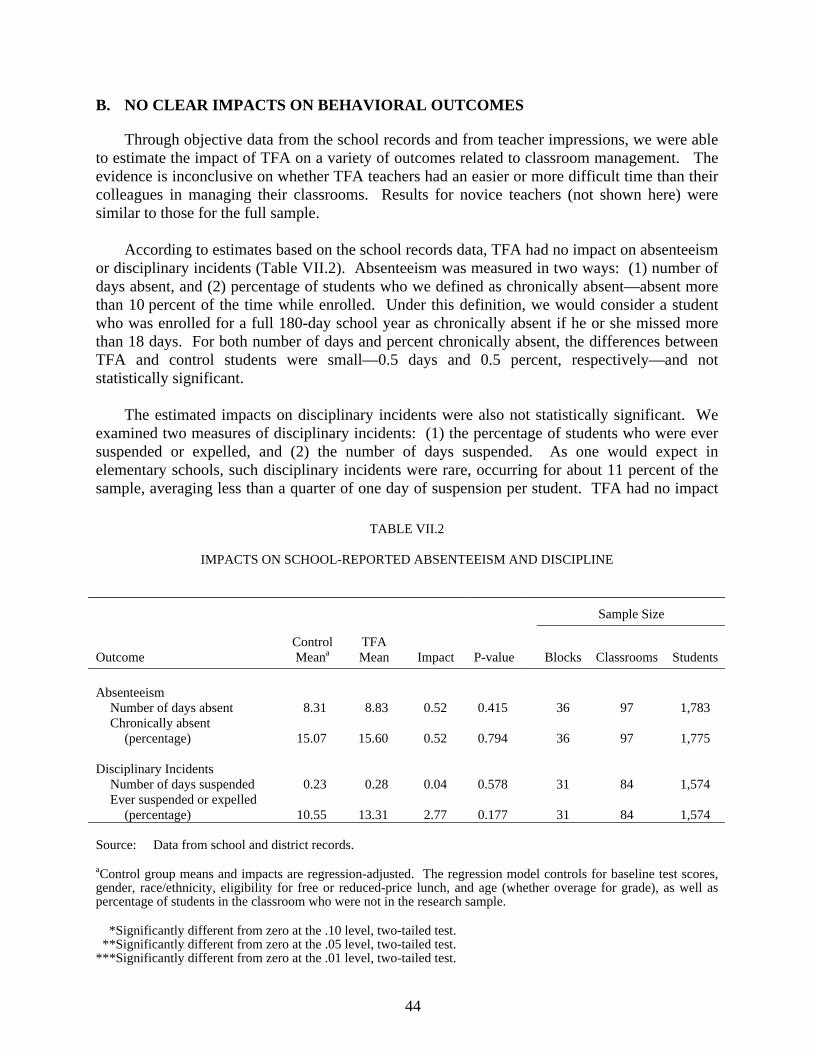
44
B. NO CLEAR IMPACTS ON BEHAVIORAL OUTCOMES
Through objective data from the school records and from teacher impressions, we were able to estimate the impact of TFA on a variety of outcomes related to classroom management. The evidence is inconclusive on whether TFA teachers had an easier or more difficult time than their colleagues in managing their classrooms. Results for novice teachers (not shown here) were similar to those for the full sample.
According to estimates based on the school records data, TFA had no impact on absenteeism or disciplinary incidents (Table VII.2). Absenteeism was measured in two ways: (1) number of days absent, and (2) percentage of students who we defined as chronically absent—absent more than 10 percent of the time while enrolled. Under this definition, we would consider a student who was enrolled for a full 180-day school year as chronically absent if he or she missed more than 18 days. For both number of days and percent chronically absent, the differences between TFA and control students were small—0.5 days and 0.5 percent, respectively—and not statistically significant. The estimated impacts on disciplinary incidents were also not statistically significant. We examined two measures of disciplinary incidents: (1) the percentage of students who were ever suspended or expelled, and (2) the number of days suspended. As one would expect in elementary schools, such disciplinary incidents were rare, occurring for about 11 percent of the sample, averaging less than a quarter of one day of suspension per student. TFA had no impact
TABLE VII.2
IMPACTS ON SCHOOL-REPORTED ABSENTEEISM AND DISCIPLINE
Sample Size
Outcome Control Meana
TFA Mean Impact P-value Blocks Classrooms Students
Absenteeism
Number of days absent 8.31 8.83 0.52 0.415 36 97 1,783 Chronically absent
(percentage) 15.07 15.60 0.52 0.794 36 97 1,775
Disciplinary Incidents Number of days suspended 0.23 0.28 0.04 0.578 31 84 1,574 Ever suspended or expelled
(percentage) 10.55 13.31 2.77 0.177 31 84 1,574
Source: Data from school and district records.
aControl group means and impacts are regression-adjusted. The regression model controls for baseline test scores, gender, race/ethnicity, eligibility for free or reduced-price lunch, and age (whether overage for grade), as well as percentage of students in the classroom who were not in the research sample.
*Significantly different from zero at the .10 level, two-tailed test. **Significantly different from zero at the .05 level, two-tailed test. ***Significantly different from zero at the .01 level, two-tailed test.
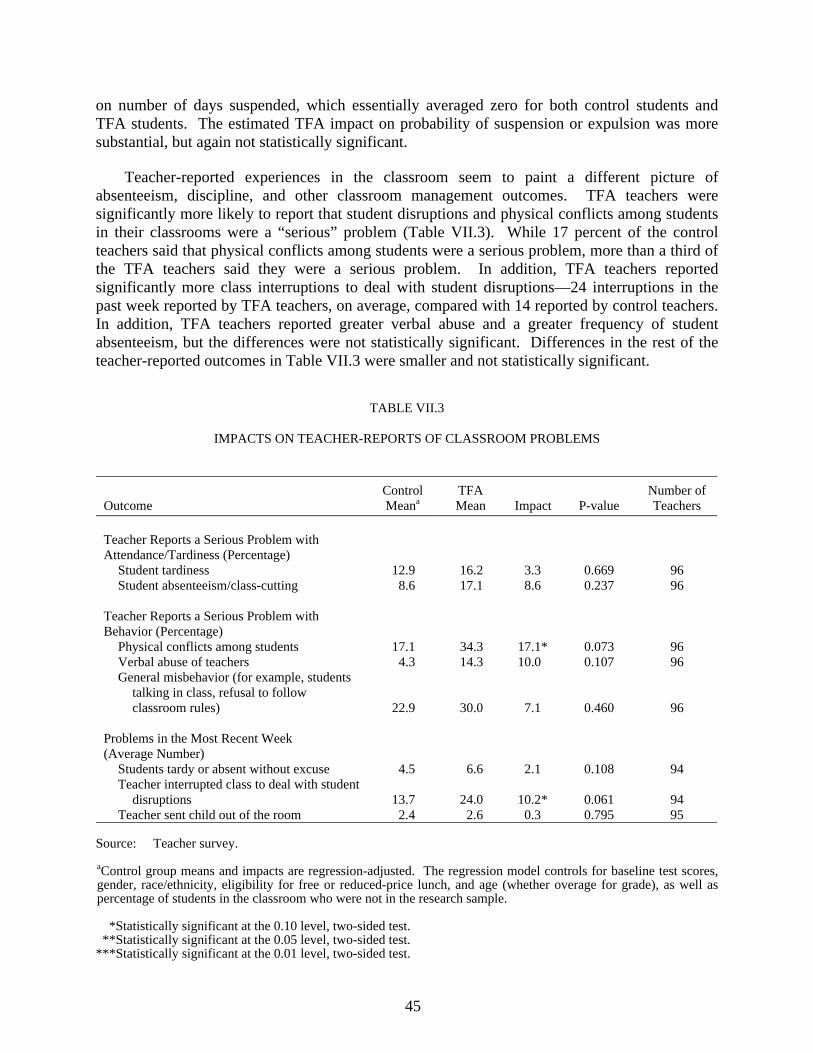
45
on number of days suspended, which essentially averaged zero for both control students and TFA students. The estimated TFA impact on probability of suspension or expulsion was more substantial, but again not statistically significant.
Teacher-reported experiences in the classroom seem to paint a different picture of
absenteeism, discipline, and other classroom management outcomes. TFA teachers were significantly more likely to report that student disruptions and physical conflicts among students in their classrooms were a “serious” problem (Table VII.3). While 17 percent of the control teachers said that physical conflicts among students were a serious problem, more than a third of the TFA teachers said they were a serious problem. In addition, TFA teachers reported significantly more class interruptions to deal with student disruptions—24 interruptions in the past week reported by TFA teachers, on average, compared with 14 reported by control teachers. In addition, TFA teachers reported greater verbal abuse and a greater frequency of student absenteeism, but the differences were not statistically significant. Differences in the rest of the teacher-reported outcomes in Table VII.3 were smaller and not statistically significant.
TABLE VII.3
IMPACTS ON TEACHER-REPORTS OF CLASSROOM PROBLEMS
Outcome Control Meana
TFA Mean Impact P-value
Number of Teachers
Teacher Reports a Serious Problem with Attendance/Tardiness (Percentage)
Student tardiness 12.9 16.2 3.3 0.669 96 Student absenteeism/class-cutting 8.6 17.1 8.6 0.237 96
Teacher Reports a Serious Problem with Behavior (Percentage)
Physical conflicts among students 17.1 34.3 17.1* 0.073 96 Verbal abuse of teachers 4.3 14.3 10.0 0.107 96 General misbehavior (for example, students
talking in class, refusal to follow classroom rules) 22.9 30.0 7.1 0.460 96
Problems in the Most Recent Week (Average Number)
Students tardy or absent without excuse 4.5 6.6 2.1 0.108 94 Teacher interrupted class to deal with student
disruptions 13.7 24.0 10.2* 0.061 94 Teacher sent child out of the room 2.4 2.6 0.3 0.795 95
Source: Teacher survey. aControl group means and impacts are regression-adjusted. The regression model controls for baseline test scores, gender, race/ethnicity, eligibility for free or reduced-price lunch, and age (whether overage for grade), as well as percentage of students in the classroom who were not in the research sample. *Statistically significant at the 0.10 level, two-sided test. **Statistically significant at the 0.05 level, two-sided test. ***Statistically significant at the 0.01 level, two-sided test.
46
There are at least two potential explanations for the findings of no impacts based on school-reported outcomes and potentially harmful impacts based on teacher self-reports. One is that TFA teachers had different expectations and perceptions than control teachers about student behavior, which could lead them to interrupt the class more often for disruptive students or be more prone to describing their students’ behavior as problematic. This explanation seems plausible, since, as we have demonstrated, TFA teachers and control teachers come from substantially different backgrounds before teaching. Another possibility is that TFA teachers actually had more difficulty managing their classrooms, which resulted in an objective increase in physical conflicts, verbal abuse, and disruption of class time. Because the results presented here on classroom management are inconclusive, further research is needed to fully understand the impacts of TFA on student behavior in the classroom.
47
VIII. CONCLUSION
The TFA teacher recruitment and training strategy produces teachers who differ in important ways from the other teachers in their schools. The TFA teachers in our sample had strong academic backgrounds, but they generally had less extensive teacher training than the control teachers in the same schools. Before entering the classroom, TFA teachers were less likely to have education degrees, be fully certified, or have substantial student teaching experience.
Our sample shows that although there were clear TFA-control differences in teacher
training, the differences were modest, primarily because the control teachers tended to be a diverse group with respect to their training. Many control teachers in these schools, like their TFA counterparts, did not have education degrees; and many were not fully certified and did not have extensive student teaching experience prior to entering the classroom. This finding reflects the situation in the schools in low-income communities where TFA places teachers rather than the situation in all schools across the country. Compared with a nationally representative sample of teachers, the control teachers in the schools in our study had substantially lower rates of certification and formal education training. Hence, in evaluating the impact of TFA teachers in our study, the appropriate counterfactual was not a set of fully certified teachers with education majors and substantial student teaching experience but, rather, a diverse group with mixed training.
Our estimates, based on student outcomes, show that TFA teachers had a positive impact on
the math achievement of their students—average math scores were higher among TFA students than among control students, and the difference was statistically significant. TFA teachers did not have an impact on reading achievement—average reading gains were comparable among the TFA and control students. The findings regarding math and reading impacts were fairly consistent across grades, regions, and student subgroups, and they were robust to changes in modeling assumptions and specifications. Our estimates also suggest that TFA teachers had larger impacts on both math and reading achievement when compared with novice control teachers than when compared with all control teachers, but the limited sample size for the novice teacher estimate precludes our drawing a definitive conclusion on this point. Estimates for other student outcomes did not reveal any other impacts of TFA. TFA teachers were more likely than control teachers to report having had problems with student disruptions and physical conflicts, but this fact may simply reflect differences between TFA and control teachers’ expectations and perceptions regarding student behavior rather than actual differences between classrooms.
The positive impacts of TFA teachers on student test scores should not be interpreted as
evidence that traditional teacher preparation routes provide training inferior to that provided by TFA. First, as we point out in the report, the control teachers in our comparisons included many who entered the profession through nontraditional routes. Second, this study was designed to examine the impact of the entire TFA program, which encompasses both the recruitment effect of TFA on the type of teacher that enters the profession and the effect of TFA training on program participants. We attempted to estimate the combined impact, rather than trying to disentangle these two effects, because it is most relevant for policymakers.
48
Regardless, our findings have important implications for a variety of stakeholders. Program funders, program operators, and policymakers at the state and federal levels have an enduring interest in finding ways to attract and retain high-quality teachers in low-income communities. District officials and school staff in such areas have an especially practical interest in the same question, particularly in the short term, with federal requirements under No Child Left Behind to place a highly qualified teacher in every classroom. Finally, parents and children in low-income communities are most directly affected by decisions about who will teach in their schools. We consider the implications of our findings for each of these groups.
From the perspective of a community or a school faced with the opportunity to hire TFA
teachers, our findings suggest that TFA offers an appealing pool of candidates. First, the positive impacts on math scores suggest that by hiring TFA teachers, a school can expect to increase the average math achievement of its students (without lowering their reading achievement). Second, the consistent pattern of positive or zero impacts on test scores across grades, regions, and student subgroups suggests that there is little risk that hiring TFA teachers will reduce achievement, either for the average student or for most subgroups of students. Finally, since TFA teachers are paid the same as other teachers, the schools pay no direct costs for the achievement increase and school districts typically contribute only $1,500 per corps member to offset screening and recruiting costs. This contrasts with other interventions, such as reduction in class size, that have been shown to increase achievement but that entail substantial direct costs.
One could expand this reasoning to conduct a larger assessment of whether, from society’s perspective, TFA is a cost-effective way to attract teachers to low-income schools. However, a full cost-effectiveness assessment would require information on a number of factors our study does not address directly. For example, although TFA teachers are paid on the same salary scale as their counterparts, they may create hidden costs if they leave their jobs sooner—for example, at the end of their two-year commitment—and have to be replaced more frequently than their non-TFA peers. Measuring such costs would be difficult, because the retention rates of TFA and non-TFA teachers are not well documented. Our data showed no difference in within-year attrition rates, but because they cover only a single school year, cannot be used to compare attrition rates over time between our TFA and control teachers. Hanushek et al. (2004) show that teacher attrition rates are particularly high in schools that serve large numbers of academically disadvantaged students—exactly the types of schools where TFA places teachers. Therefore, there is no strong reason to presume that TFA teachers have an attrition rate higher than that of other new teachers in the same schools.
From the perspective of TFA and its funders, our findings clearly show that the organization
is making progress toward its primary mission of reducing inequities in education—it supplies low-income schools with academically talented teachers who contribute positively to the academic achievement of their students. The success of TFA teachers is not dependent on teachers having extensive exposure to teacher practice or training. Even though TFA teachers generally lack any formal teacher training beyond that provided by TFA, they produce higher student test scores than the other teachers in their schools—not just other novice teachers or uncertified teachers, but also veterans and certified teachers.
49
Finally, our study provides important information to policymakers who are trying to improve the educational opportunities of children in poor communities. The findings that many of the control teachers in our study were not certified or did not have formal pre-service training highlights the need for programs or policies that offer the potential of attracting good teachers to schools in the most disadvantaged communities. Our findings show that TFA is one such program.

51
REFERENCES
Ballou, D., and M. Podgursky. “The Case Against Teacher Certification.” Public Interest, vol. 132, 1998, pp. 17-29.
Barron’s Profiles of American Colleges. Hauppauge, NY: Barron’s Educational Series, Inc., 2003.
Darling-Hammond, L. “What Matters Most: A Competent Teacher for Every Child.” Phi Delta Kappan, vol. 77, 1996, pp. 193-201.
Darling-Hammond, L. “Who Will Speak for the Children? How ‘Teach for America’ Hurts Urban School Children.” Phi Delta Kappan, vol. 76, 1994, pp. 21-34.
Finn, J., and C. Achilles. “Tennessee’s Class Size Study: Findings, Implications, Misconceptions.” Educational Evaluation and Policy Analysis, vol. 21, no. 2, summer 1999, pp. 97-110.
Hanushek, Eric A. “Efficient Estimators for Regressing Regression Coefficients.” American Statistician, vol. 28, no. 2, 1974, pp. 66-67.
Hanushek, Eric A., John F. Kain, and Steven Rivkin. “Why Public Schools Lose Teachers.” Journal of Human Resources, vol. 39, no. 2, Spring 2004, pp. 326-354.
Laczko-Kerr, I., and D. Berliner. “The Effectiveness of ‘Teach for America’ and Other Under-Certified Teachers on Student Academic Achievement: A Case of Harmful Public Policy.” Education Policy Analysis Archives, vol. 10, no. 37, 2002.
Raymond, M., S. Fletcher, and J. Luque. “Teach for America: An Evaluation of Teacher Differences and Student Outcomes in Houston, Texas.” Stanford, CA: CREDO, Hoover Institution, Stanford University, 2001.

APPENDIX A
SUPPLEMENTARY TABLES

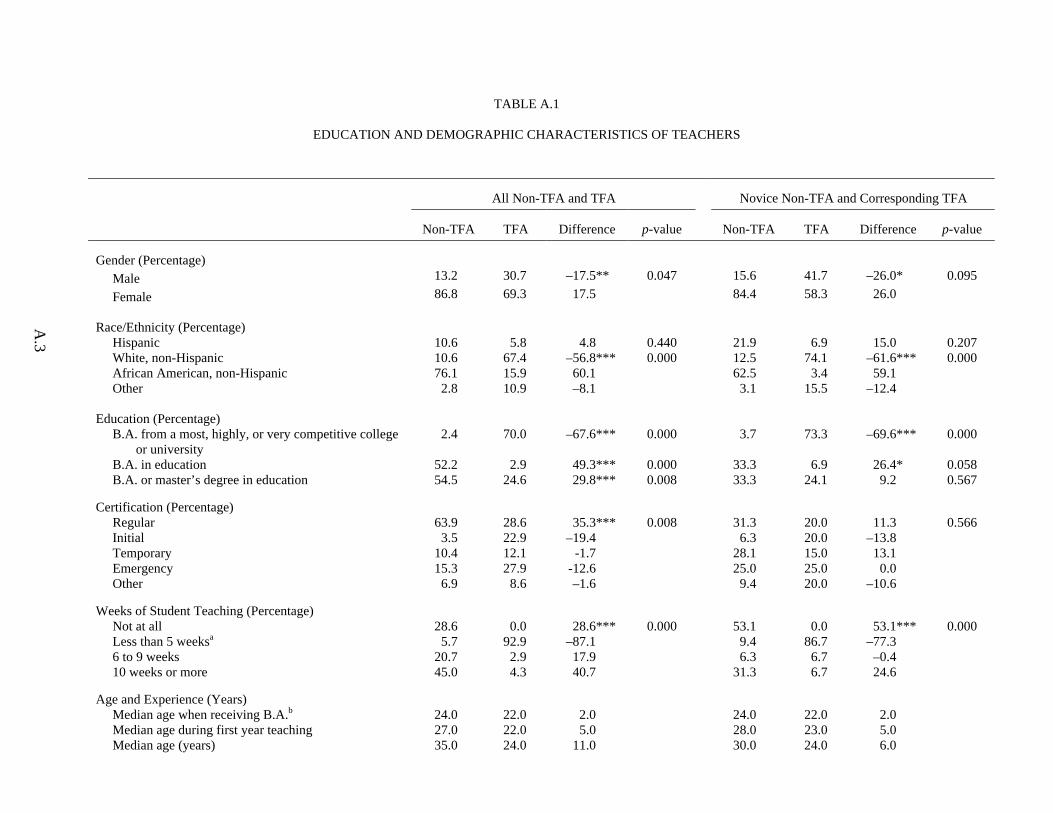
A.3
TABLE A.1
EDUCATION AND DEMOGRAPHIC CHARACTERISTICS OF TEACHERS
All Non-TFA and TFA Novice Non-TFA and Corresponding TFA Non-TFA TFA Difference p-value Non-TFA TFA Difference p-value
Gender (Percentage) Male 13.2 30.7 –17.5** 0.047 15.6 41.7 –26.0* 0.095 Female 86.8 69.3 17.5 84.4 58.3 26.0
Race/Ethnicity (Percentage) Hispanic 10.6 5.8 4.8 0.440 21.9 6.9 15.0 0.207 White, non-Hispanic 10.6 67.4 –56.8*** 0.000 12.5 74.1 –61.6*** 0.000 African American, non-Hispanic 76.1 15.9 60.1 62.5 3.4 59.1 Other 2.8 10.9 –8.1 3.1 15.5 –12.4
Education (Percentage) B.A. from a most, highly, or very competitive college
or university 2.4 70.0 –67.6*** 0.000 3.7 73.3 –69.6*** 0.000
B.A. in education 52.2 2.9 49.3*** 0.000 33.3 6.9 26.4* 0.058 B.A. or master’s degree in education 54.5 24.6 29.8*** 0.008 33.3 24.1 9.2 0.567
Certification (Percentage) Regular 63.9 28.6 35.3*** 0.008 31.3 20.0 11.3 0.566 Initial 3.5 22.9 –19.4 6.3 20.0 –13.8 Temporary 10.4 12.1 -1.7 28.1 15.0 13.1 Emergency 15.3 27.9 -12.6 25.0 25.0 0.0 Other 6.9 8.6 –1.6 9.4 20.0 –10.6
Weeks of Student Teaching (Percentage) Not at all 28.6 0.0 28.6*** 0.000 53.1 0.0 53.1*** 0.000 Less than 5 weeksa 5.7 92.9 –87.1 9.4 86.7 –77.3 6 to 9 weeks 20.7 2.9 17.9 6.3 6.7 –0.4 10 weeks or more 45.0 4.3 40.7 31.3 6.7 24.6
Age and Experience (Years) Median age when receiving B.A.b 24.0 22.0 2.0 24.0 22.0 2.0 Median age during first year teaching 27.0 22.0 5.0 28.0 23.0 5.0 Median age (years) 35.0 24.0 11.0 30.0 24.0 6.0
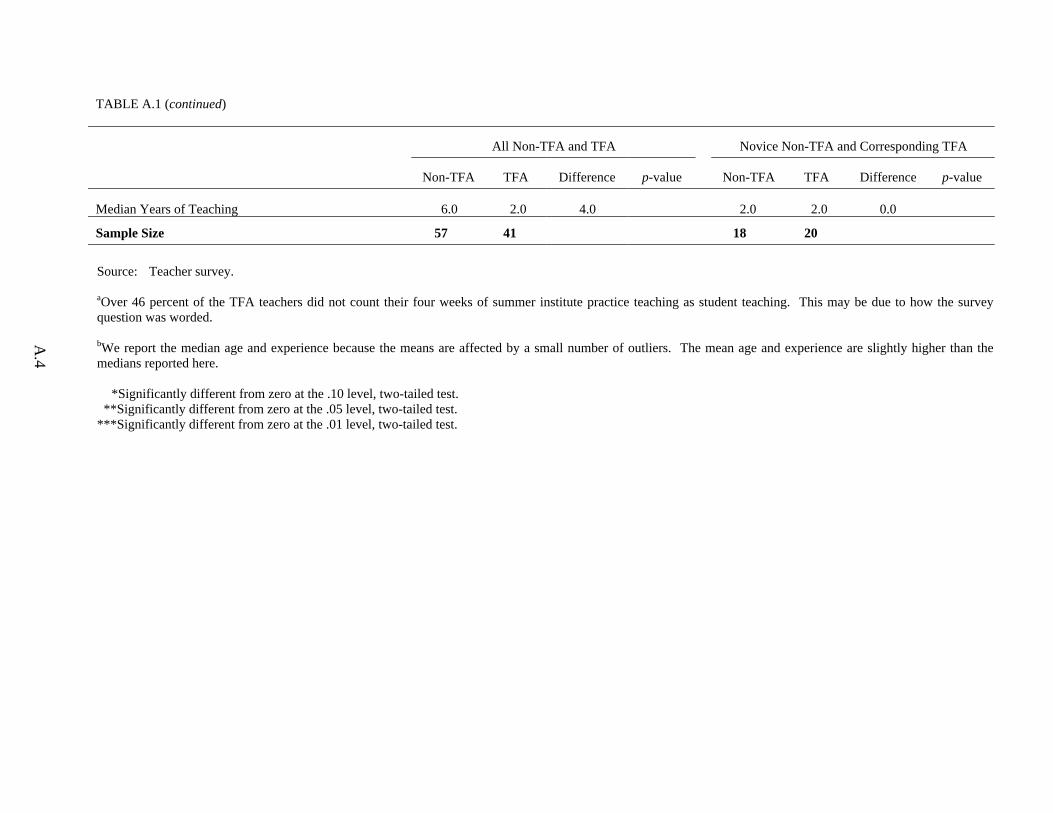
TABLE A.1 (continued)
A.4
All Non-TFA and TFA Novice Non-TFA and Corresponding TFA Non-TFA TFA Difference p-value Non-TFA TFA Difference p-value
Median Years of Teaching 6.0 2.0 4.0 2.0 2.0 0.0
Sample Size 57 41 18 20
Source: Teacher survey. aOver 46 percent of the TFA teachers did not count their four weeks of summer institute practice teaching as student teaching. This may be due to how the survey question was worded. bWe report the median age and experience because the means are affected by a small number of outliers. The mean age and experience are slightly higher than the medians reported here. *Significantly different from zero at the .10 level, two-tailed test. **Significantly different from zero at the .05 level, two-tailed test. ***Significantly different from zero at the .01 level, two-tailed test.
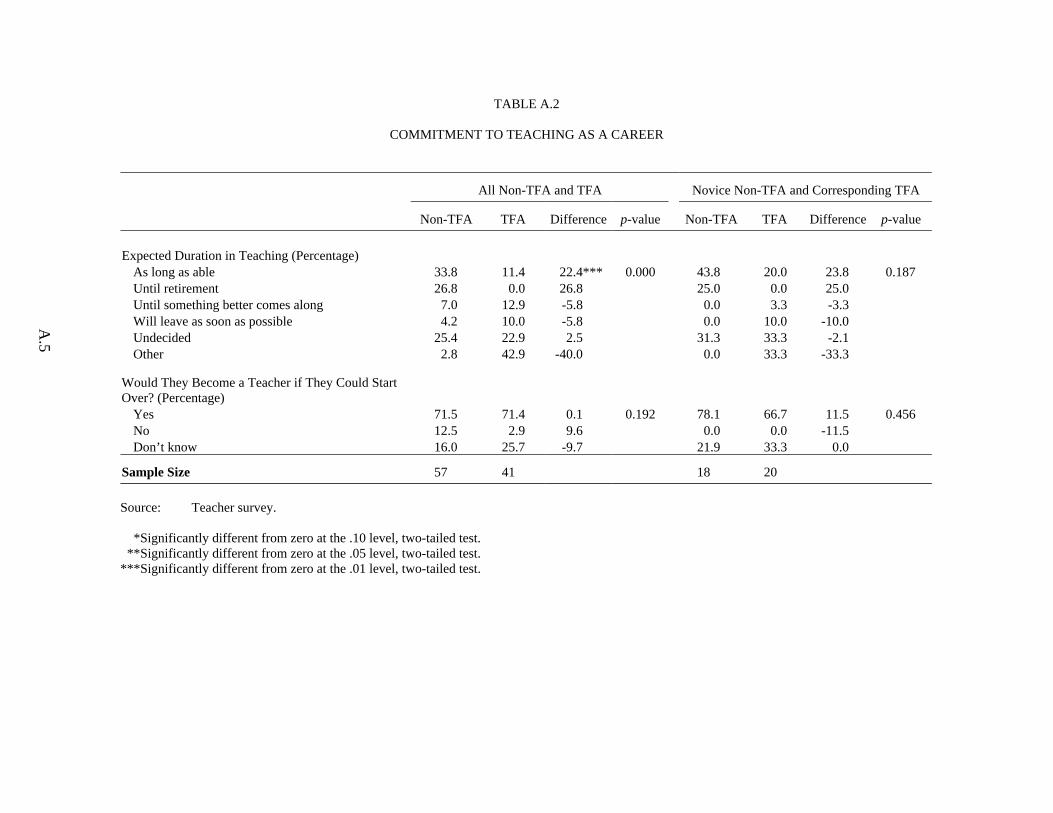
A.5
TABLE A.2
COMMITMENT TO TEACHING AS A CAREER
All Non-TFA and TFA Novice Non-TFA and Corresponding TFA
Non-TFA TFA Difference p-value Non-TFA TFA Difference p-value Expected Duration in Teaching (Percentage)
As long as able 33.8 11.4 22.4*** 0.000 43.8 20.0 23.8 0.187 Until retirement 26.8 0.0 26.8 25.0 0.0 25.0 Until something better comes along 7.0 12.9 -5.8 0.0 3.3 -3.3 Will leave as soon as possible 4.2 10.0 -5.8 0.0 10.0 -10.0 Undecided 25.4 22.9 2.5 31.3 33.3 -2.1 Other 2.8 42.9 -40.0 0.0 33.3 -33.3
Would They Become a Teacher if They Could Start Over? (Percentage)
Yes 71.5 71.4 0.1 0.192 78.1 66.7 11.5 0.456 No 12.5 2.9 9.6 0.0 0.0 -11.5 Don’t know 16.0 25.7 -9.7 21.9 33.3 0.0
Sample Size 57 41 18 20 Source: Teacher survey. *Significantly different from zero at the .10 level, two-tailed test. **Significantly different from zero at the .05 level, two-tailed test. ***Significantly different from zero at the .01 level, two-tailed test.
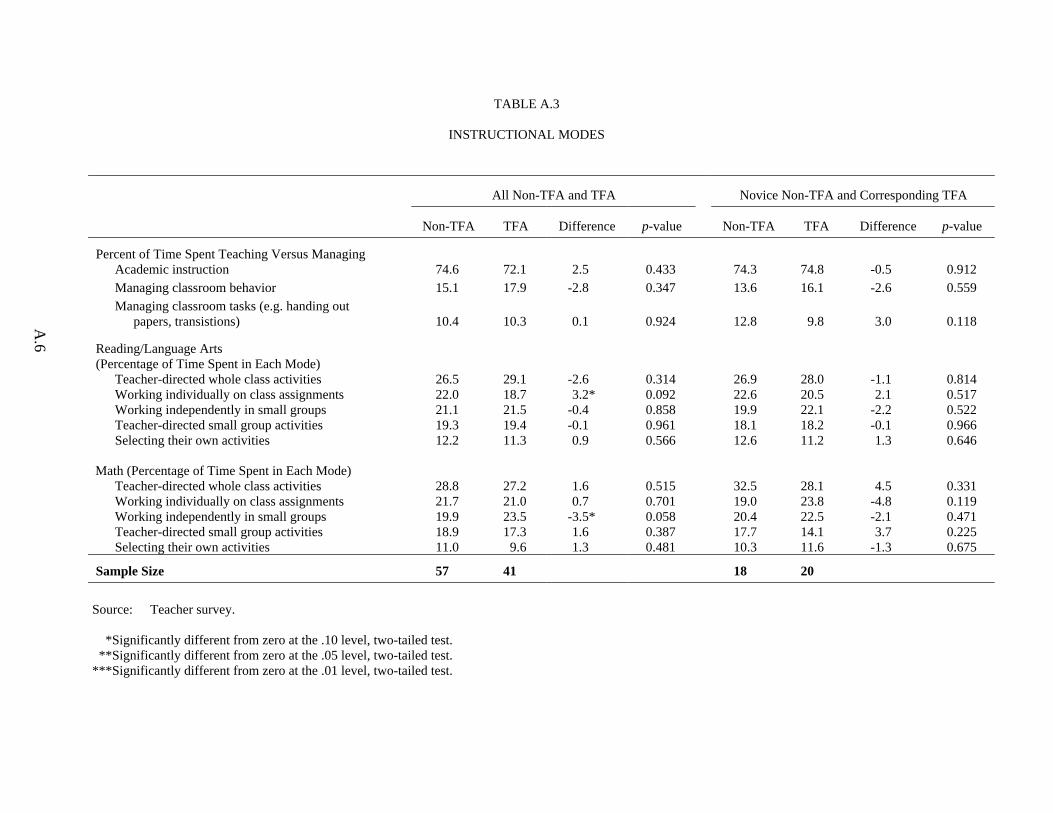
A.6
TABLE A.3
INSTRUCTIONAL MODES
All Non-TFA and TFA Novice Non-TFA and Corresponding TFA Non-TFA TFA Difference p-value Non-TFA TFA Difference p-value
Percent of Time Spent Teaching Versus Managing Academic instruction 74.6 72.1 2.5 0.433 74.3 74.8 -0.5 0.912 Managing classroom behavior 15.1 17.9 -2.8 0.347 13.6 16.1 -2.6 0.559 Managing classroom tasks (e.g. handing out
papers, transistions) 10.4 10.3 0.1 0.924 12.8 9.8 3.0 0.118
Reading/Language Arts (Percentage of Time Spent in Each Mode)
Teacher-directed whole class activities 26.5 29.1 -2.6 0.314 26.9 28.0 -1.1 0.814 Working individually on class assignments 22.0 18.7 3.2* 0.092 22.6 20.5 2.1 0.517 Working independently in small groups 21.1 21.5 -0.4 0.858 19.9 22.1 -2.2 0.522 Teacher-directed small group activities 19.3 19.4 -0.1 0.961 18.1 18.2 -0.1 0.966 Selecting their own activities 12.2 11.3 0.9 0.566 12.6 11.2 1.3 0.646
Math (Percentage of Time Spent in Each Mode) Teacher-directed whole class activities 28.8 27.2 1.6 0.515 32.5 28.1 4.5 0.331 Working individually on class assignments 21.7 21.0 0.7 0.701 19.0 23.8 -4.8 0.119 Working independently in small groups 19.9 23.5 -3.5* 0.058 20.4 22.5 -2.1 0.471 Teacher-directed small group activities 18.9 17.3 1.6 0.387 17.7 14.1 3.7 0.225 Selecting their own activities 11.0 9.6 1.3 0.481 10.3 11.6 -1.3 0.675
Sample Size 57 41 18 20
Source: Teacher survey. *Significantly different from zero at the .10 level, two-tailed test. **Significantly different from zero at the .05 level, two-tailed test. ***Significantly different from zero at the .01 level, two-tailed test.
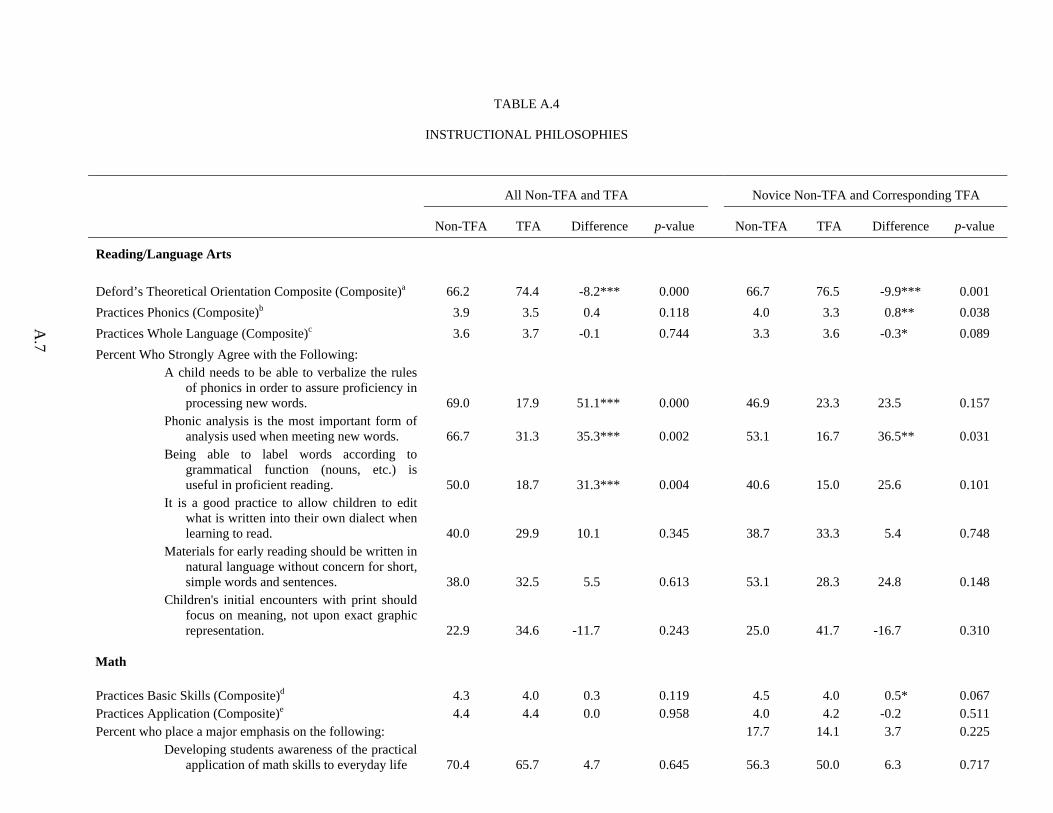
A.7
TABLE A.4
INSTRUCTIONAL PHILOSOPHIES
All Non-TFA and TFA Novice Non-TFA and Corresponding TFA
Non-TFA TFA Difference p-value Non-TFA TFA Difference p-value
Reading/Language Arts
Deford’s Theoretical Orientation Composite (Composite)a 66.2 74.4 -8.2*** 0.000 66.7 76.5 -9.9*** 0.001 Practices Phonics (Composite)b 3.9 3.5 0.4 0.118 4.0 3.3 0.8** 0.038 Practices Whole Language (Composite)c 3.6 3.7 -0.1 0.744 3.3 3.6 -0.3* 0.089 Percent Who Strongly Agree with the Following:
A child needs to be able to verbalize the rules of phonics in order to assure proficiency in processing new words. 69.0 17.9 51.1*** 0.000 46.9 23.3 23.5 0.157
Phonic analysis is the most important form of analysis used when meeting new words. 66.7 31.3 35.3*** 0.002 53.1 16.7 36.5** 0.031
Being able to label words according to grammatical function (nouns, etc.) is useful in proficient reading. 50.0 18.7 31.3*** 0.004 40.6 15.0 25.6 0.101
It is a good practice to allow children to edit what is written into their own dialect when learning to read. 40.0 29.9 10.1 0.345 38.7 33.3 5.4 0.748
Materials for early reading should be written in natural language without concern for short, simple words and sentences. 38.0 32.5 5.5 0.613 53.1 28.3 24.8 0.148
Children's initial encounters with print should focus on meaning, not upon exact graphic representation. 22.9 34.6 -11.7 0.243 25.0 41.7 -16.7 0.310
Math
Practices Basic Skills (Composite)d 4.3 4.0 0.3 0.119 4.5 4.0 0.5* 0.067 Practices Application (Composite)e 4.4 4.4 0.0 0.958 4.0 4.2 -0.2 0.511 Percent who place a major emphasis on the following: 17.7 14.1 3.7 0.225
Developing students awareness of the practical application of math skills to everyday life 70.4 65.7 4.7 0.645 56.3 50.0 6.3 0.717
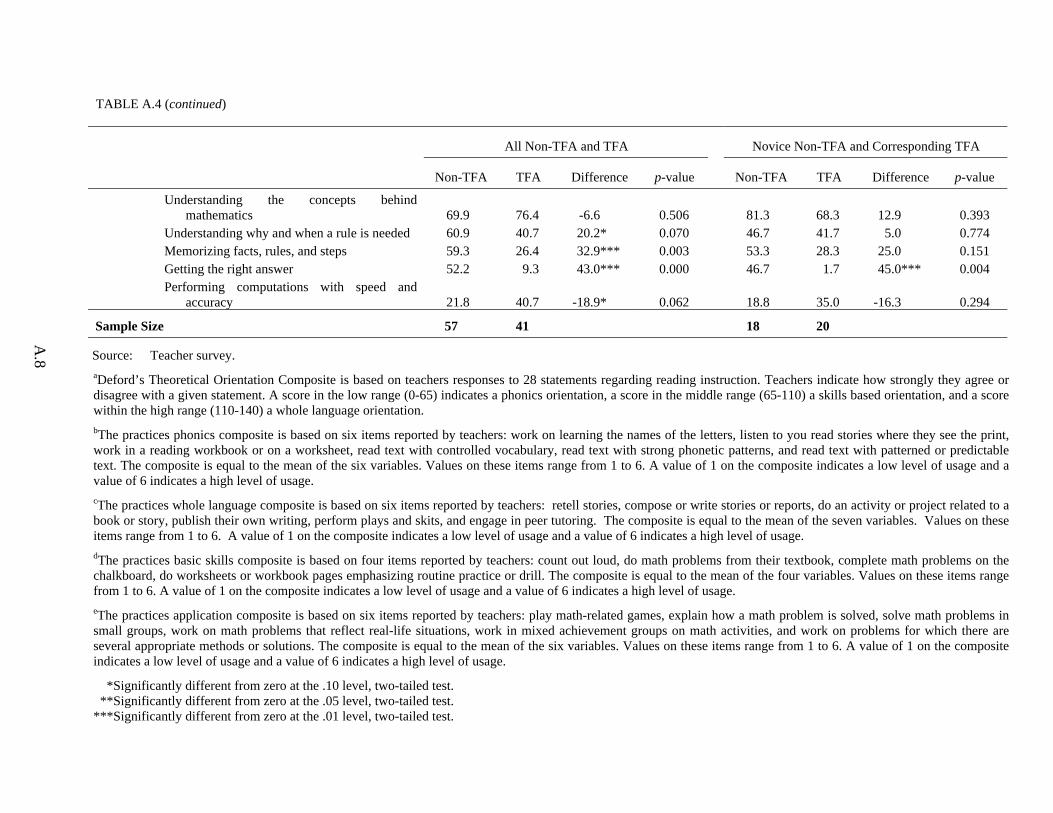
TABLE A.4 (continued)
A.8
All Non-TFA and TFA Novice Non-TFA and Corresponding TFA
Non-TFA TFA Difference p-value Non-TFA TFA Difference p-value
Understanding the concepts behind mathematics 69.9 76.4 -6.6 0.506 81.3 68.3 12.9 0.393
Understanding why and when a rule is needed 60.9 40.7 20.2* 0.070 46.7 41.7 5.0 0.774 Memorizing facts, rules, and steps 59.3 26.4 32.9*** 0.003 53.3 28.3 25.0 0.151 Getting the right answer 52.2 9.3 43.0*** 0.000 46.7 1.7 45.0*** 0.004 Performing computations with speed and
accuracy 21.8 40.7 -18.9* 0.062 18.8 35.0 -16.3 0.294
Sample Size 57 41 18 20
Source: Teacher survey.
aDeford’s Theoretical Orientation Composite is based on teachers responses to 28 statements regarding reading instruction. Teachers indicate how strongly they agree or disagree with a given statement. A score in the low range (0-65) indicates a phonics orientation, a score in the middle range (65-110) a skills based orientation, and a score within the high range (110-140) a whole language orientation.
bThe practices phonics composite is based on six items reported by teachers: work on learning the names of the letters, listen to you read stories where they see the print, work in a reading workbook or on a worksheet, read text with controlled vocabulary, read text with strong phonetic patterns, and read text with patterned or predictable text. The composite is equal to the mean of the six variables. Values on these items range from 1 to 6. A value of 1 on the composite indicates a low level of usage and a value of 6 indicates a high level of usage.
cThe practices whole language composite is based on six items reported by teachers: retell stories, compose or write stories or reports, do an activity or project related to a book or story, publish their own writing, perform plays and skits, and engage in peer tutoring. The composite is equal to the mean of the seven variables. Values on these items range from 1 to 6. A value of 1 on the composite indicates a low level of usage and a value of 6 indicates a high level of usage.
dThe practices basic skills composite is based on four items reported by teachers: count out loud, do math problems from their textbook, complete math problems on the chalkboard, do worksheets or workbook pages emphasizing routine practice or drill. The composite is equal to the mean of the four variables. Values on these items range from 1 to 6. A value of 1 on the composite indicates a low level of usage and a value of 6 indicates a high level of usage.
eThe practices application composite is based on six items reported by teachers: play math-related games, explain how a math problem is solved, solve math problems in small groups, work on math problems that reflect real-life situations, work in mixed achievement groups on math activities, and work on problems for which there are several appropriate methods or solutions. The composite is equal to the mean of the six variables. Values on these items range from 1 to 6. A value of 1 on the composite indicates a low level of usage and a value of 6 indicates a high level of usage.
*Significantly different from zero at the .10 level, two-tailed test. **Significantly different from zero at the .05 level, two-tailed test. ***Significantly different from zero at the .01 level, two-tailed test.
APPENDIX B
ESTIMATION APPROACH

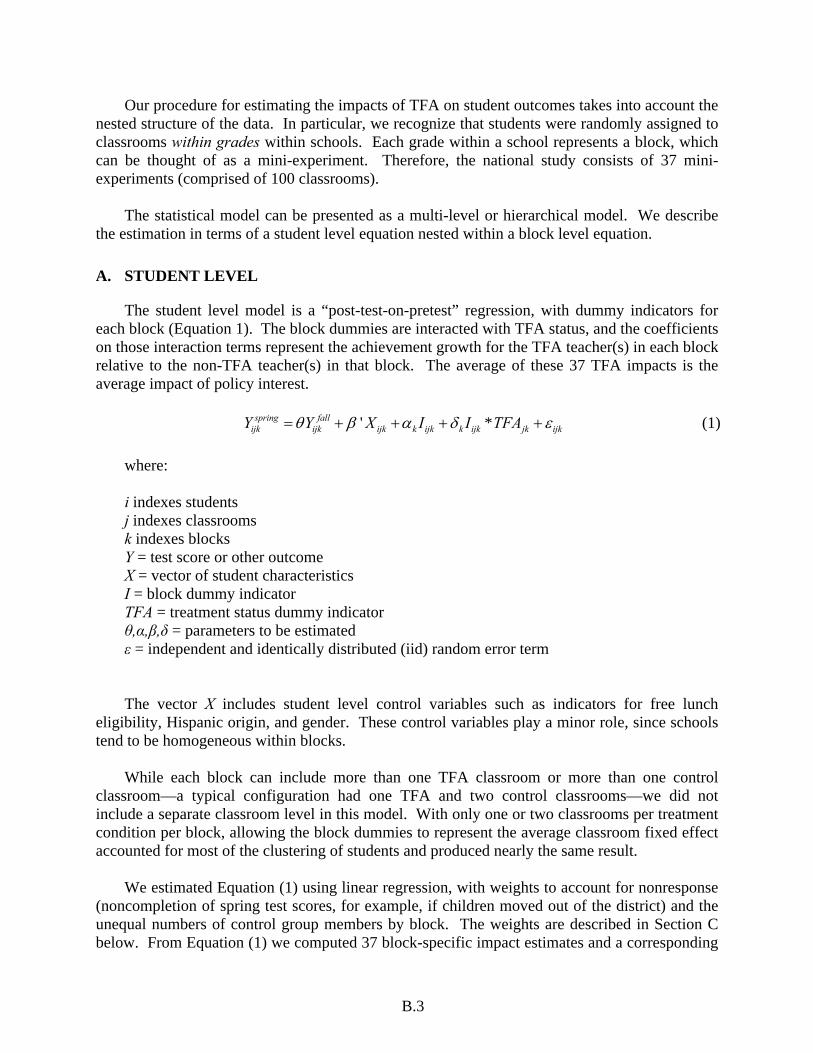
B.3
Our procedure for estimating the impacts of TFA on student outcomes takes into account the nested structure of the data. In particular, we recognize that students were randomly assigned to classrooms within grades within schools. Each grade within a school represents a block, which can be thought of as a mini-experiment. Therefore, the national study consists of 37 mini-experiments (comprised of 100 classrooms).
The statistical model can be presented as a multi-level or hierarchical model. We describe
the estimation in terms of a student level equation nested within a block level equation.
A. STUDENT LEVEL
The student level model is a “post-test-on-pretest” regression, with dummy indicators for each block (Equation 1). The block dummies are interacted with TFA status, and the coefficients on those interaction terms represent the achievement growth for the TFA teacher(s) in each block relative to the non-TFA teacher(s) in that block. The average of these 37 TFA impacts is the average impact of policy interest.
' *spring fall
ijk ijk ijk k ijk k ijk jk ijkY Y X I I TFAθ β α δ ε= + + + + (1) where: i indexes students j indexes classrooms k indexes blocks Y = test score or other outcome X = vector of student characteristics I = block dummy indicator TFA = treatment status dummy indicator θ,α,β,δ = parameters to be estimated ε = independent and identically distributed (iid) random error term The vector X includes student level control variables such as indicators for free lunch
eligibility, Hispanic origin, and gender. These control variables play a minor role, since schools tend to be homogeneous within blocks.
While each block can include more than one TFA classroom or more than one control
classroom—a typical configuration had one TFA and two control classrooms—we did not include a separate classroom level in this model. With only one or two classrooms per treatment condition per block, allowing the block dummies to represent the average classroom fixed effect accounted for most of the clustering of students and produced nearly the same result.
We estimated Equation (1) using linear regression, with weights to account for nonresponse
(noncompletion of spring test scores, for example, if children moved out of the district) and the unequal numbers of control group members by block. The weights are described in Section C below. From Equation (1) we computed 37 block-specific impact estimates and a corresponding
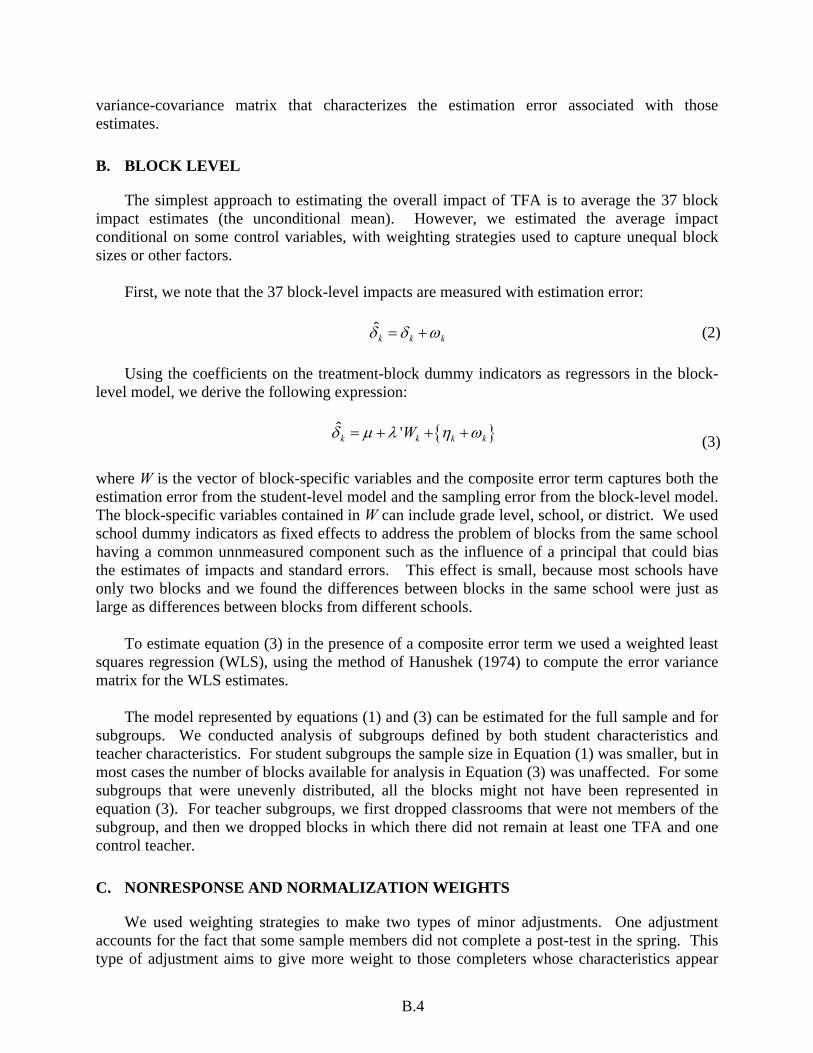
B.4
variance-covariance matrix that characterizes the estimation error associated with those estimates.
B. BLOCK LEVEL
The simplest approach to estimating the overall impact of TFA is to average the 37 block impact estimates (the unconditional mean). However, we estimated the average impact conditional on some control variables, with weighting strategies used to capture unequal block sizes or other factors.
First, we note that the 37 block-level impacts are measured with estimation error:
ˆk k kδ δ ω= + (2)
Using the coefficients on the treatment-block dummy indicators as regressors in the block-
level model, we derive the following expression:
{ }ˆ 'k k k kWδ µ λ η ω= + + + (3) where W is the vector of block-specific variables and the composite error term captures both the estimation error from the student-level model and the sampling error from the block-level model. The block-specific variables contained in W can include grade level, school, or district. We used school dummy indicators as fixed effects to address the problem of blocks from the same school having a common unnmeasured component such as the influence of a principal that could bias the estimates of impacts and standard errors. This effect is small, because most schools have only two blocks and we found the differences between blocks in the same school were just as large as differences between blocks from different schools.
To estimate equation (3) in the presence of a composite error term we used a weighted least
squares regression (WLS), using the method of Hanushek (1974) to compute the error variance matrix for the WLS estimates.
The model represented by equations (1) and (3) can be estimated for the full sample and for
subgroups. We conducted analysis of subgroups defined by both student characteristics and teacher characteristics. For student subgroups the sample size in Equation (1) was smaller, but in most cases the number of blocks available for analysis in Equation (3) was unaffected. For some subgroups that were unevenly distributed, all the blocks might not have been represented in equation (3). For teacher subgroups, we first dropped classrooms that were not members of the subgroup, and then we dropped blocks in which there did not remain at least one TFA and one control teacher.
C. NONRESPONSE AND NORMALIZATION WEIGHTS
We used weighting strategies to make two types of minor adjustments. One adjustment accounts for the fact that some sample members did not complete a post-test in the spring. This type of adjustment aims to give more weight to those completers whose characteristics appear
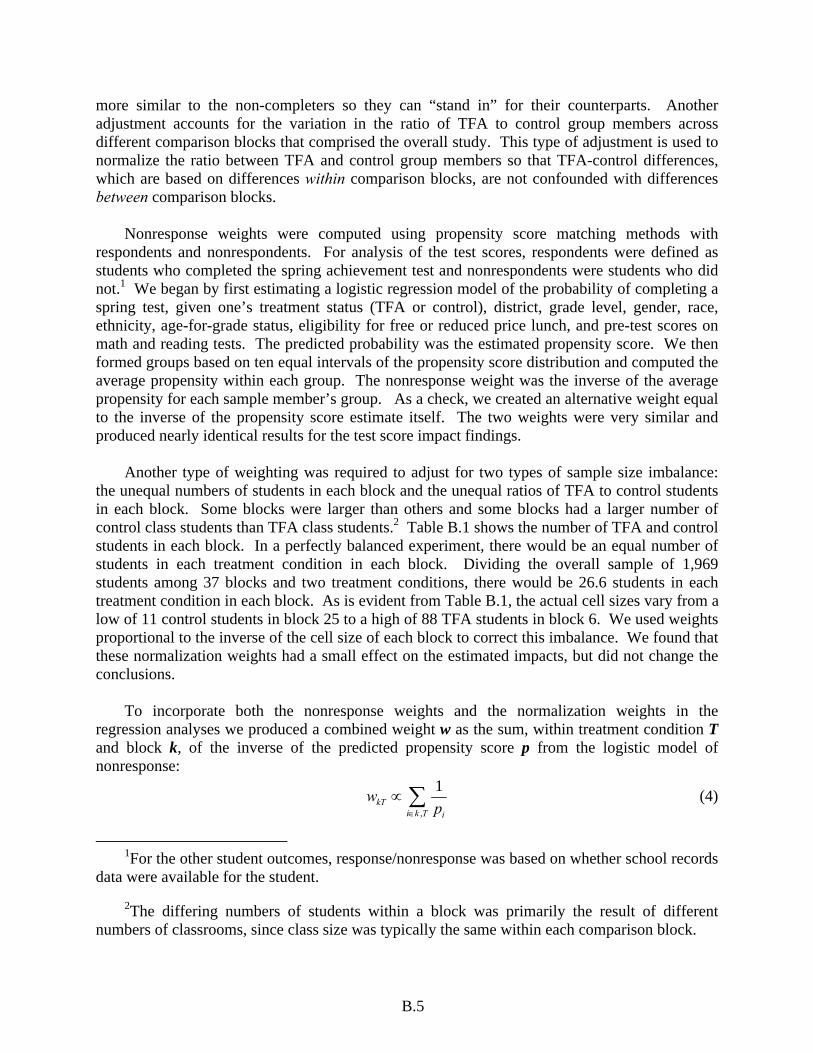
B.5
more similar to the non-completers so they can “stand in” for their counterparts. Another adjustment accounts for the variation in the ratio of TFA to control group members across different comparison blocks that comprised the overall study. This type of adjustment is used to normalize the ratio between TFA and control group members so that TFA-control differences, which are based on differences within comparison blocks, are not confounded with differences between comparison blocks.
Nonresponse weights were computed using propensity score matching methods with
respondents and nonrespondents. For analysis of the test scores, respondents were defined as students who completed the spring achievement test and nonrespondents were students who did not.1 We began by first estimating a logistic regression model of the probability of completing a spring test, given one’s treatment status (TFA or control), district, grade level, gender, race, ethnicity, age-for-grade status, eligibility for free or reduced price lunch, and pre-test scores on math and reading tests. The predicted probability was the estimated propensity score. We then formed groups based on ten equal intervals of the propensity score distribution and computed the average propensity within each group. The nonresponse weight was the inverse of the average propensity for each sample member’s group. As a check, we created an alternative weight equal to the inverse of the propensity score estimate itself. The two weights were very similar and produced nearly identical results for the test score impact findings.
Another type of weighting was required to adjust for two types of sample size imbalance:
the unequal numbers of students in each block and the unequal ratios of TFA to control students in each block. Some blocks were larger than others and some blocks had a larger number of control class students than TFA class students.2 Table B.1 shows the number of TFA and control students in each block. In a perfectly balanced experiment, there would be an equal number of students in each treatment condition in each block. Dividing the overall sample of 1,969 students among 37 blocks and two treatment conditions, there would be 26.6 students in each treatment condition in each block. As is evident from Table B.1, the actual cell sizes vary from a low of 11 control students in block 25 to a high of 88 TFA students in block 6. We used weights proportional to the inverse of the cell size of each block to correct this imbalance. We found that these normalization weights had a small effect on the estimated impacts, but did not change the conclusions.
To incorporate both the nonresponse weights and the normalization weights in the
regression analyses we produced a combined weight w as the sum, within treatment condition T and block k, of the inverse of the predicted propensity score p from the logistic model of nonresponse:
,
1kT
i k T i
wp∈
∝ ∑ (4)
1For the other student outcomes, response/nonresponse was based on whether school records
data were available for the student.
2The differing numbers of students within a block was primarily the result of different numbers of classrooms, since class size was typically the same within each comparison block.
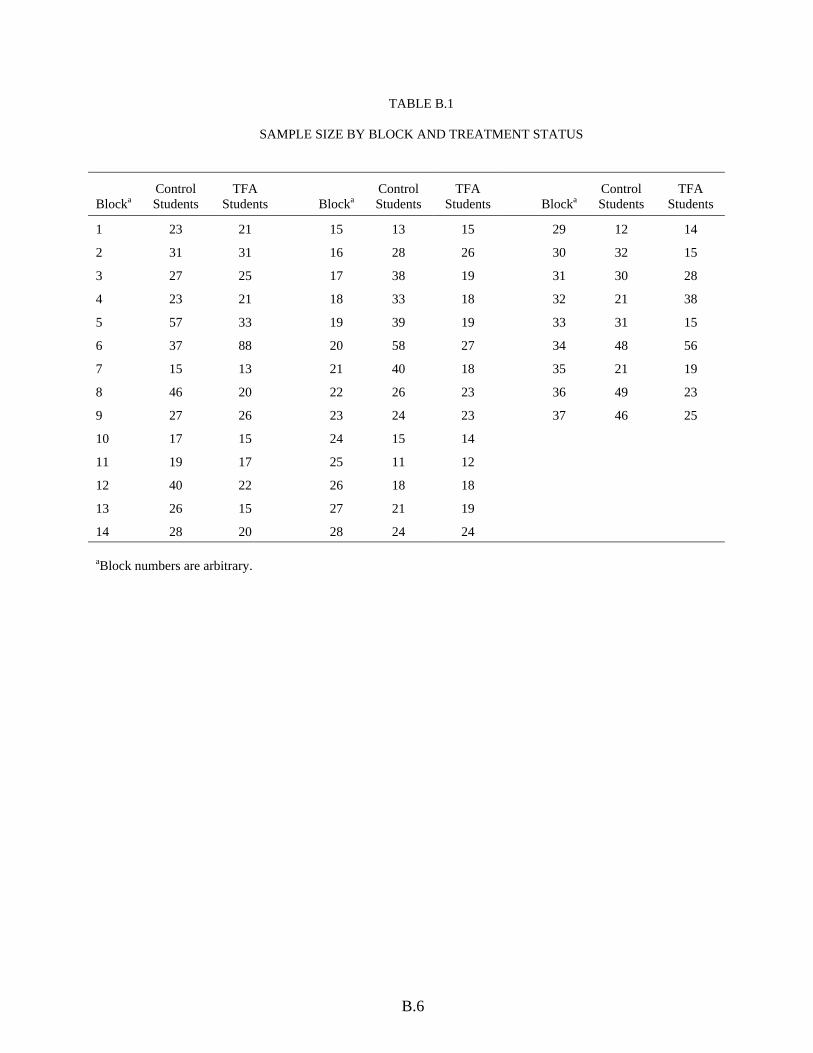
B.6
TABLE B.1
SAMPLE SIZE BY BLOCK AND TREATMENT STATUS
Blocka Control Students
TFA Students Blocka
Control Students
TFA Students Blocka
Control Students
TFA Students
1 23 21 15 13 15 29 12 14
2 31 31 16 28 26 30 32 15
3 27 25 17 38 19 31 30 28
4 23 21 18 33 18 32 21 38
5 57 33 19 39 19 33 31 15
6 37 88 20 58 27 34 48 56
7 15 13 21 40 18 35 21 19
8 46 20 22 26 23 36 49 23
9 27 26 23 24 23 37 46 25
10 17 15 24 15 14
11 19 17 25 11 12
12 40 22 26 18 18
13 26 15 27 21 19
14 28 20 28 24 24 aBlock numbers are arbitrary.