the el niño/ southern oscillation (enso) cycle michelle l’heureux noaa/nws/ncep/climate...
TRANSCRIPT

The El Niño/ Southern Oscillation (ENSO) Cycle
Michelle L’Heureux
NOAA/NWS/NCEP/Climate Prediction Center
Adapted from Vern Kousky’s presentation

Outline
(1) Seasonal Cycle of Sea Surface Temperature and Precipitation (2) El Niño - Southern Oscillation (ENSO): Historical Context
(3) Comparison between El Niño/ Low SO Phase VS. La Niña/ High SO Phase
(4) The ENSO Cycle: A Coupled Ocean- Atmosphere System
(5) Evolution of Previous ENSO Cycles
(6) ENSO Teleconnections and Global Impacts
(7) Upper-level Circulation Changes over the Pacific and North America
(8) Application to ENSO Monitoring and Prediction at NOAA Climate Prediction Center (CPC)
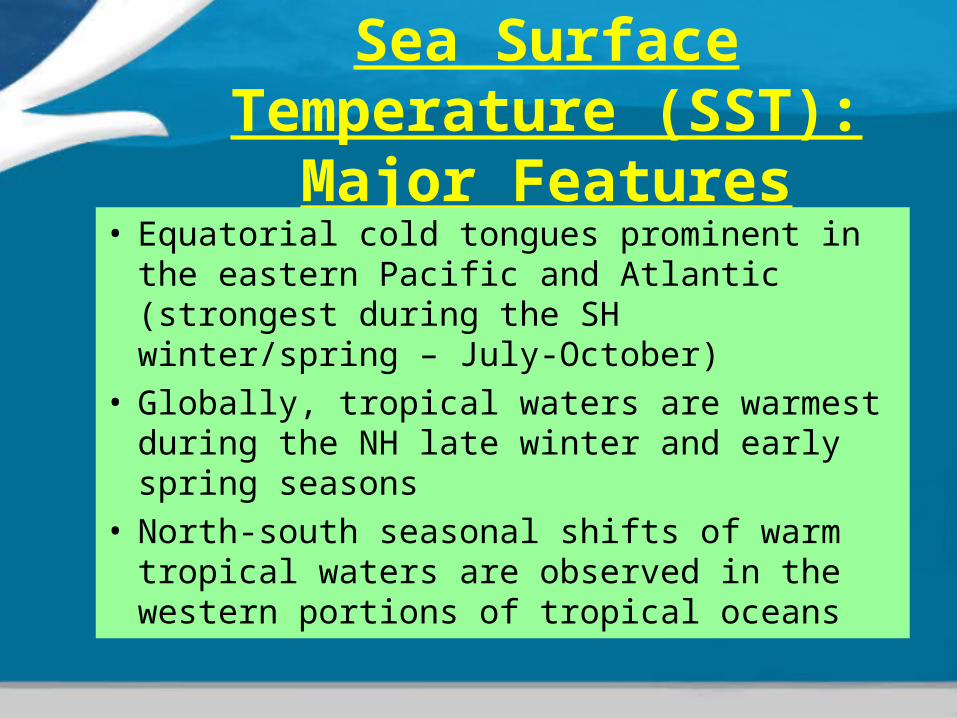
Sea Surface Temperature (SST): Major Features
• Equatorial cold tongues prominent in the eastern Pacific and Atlantic (strongest during the SH winter/spring – July-October)
• Globally, tropical waters are warmest during the NH late winter and early spring seasons
• North-south seasonal shifts of warm tropical waters are observed in the western portions of tropical oceans
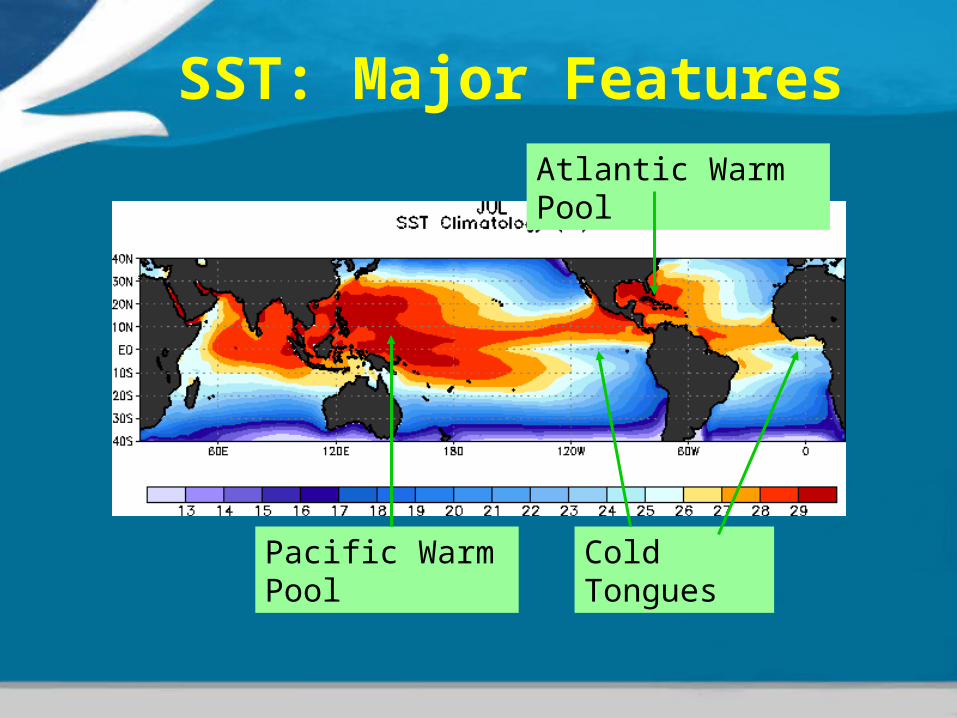
SST: Major Features
Atlantic Warm Pool
Pacific Warm Pool Cold Tongues

SST: Extremes in the Annual Cycle
Equatorial SSTs are warmest in April
Equatorial cold tongues are strongest in Jul.-Oct.
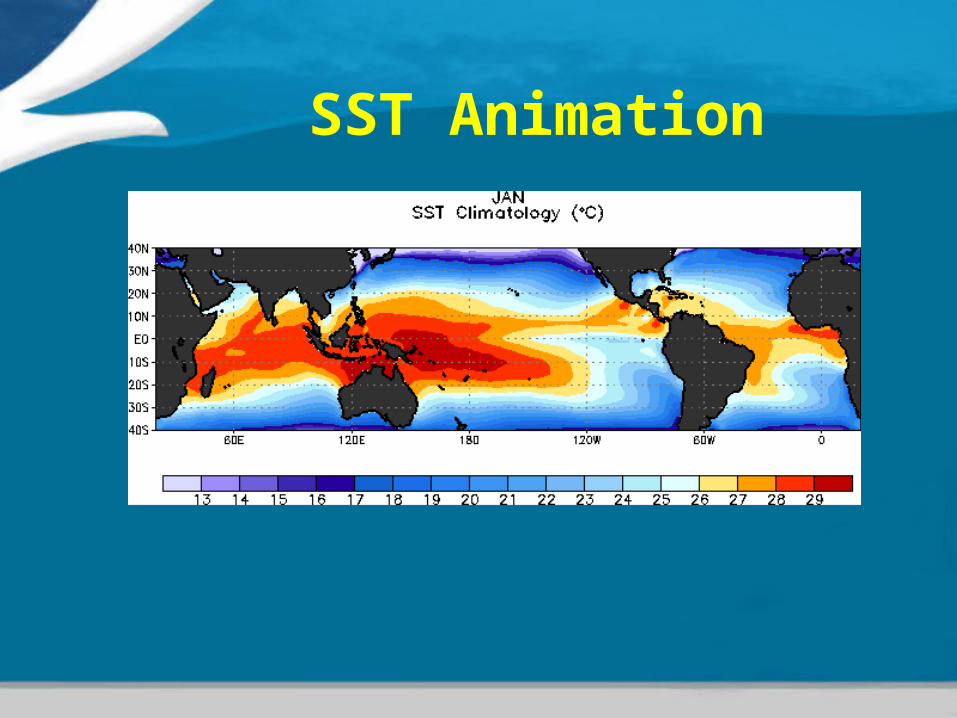
SST Animation
Precipitation
Global precipitation analyses based on station data and satellite-derived estimates
• Greatest precipitation over warm surfaces where ample moisture is available, and in areas of mid-latitude storm activity– Tropical land masses– Intertropical Convergence Zones (ITCZs)– South Pacific Convergence Zone (SPCZ)– South Atlantic Convergence Zone (SACZ)– Mid-latitude winter storm tracks

Precipitation: Major Features
SPCZ SACZ
ITCZ
Storm Tracks

Precipitation: Major Features
• Least precipitation in regions lacking moisture or featuring pronounced subsidence, and in colder regions
– Equatorial cold tongues– Deserts– Subtropical high pressure systems– High latitudes

Precipitation: January vs. July

Precipitation Animation

Outline
(1) Seasonal Cycle (Sea Surface Temperature and Precipitation) (2) El Niño - Southern Oscillation (ENSO): Historical Context
(3) Comparison between El Niño/ Low SO Phase VS. La Niña/ High SO Phase
(4) The ENSO Cycle: A Coupled Ocean- Atmosphere System
(5) Evolution of Previous ENSO Cycles
(6) ENSO Teleconnections and Global Impacts
(7) Upper-level Circulation Changes over the Pacific and North America
(8) Application to ENSO Monitoring and Prediction at NOAA Climate Prediction Center (CPC)

History of El Niño
• El Niño, as a oceanic phenomenon along the coasts of northern Peru and Ecuador, has been documented since the 1500s.
• Originally, the term El Niño was used to describe the annual appearance of warm waters around Christmastime.
• In some years the warm waters appeared earlier and lasted longer. Eventually, the term El Niño was used to describe these periods of anomalous warming.
• The stronger events disrupted local fish and bird populations
History of the Southern Oscillation
• Beginning in the late 1800s scientists began to describe large-scale pressure fluctuations.
• Sir Gilbert Walker and colleagues extended the early studies and established that a global-scale pressure fluctuation (the Southern Oscillation) is related to rainfall anomalies in many areas of the Tropics (e.g., India and South America.
• The SO was used as the basis for seasonal rainfall predictions (ca 1930s).

Discovery of the “El Niño- Southern Oscillation (ENSO)”
• El Niño and the Southern Oscillation were studied as separate phenomena until the 1950s-1960s.
• Important works by Berlage (1956) and J. Bjerknes (late 1960s) demonstrated a link between the two phenomena.
• Studies at that time also showed that the anomalous warming of the waters during El Niño extended over a large portion of the equatorial Pacific.

The ENSO Cycle
• Naturally occurring phenomenon
• Equatorial Pacific fluctuates between warmer-than-average (El Niño ) and colder-than-average (La Niña) conditions
• The changes in SSTs affect the distribution of tropical rainfall and atmospheric circulation features (Southern Oscillation)
• Changes in intensity and position of jet streams and storm activity occur at higher latitudes

Outline
(1) Seasonal Cycle (Sea Surface Temperature and Precipitation) (2) El Niño - Southern Oscillation (ENSO): Historical Context
(3) Comparison between El Niño/ Low SO Phase VS. La Niña/ High SO Phase
(4) The ENSO Cycle: A Coupled Ocean- Atmosphere System
(5) Evolution of Previous ENSO Cycles
(6) ENSO Teleconnections and Global Impacts
(7) Upper-level Circulation Changes over the Pacific and North America
(8) Application to ENSO Monitoring and Prediction at NOAA Climate Prediction Center (CPC)

El Niño/ Low Southern Oscillation Phase
VS.La Niña/ High Southern Oscillation Phase
Signals in Tropical Pacific:• Sea surface temperatures (SSTs)• Precipitation• Sea Level Pressure• The Southern Oscillation (High vs. Low Phases) • Low-level Winds and Thermocline Depth
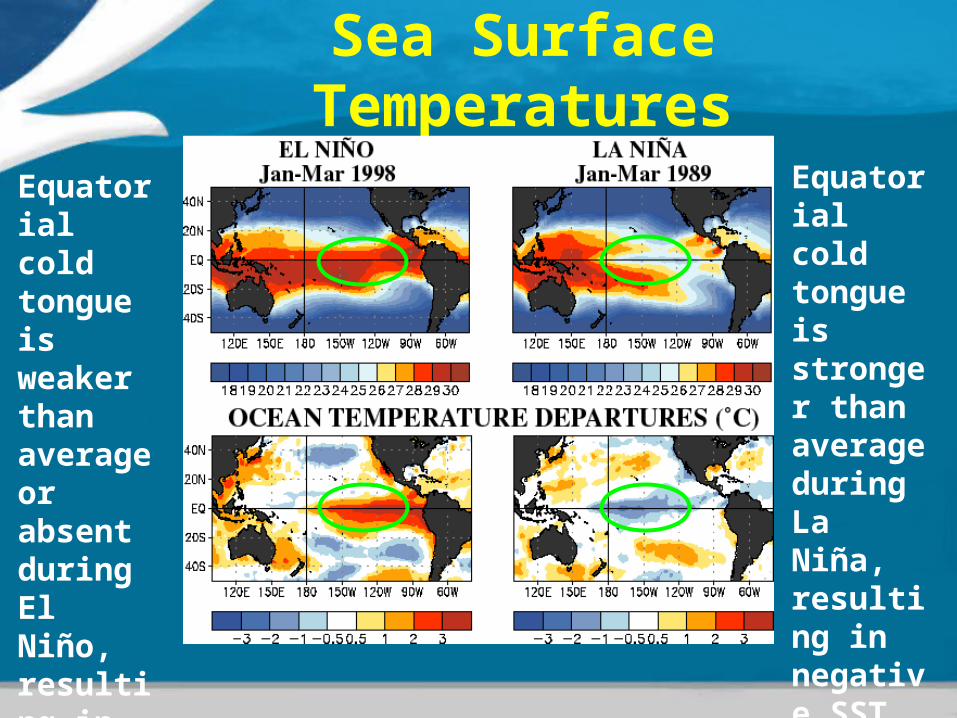
Sea Surface Temperatures
Equatorial cold tongue is weaker than average or absent during El Niño, resulting in positive SST anomalies
Equatorial cold tongue is stronger than average during La Niña, resulting in negative SST anomalies

PrecipitationEnhanced rainfall occurs over warmer-than-average waters during El Niño.
Reduced rainfall occurs over colder-than-average waters during La Niña.

Sea Level Pressure
El Niño: Positive SLP anomalies over the western tropical Pacific, Indonesia and Australia. Negative SLP anomalies over eastern tropical Pacific, middle and high latitudes of the North Pacific, and over U.S. Opposite pattern for La Niña. The pressure see-saw between the eastern and western tropical Pacific is known as the Southern Oscillation.
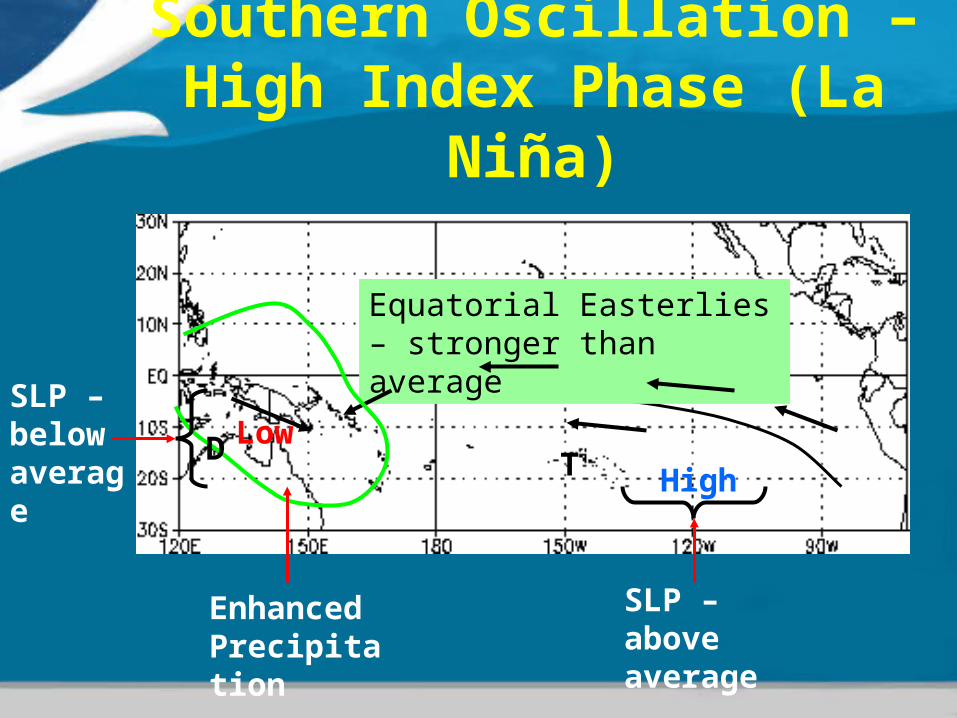
Southern Oscillation – High Index Phase (La Niña)
High
Equatorial Easterlies – stronger than average
Low
Enhanced Precipitation
SLP – above average
TD
SLP – below average
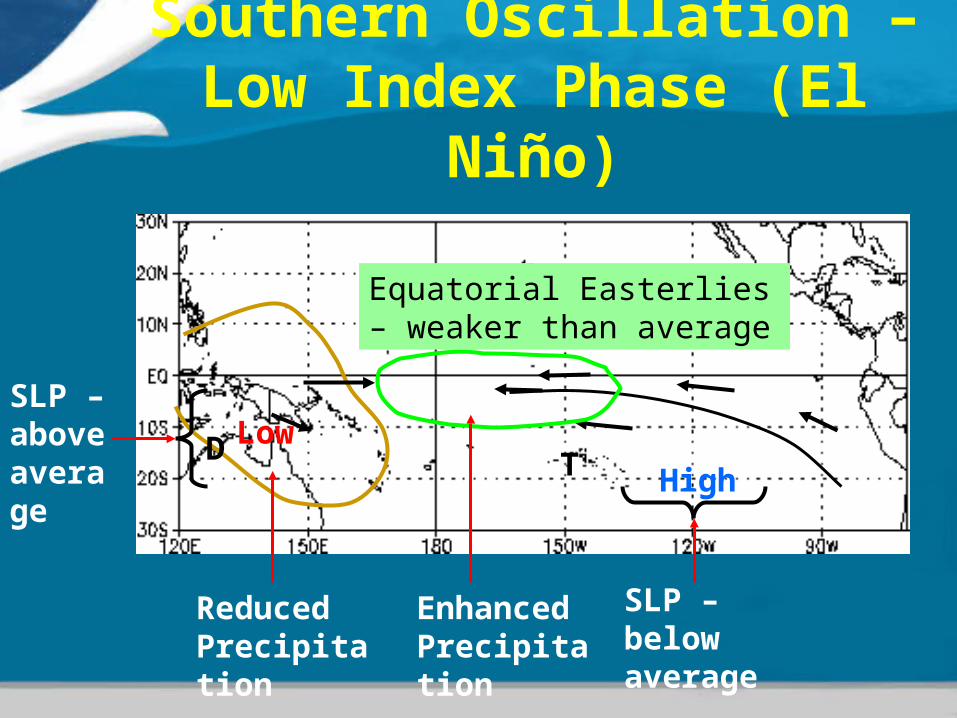
Southern Oscillation – Low Index Phase (El Niño)
High
Equatorial Easterlies – weaker than average
Low
Reduced Precipitation
SLP – below average
TD
SLP – above average
Enhanced Precipitation

Low-Level Winds & Thermocline Depth
La Niña: stronger-than-average easterlies lead to a deeper (shallower)-than-average thermocline in the western (eastern) eq. Pacific.
El Niño: weaker-than-average easterlies lead to a deeper (shallower)-than-average thermocline in the eastern (western) eq. Pacific.

Outline
(1) Seasonal Cycle (Sea Surface Temperature and Precipitation) (2) El Niño - Southern Oscillation (ENSO): Historical Context
(3) Comparison between El Niño/ Low SO Phase VS. La Niña/ High SO Phase
(4) The ENSO Cycle: A Coupled Ocean- Atmosphere System
(5) Evolution of Previous ENSO Cycles
(6) ENSO Teleconnections and Global Impacts
(7) Upper-level Circulation Changes over the Pacific and North America
(8) Application to ENSO Monitoring and Prediction at NOAA Climate Prediction Center (CPC)

ENSO: A Coupled Ocean-
Atmosphere Cycle
ENSO is a “coupled” phenomenon: atmosphere drives the ocean and the ocean drives the atmosphere.
“Positive Feedback” between ocean and atmosphere. Example:
Weaker equatorial trade winds cold water upwelling in the east will decrease surface warming of the ocean reduced east-west temperature gradient Weaker equatorial trade winds
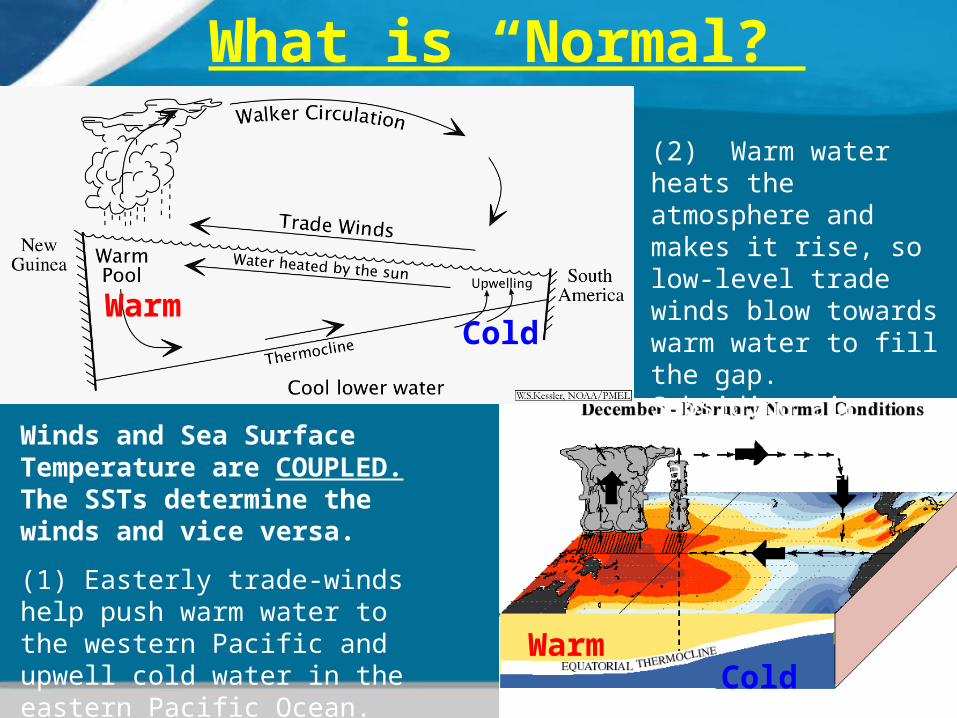
What is “Normal?”
WarmCold
WarmCold
Winds and Sea Surface Temperature are COUPLED. The SSTs determine the winds and vice versa.
(1) Easterly trade-winds help push warm water to the western Pacific and upwell cold water in the eastern Pacific Ocean.
(2) Warm water heats the atmosphere and makes it rise, so low-level trade winds blow towards warm water to fill the gap. Subsiding air occurs in the eastern basin.

“El Niño”
WarmCold
Warm
ColdWarm
• Convection shifts eastward over the central and/or eastern Pacific Ocean. Convection becomes suppressed over the far western Pacific/
Indonesia.
• Easterly trade winds weaken
• Thermocline deepens and the cold water upwelling decreases in
the eastern Pacific.
NOTE: Location of the warmest SSTs (>28°C)
determines where tropical convection will
be located.
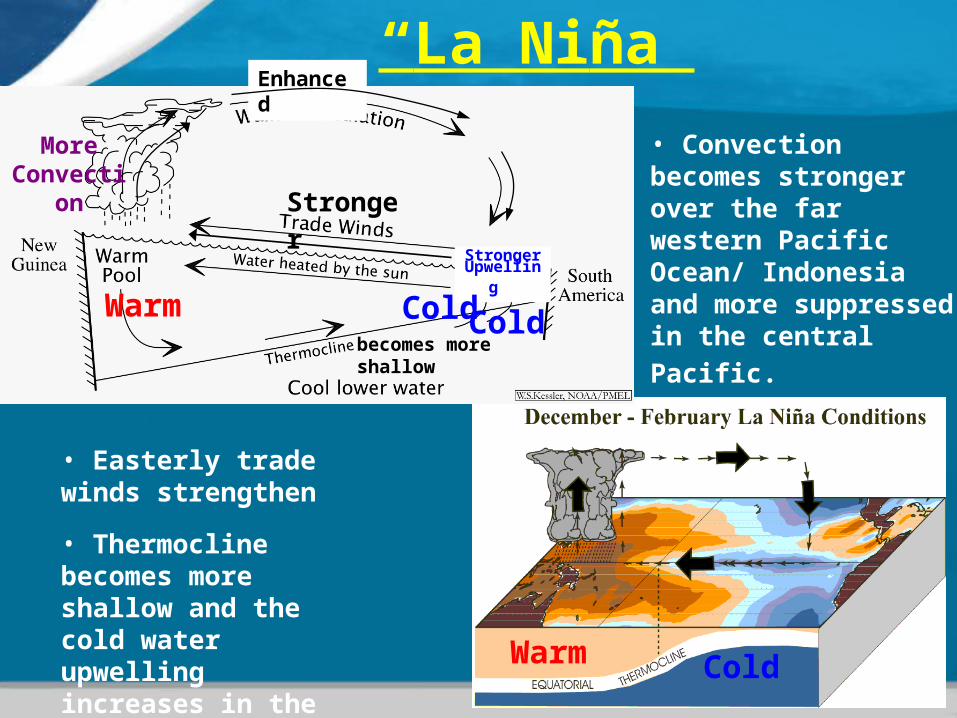
“La Niña”
ColdWarm
Warm Cold
Stronger Stronger
Upwelling
Enhanced
More Convection
becomes more shallow
• Convection becomes stronger over the far western Pacific Ocean/ Indonesia and more suppressed in the central
Pacific.
• Easterly trade winds strengthen
• Thermocline becomes more shallow and the cold water upwelling increases in the eastern
Pacific.
Cold
Outline
(1) Seasonal Cycle (Sea Surface Temperature and Precipitation) (2) El Niño - Southern Oscillation (ENSO): Historical Context
(3) Comparison between El Niño/ Low SO Phase VS. La Niña/ High SO Phase
(4) The ENSO Cycle: A Coupled Ocean- Atmosphere System
(5) Evolution of Previous ENSO Cycles
(6) ENSO Teleconnections and Global Impacts
(7) Upper-level Circulation Changes over the Pacific and North America
(8) Application to ENSO Monitoring and Prediction at NOAA Climate Prediction Center (CPC)
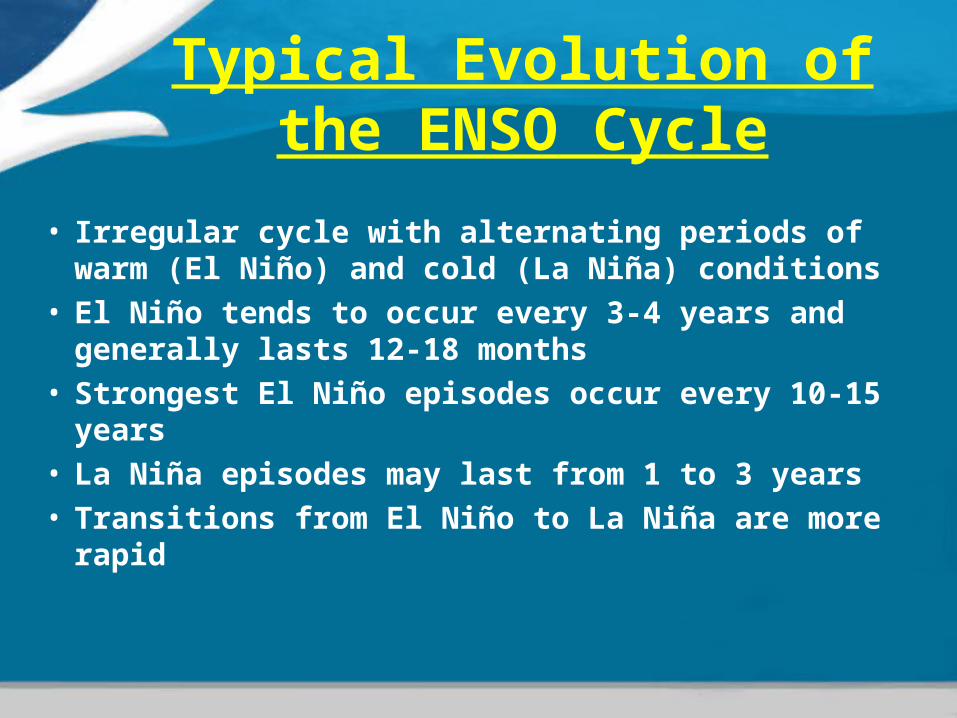
Typical Evolution of the ENSO Cycle
• Irregular cycle with alternating periods of warm (El Niño) and cold (La Niña) conditions
• El Niño tends to occur every 3-4 years and generally lasts 12-18 months
• Strongest El Niño episodes occur every 10-15 years• La Niña episodes may last from 1 to 3 years• Transitions from El Niño to La Niña are more rapid

The Evolution of Equatorial SST Anomalies: 1982-1990
1982-83 El Niño
1986-87 El Niño
1988-89 La Niña
1984-85 La Niña

Evolution of the ENSO Cycle: 1982-1990
El Niño: Positive SST anomalies, enhanced precip, weaker than average easterly winds
La Niña: Negative SST anomalies, reduced precip, stronger than average easterly winds
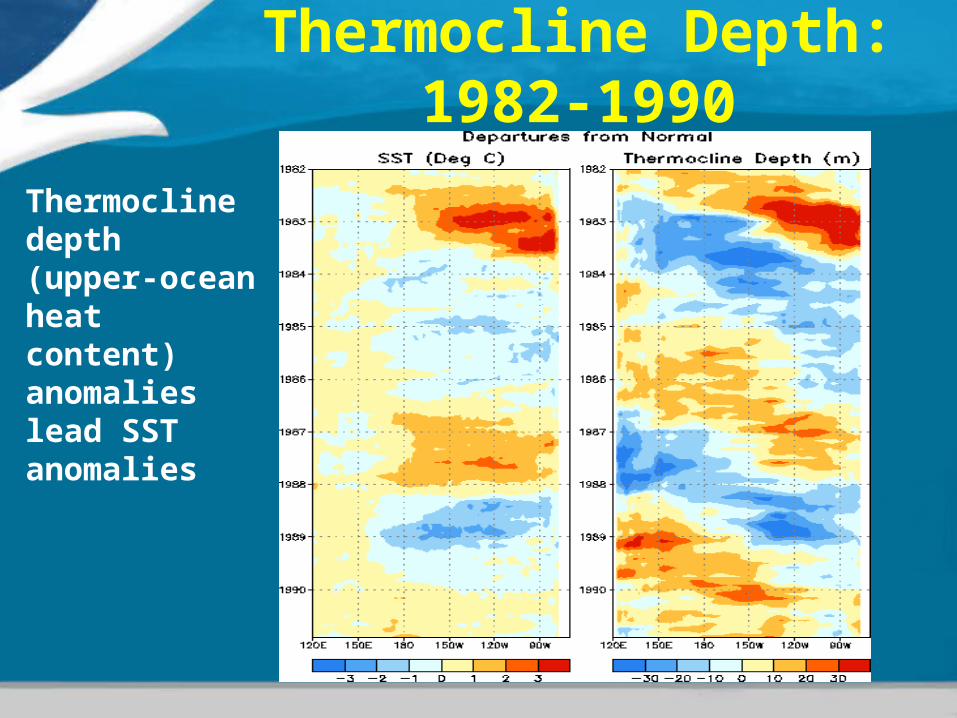
Thermocline Depth: 1982-1990
Thermocline depth (upper-ocean heat content) anomalies lead SST anomalies

Animation of Subsurface Temperatures: 1996-1999

SST Animation: 1997-1998

Outline
(1) Seasonal Cycle (Sea Surface Temperature and Precipitation) (2) El Niño - Southern Oscillation (ENSO): Historical Context
(3) Comparison between El Niño/ Low SO Phase VS. La Niña/ High SO Phase
(4) The ENSO Cycle: A Coupled Ocean- Atmosphere System
(5) Evolution of Previous ENSO Cycles
(6) ENSO Teleconnections and Global Impacts
(7) Upper-level Circulation Changes over the Pacific and North America
(8) Application to ENSO Monitoring and Prediction at NOAA Climate Prediction Center (CPC)
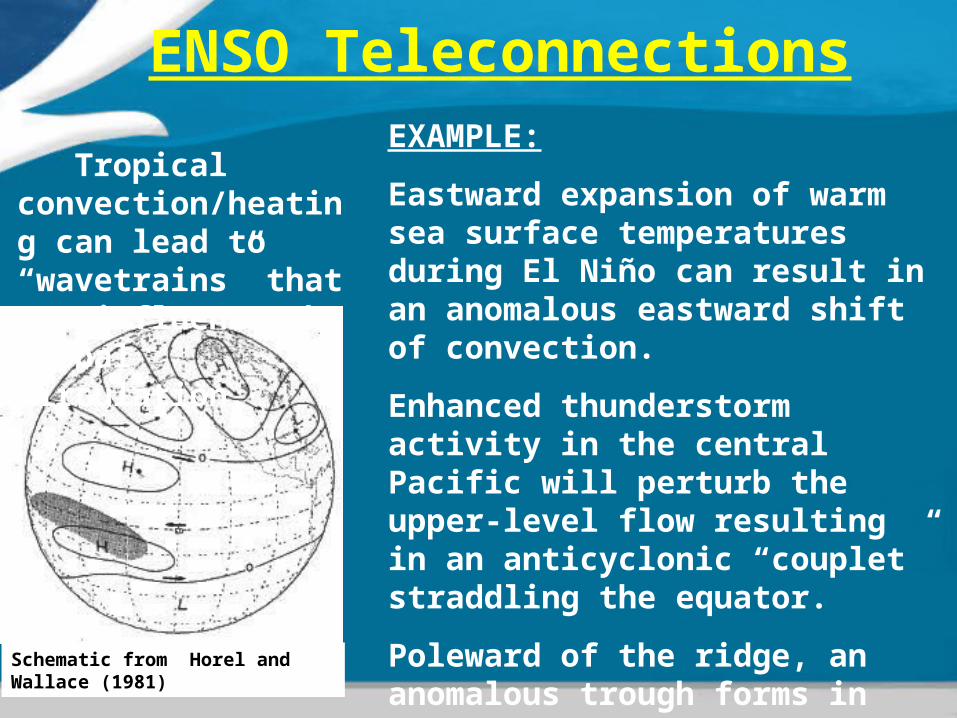
ENSO Teleconnections
Schematic from Horel and Wallace (1981)
EXAMPLE:
Eastward expansion of warm sea surface temperatures during El Niño can result in an anomalous eastward shift of convection.
Enhanced thunderstorm activity in the central Pacific will perturb the upper-level flow resulting in an anticyclonic “couplet” straddling the equator.
Poleward of the ridge, an anomalous trough forms in the central North Pacific Ocean.
Tropical convection/heating can lead to “wavetrains” that can influence the global circulation.
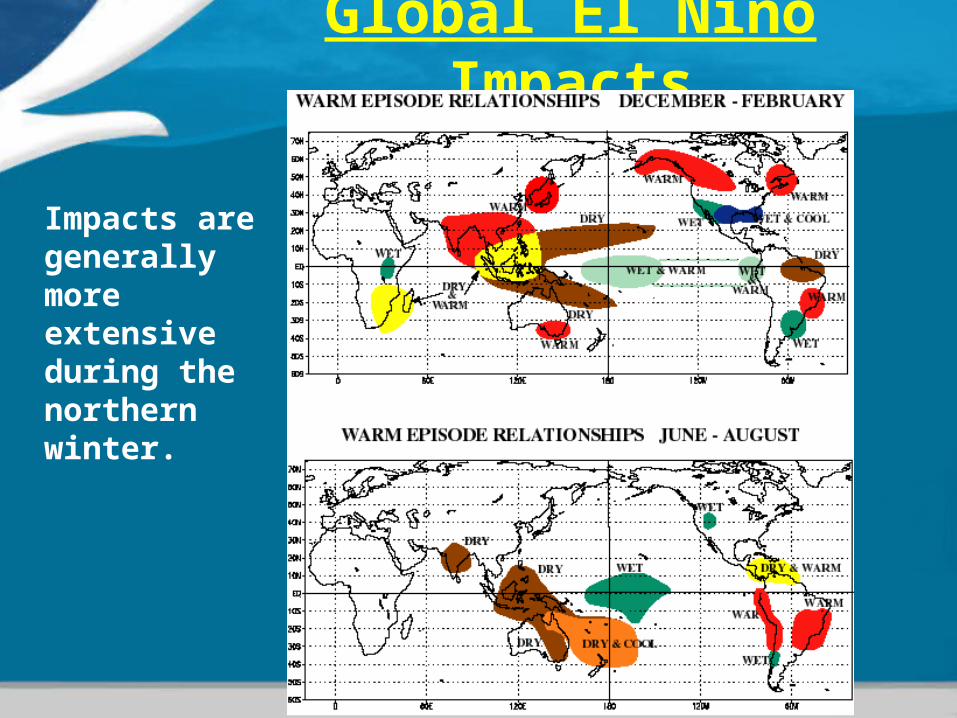
Global El Niño Impacts
Impacts are generally more extensive during the northern winter.
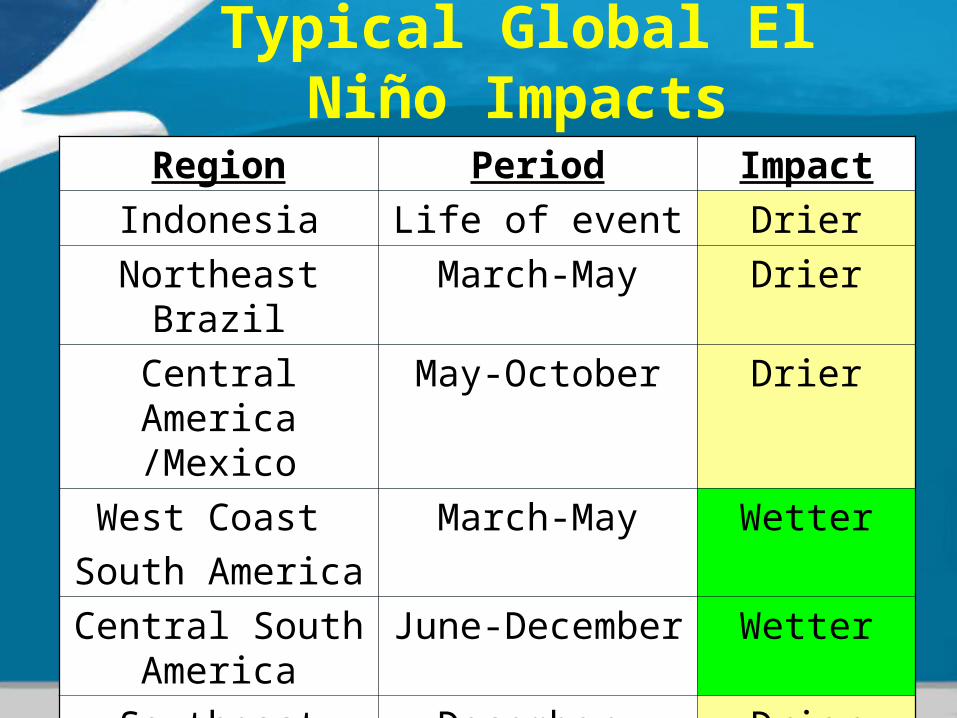
Typical Global El Niño Impacts
Region Period Impact
Indonesia Life of event Drier
Northeast Brazil March-May Drier
Central America /Mexico
May-October Drier
West Coast
South America
March-May Wetter
Central South America
June-December Wetter
Southeast Africa December-February Drier
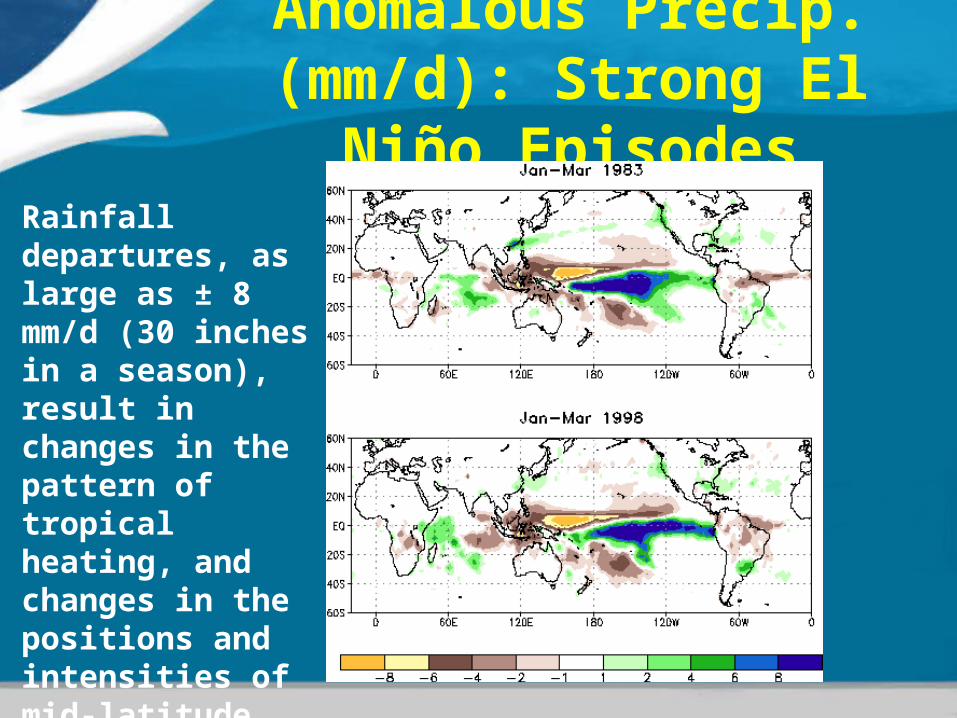
Anomalous Precip. (mm/d):
Strong El Niño Episodes
Rainfall departures, as large as ± 8 mm/d (30 inches in a season), result in changes in the pattern of tropical heating, and changes in the positions and intensities of mid-latitude jet streams and planetary waves.

Anomalous Precip. (mm/d): Moderate El Niño Episodes
Rainfall departures are less during weak/ moderate warm episodes. Smaller changes occur in the pattern of tropical heating, and in the mid-latitude jet streams and planetary waves.
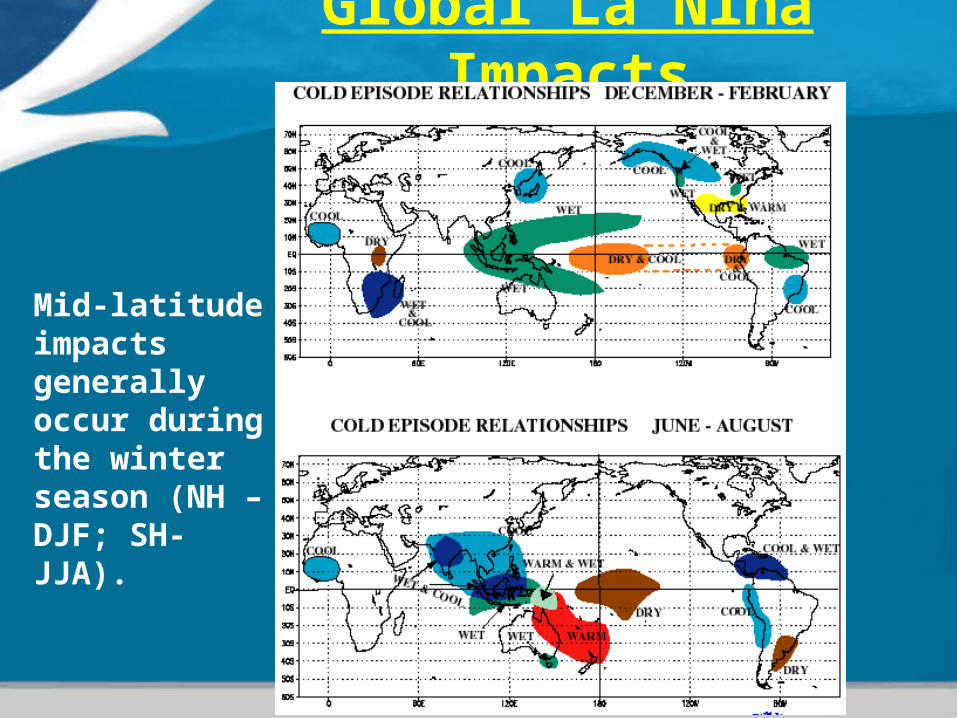
Global La Niña Impacts
Mid-latitude impacts generally occur during the winter season (NH – DJF; SH- JJA).
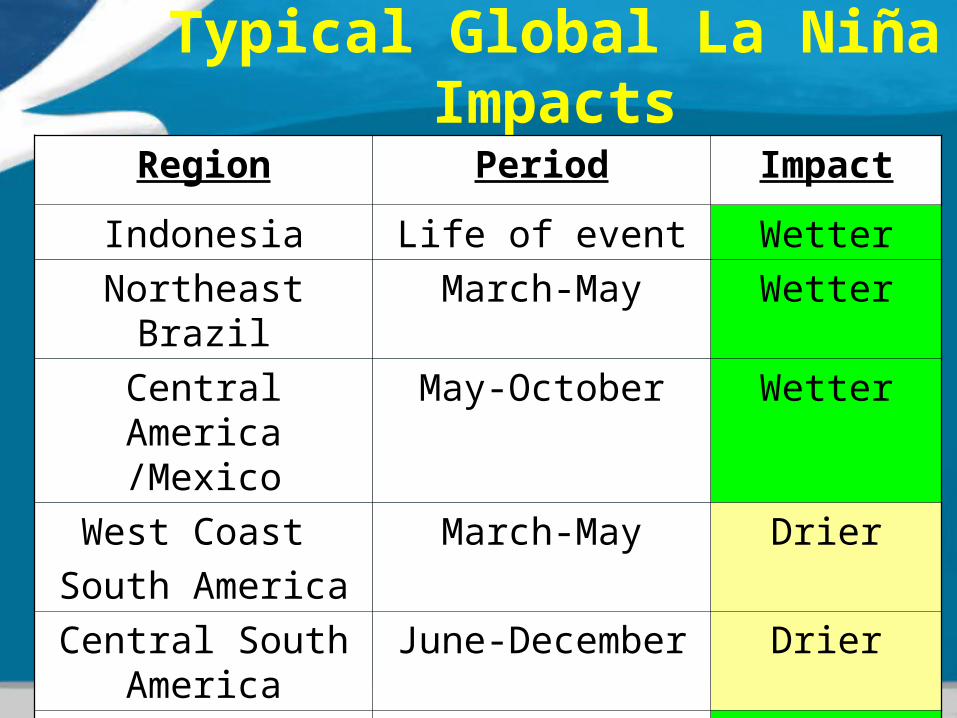
Typical Global La Niña Impacts
Region Period Impact
Indonesia Life of event Wetter
Northeast Brazil March-May Wetter
Central America /Mexico
May-October Wetter
West Coast
South America
March-May Drier
Central South America
June-December Drier
Southeast Africa December-February Wetter
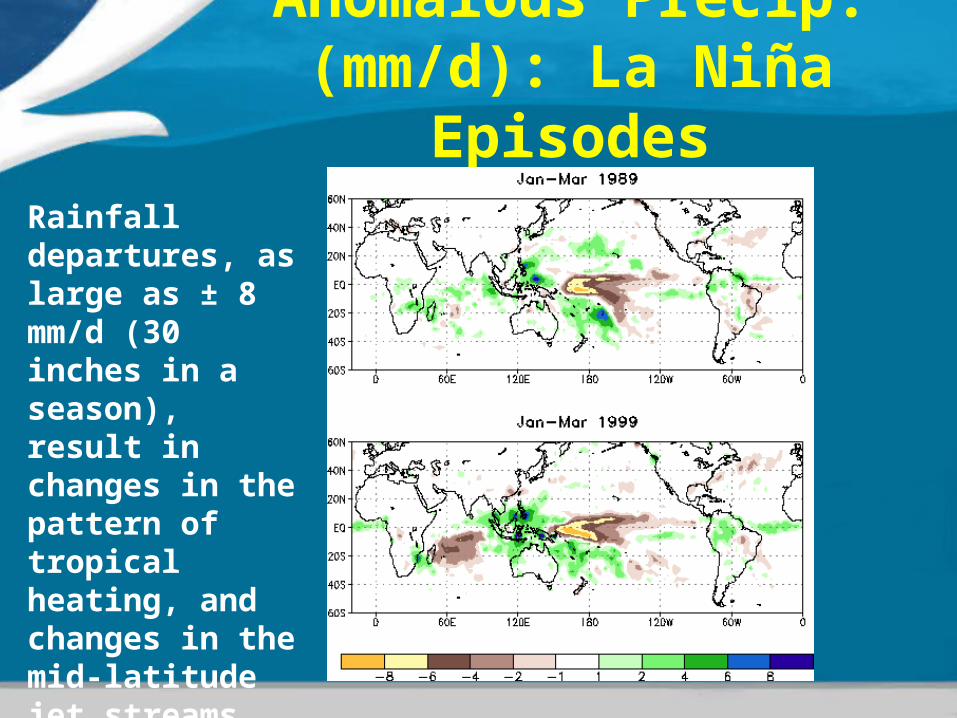
Anomalous Precip. (mm/d): La Niña Episodes
Rainfall departures, as large as ± 8 mm/d (30 inches in a season), result in changes in the pattern of tropical heating, and changes in the mid-latitude jet streams and planetary waves.

Outline
(1) Seasonal Cycle (Sea Surface Temperature and Precipitation) (2) El Niño - Southern Oscillation (ENSO): Historical Context
(3) Comparison between El Niño/ Low SO Phase VS. La Niña/ High SO Phase
(4) The ENSO Cycle: A Coupled Ocean- Atmosphere System
(5) Evolution of Previous ENSO Cycles
(6) ENSO Teleconnections and Global Impacts
(7) Upper-level Circulation Changes over the Pacific and North America
(8) Application to ENSO Monitoring and Prediction at NOAA Climate Prediction Center (CPC)
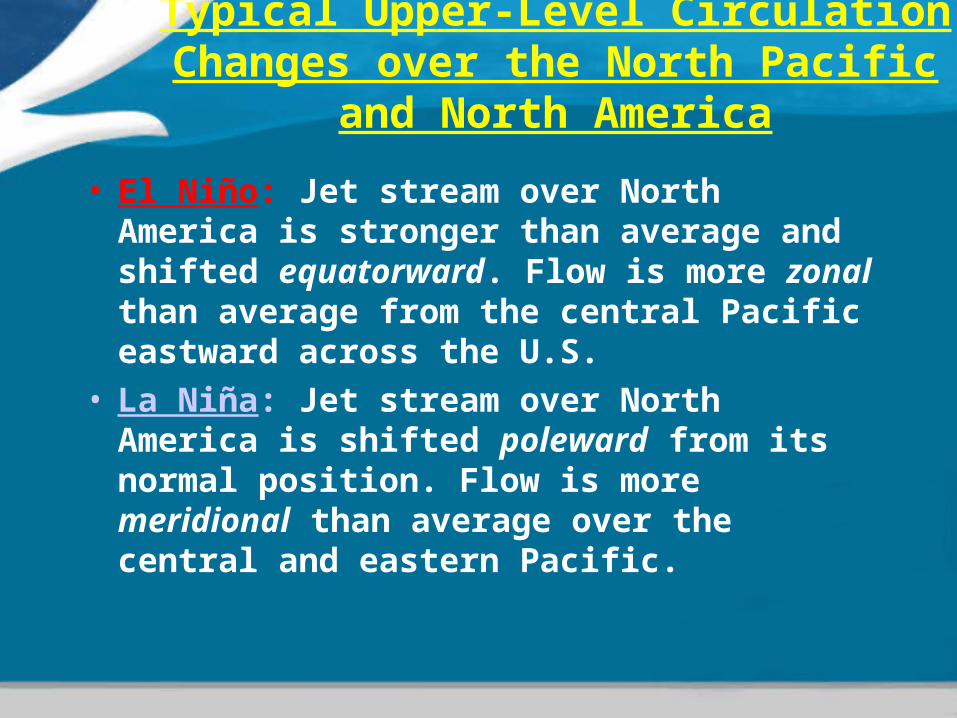
Typical Upper-Level Circulation Changes over the North Pacific and North America
• El Niño: Jet stream over North America is stronger than average and shifted equatorward. Flow is more zonal than average from the central Pacific eastward across the U.S.
• La Niña: Jet stream over North America is shifted poleward from its normal position. Flow is more meridional than average over the central and eastern Pacific.

Upper-level Winds: El Niño

Upper-level Winds: La Niña

Upper Level Winds El Niño Episodes

Upper Level WindsLa Niña Episodes

North American jet stream
La Niña
El Niño
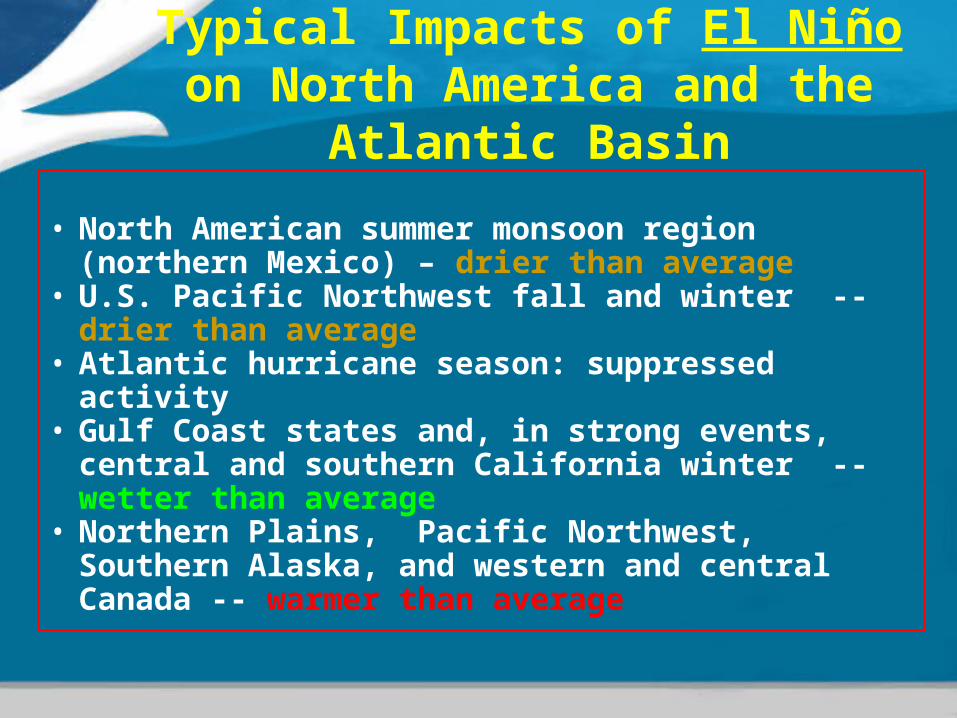
• North American summer monsoon region (northern Mexico) – drier than average
• U.S. Pacific Northwest fall and winter -- drier than average
• Atlantic hurricane season: suppressed activity• Gulf Coast states and, in strong events, central and
southern California winter -- wetter than average• Northern Plains, Pacific Northwest, Southern
Alaska, and western and central Canada -- warmer than average
Typical Impacts of El Niño on North America and the Atlantic Basin
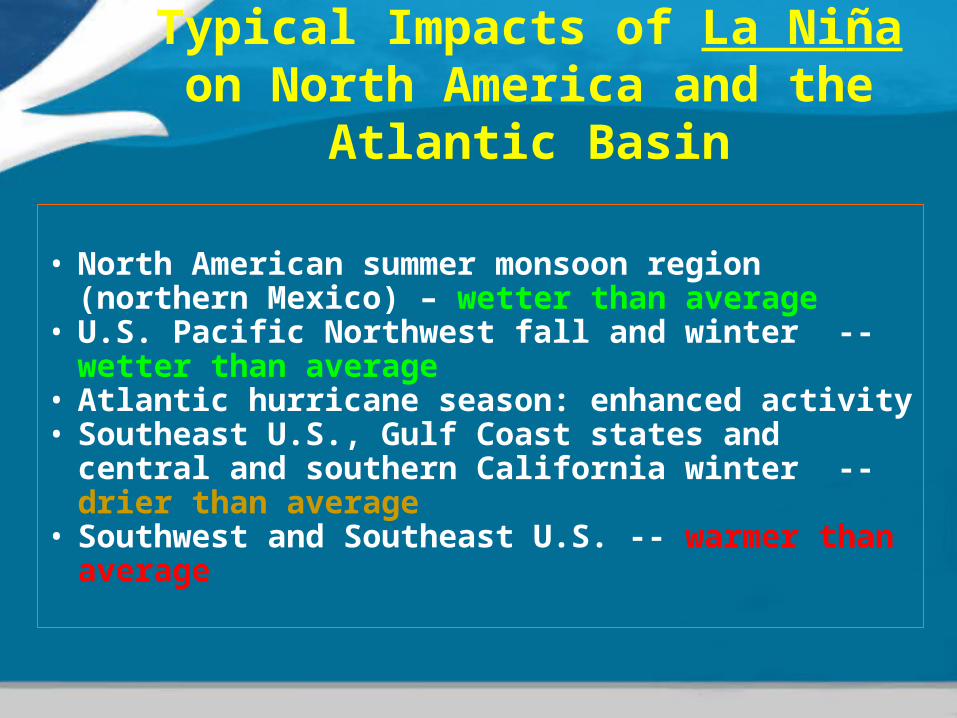
Typical Impacts of La Niña on North America and the Atlantic Basin
• North American summer monsoon region (northern Mexico) – wetter than average
• U.S. Pacific Northwest fall and winter -- wetter than average
• Atlantic hurricane season: enhanced activity• Southeast U.S., Gulf Coast states and central and
southern California winter -- drier than average• Southwest and Southeast U.S. -- warmer than
average

Outline
(1) Seasonal Cycle (Sea Surface Temperature and Precipitation) (2) El Niño - Southern Oscillation (ENSO): Historical Context
(3) Comparison between El Niño/ Low SO Phase VS. La Niña/ High SO Phase
(4) The ENSO Cycle: A Coupled Ocean- Atmosphere System
(5) Evolution of Previous ENSO Cycles
(6) ENSO Teleconnections and Global Impacts
(7) Upper-level Circulation Changes over the Pacific and North America
(8) Application to ENSO Monitoring and Prediction at NOAA Climate Prediction Center (CPC)
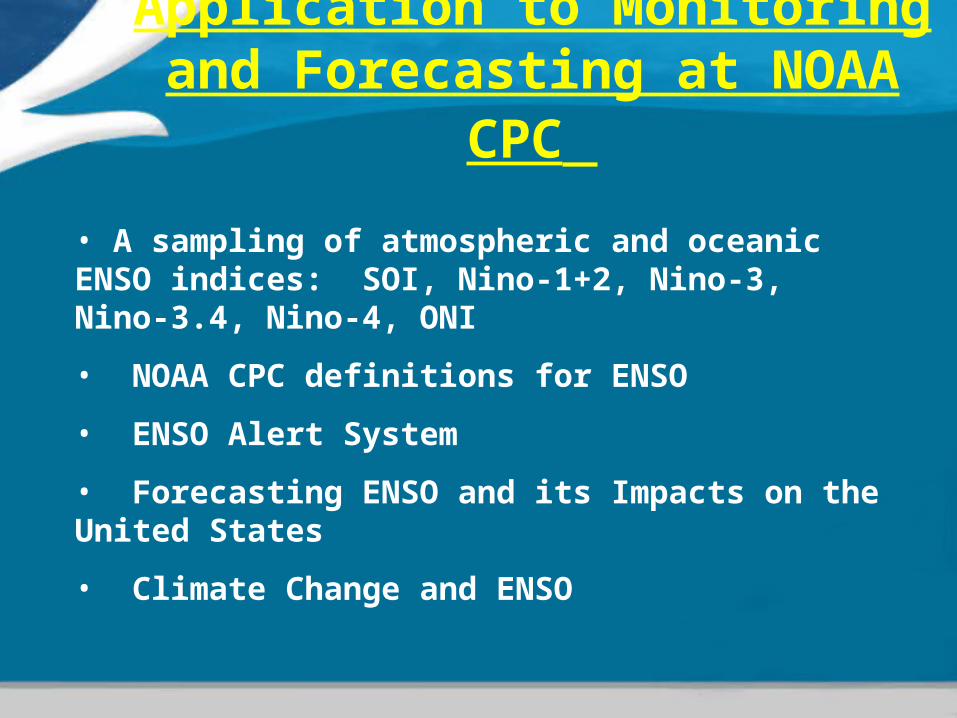
Application to Monitoring and
Forecasting at NOAA CPC
• A sampling of atmospheric and oceanic ENSO indices: SOI, Nino-1+2, Nino-3, Nino-3.4, Nino-4, ONI
• NOAA CPC definitions for ENSO
• ENSO Alert System
• Forecasting ENSO and its Impacts on the United States
• Climate Change and ENSO
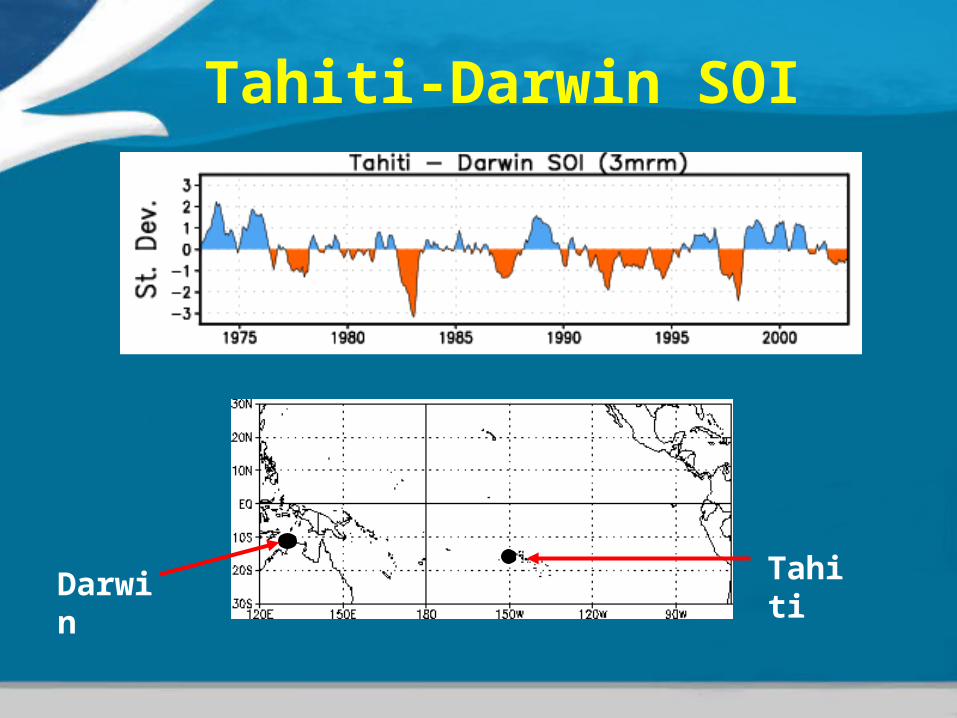
Tahiti-Darwin SOI
Darwin Tahiti

Niño Regions
Largest positive anomalies occur in the eastern equatorial Pacific (Niño 1+2 and 3 regions).
Negative anomalies have roughly the same magnitude in all regions.

NOAA Operational ENSO Definition
• The Oceanic Niño Index (“ONI”) is based on SST departures from average in the Niño 3.4 region, and is a principal measure for monitoring, assessing, and predicting ENSO.
• ONI is defined as the 3-month running-mean SST departures in the Niño-3.4 region. Departures are based on a set of improved homogeneous historical SST analyses (Extended Reconstructed SST – ERSST.v3b).
El Niño: characterized by a positive ONI greater than or equal to +0.5°C.
La Niña: characterized by a negative ONI less than or equal to −0.5°C.
To be classified as a full-fledged El Niño or La Niña “episode” these thresholds must be exceeded for a period of at least 5 consecutive overlapping 3-month seasons.
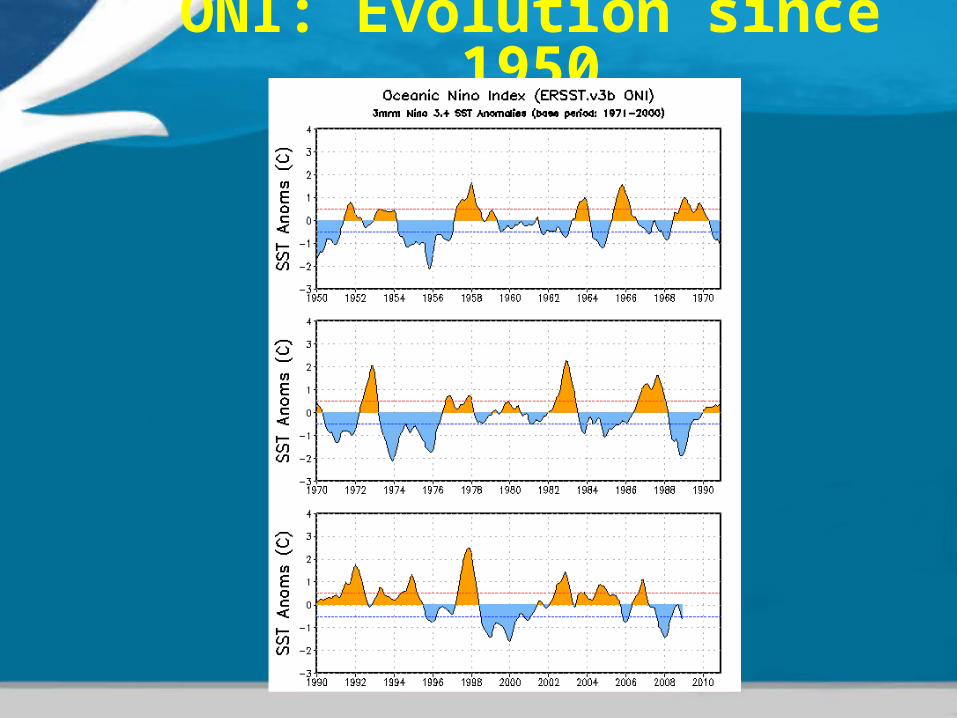
ONI: Evolution since 1950

CPC Working Definition for ENSO
• The Oceanic Niño Index (ONI) is used to put current events in historical context. Because it is calculated as a 3-month running mean SST departure it is a “lagging” index, which works better in a retrospective fashion.
• For real-time use, CPC uses “conditions:”
El Niño conditions: one-month positive SST anomaly of +0.5 or greater in the Niño-3.4 region and an expectation that the 3-mth ONI threshold will be met.
La Niña conditions: one-month negative SST anomaly of −0.5 or less in the Niño-3.4 region and an expectation that the 3-mth ONI threshold will be met.
AND
An atmospheric response typically associated with El Niño/ La Niña over the equatorial Pacific Ocean.
The ENSO Alert System is based on El Niño and La Niña “conditions” that allows CPC to be able to issue watches/advisories in real-time.
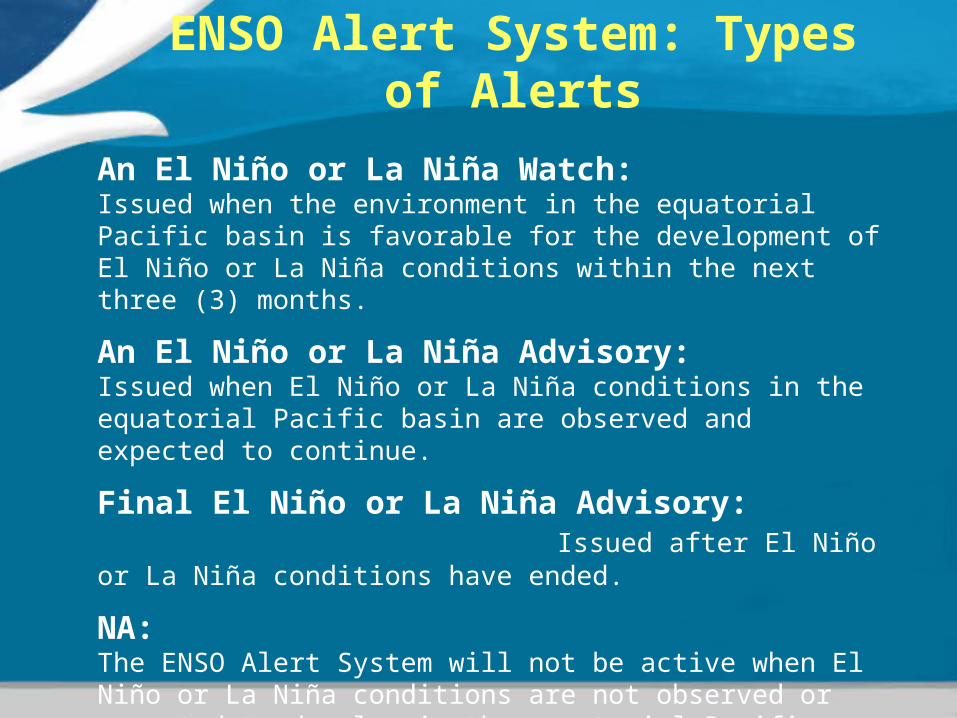
ENSO Alert System: Types of Alerts
An El Niño or La Niña Watch: Issued when the environment in the equatorial Pacific basin is favorable for the development of El Niño or La Niña conditions within the next three (3) months.
An El Niño or La Niña Advisory: Issued when El Niño or La Niña conditions in the equatorial Pacific basin are observed and expected to continue.
Final El Niño or La Niña Advisory: Issued after El Niño or La Niña conditions have ended.
NA: The ENSO Alert System will not be active when El Niño or La Niña conditions are not observed or expected to develop in the equatorial Pacific basin.

What triggers an ENSO Watch or Advisory?
• The ENSO Alert System is based on El Niño and La Niña “conditions” that allows CPC to be able to issue watches/advisories in real-time.
• “Conditions” requires a 1-month SST value and corresponding atmospheric response, along with the expectation that the 3-month threshold (ONI) will be met.
• NOAA’s official Oceanic Niño Index (ONI) is not used to trigger a Watch or Advisory because it is calculated as a 3-month running mean SST departure. It is a “lagging” index, which puts ENSO events in a historical context.
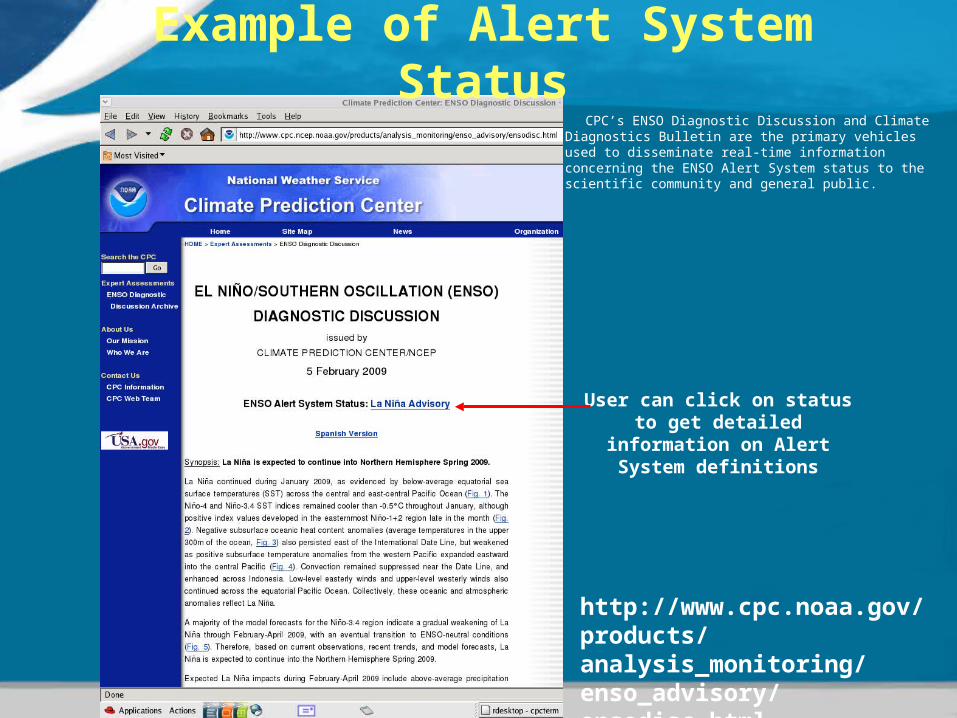
Example of Alert System Status CPC’s ENSO Diagnostic Discussion and Climate
Diagnostics Bulletin are the primary vehicles used to disseminate real-time information concerning the ENSO Alert System status to the scientific community and general public.
User can click on status to get detailed information on Alert System
definitions
http://www.cpc.noaa.gov/products/analysis_monitoring/enso_advisory/ensodisc.html

Forecasting ENSO ENSO Forecasters rely on:
(1) Real-time data from the equatorial Pacific Ocean (collected from buoys, satellites, etc) and their knowledge of previous ENSO episodes
(2) Dynamical models: mathematical equations combined with current observations and run on a computer
- NCEP Climate Forecast System (CFS): a “coupled” computer model (ocean and atmosphere interact)
(3) Statistical models: use observations of the past to make predictions of the future
- Consolidated Forecast Tool (“CON”): statistically combines different models to take advantage of independent information provided by each model
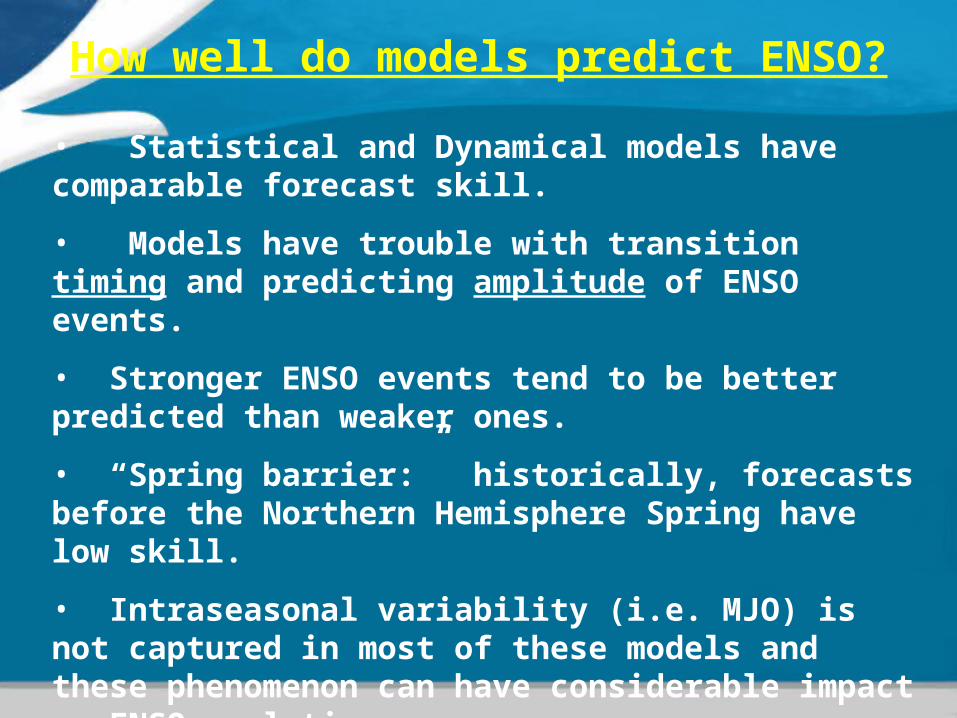
How well do models predict ENSO?
• Statistical and Dynamical models have comparable forecast skill.
• Models have trouble with transition timing and predicting amplitude of ENSO events.
• Stronger ENSO events tend to be better predicted than weaker ones.
• “Spring barrier:” historically, forecasts before the Northern Hemisphere Spring have low skill.
• Intraseasonal variability (i.e. MJO) is not captured in most of these models and these phenomenon can have considerable impact on ENSO evolution.
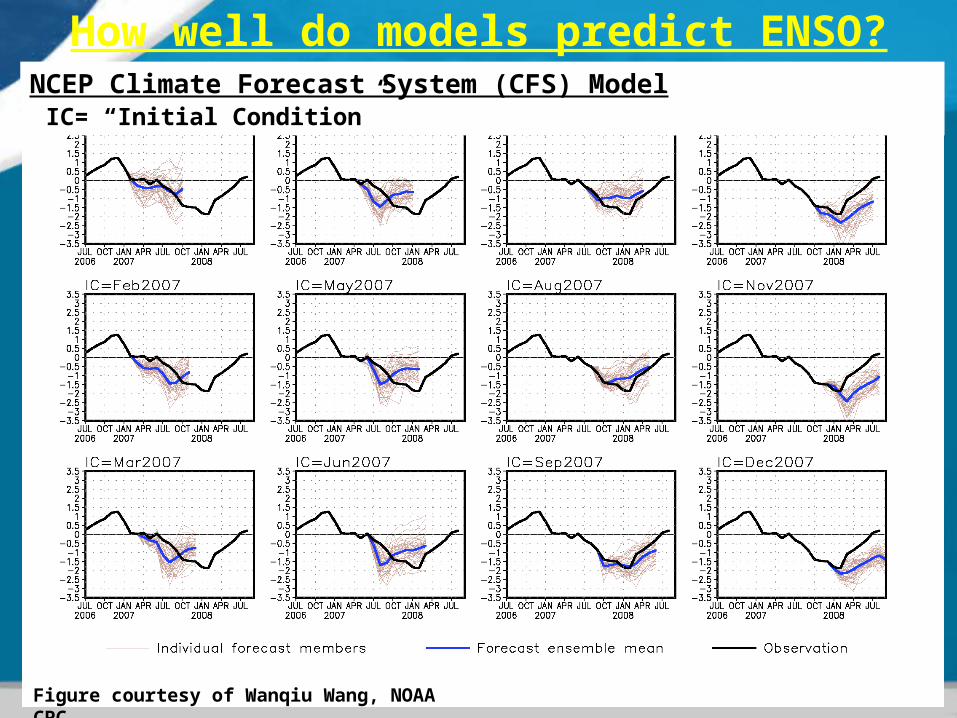
How well do models predict ENSO?
Figure courtesy of Wanqiu Wang, NOAA CPC
NCEP Climate Forecast System (CFS) Model IC= “Initial Condition”
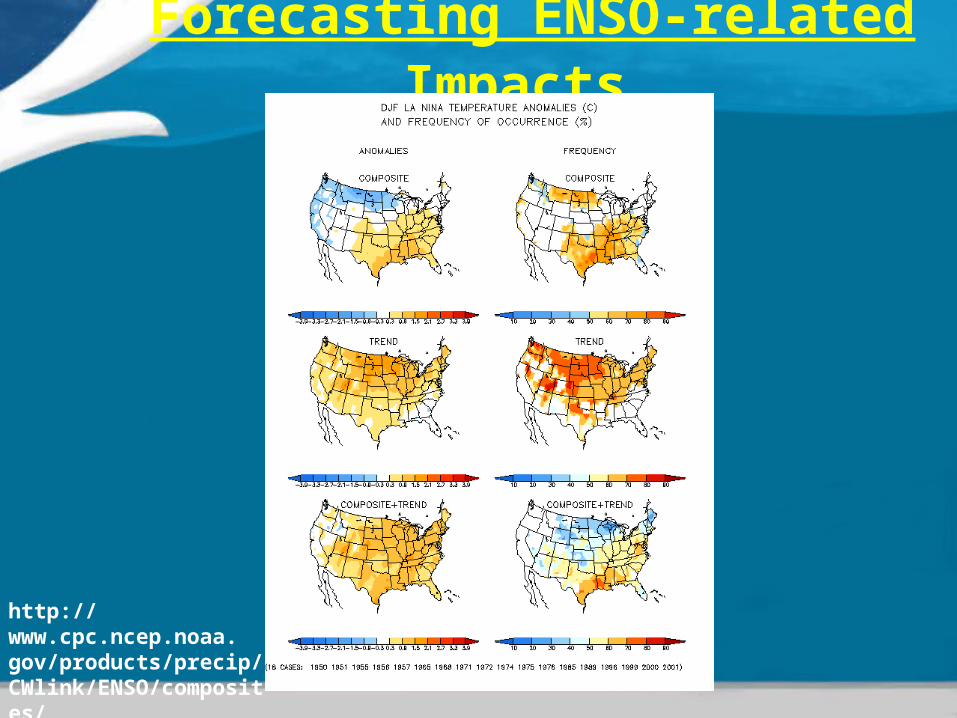
Forecasting ENSO-related Impacts
http://www.cpc.ncep.noaa. gov/products/precip/ CWlink/ENSO/composites/

Forecasting ENSO-related Impacts
http://www.cpc.ncep.noaa. gov/products/precip/ CWlink/ENSO/composites/

Climate Change and ENSO
• IPCC-AR4: “No consistent indication at this time of discernible changes in projected ENSO amplitude or frequency in the 21st century.”
- ENSO projections differ from model to model
- Continued ENSO variability in the future even with changes to the background state
Fig. 10.16 from Chapter 10- IPCC AR4

Summary
• ENSO is a naturally occurring phenomenon• Equatorial Pacific fluctuates between warmer-than-average (El
Niño ) and colder-than-average (La Niña) conditions• The changes in SSTs affect the distribution of tropical rainfall
and atmospheric circulation features (Southern Oscillation)• Changes in intensity and position of jet streams and storm
activity occur at higher latitudes