the electoral origins of the fiscal...
TRANSCRIPT

The Electoral Origins of the Fiscal State
Pablo Beramendi∗ and Didac Queralt†
October 9, 2015
Abstract
This paper develops an argument to explain the origins of the fiscal state in Europe.We theorize the rise of the modern fiscal state as a byproduct of time-inconsistent elec-toral calculations by incumbent elites with distinctive ideological constituencies. Byfocusing on the strategic interaction over time between electorally motivated politicalparties, our analysis links directly decisions to expand the franchise, decisions aboutspending, and decisions about the level and composition of revenues in a process inwhich elites prioritize their short-term political positions. Organizationally weak par-ties make incumbent politicians to engage in institutional and policy reforms largelydisregarding the long-term implications of their short-run strategic moves. This analy-sis generates novel predictions about the partisan determinants of both the extensionsof franchise and the development of fiscal policy. To asses these predictions, we makeuse of a new dataset of parliamentary plurality by party families in 10 European democ-racies between 1820 and 1975.
∗Duke University; [email protected]
†Institute of Political Economy and Governance, Barcelona; [email protected]
1

Introduction
“Little else is requisite to carry a state to the highest degree of opulence from the
lowest barbarism but peace, easy taxes, and a tolerable administration of justice:
all the rest being brought about by the natural course of things” (Adam Smith,
1755)1
Since Adam Smith’s famous diagnosis, much has changed in our understanding of the
determinants of human development. Beyond the natural order of things, a wealth of the-
oretical and empirical research links directly effective states and prosperous societies. The
modern fiscal state, that is an institutionalized organization capable of collecting and reallo-
cating revenues according to democratically adopted legal provisions, plays an essential role
as a pillar of prosperity. Besley and Persson 2011 influential analysis shows how high levels
of legal and fiscal capacity are essential conditions for the development of markets and the
stability of societies. Regardless of the specific indicator of development at use (from GDP
per capita to infant mortality rate or the human development index), polities with large,
effective, and democratic fiscal states fare better.2
Political economy has devoted relatively more effort to understand the social and eco-
nomic consequences of variation in fiscal capacity than to explain the origins of this highly
consequential institutional form. In this paper we contribute to a small (but growing) body
of work revisiting the cradle of modern prosperity, that is the process by which the modern
fiscal state came to exist as we know it today. To this end we focus on the part of the world
1Source: Dugald Stewart, in his “Account of the Life and Writings of Adam Smith”,
read to the Royal Society of Edinburgh in 1793 and published in Adam Smith’s posthumous
Essays on Philosophical Subjects, 1795, p. xviii
2For evidence that higher levels of democracy lead to higher tax yields, Acemoglu et al.
2013, and better economic and welfare outcomes, Harding and Stasavage 2014, and Lake
and Baum 2001.
2

and period of time, Europe 1820-1975, that dominated this process and for which we have
minimally reliable information.
Our argument sees the rise of the modern fiscal state as a byproduct of time-inconsistent
electoral calculations by incumbent elites with distinctive ideological constituencies. Our
analysis links directly decisions to expand the franchise, decisions about spending, and deci-
sions about the level and composition of revenues in a process in which elites move to secure
their political position miscalculating the long-term implications of their short-run strategic
moves. The inability of incumbents to anticipate long-term politico-economic consequences
derives from the combination of short-term electoral aspirations and the organizational weak-
ness of early political machines that cannot credibly enter into long-term commitments and,
as a result, nurture very high discount ratios amongst party leaders. We formalize this logic
with a simple but illuminating game theoretical model, in which political myopia induced by
the organizationally weakness of early political parties is captured by high discount factors
when establishing their electoral strategies. This simple heuristic device captures the tension
between the short- vs- long-term goals across different generations within the same political
machines.
Before WWI proto-democratic politics is driven by the competition between Liberals and
Conservatives. In their quest for political dominance against agrarian elites, we claim, Lib-
erals extend franchise and expand the fiscal state minimally to secure political dominance
among the new economic elite. They do so marginally and regressively. This move is all
the more prevalent the higher the share of enfranchised population. Interestingly, as WWI
precipitated the expansion of franchise, contrary to the earlier period, Liberals oppose fur-
ther extensions of franchise whereas Conservatives support it, following a very similar logic
than that of Liberals before the War. Through their resort to the same electorally motivated
extension of franchise as the Liberals before WWI, the Conservatives (unintentionally) help
pave the way for the political mobilization of the working classes by left parties under condi-
tions of full franchise and its impact on the levels of tax collection and social spending. By
3

tracing this long-term process and its determinants, we argue and show that political myopia
fosters fiscal investments and fiscal capacity. Given the long run observable implications of
their early choices, fully rational Liberals and Conservatives should have resisted extensions
of franchise consistently, and forged an alliance in support of a limited parliamentary democ-
racy. Instead, they strategically pursued franchise extensions that ultimately generated a
suboptimal outcome for them.
Our paper speaks to several recent debates on the role of international versus domestic
origins of the fiscal state,3 on the implications of enfranchisement for the politics of fiscal
policy,4 and on the relationship between democratization, fiscal capacity, and fiscal expan-
sion.5 The rest of the paper is organized as follows. First, we map out the origins of the
fiscal state and motivate our puzzle in relation to these three literatures. Second, we present
our theoretical argument and derive the core empirical implications. Section III reports
the empirical analyses. Section IV concludes by pointing the broader implications of our
findings.
The Rise of the Fiscal State: Puzzles
The birth of the modern fiscal state took place primarily in Europe between the aftermath
of the Liberal Revolutions and the post WWII period. By way of motivation, Figure 1
displays the evolution over time of the overall size of the fiscal budget relative to the economy
3Dincecco 2011; Queralt 2015; Scheve and Stasavage 2010.
4Aidt, Dutta and Loukoianova 2006; Aidt and Jensen 2013; Husted and Kenny 1997; Kim
2007.
5Acemoglu and Robinson 2006; Ansell and Samuels 2014; Lizzeri and Persico 2004; Mares
and Queralt 2015.
4

(tax revenue as % of GDP) as far as 1822.6 In addition, Figure 1 also displays the size of
social expenditures relative to the overall economy (social spending as % of GDP). The
former indicator captures directly the size of the emerging fiscal state, whereas the latter
provides some information about its composition. Clearly, the expansion of the fiscal state
in Europe reflects two distinctive moments, separated by the discontinuity implied by the
Great War. Before 1914 we see steady increases from very low levels. After WWI, a clear
break marks a significant increase in both total taxation and the rise of social expenditures.
This is true regardless of whether the country actually took part in the conflict (e.g. UK,
France, Germany) or not (e.g. Sweden, Norway).
Figure 1
Indeed, the obvious importance of WWI as a breaking point has fostered a stream of
research that sees the birth of the fiscal state as reflective of international pressures, most
prominently the war itself through its impact on domestic budgetary needs and functional
modernization.7 This line of reasoning, going back to Tilly 1990, Hintze 1975, or more
recently Dincecco 2011, sees the war as a external constraint that forces states to re-organize
their internal political architecture. In line with this reasoning Scheve and Stasavage 2010,
2012 have recently revisited the notion of a conscription of wealth to argue that the war
is a major factor, if not the major factor, behind the rise of income tax progressivity and
inheritance taxation, both pillars of the development of the tax state after 1918. Without
downplaying the importance of the war and other cross-national common factors, there are
several limitations to this approach. To begin with several countries in Figure 1 did not take
place in the Great War and yet witnessed a significant expansion in revenue collection and
social spending throughout the period (e.g. Netherlands, Sweden). More importantly, as
6Refer to Supplementary Material for fiscal data details, and to Figure S-4 in the Sup-
plementary Material for a colorblind version of Figure 1.
7Flora 1974.
5
shown in Figure 1, there are significant differences among the countries that did participate
in the conflict in both the scope of the fiscal state and the composition of its spending.
Figure 2 shows the relative importance of direct taxes as tools of revenue collection across
countries and over time.8 What explains these differential patterns in terms of revenue
collection strategies (Italy vs. UK) and over time (France)? Why does the war hardly affect
France’s fiscal structure? Finally, a major implication of war oriented explanations is that
the link between the extension of franchise and the fiscal expansion of the state is spurious.
As the war explains the expansion in both, again as visually apparent in Figure 1, there
is little room to think of a politically meaningful causal link between enfranchisement and
fiscal expansions. In this paper we challenge this reasoning.
Figure 2
A second line of work sees Europe’s fiscal expansion as the result of pressures by lower
income citizens. In the spirit of the distributive turn in democratization studies, fiscal
expansion reflects a redistributive concession to appease the demand of lower income citizens
who otherwise would be malleable to revolutionary pleas. According to this line of work, the
observable covariance between the rise in franchise and the rise of spending responds to the
logic of redistributive appeasement.9 Recent research revisiting the priors of this literature
has highlighted a number of important concerns. Chief among them is the realization that
more democracy does not necessarily lead to more redistribution.10 This is consistent with
the fact that for many years in the early stages of democratization, an extension of suffrage
8One can think of the share of direct to total taxation as an indicator of progressivity, par-
ticularly after the turn of the century when the income tax expands. Sabine 1966; Seligman
1911.
9Acemoglu and Robinson 2006; Aidt and Jensen 2014; Boix 2003.
10Acemoglu et al. 2013; Ansell and Samuels 2014.
6

did not reduce wealthy inequality, as reflected on Figure 1.11 The latter decreased only
when franchise reached intermediate levels, already in the twentieth century. If the patterns
displayed in Figure 1 cannot be explained as a consequence of the war nor as a strategic
concession by the rich under the threat of revolution by the poor, what explains the rise of
the model fiscal state?
These puzzles point to unexplained aspects of the observable patterns between franchise
extensions, spending choices and revenue collection, aspects that are essential for a full un-
derstanding of the birth of the modern fiscal state. In the next section we propose an answer
to these puzzles based on the link between parties’ electoral incentives and the evolution of
fiscal policy.
The Argument: Time Inconsistent Electoral Strategies
and Fiscal Policy
Our analysis, along with Ansell and Samuels’s 2014 elite competition model, assumes a
split between elites (rural versus industrial, old versus new) at the onset of the process. We
believe with them that exploring the implications of this divide is an essential step to un-
derstand the joint endogeneity between democratization and fiscal expansion. Our analysis
begins where they end: namely, by assuming the existence of a minimally functional democ-
racy where a fraction of the population, however small, votes to choose its representatives
and/or the executive and the latter is periodically accountable to them. In addition, we take
the agenda one step further by introducing explicit partisan considerations and modeling
jointly the extension of franchise and the rise of the fiscal state as the byproduct of the
dynamic interaction of strategically oriented parties. To this end, we assume parties to be
11Wealth inequality is proxied by landholding inequality, as drawn from Vanhanen 2003.
For income inequality, see Figure S-5 in the Supplementary Material, where the same pattern
holds.
7

representative of organized economic interests. For simplicity, consistent with Ansell and
Samuel’s economic model, we consider the following party-class linkages:
• Conservative parties represent the preferences of the old land aristocracy and rural
elites.
• Liberal parties represent the preferences of the emerging industrial owners and urban
elites.
• Labor parties represent the preferences of the working classes resulting from the waves
of industrialization (1830s-1840s in the UK, and the 1870s in the rest of Europe).
Second, in this context we assume that parties set out to maximize their options to gain
and retain power and therefore jointly optimize two things:
• The definition of the rules of the game (primarily franchise) that best fits the size of
their coalition, and
• The design of policy that enhances the loyalty of their core supporters
Table 1 summarizes the preferences of the different parties with respect to three core
elements of the argument: franchise, taxes, and spending. When pursuing these preferences,
parties are operating in a rapidly changing social and economic context. Parties are engaged
in dynamic interactions in which the number and type of relevant actors, as well as the very
rules of the game, evolve often rapidly over time. In stark contrast to existing approaches in
the literature, we do not assume actors to have the ability to perfectly observe all possible
paths of strategic interactions among the relevant actors and backward induce over a century
and a half. Rather, we conceive of mid 19th-century parties as weak political machines,
operating in a context in which the rules of the game are far from established and political
loyalties are in flux.12 At the onset of democracy, parties are but hardly institutionalized
12Caramani 2004; Cirone 2015; Cox 1987; Michels 1911; Kirchheimer 1966.
8

clusters of notables whose core goal was to control state institutions according to their
own interests. Led by a small elite, these “cadre parties” lack the bureaucratic structure
of modern organizations, and their ability to preserve legacies and goals across subsequent
electoral terms.13 There is little coherence either within party families or over time and,
as a result, time horizons are bound to be short. Under these conditions, parties do not
internalize the long term consequences of today’s decisions over the rules of game of the
policies that enhance loyalty among its core voters. This organizationally-induced myopia
plays a critical role to understand the connection between short-term electoral incentives
and the rise of the fiscal state. From now on, we characterize myopia in the form of a the
discount ratio δ, that denotes the relative weight assigned by office seeking politicians to
future relative to current payoffs.
Table 1
To capture the strategic interaction between Liberals and Conservatives over time, we
analyze a two period game as displayed in Figure 3. We proceed in three steps. First, in the
first period of the game, which characterizes restricted parliamentary representation in the
mid-nineteenth century, we analyze what happens when Liberals reach office in a context
of conservative dominance.14. We establish the conditions under which Liberals choose to
expand franchise and with which policy implications, both on the spending and the revenue
sides. Second, assuming that the Liberals have succeeded in their strategy to optimize the
electorate’s size and policy offerings, we study the Conservative’s reaction in a context of
liberal dominance (second period). Finally, we analyze the decision of the first mover in light
of the consequences that followed, and draw insights about the conditions under which the
dynamics of fiscal expansion unfolds as a result of short-term electoral strategies.
13Katz and Mair 1995.
14Hereafter, dominance implies that forces other than the incumbent have a very low
probability of winning elections
9

Figure 3
Period 1: Liberal Parties’ Strategies and Payoffs
A status quo of conservative dominance implies that the probability of Conservatives, C,
winning the election as assigned by nature is almost one, that is, p ≈ 1. Under conservative
rule the Liberals, L, receive no benefit other than parliamentary representation, for which
they pay a low tax rate, tl. Conservatives enjoy an electorally dominant position until some
exogenous factor (e.g. a sudden increase in the prize of agricultural goods associated with
exceptional climatic conditions breeding political instability) reduces p enough for Liberals
to conceivably win office (in other words 1− p > 0). Historians show that there were few of
these exceptional times in Europe, mainly resulting from climate shocks at home or abroad.15
Our analysis begins at the point in which Liberals win office. Given limited franchise
(that is a situation in which Labor parties are excluded from the political game) liberal
elites must expand the franchise enough to incorporate their natural constituency, namely
new industrialists, and the upper echelons of urban liberal professionals such as lawyers and
traders. Otherwise, p regresses to values near 1 and the conservative hegemony is restored
(a la Acemoglu and Robinson 2000). In doing so, however, Liberals face some uncertainty
about the optimal level of the extension of franchise. At the same time that they want to
expand the electoral body to incorporate new economic elites they want to limit the entry
into the political body of potential supporters of political organizations further to the left.
Their optimal extension is a limited one but they do not know ex ante how limited. If they
err on the side of caution, their coalition may be too small to sustain a successful and stable
alternative against the Conservatives. If they err on the side of safety and build a small
buffer into the design of the extension of franchise, the pool of voters to lure may become
wider and more diverse than optimal. The scope of this ambiguity has direct implications
15See Berger and Spoerer 2001 and Traugott 1983 for the opportunities of reform derived
from the mid-nineteenth century crises.
10

for the second argument in parties’ strategies in our model, namely their policy offerings,
should they succeed in securing an extension of franchise and, ultimately, gain control over
the executive.
Consider first the optimal policy strategy of an unconstrained liberal party in a situation
in which Liberals have managed to carve out their ideal demos. Industrialists and urban
elites support large scale investments in public goods and infrastructures, particularly com-
munication networks, water sanitation, and partially, expansions in education to sustain a
sizable and well qualified labor force.16 By contrast redistributive social spending is not a
direct policy or electoral concern. Income and/or asset redistribution towards lower income
citizens is something at odds with the interest of the liberal coalition.17 To the extent that
they make an effort in this policy area it is to cope with potential negative externalities,
such as potential health hazards within cities, affecting their core supporters.18 As a result,
Liberals will tend to spend more than Conservatives across policy categories but, in line with
the interests of their core supporters, will minimize their redistributive incidence on the the
spending and the revenue side. To the extent they pursue a fiscal expansion, the latter will
be regressive. Liberal elites seek to finance new spending through the expansion of indirect
taxes. This allows them to keep overall spending levels at bay while pushing the burden of
taxation onto the newly enfranchised classes on a clear taxation-for-representation logic.19
16Pincus and Robinson 2011.
17Aidt, Daunton and Dutta 2010.
18Lindert 2004.
19A good illustration of the liberal position is given by the free traders’ reaction to Peel’s
reintroduction of the income tax in England in 1842. As Daunton 2001, 82 shows, “the
reintroduction of the income tax was not received with enthusiasm by many radicals and free
traders, who felt that it was being adopted in place of a more desirable policy of retrenchment
in government spending, particularly on war”. In Parliament, their position was eloquently
expressed: “No tax could be devised which would operate more unequally, more unjustly, and
11

In sum, once Liberals extend franchise, e, they will also increase the tax rate to tm > tl
so as to expand social spending G(tm) > G(tl) to lure the newly enfranchise into the Liberal
coalition. The Liberals’ payoff is then b − tm, with b > 1 being the value of office and tm
an intermediate tax rate. By contrast, if Liberals do not expand franchise, they go back to
their “loser/opposition party” condition, where they remain in opposition, receiving a payoff
that we normalize to 0, pay little taxes (in exchange for parliamentary representation) but
are left outside the executive. That is, they would continue to receive a −tl payoff.
Period 2: Conservative’s Strategies and Payoffs
The second case of interest is one in which Liberals have achieved office and begun to
enact their policy platform. They face two contenders: Labor, still largely excluded from
the formal political arena, and Conservatives, the opposition party in the new status quo.
Labor’s optimal strategy seems straightforward: demand full franchise to incorporate their
natural potential constituency, the working class.20
Liberals are now enjoying a dominant position: they stay in office with probability (1−
q) ≈ 1. The payoff function in Figure 3 captures the fact that they are particularly averse to
the tax increase that would necessarily come with the extension of franchise. Conservatives,
in turn, access power with probability q < 1− q, again driven by some set of extraordinary
politico-economic circumstances: e.g. World War I.21
Once in office, Conservatives face a strategic dilemma common to all non-dominant par-
ties, and similar to the Liberals’ in the previous period. If they extend franchise, they receive
a payoff b − th, with th > tm > tl. That is, they secure office but they also pay relatively
larger taxes to lure the newly enfranchised into their support coalition. If, on the contrary,
they do not extend franchise they remain in the opposition and pay tm (the cost of being part
more oppressively”. Daunton 2001, 83.
20Przeworski and Sprague 1986.
21Ticchi and Vindigni 2008.
12

of the selectorate, again with the only benefit of parliamentary representation normalized to
0).
Mirroring the Liberals in period 1, now Conservatives face a trade-off between their
ideological preferences and their own electoral survival. Their preferences are closer to those
of the Liberals than to those of Labor, and a Liberal-Conservative coalition against further
extensions of franchise constitutes their second best. Yet such a coalition would render
Conservatives’s role in politics to that of a permanent (and dwindling, in light of pervasive
structural changes) minority. Aware of this risk, however, office-seeker Conservatives have a
second alternative, namely switching their attitude towards further extensions of franchise.
By sacrificing part of their earlier ideological position on franchise, and broadening the pool
of potential voters, the Conservatives aspire to build a larger base from which to regain levels
of electoral support that bring them back to office.
There is no gainsaying this is a risky move on the part of Conservatives, one with high
costs in terms of mobilization/resources and uncertain political returns. Under what condi-
tions should one expect Conservatives to endorse further expansions of franchise from which
they would try to benefit then? Conservatives cannot credibly promise a policy platform ap-
pealing to low income voters on a redistributive dimension.22 Moreover, such a move would
create far too extreme internal divisions within their rank and it would go against the very
core of their ideological preferences. With this constraint in mind, they can only hope to
engage effectively in the mobilization of new voters in those societies where they can appeal
to them along a different political dimension. The range of feasible strategies to undertake
this switch varies across countries. In some cases, Conservatives opt for national identity
and nation building. In others, they endorse the preservation of traditional societal values
and religious institutions versus the endorsement of state centralization and secularization
championed by liberal reformist.23
22Acemoglu and Robinson 2000.
23Lipset and Rokkan 1967.
13

The resort to national identity was the prime strategy by Conservatives such as Bismark,
or in a different historical and institutional context, Cavour in Italy. Both were members of
the land aristocracy and perceived the process of nation building against external enemies as
an opportunity to forge a coalition with emerging industrial interests around the expansion
of national markets, and to undermine the growing political support for workers’ movements
during the second industrialization.24 As part of the strategy to forge a national identity
and broaden the social basis of support for the constitutional monarchy, Prussia was indeed
a pioneer in granting universal male franchise yet for an institution with limited powers in
the 1871 Wilhelmine Constitution.25 This combination, coupled with the early development
of social insurance systems,26 proved a successful adaptation strategy against the rise of
liberalism in several European nations.27
Conservatives’ strategic switch, while driven by similar goals, works differently in societies
with pre-existing and encompassing religious organizations, such as the Catholic Church.
Their presence on the ground reduces the organizational investment necessary to compete for
new voters and therefore increases the expected net gains of supporting further extensions of
franchise. As a result, the costs of the mobilization investment along non-income lines is lower
to begin with. In addition, Conservatives operating in coordination with the Catholic Church
can also engage in the mobilization of lower income voters via material incentives through
charitable institutions of the sort advocated by the early Social Catholic movements.28 In
24Steinmetz 1993; Mommsen 1986.
25Berman 2001.
26Mares 2003.
27Shayo 2009 provides micro-foundations to explain why conservative elites see nationalism
as an opportunity to extend franchise while containing the risk of being overpowered by
political parties representing lower income groups.
28Kalyvas 1996; Van Kersbergen 1995. Moreover, a wealth of historical evidence on the
emergence of Christian Democracy in Europe validates this theoretical prior. Initially, Con-
14

the absence such an organizational infrastructure, though, supporting additional extensions
of franchise is a riskier political endeavor and makes little strategic sense.
To sum up, provided that the right organizational conditions are in place, Conservative
parties under liberal incumbency have strong incentives to modify their earlier position
on the extension of franchise and strategically support a more encompassing voting pool.
Whether confessional (religious driven) or not (identity driven),29 the strategic shift by the
Conservatives is interesting for several reasons. First, it is a priori counter-intuitive in
nature. Second, it is especially consequential from the perspective of the birth of the fiscal
state because of its medium term consequences. Critically, the long term implications of
servative parties were wary of both franchise and the Church. The former implied too much
political equality; the latter, too much institutional dependence from the Church (as illus-
trated by the fact that Italian unification occurred largely at the expense of the Church).
Yet as their competition with Liberals intensified and mass politics became a real possibility,
they had to abandon their original preferences. As Kalyvas 1996 puts it “[ 55] The defense
of the church presented two related advantages: first, a great appeal, both in broadness and
intensity, especially to just enfranchised or soon to be enfranchised masses, and second, the
direct access it provided to the organizational resources of the church [...] [57] To conclude,
in the interaction between the Church and the Conservatives the participation strategy con-
stitutes a stable equilibrium. It is an equilibrium based on the mutual contracting out of
undesirable but necessary activities: political struggle agains anticlerical reforms for the
Church and mass organization for Conservative political elites. It is a stable equilibrium
because no side has, at this point, the incentive to defect unilaterally.”
29Historically, the particular strategic choice by Conservatives determines whether the
right side of the spectrum is dominated by Christian Democracy or by Conservative parties
that tend to absorb the remains of pre-existing liberal parties. The latter, incapable to
embrace and situate themselves in the new strategic scenario of full enfranchisement, find it
harder and harder to retain a significant institutional presence.
15

the Conservative move towards full franchise (i.e. labor parties reaching office as a result of
the second and last franchise extension, thus fostering higher taxes and spending) cannot be
anticipated ex ante.30
Implications: Myopia and Fiscal Expansion
Given the responses by Conservatives to liberal dominance in period 2, the last hurdle is
to analyze the conditions under which liberals find it rational to extend franchise in period
1. Taking periods 1 and 2 as two elements of a single game, and solving the Liberal inter-
temporal calculation through a standard backwards induction approach, yields the following
condition:
δ < δ∗ =b− (tm − tl)
qth − [tl + (1− q)(b− tm)](1)
which implies that Liberals extend franchise in period 1 if and only if δ < δ∗, that is, as
long as they discount the future large enough.31 Liberals (as any other political group) value
office rents: thus, Expression 1 is more easily met when b is high. Liberals fear extraction too:
accordingly, Expression 1 is harder to be satisfied when Liberals anticipate a low probability
of retaining office in the future, (1 − q), or high tax rates, th. The key insight from the
analysis is that Liberals extend franchise in period 1 if only if they prioritize short-term
office rents, or underestimate the probability of Conservatives regaining office in the future.
30Conservatives would not extend franchise at t = 2 if their probability of staying in office
under full franchise, h, is very low. Insofar as the condition b−th+δ[h(b−th)+(1−h)(−th)] >
−(1 + δ)tm is met, the decision by Conservatives to expand franchise in t = 2 is optimal.
31Expression 1 results from comparing Liberals’ current utility of expanding plus the ex-
pected value in time 2, against the possibility of being in opposition in time 1 and 2, provided
a discount factor δ ∈ [0, 1]. This result requires b > tm − tl in period 1 (i.e. Liberals extend
franchise in t = 1), and b > th− tm in period 2 (i.e. Conservatives extend franchise in t = 2).
Both conditions are simultaneously met for b > (th − tl)/2.
16

Three important analytical implications follow from our analysis:
1. The model suggests that the Liberals’ organizationally-induced myopia in period 1,
characterized by a high discount ratio, pushes Conservatives to lead further extensions
of franchise in period 2, reaching to a sub-optimal result for both the Liberals and
Conservatives with respect to the initial conditions of the game: that is, they will end
paying high taxes, and taking turns in office with a third player, Labor.
2. Our theory implies that under partial franchise, no combination of franchise regulation
and public policy constitutes a stable equilibrium. For any party satisfied with the
status quo in terms of the size and composition of the demos and the policy regime there
will always be at least one other party inside the political game with (1) different policy
preferences and (2) incentives to push for additional extensions of franchise in the hope
that the new inflow of voters increase their chances to influence policy. Critically, this
holds true regardless of ideological position of the challenger relative to the incumbent
party.32 At the limit, this dynamics leads to a much larger level of enfranchisement than
either Liberals or Conservatives would consider their first preference at the beginning
of the process. By prioritizing short term gains over medium term strategies, Liberals
and Conservatives display time-inconsistent strategies that ultimately facilitate the
political entry of platforms mobilizing the working class and securing much higher
levels of social spending, revenue collection, and progressive taxation than either of
them would ever deem optimal.33
3. Fiscal policy choices evolve over time as part of an office seeking electoral strategy.
As incumbents are defeated and become the new challengers, their preferences over
the optimal size of the electorate switch, and they support additional extensions of
32In addition, there will also be parties excluded from the political arena demanding an
even broader political field.
33Dixit and Londregan 1996; Esping-Andersen 1985.
17

franchise, which in turn demands new fiscal policies to forge new and stable political
coalitions. Herein lies the mechanism linking electoral incentives and fiscal expansions.
More specifically:
(a) In the early stages of their contest against Conservatives under very limited fran-
chise, Liberals expand both franchise and social spending to lure the newly en-
franchised into the liberal coalition. Critically, this spending is non-redistributive
in nature and is funded by indirect/regressive tax instruments.
(b) In their efforts to regain power, Conservatives switch their preferences over suf-
frage and endorse further extensions of franchise.
(c) In later stages, in their contest against Conservatives under full enfranchisement,
Labor parties take advantage of previous franchise extensions and expand social
spending and more progressive forms of taxation to lure the newly enfranchised
into the Labor coalition.
Empirical Analysis
To assess the empirical validity of our argument we proceed in three steps. We first
investigate franchise extensions as a function of what parties expect to gain given the existing
size of the electorate. Second, we test whether policy responses by parties are actually
consistent with the goals of the extension of franchise. We study this mechanism by focusing
on what parties offer the newly enfranchised (i.e. spending) and how they finance it (i.e.
revenue). Lastly, we evaluate whether the long-run consequences of this iterated game of
electorally motivated franchise extensions are consistent with our argument.
Throughout the analysis, and consistent with the trends identified in Figure 1, we treat
WWI as a breaking point between the era of elite competition and the era of mass politics.
Obviously, instances of mass politics occurred before 1914 and elite competition remains a
key engine of history after 1918, but the relative balance between the two changes as a result
18

of the war.34 The war effort puts pressure on incumbent parties to broaden franchise and
opens up a new playing field in which the demands by workers’ representatives and women
are harder to ignore.35 In our framework this has implications not only for the fortune of the
direct demands by labor parties, but also for the strategic portfolio of conservative parties
challenging liberal elites, reinforcing in many instances a trend that in several cases was
present since before the War.
Franchise Extensions in the Long Nineteenth Century and Beyond
Parties evaluate the gains and costs of extending franchise given the size of the electorate
at any given point in time. When franchise is restrictive, we expect Liberals to have a strong
incentives to loose franchise provisions. In a context of conservative dominance, Liberals
can benefit electorally from bringing the middle classes into the electorate. However, their
preference toward franchise extensions is expected to be endogenous to the process itself.
At later stages, when the size of the electorate is big enough to include their immediate
supporters (professionals and urban middle class), we expect Liberals to lobby against further
franchise extensions. They have nothing to gain from a bigger electorate, which presumably
would prefer a big government platform offered by Labor opponents rather than the minimum
government Liberals are after.
By contrast, our argument suggests that Conservative preferences evolve in the oppo-
site direction. When franchise is restrictive, rural elites hardly gain from relaxing franchise
provisions. First, the newly enfranchised classes are likely to support the Liberals. Sec-
ond, the larger the size of the electorate, the more necessary building strong, hierarchical
34Aidt and Jensen 2014; Ticchi and Vindigni 2008.
35In turn, such a pressure for incorporation within war participant countries spills over
to non-participants through a variety of diffusion mechanisms. Indeed, of the four neutral
countries in our sample, Denmark extended franchise in 1918, Norway in 1915, and Sweden
in 1919. Finland had already done in 1907 for reason arguably independent than WWI.
19

organizations becomes, something of conservative dislike.36 However, once Liberals extend
franchise, the incentives of Conservatives to relax franchise provisions change. Aware of
the rising popularity of the Liberals, Conservatives come back to the game by mobilizing
a second dimension: religion and national identity. Both religion and nationalism appeal
to a wider electorate irrespective of class, and makes of the conservative brand a genuine,
competitive alternative to both Liberals and Labor. Based on these expectations, we draw
two hypotheses:
Hypothesis 1. In early stages of franchise extension, Liberals lead the extension of
franchise, and Conservatives oppose it.
Hypothesis 2. In later stages of franchise extension, Conservatives lead the extension
of franchise, and Liberals oppose it
The dependent variable in both hypotheses is the extension of franchise. This indicator
variable is drawn from Aidt and Jensen 2013, and Przeworski 2013. Table 2 lists the dates
of franchise extensions per country: it includes extensions affecting male (i.e. elimination of
wealth, tax, or educational requirements), as well as those affecting women’s suffrage, which
concentrate after WW1. Table 2 also lists the first extension of franchise, that is, the one
bringing parliamentary representation. However, we do not model first extensions as our
theory assumes a minimum level of parliamentary representation.
Table 2
The dependent variable equals 1 the year in which a country extends franchise, and 0
otherwise. Accordingly, the structure of the dataset is Binary Time-Series-Cross-Sectional
(TSCS). To model duration dependence in the extension of franchise, we resort to event
history models for discrete dependent variables. In particular, we seek to estimate
h(t|xi,t) =1
e−(xi,tβ+H(t−t0))(2)
36Kalyvas 1996.
20

where the instantaneous discrete hazard rate (or simply, the probability of franchise extension
at time t) is a function both of the independent variables, (the xi,tβ term), and the length
of time that the country has been been at risk of extending franchise, H(t− t0), or baseline
hazard. In order to model the baseline hazard, we fit a smooth function of the number of
years elapsed since the country is at risk of extending franchise.37 There are two standard
solutions for this: flexible polynomials (Carter and Signorino, 2010), and splines (Beck, Katz
and Tucker, 1998). We fit both.
Once the baseline hazard is properly accounted for, logit models are proved to be history
method for BTSCS data.38 Still, for the sake of robustness, we also fit complementary log-log
models (or cloglog) which are the “exact discrete duration analogue” of the Cox proportional
hazard model.39 To account for time-invariant unobserved heterogeneity across units, we also
fit country fixed effects. This is possible thanks to the repeated event structure of the data:
that is, countries extend franchise multiple times.
To properly assess Hypotheses 1 and 2, we have coded the parliamentary plurality for
each parliamentary sessions in 10 European countries since 1820 (refer to Supplementary
Material for details). Before 1914, Parliamentary plurality was either in the hands of the
Conservatives or the Liberals. Franchise extensions in the turn of the century, and specially
following WWI, paved the way to Labor representation. Eventually, they became a major
group in Parliament, and alternated plurality with the two pre-existing blocks: Liberals and
Conservatives.
Since we argue that the parties’ incentives to extend franchise vary as franchise expands,
we control for franchise levels (various sources, see Supplementary Material). We also adjust
37Box-Steffensmeier and Jones 2004. Specifically, the risk starts following the first exten-
sion of franchise, as listed in Table 2.
38Beck, Katz and Tucker 1998, 1264.
39Beck, Katz and Tucker 1998, 1268; Box-Steffensmeier and Jones 2004, 74.
21

for GDP per Capita,40 and participation in war at any given year.41 To account for the
demand of franchise extension coming from below, we control for the vote share of labor
parties for each legislative session.42
We consider two alternative safeguard mechanisms that, for any given level of franchise,
serve the elite to control how people vote and how votes are counted: one is the open
ballot, an instrument of strong social control;43 another is proportional representation, which
minimizes the policy costs of labor gaining office.44 We could have also controlled for the
existence of higher chambers, which presumably minimize the impact of policy crafted by
leftist parties in the lower chamber. However, bicameral parliaments are a constant in our
sample: 99.6% of country-years have one.
To emphasize the different set of incentives that Liberals face at different levels of fran-
chise, we perform this exercise step-wise. In Table 3 we investigate franchise extensions in
the long nineteenth century, 1815-1913, a key period in the development of modern democ-
racy in Western Europe. In Tables 4 and 5 we broaden the spotlight and analyze franchise
extensions in the full period, that is, from 1820 to 1975. Results are consistent across time
periods: Liberals promote franchise extensions when suffrage was restricted, and opposed
further extensions at the turn of the century, when suffrage reaches intermediate levels. At
that stage, the Conservatives, cross-pressured by Liberals and the rising Labor movement,
sponsor further franchise extensions to appeal to social-conservative, religious voters.
40Maddison 2007.
41Sarkees and Wayman 2010.
42Aidt and Jensen 2014 show that social revolutions were effective in delivering franchise
extensions. However, revolutions happened out of our sample, except for France. Results
when we include the 1830, 1848, and 1870-1 French revolutions hold.
43Mares 2015. Data of the secret (open) ballot is drawn from Przeworski 2013.
44Boix 1999. The adoption year of a proportional electoral system is drawn from Calvo
2009.
22

Table 3
Table 3 investigates franchise extensions in the long nineteenth century, which comes to
an end on the eve of World War I. The nineteenth century is a time in which old-regime con-
servative parties are still major players, and Parliament representation is restricted. These
are the conditions under which we expect liberal parties to sponsor franchise extensions the
moment they gain power so as to maximize their chances to retain it. Consistent with this
logic, Table 3 shows that, from 1820 to 1914, liberal parliamentary pluralities predict the
extension of franchise as compared to conservative pluralities. Importantly, the results are
robust to various empirical strategies and ways to account for duration dependence: columns
1-3 are fitted with a logit model, first accompanied by a third-order flexible polynomial to
account for time dependence, and then by a battery of three splines. Columns 4-6 replace
the logit for the cloglog link, and alternates the two same methods of adjusting for the base-
line hazard. The various analyses suggest that liberal majorities are significantly associated
with franchise expansions prior to 1914. A liberal plurality in parliament increased the in-
stantaneous probability of a franchise extension by almost 10%. Importantly, results are
also robust to controlling for the labor vote share, which captures either the left threat, a la
Acemoglu and Robinson 2006, and Boix 2003, or the permissiveness of the political system;
the presence of an open ballot (arguably a substitute for low franchise), GDP per capita,
and participation at war. Additionally, in columns 3 and 6, we fit a battery of country fixed
effects to account for unobserved heterogeneity across countries. Results remain unchanged:
Liberals are associated with franchise extension in the long nineteenth century, when fran-
chise was still limited to the wealthier strata of society. Who sponsored franchise extensions
in the twentieth century?
Table 4
Table 4 expands the scope of the analysis, including franchise extension occurring before
and after World War I, all the way to 1975, the heydays of the modern fiscal state. We claim
23

that nineteenth-century parties made myopic decision that resulted from their weak internal
cohesion and organization. Being clubs more than modern party organizations, they did
not anticipate the long-run consequences of the decisions that maximized their immediate
electoral fortunes. Accordingly, we expect Liberal-sponsored franchise extensions to be self-
defeating: once franchise is sufficiently extended, Liberals cannot gain from further franchise
extensions; yet, they unintentionally push Conservatives to further extend franchise as to
appeal the nationalist/religious worker. This is, however, a double-edged strategy for the
Conservatives too: by enfranchising the working poor, Labor parties get an opportunity to
reach power and implement a progressive agenda, which is suboptimal both for Liberals and
Conservatives, who would prefer a smaller government. Next, we test these implications
step-wise.
First, as franchise increases, we expect Liberals to switch strategy: that is, by the turn
of the century, when suffrage is already intermediate, Liberals refrain from sponsoring fur-
ther franchise extensions. We test this by interacting Liberal parliamentary pluralities (an
indicator variable) with the franchise level (a continuous variable). Consistent with the the-
oretical expectation, column 1 in Table 4 shows that for low levels of franchise, Liberals favor
franchise extensions (which is consistent with Table 3’s results), whereas for high levels of
franchise, Liberal oppose further extensions.
Column 2 reexamines our expectation replacing franchise level for a Before-After 1914
indicator. This variable roughly identifies the end of the long nineteenth century. By the
end of this period, on average, suffrage in Europe has already achieved intermediate levels
(refer to Figure S-3 in the Supplementary material for evidence of this). Accordingly, we
expect Liberals to stop sponsoring franchise extensions after 1914. Consistent with this
expectation, the analysis shows that Liberals did sponsor franchise extensions before WW1,
but not afterwards. That is, the Liberal strategy toward suffrage extensions shift when
franchise reached intermediate levels.
Table 4
24

To illustrate column 2’s result, Figure 4 plots the effect of a Liberal plurality in Parliament
on the probability of extending franchise, before and after 1914. The results clearly reflect the
change in attitude toward franchise extensions by Liberals before and after the Great War.
Before WWI, Liberals in power increase the probability of franchise extension by almost
10 points (as compared to Conservatives and Labor, the excluded category); after WWI,
Liberals are no longer associated with franchise extensions. Column 3 in Table 4 reruns the
analysis while adding country fixed effects to control for unobserved heterogeneity. Results
hold.
Figure 4
Who is then responsible for franchise extensions when suffrage is already partially ex-
tended? Conservatives, we claim. When franchise levels are intermediate, Conservatives are
no longer competitive. The newly enfranchised, who are drawn from the rising urban elites
associated with manufacturing and trade, see the Liberals as a natural ally. Conservatives
may revert this imbalance by further extending franchise while mobilizing a second policy di-
mension that is not associated with spending decisions: namely, religion and/or nationalism.
Based on this logic, we should expect franchise extensions in the twentieth century being
promoted by conservative parties. Those competing in countries with a pre-existing religious
cleavage would run under the Christian-Democratic label. Alternatively, they would mobi-
lize the nationalist card to speak directly to the traditionalist working class. We test these
predictions stepwise in Table 5, in which we interact three types of parliamentary pluralities
(confessional, non-confessional right, and labor parties) with the level of franchise. Both
in columns 1 and 2, Liberal pluralities are the excluded category, as they are expected to
oppose further franchise extensions when franchise is already intermediate.
Table 5
In column 1, the interaction terms suggest that for higher levels of franchise, both types
of conservative parties sponsor franchise extension relative to the Liberals (the excluded
25
category). Interestingly, Labor pluralities are not associated with franchise extensions. One
logical reason for this is simply that Labor only gained parliamentary pluralities once suffrage
was already nearly universal. In column 2, we fit country fixed effects to address time-
invariant unobserved heterogeneity across countries. Results are similar, but certainly not
the same. The non-confessional right is still associated with franchise extensions at high
values of franchise, but the confessional right is not. The coefficient is still positive, but it
does not reach standard levels of statistical significance. Nevertheless, in order to get a full
understanding of the interaction term in non-linear models, we need to plot the results.
Figure 5
Figure 5 simulates the predicted probability of franchise extension by franchise level and
parliamentary plurality, as drawn from Table 5. This figure suggests that Conservatives and
Labor, in this order, increase the probability of extending franchise once suffrage has reached
40% of the national population (i.e. intermediate values). Within the conservative spectrum,
non-confessional parties lead franchise extensions, although the confessional right do not lag
far behind. These results suggest that parties that used to block franchise extension in
the nineteenth century switched their strategy at intermediate levels of franchise, we argue,
because they were cross-pressured from above (the Liberals) and below (Labor).
All in all, this section shows that Liberals and Conservatives switched roles as franchise
extended. When suffrage was limited to a bunch of old regime elites, Liberals sponsored
franchise extension as a means to move away from that status quo, in which Conservatives
were the leading political force. At more advanced stages of suffrage, Liberals stopped
sponsoring further extensions, as these were detrimental for the Liberal voter: they implied
greater taxes and spending. Conservative parties, on the other hand, saw further franchise
extensions as an opportunity to regain power. Specifically, Conservatives sponsored further
franchise extension as a means to appeal to the social-conservative, religious/nationalist
worker. Next section investigates specific ways in which Liberals appealed to the newly
enfranchised to join their coalition prior to 1914.
26

Social Spending and Revenue Collection before 1914
The electoral strategies are meant to shape the size and composition of the demos to each
party’s advantage. In turn, to sustain stable coalitions of support parties rely on different
policy portfolios. Conservatives preferences for a small, selective electorate, is consistent with
their quest for sheltering from taxes (on land assets) and competition.45 Liberals and Labor
in turn, as the complexity of their constituents increases, must rely on different combinations
of spending and revenue policies. This section investigates how Liberals were able to mobilize
enough resources to gain the support of the newly enfranchised in such a way that the net
benefits of this electoral strategy were still positive for the Liberals.
To obtain and secure the support of the new or would-be enfranchised, Liberals had to
finance services that the State had never delivered ever before: basic social goods (see, for
instance, the case of primary education in Ansell and Lindvall 2013). In small quantities,
education, housing and social services spending would lean the newly enfranchised in favor
of the Liberals, which would be seen as the party of the urban professional, middle class,
especially when compared to the Conservatives, the party of the county and the privilege.
The volume of social spending before 1914 was still a fraction of what it would become later
one, but was by no means insignificant. On average the total budget during this period
amounted to 6 percent of GDP, with social spending accounting for about one third of the
budget. We claim that these small quantities were of profound electoral significance, enough
to incline the electoral game in favor of the Liberals.
For the strategic decision of providing basic social services to gain the hearts and minds
of the newly enfranchised to be rational, the expected net benefits for Liberal constituents
must be positive. This concerns both revenue and spending choices. Liberals in power,
we argue, did not only tune spending but also revenue. In order to maximize their utility,
Liberals placed the incidence of taxation on the newly enfranchised themselves. That is, they
45Mares and Queralt 2015.
27

created the illusion that political rights came with new social services, but in reality, the
latter were financed via indirect taxation. That is, Liberals did not assume the financial cost
of the new social services, but the newly and would-be enfranchised.46 In essence, the proto-
welfare state was a small-scale, partial replica of what it eventually became in the twentieth
century: a social insurance system, where middle classes fund via indirect taxation the same
services they consume.47 In other words, the initial fiscal contract was not redistributive,
but a system of largely regressive social insurance driven carefully tailored to electoral needs.
Based on these expectations, we hypothesize:
Hypothesis 3. Before 1914, an expansion of the franchise by the Liberals implies an
increase in social spending.
Hypothesis 4. Before 1914, any increase in social spending is funded via indirect,
regressive taxation.
Social Spending before 1914
To test Hypotheses 3 we make use of a series of social spending starting as far back as
1820. The data includes any spending on education, housing or social services provided by
the central government (for further details see the Supplementary Material). To account for
the instantaneous effect of a Liberal-sponsored franchise extension on social spending, we fit
a first difference models. Specifically, we test whether social spending increases following an
extension of franchise sponsored by the Liberals. The model to be estimated is:
46For further evidence of the Liberal’s preference of indirect to direct taxation in the
nineteenth century, Mares and Queralt 2015.
47Beramendi and Rueda 2007; Timmons 2005.
28

∆SocialSpendingi,(t,t−1) = φExtensioni,t−1 + κLiberalsi,t−1 + ψ(Extensioni,t−1 × Liberalsi,t−1
)+Xi,t−1κ+ γi + ηt + ui,t
(3)
where ∆SocialSpending denotes the first-difference in social spending (as % of GDP) be-
tween t and t−1, Extension refers to franchise extension, Liberals to liberal plurality in Par-
liament, X is a vector of time-varying controls, and ui,t is the disturbance term. Moreover,
we include a full battery of country fixed effects, γi, to control for unobserved heterogeneity
across panels (e.g. religious fractionalization, institutional or cultural legacies), and year
fixed effects, ηt, to account for common underlying time trends (e.g. world trade, financial
shocks). To address sequential causation, we lag all covariates one year. That is, we investi-
gate whether Liberal-sponsored franchise extensions yesterday lead to more social spending
today. The analysis also controls for various alternatives determinants of social spending:
trade openness,48 landholding inequality,49 and urbanization.50
Table 6
Table 6 reports the estimates of this model. In column 1 we fit the instantaneous change of
a Liberal-sponsored franchise extension on social spending as % of GDP. That is, we strictly
fit Expression 3. We observe that the interactive coefficient is positive but not statistically
48Refer to Adsera and Boix 2002; Hiscox 2002 for theoretical foundations. Trade data are
drawn from Banks and Wilson 2010.
49Refer to Acemoglu and Robinson 2000; Boix 2003 for theoretical foundations. Landhold-
ing Inequality is computed as the percentage of farms not owned by families. It is drawn
from Vanhanen 2003, and it is also a standard measure in the literature: Ansell and Samuels
2014; Mares and Queralt 2015; Ziblatt 2008.
50Refer to Lindert 2004 for theoretical foundations. Urbanization data are drawn from
Banks and Wilson 2010.
29
significant. In column 2, we control for the level of social spending at t − 1 to account
for country-level time-varying unobserved heterogeneity. Again, the interactive coefficient is
positive but does not strictly fall within conventional levels of statistical significance. One
obvious caveat with this test is that the returns of electorally motivated changes in social
spending might take a few years to realize: new laws and budgets have to be drafted, then
implemented, and ultimately, recorded. To account for these lags, in columns 3 to 5 we
replace the immediate change in social spending from t− 1 to t for a longer spell: five years,
that is, the different in social spending from t− 1 to t+ 4.51
Results in columns 3 to 6 suggest that Liberal-sponsored franchise extensions before 1914
did expand social spending within five-year time. Results are consistent to different specifi-
cations: the presence and absence of the level of social spending when suffrage reform takes
place (columns 3 and 4), and the inclusion of further controls: Proportional Representation
(PR), Secret Vote and Left Share, in column 5, and urbanization and trade openness, in
column 6.
Figure 6
Figure 6 plots the marginal effect of the interaction (as drawn from column 4). In the
absence of a franchise extension, Liberal pluralities are associated with low social spending.
However, when they sponsor a franchise extension, average social spending to GDP increases
by 0.25% within five years, consistent with our theoretical expectation. These are the type
of minimal expansions of spending that we would expect from a political group defending
small government, as Liberals did.
51In the Supplementary Material, we consider alternative time windows. Importantly,
these cannot be too short for the reasons just stated, nor too long, as new coalitions might
replace those that motivated the franchise extension. Results of the alternative time windows
are virtually identical.
30

All in all, irrespective of the actual specification, franchise extensions promoted by liberal
parliamentary pluralities before 1914 systematically led to rises in social spending as a share
of GDP within 5 years from suffrage reform.
How was Early Social Spending Financed?
Turning to Hypothesis 4, we perform our test on the basis of two series: one on direct
taxation, and another on indirect taxation, both as share of total tax revenue. The goal
of this double test is to show that, as social spending increased, taxation leaned toward
regressive, indirect taxation, as it was preferred by the same industrial sectors that Liberal
parties represented.52
To account for indirect taxation, we use the share of excise revenue to total tax revenue.
In a world with no VAT, the excise nicely captures the regressive nature of the early fiscal
state. Based on the results of Table 6, we do not evaluate instantaneous changes in taxation,
but we allow for a longer spells: that is, the difference in taxation five years from franchise
extension:
∆Taxationi,(t+4,t−1) = φExtensioni,t−1 + κLiberalsi,t−1 + ψ(Extensioni,t−1 × Liberalsi,t−1
)+Xi,t−1κ+ γi + ηt + ui,t
(4)
where ∆Taxationi,(t+4,t−1) denotes the first-difference in direct/indirect tax (as % of total
taxation) between t+ 4 and t− 1, Extension refers to franchise extension, Liberals to liberal
plurality in Parliament, X is a vector of time-varying controls, γi and ηt are full vectors
of country- and year-fixed effects, respectively, and ui,t is the disturbance term. Again, we
address sequential causation by using the first-lag of all covariates.
Table 7 reports three specifications for each of the two dependent variables. Columns 1 to
3 investigate the effect of Liberal-sponsored franchise extensions on direct taxation. Results
52Ansell and Samuels 2014; Mares and Queralt 2015.
31

are either non-significant or negative. That is, franchise extensions by Liberal parliamentary
pluralities were not followed by an increase in direct taxation, if any, the opposite.
Table 7
In stark contrast, indirect taxation, measured by the share of excise yields to total tax
revenue, did raise after franchise extensions. This result is robust to various specifications,
as stated in columns 4 to 6, plus country and year fixed effects. Figure 7 plots the marginal
effect of the interactive coefficient. Based on this estimate, the change in excise revenue to
total taxation increased by over 3.5% point within five years of a Liberal-sponsored franchise
extension prior to 1914, a remarkable increase in regressivity.
Figure 7
Considered together, Table 6 and 7 suggest that franchise extensions prior to 1914 pro-
moted by the Liberals increased social spending. However, this early spending was funded
by the newly enfranchised themselves on a quid pro quo, regressive basis. In other words,
the early fiscal state was not redistributive, contrary to the what is usually understood.53
The early social services were not provided to appease the working class but to maximize
political survival of the a new political elite, the Liberals. We do not find evidence of any
retrenchment either, as it has been argued elsewhere.54 Rather, the logic guiding the data
generation process is political and electoral. Social spending as a share to GDP did increase
over the period, and it did as a result of an electoral calculus by the Liberals to unravel the
conservative political dominance of the nineteenth century.
53Acemoglu and Robinson 2006; Boix 2003.
54Aidt, Daunton and Dutta 2010; Aidt and Jensen 2013. A possible explanation for the
difference with Aidt and Jensen 2013 is in the dependent variable. We do not use total
spending, as they do, but social spending as a percentage of GDP, which we believe is more
strongly connected to the electoral logic of franchise extension.
32

Corollary: Fiscal Consequences of Electoral Strategies
Our theory suggests that Liberals switched their electoral strategy twice. Early in the
democratization process, when they targeted social spending, and later in the process, when
they opposed further social spending, as they had reached their optimal steady-state: a lim-
ited electorate populated professional and urban middle classes, plus limited social spending.
At the turn of the century, Liberals were the new dominant political force.
We also claim the new status quo was never an equilibrium for the Conservatives. Cor-
nered by the Liberals and afraid of a democratic take over by the radical left, Conservatives
mobilized a second dimension, religion or nationalism, depending on the pre-existence of
a religious cleavage, to regain competitiveness in the electoral arena. What was the fiscal
effect of the electoral shift of Conservative parties? We claim it had no major effect in the
short-run —appealing to religious and nationalist values did not require of new taxes or
spending—, but that it turned huge in the medium-run. As we have proved above, Conser-
vatives were the main advocates of franchise extension after 1914. At this stage, this meant
universal franchise, which strongly benefited the left. That is, the Conservatives’ search for
regaining political centrality in Europe endowed Labor parties with the strongest weapon to
implement a fully-fledged socialist agenda: paper stones.55 This is clearly seen in Table 8
where we test for the effect of Labor parliamentary majorities on long-term social spending
and tax revenue.
Table 8
Specifically, Table 8 reports a series of standard Lagged Dependent Variable (LDV) and
Auto-regressive Distributed Lag (ADL) models of social spending and taxation that are
fitted for serially correlated data as these.56 For consistency, we run the same specification
55Przeworski and Sprague 1986.
56Beck and Katz 2011. For reference, ADL models include a first-lag of all independent
variables to account for any serial correlation in the covariates.
33

for both dependent variables: social spending to GDP (columns 1 to 3), and total tax revenue
to GDP (columns 4 to 7), starting as early as 1822.57 The results confirm our expectations.
When franchise is high and Labor achieve plurality in Parliament (thus an opportunity to
implement a progressive agenda), both social spending and tax revenue grow. This result
holds regardless of the error structure (LDV or ADL), and the consideration of a battery of
relevant controls in the literature of taxation and spending: War, urbanization, trade, and
landholding inequality. In the long-run, Labor champions big government. To emphasize
further this point, Figure 8 plots the predicted values of social spending and taxation in the
presence and absence of a Labor plurality in Parliament. Only levels of franchise above 40%
of the population are considered, as Labor was residual before that. Both subfigures speak
for themselves. When suffrage is universal (i.e. covering around 70% of total population),
Labor is significantly associated with high social spending and taxation (relative to Liberals
and Conservatives, the excluded categories in Table 8).
To sum up, Tables 8 combined with Tables 3-7 jointly illustrate the long-run fiscal conse-
quences of short-term electoral politics. At early stages, Liberals were the main supporters of
franchise extension accompanied by modest social spending, the minimum necessary to lure
the newly enfranchised into the liberal coalition. This strategy was successful. Conservatives
were penalized by a system with partial franchise, were only elites and urban middle-classes
could vote. The new status quo was not a beneficial equilibrium for the Conservatives, and
they sought new strategies to break with the liberal hegemony. Chief among them was the
mobilization of the religious and national identity cleavage along with full enfranchisement,
a strategy that brought them back to the electoral arena as a competitive player. This move
proved successful in the short run but it also empowered Labor parties, which now could
appeal to a wider spectrum of voters. Ultimately, the conservative electoral strategy opened
57Results hold if we use the tax series produced by Dincecco and Prado 2014. However,
theirs start 50 years afters ours, which is based on Flora, Kraus and Pfenning 1983. Refer
to Supplementary Material for details.
34

the door of the national executive to labor parties and, as a direct consequence, paved the
road to the growth of the fiscal state.
Conclusion
Previous explanations of the rise of the fiscal state in Europe have emphasized the role of
the international pressures (such as those derived from war) and/or structural factors (such
as the relationship between industrialization and different forms of inequality). Our findings
in this paper highlight a distinctively political logic —thus partisan and strategic—behind
the variation in the increasing role of government in spending and revenue collection. First
the Liberals, and then, counter-intuitively the Conservatives, pushed for extensions of fran-
chise mostly driven by short-term electoral considerations. The Liberals first support fran-
chise extensions to gain power and shift to preserve the new status quo subsequently. The
Conservatives first oppose political equality but then discover its potential advantage as a
device to resist the liberal transformation of society and state institutions. We also show,
however, that such an advantage was not devoid of risks. The competitive interaction be-
tween Liberals and Conservatives over time paved the way for the subsequent incorporation
of political forces representing the working classes in the era of mass politics. Our analysis
has also unveiled the link between parties’ preferences about the optimal size and electorate
and their revenue collection and budgetary choices. There is a clear, if indirect, connection
between enfranchisement and fiscal policy choices with deep rooted origins across European
countries.
We claim that none of these decisions were fully rational, in the sense that they were not
really forward-looking. In early democratic settings, electoral pressures pushed liberal elites
to favor franchise extensions even if accompanied by surges in social spending. Cornered by
the Liberals’ electoral success, confessional Conservatives rooted for further electoral exten-
sions that eventually paved the road to entry of labor parties, the leading social spending
35

advocates. This sequence of events can be explained by an accumulation of myopic strategies
designed to maximize the probability of reaching (or keeping) office today at any (future)
cost. Specifically, blinded by the perks of public office, the leaders of the incipient political
machines leaded the expansion of the fiscal (and democratic) state while imputing its costs
to the younger aristocratic cohorts. Had the early political parties been more organized and
capable to internalize the fiscal costs of electoral competition, the fiscal state as we know
it today might have never emerged. Our analysis unveils political myopia as a critical and
largely overlooked mechanism behind the origins of the fiscal state.
Our findings have a number of significant implications for our understanding of the demo-
cratic class struggle. First, we add to an emerging chorus questioning the notion that democ-
racy and state capacity emerged as a response to the revolutionary threat by the poor. In
our analysis, the story of the development of the modern fiscal state is one about intra-elite
struggles where short-term strategic partisan considerations play a prominent role. The
poor only enter the game at the end, and in part, thanks to myopic strategic decisions by
conservative elites. Second, our findings highlight the advantages of relaxing assumptions
of perfect rationality by key political actors over the long run. Such a prior, dominant in
the literature so far, seems inconsistent with the nature of party organizations throughout
most of the period of interest. Parties today do serve as inter-temporal coordination devices,
as institutions that help solve commitment problems across generations. Parties and party
systems throughout XIX and early XX century Europe were much less developed a set of
organizational structures, therefore far less capable of playing a role as a commitment de-
vice. As a result, elites are bounded to focus more on the short-run consequences of their
actions, adjust flexibly to a rapidly changing context, and fail to foresee some of their unin-
tended consequences. Introducing this premise while keeping a rationalist framework opens
up ways to unveil important political mechanisms behind the origins of fiscal capacity and
design of fiscal states, as well as to understand the coalitional logic behind the fiscal design
of different states. Finally, our analysis point to the roots of the coalitional logic behind
36

states that vary in both size and progressivity. Our findings suggest that in those countries
where Conservatives pushed for the extension of franchise at the onset of era of mass poli-
tics, Christian Democracy became a crucial, if not hegemonic, conservative force with well
known consequences for the process of welfare state formation.58 In those countries were
Conservatives did not follow such a strategy, Liberals and Conservatives ultimately merged
on the right side of the spectrum and conflicts over redistributive issues became starker. In
future research we plan to investigate how these colational legacies shaped the origins of
progressivity across democracies.
58Esping-Andersen 1990; Huber, Ragin and Stephens 1993; Mares 2003.
37

References
Acemoglu, Daron and James A. Robinson. 2000. “Why Did the West Extend the Franchise?Democracy, Inequality, and Growth in Historical Perspective.” The Quarterly Journal ofEconomics 115(4):1167–1199.
Acemoglu, Daron and James A. Robinson. 2006. “Economic Backwardness in PoliticalPerspective.” American Political Science Review 100(1):115–131.
Acemoglu, Daron, Suresh Naidu, Pascual Restrepo and James A. Robinson. 2013. “Democ-racy, Redistribution and Inequality.” Manuscript .
Adsera, Alicia and Carles Boix. 2002. “Trade, Democracy, and the Size of the Public Sector:The Political Underpinnings of Openness.” International Organization 56(2):229–262.
Aidt, Toke S., Jayasri Dutta and Elena Loukoianova. 2006. “Democracy comes to Eu-rope: Franchise extension and fiscal outcomes 1830-1938.” European Economic Review50(2):249–283.
Aidt, Toke S., Martin Daunton and Jayasri Dutta. 2010. “The Retrenchment Hypothe-sis and the Extension of the Franchise in England and Wales.” The Economic Journal120(547):990–1020.
Aidt, Toke S. and Peter Jensen. 2013. “Democratization and the size of government: evidencefrom the long 19th century.” Public Choice 157(3-4):511–542.
Aidt, Toke S. and Peter S. Jensen. 2014. “Workers of the world, unite! Franchise extensionsand the threat of revolution in Europe, 1820-1938.” European Economic Review 72(0):52–75.
Ansell, Ben and David Samuels. 2014. Inequality and Democratization: An Elite-CompetitionApproach. New York: Cambridge University Press.
Ansell, Ben and Johannes Lindvall. 2013. “The Political Origins of Primary EducationSystems: Ideology, Institutions, and Interdenominational Conflict in an Era of Nation-Building.” American Political Science Review 107:505–522.
Banks, Arthur S. and Kenneth A. Wilson. 2010. Cross-National Time-Series Data Archive.Jerusalem: Databanks International.
Bartolini, Stephano. 2000. The Class Cleavage. The electoral Mobilisation of the EuropeanLeft 1880-1980. New York: Cambridge University Press.
Beck, Nathaniel and Jonathan N. Katz. 2011. “Modeling Dynamics in Time-SeriesCross-Section Political Economy Data.” Annual Review of Political Science 14(1):331–352.
Beck, Nathaniel, Jonathan N. Katz and Richard Tucker. 1998. “Beyond Ordinary Logit:Taking Time Seriously in Binary Time-Series-Cross-Section Models.” American Journalof Political Science 42(4):1260–88.
38

Beramendi, Pablo and David Rueda. 2007. “Social Democracy Constrained: Indirect Taxa-tion in Industrialized Democracies.” British Journal of Political Science 37:619–641.
Berger, Helge and Mark Spoerer. 2001. “Economic Crises and the European Revolutions of1848.” The Journal of Economic History 61(2):293–326.
Berman, Sheri E. 2001. “Modernization in Historical Perspective. The Case of ImperialGermany.” World Politics 53(3):431–62.
Besley, Timothy. and Torsten Persson. 2011. Pillars of Prosperity: the Political Economicsof Development Clusters. Princenton: Princeton University Press.
Boix, Carles. 1999. “Setting the Rules of the Game. The Choice of Electoral Systems inAdvanced Democracies.” American Political Science Review 93(3):609–624.
Boix, Carles. 2003. Democracy and Redistribution. New York: Cambridge University Press.
Bourguignon, Francois and Christian Morrisson. 2002. “Inequality among World Citizens:1820-1992.” American Economic Review 92(4):727–744.
Box-Steffensmeier, Janet M. and Bradford S. Jones. 2004. Event History Modeling. NewYork Cambridge University Press.
Calvo, Ernesto. 2009. “The Competitive Road to Proportional Representation. PartisanBiases and Electoral Regime Change under Increasing Party Competition.” World Politics61(2):254–295.
Caramani, Daniele. 2004. The Nationalization of Politics. New York: Cambridge UniversityPress.
Carpentier, Vincent. 2001. Systeme educatif et performances economiques au Royaume-Uni:19eme et 20eme siecles. Paris: Logiques Economiques.
Carter, David B. and Curtis S. Signorino. 2010. “Back to the Future: Modeling TimeDependence in Binary Data.” Political Analysis 18(3):271–292.
Cirone, Alexandra. 2015. “Dual Mandates, Patronage, and Partisanship in the French ThirdRepublic.” Working Paper .
Cox, Gary W. 1987. The Efficient Secret. The Cabinet and the developiment of PoliticalParties in Victorian England. New York: Cambridge University Press.
Daunton, Martin. 2001. Trusting Leviathan: the Politics of Taxation in Britain, 1799-1914.New York: Cambridge University Press.
Dincecco, Mark. 2011. Political Transformations and Public Finances: Europe, 1650-1913.Cambridge University Press.
Dincecco, Mark and Mauricio Prado. 2014. Tax to GDP ratios: 1870-2012. Global Priceand Income History Group.
39

Dixit, Avinash and John Londregan. 1996. “The Determinants of Success of Special Interestsin Redistributive Politics.” Journal of Politics 58:1132–1155.
Esping-Andersen, Gøsta. 1985. Politics against Markets. New Jersey: Princeton UniversityPress.
Esping-Andersen, Gøsta. 1990. Three Worlds of Welfare Capitalism. Cambridge: PolityPress.
Flora, Peter. 1974. Modernisierungsforschung: Zur empirischen Analyse dergesellschaftlichen Entwicklung. Opladen: Westdeutscher Verlag.
Flora, Peter, Franz Kraus and Winfried Pfenning. 1983. State, Economy, and Society inWestern Europe 1815-1975. London: Macmillan Press.
Haapala, Pertti. 1987. “How was the working class formed? The case of Finland, 1850-1920.”Scandinavian Journal of History 12(3):179–197.
Harding, Robin and David Stasavage. 2014. “What Democracy Does (and Doesnt Do) forBasic Services: School Fees, School Inputs, and African Elections.” Journal of Politics76:229–245.
Hintze, Otto. 1975. The historical essays of Otto Hintz. New York: Oxford University Press.
Hiscox, Michael. 2002. International Trade and Political Conflict. Commerce, Coalitions,and Mobility. Princeton University Press.
Huber, Evelyne, Charles Ragin and John D. Stephens. 1993. “Social Democracy, Chris-tian Democracy, Constitutional Structure, and the Welfare State.” American Journal ofSociology 99(3):711–749.
Husted, Thomas A. and Lawrence W. Kenny. 1997. “The Effect of the Expansion of theVoting Franchise on the Size of Government.” Journal of Political Economy 105(1):pp.54–82.
Jutikkala, Eino. 1960. “Political Parties in the Elections of Deputies to the Estate ofBurgesses and the Estate of Farmers in the Finnish Diet of Estates.” Proceedings of theFinnish Academy of Science and Letters pp. 167–184.
Kalyvas, Stathis. 1996. The Rise of Christian Democracy in Europe. New York: CornellUniversity Press.
Katz, Richard S. and Peter Mair. 1995. “Changing Models of Party Organization and PartyDemocracy: The Emergence of the Cartel Party.” Party Politics 1(1):5–28.
Kim, Wonik. 2007. “Social Insurance Expansion and Political Regime Dynamics in Europe,1880-1945.” Social Science Quarterly 88(2):494–514.
40

Kirchheimer, Otto. 1966. The Transformation of Western European Party Systems. InPolitical Parties and Political Development, ed. Joseph LaPalombara and Myron Weiner.Princeton: Princeton University Press.
Lake, David A. and Matthew A. Baum. 2001. “The Invisible Hand of Democracy.” Com-parative Political Studies 34(6):587–621.
Lindert, Peter H. 2004. Growing Public: Social Spending and Economic Growth since theEighteenth Century. New York: Cambridge University Press.
Lipset, Seymour M. and Stein Rokkan. 1967. Party systems and voter alignments: Cross-national perspectives. Toronto: The Free Press.
Lizzeri, Alessandro and Nicola Persico. 2004. “Why Did the Elites Extend the Suffrage?Democracy and the Scope of Government.” Quarterly Journal of Economics 119(2):705–763.
Maddison, Angus. 2007. Contours of the World Economy 1-2030 AD: Essays in Macro-Economic History. Oxford University Press.
Mares, Isabela. 2003. The Politics of Social Risk. Business and Welfare State Development.New York: Cambridge University Press.
Mares, Isabela. 2015. From open secrets to secret ballots: The adoption of electoral reformsprotecting voters against intimidation. New York: Cambridge University Press.
Mares, Isabela and Didac Queralt. 2015. “The Non-Democratic Origins of Income Taxation.”Comparative Political Studies .
Michels, Robert. 1911. Political Parties: A Sociological Study of the Oligarchical Tendenciesof Modern Democracy. 1962 ed. New York: Collier Books.
Mommsen, Wolfgang J . 1986. “Britain and Germany 1800 to 1914, two developmental pathstowards industrial society.” Annual Lecture, German Historical Institute of London.
Mylly, Juhani. 2008. “The emergence of the Finnish Multi-Party System.” ScandinavianJournal of History 4(1):277–293.
Nohlen, Dieter and Philip Stover. 2010. Elections in Europe. Baden-Baden: Nomos.
van Kersbergen, Kees. 1995. Social Capitalism: A study of Christian Democracy and theWelfare State. London: Routledge.
Pincus, Steven C.A. and James A. Robinson. 2011. “What Really Happened During theGlorious Revolution?” NBER Working Papers 17206.
Przeworski, Adam. 2013. “Political Institutions and Political Events (PIPE) Data Set.”Departament of Politics. New York University .
41

Przeworski, Adam and John Sprague. 1986. Paper Stones: A History of Electoral Socialism.Chicago: Chicago University Press.
Queralt, Didac. 2015. “From Mercantilism to Free Trade: A History of Fiscal CapacityBuilding.” Quarterly Journal of Political Science 10(2):221–273.
Sabine, B.E.V. 1966. A History of the Income Tax. London: George Allen & Unwin LTD.
Sarkees, Meredith Reid and Frank Wayman. 2010. Resort To War. CQ Press.
Scavo, Jordan, Jutta Bolt and Peter Lindert. 2014. Nominal National Product in WesternEurope since Earliest data. Government Budget Historical Series.
Scheve, Kenneth and David Stasavage. 2010. “The Conscription of Wealth: Mass Warfareand the Demand for Progressive Taxation.” International Organization 64(4):529–561.
Scheve, Kenneth and David Stasavage. 2012. “Democracy, War, and Wealth: Lessons fromTwo Centuries of Inheritance Taxation.” American Political Science Review 106:81–102.
Seligman, Edwin R.A. 1911. The Income Tax: a Study of the History, Theory and Practiceof Income Taxation at Home and Abroad. 2004 ed. New York: Macmillan Press.
Shayo, Moses. 2009. “A Model of Social Identity with an Application to Political Economy:Nation, Class, and Redistribution.” American Political Science Review 103:147–174.
Steinmetz, George. 1993. Regulating the Social: The Welfare State and Local Politics inImperial Germany. New Jersey: Princeton University Press.
Sternberger, Dolf, Bernhard Vogel and Dieter Nohlen. 1969. Die Wahl der Parlamente undanderer Staatsorgane: Ein Handbuch. Band I: Europa. Berlin: Walter de Gruyter & Co.
Ticchi, Davide and Andrea Vindigni. 2008. “War and Endogenous Democracy.” IZA Dis-cussion paper 3397.
Tilly, Charles. 1990. Coercion, Capital, and European States. Cambridge: Basil Blackwell.
Timmons, Jeffrey F. 2005. “The Fiscal Contract: States, Taxes, and Public Services.” WorldPolitics 57:530–567.
Traugott, Mark. 1983. “The Mid-Nineteenth-Century Crisis in France and England.” Theoryand Society 12(4):455–468.
Vanhanen, Tatu. 2003. Democratization: A Comparative Analysis of 170 Countries. NewYork: Routledge.
Ziblatt, Daniel. 2008. “Does Landholding Inequality Block Democratization.” World Politics60(4):610–41.
42

Table 1: Policy Preferences
Conservatives Liberals LaborFranchise Low Medium HighSocial Spending Low Low HighTaxation Low, direct Low, indirect High, direct
43

Table 2: Year of Franchise Extension.
Country First Election Franchise ExtensionsBelgium 1831 1848,1893,1919, 1948Denmark 1849 1915Finland 1869 1906France 1820 1830, 1848, 1945Germany 1871 1919Italy 1861 1882, 1912, 1946Netherlands 1849 1887,1894, 1917, 1922Norway 1884 1897, 1907, 1913Sweden 1866 1907, 1919United Kingdom 1832 1867, 1884, 1918, 1928Women’s universal suffrage in italics. Source: Przeworski 2013 and Aidt andJensen 2013.
44
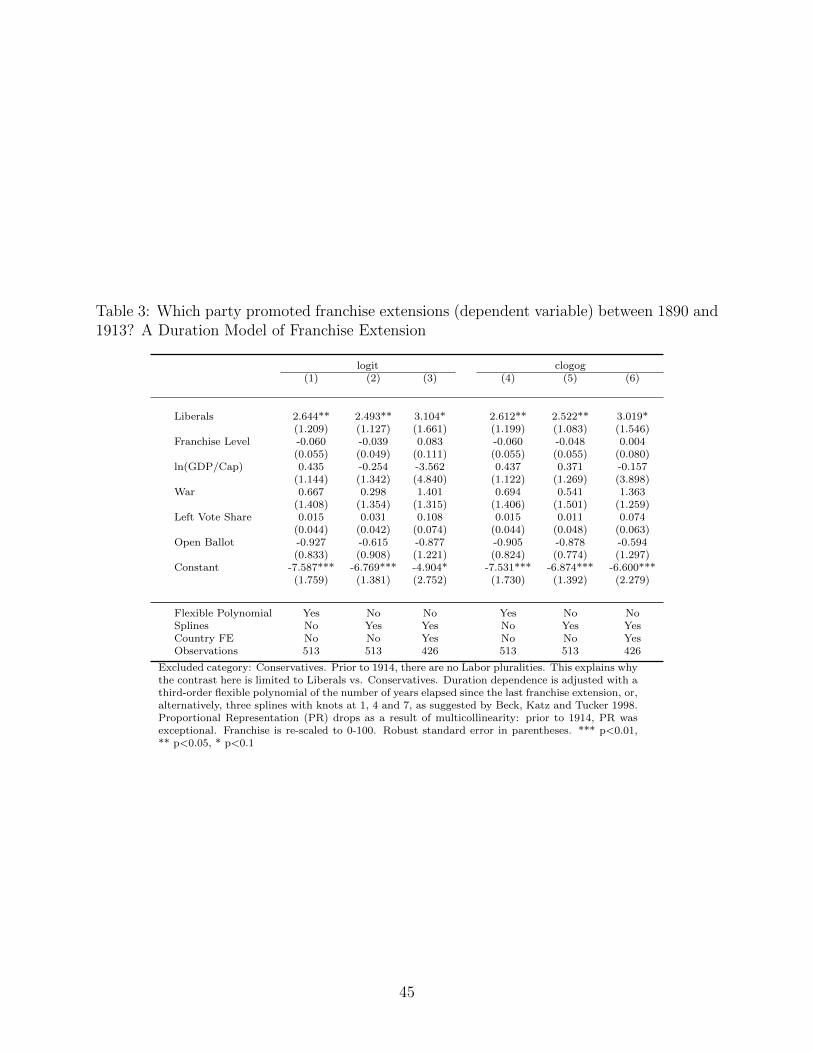
Table 3: Which party promoted franchise extensions (dependent variable) between 1890 and1913? A Duration Model of Franchise Extension
logit clogog(1) (2) (3) 4 (4) (5) (6)
Liberals 2.644** 2.493** 3.104* 2.612** 2.522** 3.019*(1.209) (1.127) (1.661) (1.199) (1.083) (1.546)
Franchise Level -0.060 -0.039 0.083 -0.060 -0.048 0.004(0.055) (0.049) (0.111) (0.055) (0.055) (0.080)
ln(GDP/Cap) 0.435 -0.254 -3.562 0.437 0.371 -0.157(1.144) (1.342) (4.840) (1.122) (1.269) (3.898)
War 0.667 0.298 1.401 0.694 0.541 1.363(1.408) (1.354) (1.315) (1.406) (1.501) (1.259)
Left Vote Share 0.015 0.031 0.108 0.015 0.011 0.074(0.044) (0.042) (0.074) (0.044) (0.048) (0.063)
Open Ballot -0.927 -0.615 -0.877 -0.905 -0.878 -0.594(0.833) (0.908) (1.221) (0.824) (0.774) (1.297)
Constant -7.587*** -6.769*** -4.904* -7.531*** -6.874*** -6.600***(1.759) (1.381) (2.752) (1.730) (1.392) (2.279)
Flexible Polynomial Yes No No Yes No NoSplines No Yes Yes No Yes YesCountry FE No No Yes No No YesObservations 513 513 426 513 513 426
Excluded category: Conservatives. Prior to 1914, there are no Labor pluralities. This explains whythe contrast here is limited to Liberals vs. Conservatives. Duration dependence is adjusted with athird-order flexible polynomial of the number of years elapsed since the last franchise extension, or,alternatively, three splines with knots at 1, 4 and 7, as suggested by Beck, Katz and Tucker 1998.Proportional Representation (PR) drops as a result of multicollinearity: prior to 1914, PR wasexceptional. Franchise is re-scaled to 0-100. Robust standard error in parentheses. *** p<0.01,** p<0.05, * p<0.1
45

Table 4: Duration Models of Franchise Extension. The Liberal Switch.
(1) (2) (3)
Liberals × Franchise Level -0.104**(0.052)
Liberals × After 1914 -3.853** -3.719*(1.707) (1.993)
Liberals 2.716*** 2.284** 2.591*(0.910) (1.016) (1.340)
Franchise Level 0.033(0.026)
After 1914 3.458*** 2.655**(1.086) (1.336)
ln(GDP/Cap) -0.562 -0.658 -1.564(0.821) (0.844) (1.216)
Open Ballot -0.553 -0.364 -0.815(0.815) (0.857) (1.097)
PR -0.179 -1.124 -0.920(1.445) (1.123) (1.066)
Left Vote Share 0.094*** 0.084*** 0.161***(0.019) (0.023) (0.038)
War 0.640 0.015 0.554(0.733) (0.739) (0.832)
WWI Participant -1.956 -2.136** -3.056**(1.323) (0.912) (1.539)
Constant -6.979*** -7.102*** -6.919***(1.110) (1.299) (2.529)
Duration Dependence Yes Yes YesCountry FE No No YesObservations 700 704 704
Logit link. Excluded category: Conservatives and Labor pluralities. To model durationdependence, models include a third-order flexible polynomial of the number of yearselapsed since the last franchise extension. Countries permanently drop the sample whenthey adopt full franchise. Franchise is rescaled to the interval 0-100. Robust standarderror in parentheses. *** p<0.01, ** p<0.05, * p<0.1
46

Table 5: Duration Models of Franchise Extension. The long-run: 1820-1975.
(1) (2)
Non-Confessional Conservatives×Franchise Level 0.169*** 0.117*(0.055) (0.065)
Confessional Conservatives×Franchise Level 0.103** 0.074(0.050) (0.085)
Labor ×Franchise Level 0.089 0.039(0.057) (0.125)
Non-Confessional Conservatives -5.210*** -5.386***(1.202) (1.716)
Confessional Conservatives -0.665 -2.672(1.033) (2.882)
Labor 0.173 -2.126(2.484) (4.851)
Franchise Level -0.072 0.099(0.050) (0.091)
ln(GDP/Cap -1.136 -3.672(1.039) (2.266)
Left Vote Share 0.089*** 0.189***(0.030) (0.063)
Open Ballot -0.364 -0.207(0.812) (1.215)
PR -1.438 -1.494(1.938) (1.192)
War 1.000 1.345*(0.790) (0.763)
WWI Participant -1.781 -4.722***(1.466) (1.261)
Constant -3.615*** -3.139(1.029) (2.485)
Duration Dependence Yes YesCountry FE No YesObservations 700 700
Logit link. Excluded category: Liberal plurality. Both models include a third-orderflexible polynomial of the number of years elapsed since the last franchise extension.Countries permanently drop the sample when they adopt full franchise. Franchise isrescaled to the interval 0-100. Robust standard error in parentheses. *** p<0.01, **p<0.05, * p<0.1
47
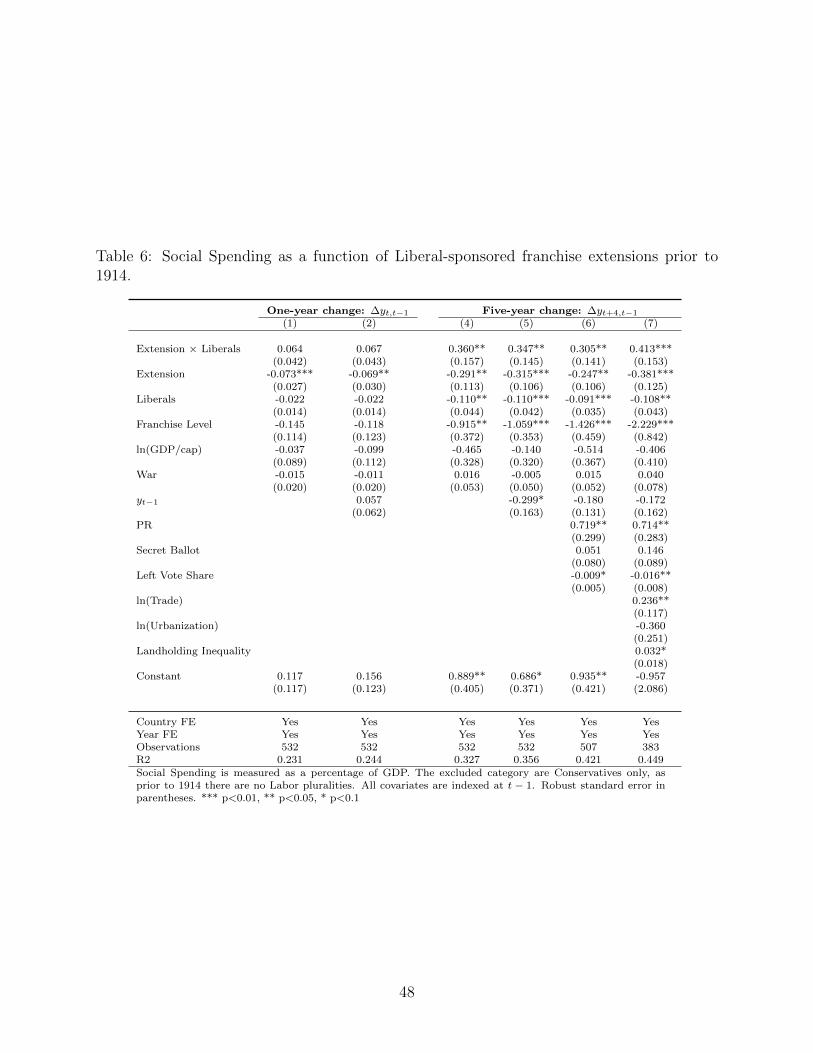
Table 6: Social Spending as a function of Liberal-sponsored franchise extensions prior to1914.
One-year change: ∆yt,t−1 Five-year change: ∆yt+4,t−1
(1) (2) 3 (4) (5) (6) (7)
Extension × Liberals 0.064 0.067 0.360** 0.347** 0.305** 0.413***(0.042) (0.043) (0.157) (0.145) (0.141) (0.153)
Extension -0.073*** -0.069** -0.291** -0.315*** -0.247** -0.381***(0.027) (0.030) (0.113) (0.106) (0.106) (0.125)
Liberals -0.022 -0.022 -0.110** -0.110*** -0.091*** -0.108**(0.014) (0.014) (0.044) (0.042) (0.035) (0.043)
Franchise Level -0.145 -0.118 -0.915** -1.059*** -1.426*** -2.229***(0.114) (0.123) (0.372) (0.353) (0.459) (0.842)
ln(GDP/cap) -0.037 -0.099 -0.465 -0.140 -0.514 -0.406(0.089) (0.112) (0.328) (0.320) (0.367) (0.410)
War -0.015 -0.011 0.016 -0.005 0.015 0.040(0.020) (0.020) (0.053) (0.050) (0.052) (0.078)
yt−1 0.057 -0.299* -0.180 -0.172(0.062) (0.163) (0.131) (0.162)
PR 0.719** 0.714**(0.299) (0.283)
Secret Ballot 0.051 0.146(0.080) (0.089)
Left Vote Share -0.009* -0.016**(0.005) (0.008)
ln(Trade) 0.236**(0.117)
ln(Urbanization) -0.360(0.251)
Landholding Inequality 0.032*(0.018)
Constant 0.117 0.156 0.889** 0.686* 0.935** -0.957(0.117) (0.123) (0.405) (0.371) (0.421) (2.086)
Country FE Yes Yes Yes Yes Yes YesYear FE Yes Yes Yes Yes Yes YesObservations 532 532 532 532 507 383R2 0.231 0.244 0.327 0.356 0.421 0.449Social Spending is measured as a percentage of GDP. The excluded category are Conservatives only, asprior to 1914 there are no Labor pluralities. All covariates are indexed at t − 1. Robust standard error inparentheses. *** p<0.01, ** p<0.05, * p<0.1
48

Table 7: Financing Electorally-driven Social Spending prior to 1914.
Change in Direct Taxation Change in Indirect Taxation(1) (2) (3) 4 (4) (5) (6)
Expansion × Liberals -0.589 -4.779 -5.412* 3.632** 4.573*** 5.744***(3.785) (2.949) (2.890) (1.819) (1.728) (1.828)
Extension -0.413 3.946** 4.546*** -2.751** -3.614*** -4.561***(2.935) (1.576) (1.675) (1.283) (1.111) (1.345)
Liberals 0.811 1.303* 0.442 -0.305 -0.337 -0.259(0.622) (0.692) (0.728) (0.435) (0.501) (0.516)
ln(GDP/cap) 5.753 4.483 3.757 -2.466 -3.053 1.241(3.815) (4.465) (5.863) (2.706) (3.216) (3.651)
War 0.076 0.045 -1.769 0.860 0.832 2.083*(1.362) (1.284) (1.718) (0.853) (0.867) (1.183)
yt−1 -0.053 -0.026 -0.267*** -0.221*** -0.218*** -0.356***(0.043) (0.050) (0.096) (0.047) (0.053) (0.078)
PR -1.949 -0.392 0.433 1.094(2.499) (2.906) (1.537) (1.602)
Secret Ballot 0.875 -0.569 0.213 1.720**(0.941) (1.078) (0.668) (0.752)
Left Vote Share 0.159 0.289 -0.013 -0.105(0.121) (0.182) (0.060) (0.085)
ln(Trade) -2.042 3.140**(1.891) (1.447)
ln(Urbanization) 6.308* -3.631(3.694) (2.743)
Landholding Inequality -0.966*** 0.384**(0.310) (0.158)
Constant -4.024 -5.029 51.068* 8.053*** 8.499** -24.461(4.539) (5.313) (30.801) (3.076) (3.460) (21.421)
Observations 457 433 326 491 467 355Country FE Yes Yes Yes Yes Yes YesYear FE Yes Yes Yes Yes Yes YesR2 0.446 0.469 0.478 0.379 0.388 0.393
Both dependent variables are expressed in percentage points of total tax revenue. They refer to five-yearchanges: ∆yt+4,t−1, in the spirit of Table 6 results. The excluded category is Conservatives, as priorto 1914 there were no Labor pluralities. All covariates are indexed at t − 1. Robust standard error inparentheses. *** p<0.01, ** p<0.05, * p<0.1
49

Table 8: Social Spending and Tax Revenue in the Long-Run. Labor’s Opportunity ToImplement a Progressive Agenda.
Social Spending (% GDP) Tax Revenue (% GDP)LDV ADL ADL LDV ADL ADL(1) (2) (3) (4) (5) (6)
Labor × Franchise Level 2.304*** 1.787*** 1.817** 4.729*** 4.898*** 3.627**(0.837) (0.682) (0.725) (1.332) (1.571) (1.541)
Franchise Level 0.138 0.337 0.296 -1.115** 0.765 1.025(0.255) (0.475) (0.519) (0.436) (0.939) (0.939)
Labor -1.110** -0.813** -0.794** -2.436*** -2.841*** -2.138**(0.443) (0.372) (0.403) (0.758) (0.924) (0.907)
PR -0.016 -0.032 0.016 0.215 0.091 0.301(0.110) (0.064) (0.068) (0.169) (0.225) (0.197)
Secret Ballot 0.109 0.091 0.098 0.104 -0.128 -0.008(0.087) (0.071) (0.071) (0.101) (0.184) (0.198)
ln(GDP/cap) -0.406 -2.022*** -1.920*** -1.400*** -4.399*** -3.728**(0.259) (0.689) (0.725) (0.445) (1.518) (1.628)
War -0.009 0.020 0.010 0.339 0.184 0.198(0.098) (0.090) (0.100) (0.285) (0.282) (0.312)
WW Participant 0.052 -0.078 0.023 0.021 -0.030 0.136(0.203) (0.111) (0.123) (0.208) (0.221) (0.255)
ln(Urbanization) 0.005 1.859 1.915 -0.153 -4.875* -4.615(0.156) (1.200) (1.225) (0.252) (2.949) (2.984)
ln(Trade) 0.095 -0.135 -0.135 0.199 0.801**(0.120) (0.214) (0.209) (0.200) (0.405) (0.376)
Landholding inequality -0.019 0.559**(0.104) (0.232)
Constant 0.057 1.506 2.074* 2.650 3.161 7.258***(1.600) (1.088) (1.151) (2.017) (2.020) (2.375)
First Lag of the Dependent Variable Yes Yes Yes Yes Yes YesFist Lag of all Controls No Yes Yes No Yes YesCountry FE Yes Yes Yes Yes Yes YesYear FE Yes Yes Yes Yes Yes YesObservations 946 921 851 947 922 852R2 0.978 0.989 0.989 0.976 0.978 0.978
LDV: Lagged-Dependent Variable model. ADL: Autoregressive Distributed Lag model. Both dependent vari-ables are measured in levels. The excluded categories are Conservatives and Liberals. Robust standard error inparentheses. *** p<0.01, ** p<0.05, * p<0.1
50

Figure 1: Trends in Social Spending, Franchise, Land Inequality and Tax Revenue in WesternEurope since 1822. Refer to Table S-4 for a colorblind version, and to Table S-5 for a replicathat includes a series of Income Inequality.
050
100
050
100
050
100
1800 1850 1900 1950 2000 1800 1850 1900 1950 2000
1800 1850 1900 1950 2000 1800 1850 1900 1950 2000
Belgium Denmark Finland France
Germany Italy Netherlands Norway
Sweden United Kingdom
Franchise Social Spending as % of GDPLand Inequality Tax Revenue as % of GDP
51

Figure 2: Share of Direct Taxes to Total Tax Revenue. Lowess line added. Vertical dottedline indicates World War I onset. Data source: Flora, Kraus and Pfenning 1983.
050
100
050
100
050
100
1800 1850 1900 1950 2000 1800 1850 1900 1950 2000
1800 1850 1900 1950 2000 1800 1850 1900 1950 2000
Belgium Denmark Finland France
Germany Italy Netherlands Norway
Sweden United Kingdom
52

Period 1
Nature
Liberals
−tl
note
b− tme
1-p
Conservatives
b− tl
note
−tm
e
p
Period 2
Nature
Liberals
b− tm
note
b− th
e
1-q
Conservatives
−tmnote
b− th
e
q
Figure 3: Decision Tree
53

Figure 4: Marginal Effect of Liberal Parliamentary Plurality on the Likelihood of FranchiseExtension before and after 1914. Estimates drawn from column 2 in Table 4.
-.3-.2
-.10
.1.2
Mar
gina
l Effe
ct o
f Lib
eral
Plu
ralit
y on
Fra
nchi
se E
xten
sion
Before 1914 After 1914
54

Figure 5: Franchise Extensions in the Long-Run by Parliament Plurality.
-.50
.51
1.5
-.50
.51
1.5
0 20 40 60 0 20 40 60
Labor Liberals
Confessional Conservatives Non-Confessional Conservatives
Prob
abilit
y of
Fra
nchi
se E
xten
sion
Franchise Level
55

Figure 6: Change in Social Spending as a function of a Liberal-sponsored franchise extensionprior to 1914. Estimates drawn from column 4 in Table 6.
-.20
.2.4
.6C
hang
e in
Soc
ial S
pend
ing
as %
of G
DP
0 1.5 1.5Franchise Extension
56

Figure 7: Change in Regressive Taxation as a function of a Liberal-sponsored franchiseextension prior to 1914. Estimates drawn from column 5 in Table 7.
-20
24
6C
hang
e in
Exc
ises
as
% o
f Tax
Rev
enue
0 1Franchise Extension
57

Figure 8: Social Spending and Tax Revenue in the Long-Run as a function of Labor Par-liamentary Plurality. Since Labor is competitive when franchise is advanced, only mid- tofull-franchise values are plotted on the horizontal axis.
3.5
44.
55
Soci
al S
pend
ing
as %
of G
DP
.4 .5 .6 .7franchise
Labor Plurality = 0 Labor Plurality = 1
(a) Social Spending as % of GDP
10.5
1111
.512
12.5
Tax
Rev
enue
as
% o
f GD
P
.4 .5 .6 .7franchise
Labor Plurality = 0 Labor Plurality = 1
(b) Tax Revenue as % of GDP
58
Supplementary Material i
The Supplementary Material expands the data collection strategy for selected variables.
For the remaining variables, refer to the main text.
Social spending. We limit the attention to 10 Western European economies for which we
have been able to recollect social (and other types of) expenditure at the central government
level. The main data source for this series is Flora, Kraus and Pfenning 1983, who coded
spending in housing, social services and education. These data are provided in nominal
values. To normalize it, we have used nominal GDP values from Scavo, Bolt and Lindert
2014 compendium, accessible at the Global Price and Income History Group. The data is
completed for the UK with central government education spending data from Carpentier
2001 for the period 1830-1890, also made available by the Global Price and Income History
Group. For Germany, we did not code central government spending but general government
spending. Once the social spending to GDP series were ready, we interpolated the data. We
also considered multiple imputation. Amelia II estimates proved systematically upwardly
biased for all panels. This was due to the high degree of data missingness in the original
series. Figure S-1 plots the original and interpolated series. As manifest in Figure S-1, the
actual coverage of these series varies by country. Table S-1 reports the first and last year for
which we have data for each country. All series end in 1975, coinciding with the heydays of
the welfare state, but truly constrained by Flora, Kraus and Pfenning 1983 data.
Tax Revenue. Nominal tax revenue data is drawn from Flora, Kraus and Pfenning 1983.
To compute its share to GDP, we use nominal GDP values from Scavo, Bolt and Lindert
2014 compendium. We adjusted the order of magnitude of the resulting ratio to fit it within
the 0-100 interval. These series goes back as far as 1822.
Franchise. This variable is computed as the ratio of eligible electors (Flora, Kraus and
Pfenning, 1983; Nohlen and Stover, 2010) to total population (Maddison, 2007). Franchise
extensions are drawn from Aidt and Jensen 2014 and Przeworski 2013. Both franchise level

Supplementary Material ii
and extensions are plotted in Figure S-2. Average franchise level per period (intial conditions,
pre-WWI, and long-term) is plotted in Figure S-3.
Parliamentary Plurality. Parliamentary plurality is coded step-wise. First, we code
party seat shares in the National Parliament from Flora, Kraus and Pfenning 1983, Nohlen
and Stover 2010, Sternberger, Vogel and Nohlen 1969, and Rois & Presidents. Second,
we classified parties in three larger families: Conservative (or traditionalist), Liberals (or
reformers), and Labor (or radicals). The information for the ideological stand of each party
is drawn from multiple sources: Bartolini 2000, Caramani 2004, Kalyvas 1996, country
experts such as Alberto Penades (Italy), and general open sources, such as Wikipedia, for
party name identification. For the Finnish Diet, based on Haapala 1987, Jutikkala 1960 and
Mylly 2008, we classified the Nobility and Burghers estates as Conservatives, and the Clergy
and Peasant estates as reformers (Liberals). Third, for each parliamentary session, we pooled
all parties from the same ideological family and identified the one having the largest share of
seats (i.e. the plurality). Figure S-6 plots the evolution of the three main ideological families:
Conservatives, Liberals and Labor. Aware of the Conservative split between religious and
non-religious parties, we repeated the same steps assuming four ideological families instead
of three: Liberals, confessional Conservatives, non-confessional Conservatives and Labor.

Supplementary Material iii
Figure S-1: Social Spending. Original data points and interpolated series from Earliest Datato 1975.
010
2030
010
2030
010
2030
1800 1850 1900 1950 2000 1800 1850 1900 1950 2000
1800 1850 1900 1950 2000 1800 1850 1900 1950 2000
Belgium Denmark Finland France
Germany Italy Netherlands Norway
Sweden United Kingdom
Soci
al S
pend
ing
as %
of G
DP

Supplementary Material iv
Figure S-2: Franchise (as share of total population) and Franchise Extensions (vertical lines).0
.2.4
.6.8
Fran
chis
e
1825185018751900192519501975
Belgium
0.2
.4.6
.8Fr
anch
ise
1825185018751900192519501975
Denmark
0.2
.4.6
.8Fr
anch
ise
1825185018751900192519501975
Finland
0.2
.4.6
Fran
chis
e
1825185018751900192519501975
France
.2.3
.4.5
.6.7
Fran
chis
e
1825185018751900192519501975
Germany
0.2
.4.6
.8Fr
anch
ise
1825185018751900192519501975
Italy
0.2
.4.6
.8Fr
anch
ise
1825185018751900192519501975
Netherlands
0.2
.4.6
.8Fr
anch
ise
1825185018751900192519501975
Norway
0.2
.4.6
.8Fr
anch
ise
1825185018751900192519501975
Sweden
0.2
.4.6
.8Fr
anch
ise
1825185018751900192519501975
United Kingdom

Supplementary Material v
Figure S-3: Average Franchise for three periods: before 1870, 1870-1914, and after 1914.
020
4060
80To
tal P
opul
atio
n En
title
d to
Vot
e (%
)
<1870 1870-1914 >1914

Supplementary Material vi
Figure S-4: Colorblind version of Figure 1. Trends in Social Spending, Franchise, LandInequality and Tax Revenue in Western Europe since 1822.
050
100
050
100
050
100
1800 1850 1900 1950 2000 1800 1850 1900 1950 2000
1800 1850 1900 1950 2000 1800 1850 1900 1950 2000
Belgium Denmark Finland France
Germany Italy Netherlands Norway
Sweden United Kingdom
Franchise Social Spending as % of GDPLand Inequality Tax Revenue as % of GDP

Supplementary Material vii
Figure S-5: Trends in Social Spending, Franchise, Income Inequality and Tax Revenue inWestern Europe since 1822. Source for inequality data: Bourguignon and Morrisson 2002.For other series refer to Supplementary Material.
020
4060
800
2040
6080
020
4060
80
1800 1850 1900 1950 2000 1800 1850 1900 1950 2000
1800 1850 1900 1950 2000 1800 1850 1900 1950 2000
Belgium Denmark Finland France
Germany Italy Netherlands Norway
Sweden United Kingdom
Franchise % Social Spending/GDPInequality % tax/GDP
year

Supplementary Material viii
Figure S-6: Party Seat Shares from Earliest Data to 1975.
050
100
050
100
050
100
1800 1850 1900 1950 2000 1800 1850 1900 1950 2000
1800 1850 1900 1950 2000 1800 1850 1900 1950 2000
Belgium Denmark Finland France
Germany Italy Netherlands Norway
Sweden United Kingdom
Conservative Seat Share Liberal Seat ShareLabor Seat Share
year
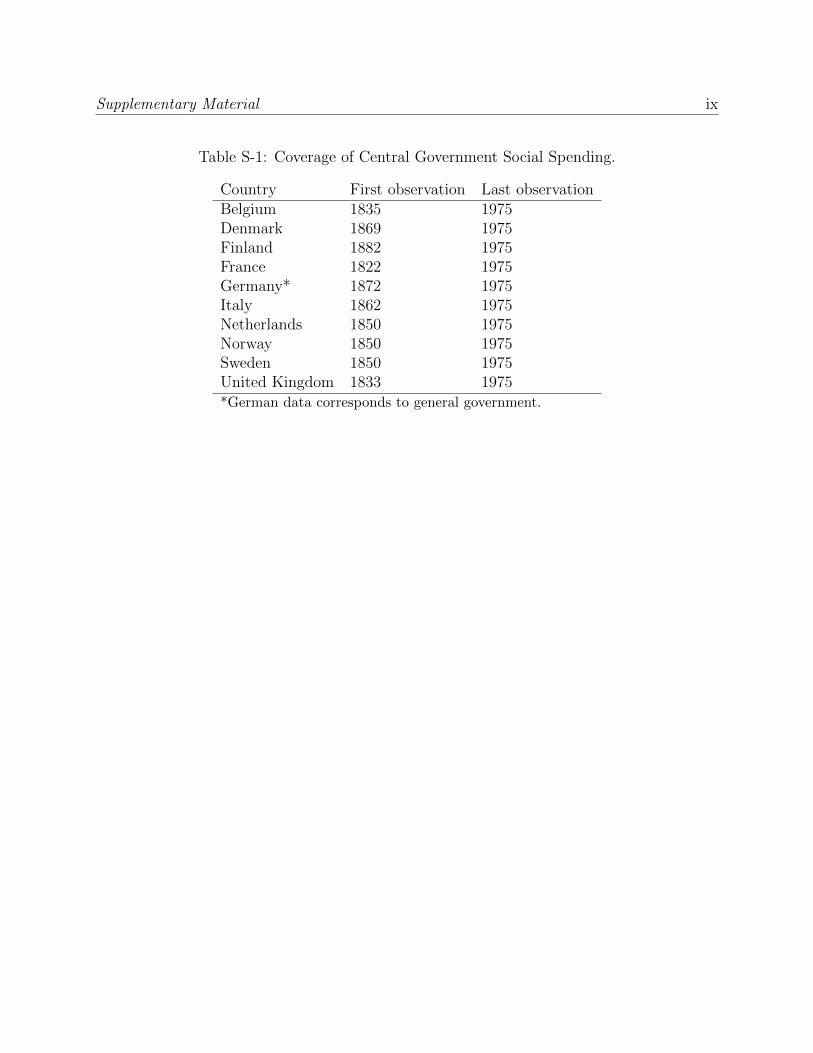
Supplementary Material ix
Table S-1: Coverage of Central Government Social Spending.
Country First observation Last observationBelgium 1835 1975Denmark 1869 1975Finland 1882 1975France 1822 1975Germany* 1872 1975Italy 1862 1975Netherlands 1850 1975Norway 1850 1975Sweden 1850 1975United Kingdom 1833 1975*German data corresponds to general government.

Supplementary Material x
Table S-2: Sensibility Analysis: Social Spending as a function of Liberal-sponsored franchiseexpansions prior to 1914 with different time spells. This Supplementary Material replicatesthe analysis in Table 6 considering alternative time windows of social spending: four and sixyears instead of four.
Four year leads ∆yt+3,t−1 Six year leads: ∆yt+5,t−1
(1) (2) 3 (3) (4)
Extension×Liberals 0.146 0.196* 0.743* 0.593(0.117) (0.116) (0.407) (0.401)
Extension -0.193** -0.224** -0.487*** -0.315**(0.093) (0.096) (0.167) (0.125)
Liberals -0.088** -0.067** -0.119*** -0.108***(0.039) (0.032) (0.045) (0.039)
yt−1 -0.181 -0.090 -0.416** -0.265*(0.158) (0.130) (0.170) (0.136)
Franchise Level -0.832** -1.103*** -1.349*** -1.664***(0.329) (0.403) (0.424) (0.523)
ln(GDP/cap) -0.126 -0.442 0.024 -0.228(0.281) (0.326) (0.385) (0.457)
War -0.028 -0.013 0.202 0.230(0.036) (0.038) (0.155) (0.159)
PR 0.538** 0.886***(0.271) (0.314)
Secret Ballot 0.062 -0.021(0.072) (0.096)
Left Vote Share -0.004 -0.015**(0.004) (0.007)
Constant 0.538 0.729* 0.648 0.793(0.331) (0.375) (0.427) (0.497)
Country FE Yes Yes Yes YesYear Fe Yes Yes Yes YesObservations 532 507 532 507R2 0.307 0.362 0.385 0.448
Social Spending is expressed as a percentage of GDP. The excluded cate-gory is Conservatives, as prior to 1914 there were no Labor plurality. Allcovariates are indexed at t− 1. Robust standard error in parentheses. ***p<0.01, ** p<0.05, * p<0.1