the energy efficiency with climate financere.indiaenvironmentportal.org.in/files/file/plugging the...
TRANSCRIPT

The views expressed in this IEA Insights paper do not necessarily reflect the views or policy of the International Energy Agency (IEA) Secretariat or of its individual member countries. This paper is a work in progress and/or is produced in parallel with or contributing to other IEA work or formal publication; comments are welcome, directed to email [email protected]
© OECD/IEA, 2012
©OEC
D/IEA
2012
Plugging the Energy Efficiency Gap with Climate Finance
The role of International Financial Institutions (IFIs) and the Green Climate Fund to realise the potential of energy efficiency in developing countries
Lisa Ryan
Nora Selmet
André Aasrud
INTERNATIONAL ENERGY AGENCY
The International Energy Agency (IEA), an autonomous agency, was established in November 1974. Its primary mandate was – and is – two-fold: to promote energy security amongst its member countries through collective response to physical disruptions in oil supply, and provide authoritative
research and analysis on ways to ensure reliable, affordable and clean energy for its 28 member countries and beyond. The IEA carries out a comprehensive programme of energy co-operation among its member countries, each of which is obliged to hold oil stocks equivalent to 90 days of its net imports. The Agency’s aims include the following objectives:
n Secure member countries’ access to reliable and ample supplies of all forms of energy; in particular, through maintaining effective emergency response capabilities in case of oil supply disruptions.
n Promote sustainable energy policies that spur economic growth and environmental protection in a global context – particularly in terms of reducing greenhouse-gas emissions that contribute to climate change.
n Improve transparency of international markets through collection and analysis of energy data.
n Support global collaboration on energy technology to secure future energy supplies and mitigate their environmental impact, including through improved energy
efficiency and development and deployment of low-carbon technologies.
n Find solutions to global energy challenges through engagement and dialogue with non-member countries, industry, international
organisations and other stakeholders. IEA member countries:
Australia Austria
Belgium Canada
Czech RepublicDenmark
Finland France
GermanyGreece
HungaryIreland
ItalyJapan
Korea (Republic of)LuxembourgNetherlandsNew Zealand NorwayPolandPortugalSlovak RepublicSpainSwedenSwitzerland
TurkeyUnited Kingdom
United States
The European Commission also participates in
the work of the IEA.
© OECD/IEA, 2012International Energy Agency
9 rue de la Fédération 75739 Paris Cedex 15, France
www.iea.org
Please note that this publication is subject to specific restrictions that limit its use and distribution.
The terms and conditions are available online at http://www.iea.org/termsandconditionsuseandcopyright/

Plugging the energy efficiency gap with climate finance © OECD/IEA 2012
Page | 1
Table of Contents Acknowledgements .......................................................................................................................... 4
Executive Summary .......................................................................................................................... 5
Introduction ...................................................................................................................................... 9 Definitions ............................................................................................................................... 10
Energy efficiency for developing countries ................................................................................... 13 Estimates of energy efficiency finance in developing countries ............................................. 13
Benefits of energy efficiency in developing countries ............................................................ 15
Barriers to energy efficiency finance ....................................................................................... 16
Barriers particularly impacting developing countries ...................................................... 17
Financing vehicles to scale up energy efficiency ..................................................................... 18
Climate finance flows and instruments ......................................................................................... 21 Climate finance: where does the money come from? ............................................................ 21
Climate finance: flows and instruments .................................................................................. 22
Climate finance for energy efficiency in developing countries ..................................................... 25 Carbon finance and energy efficiency ..................................................................................... 25
Financing of energy efficiency projects under CDM ........................................................ 26
CDM Programme of Activities .......................................................................................... 29
Improving PoA and new carbon market mechanisms for EE ........................................... 30
International Financial Institutions: key investors in energy efficiency .................................. 32
Data and methodology .................................................................................................... 33
BFIs’ funding of energy efficiency .................................................................................... 34
MFIs’ funding of energy efficiency ................................................................................... 37
Financing instruments used by IFIs .................................................................................. 42
Estimate of investments in energy efficiency through leverage of IFI funds .................. 46
Estimation of investments in energy efficiency in the developing world ........................ 48
The Green Climate Fund – a new source of funds for energy efficiency? ............................... 49
Context ............................................................................................................................. 49
Sources of funding ........................................................................................................... 49
Use of GCF for energy efficiency ...................................................................................... 50
Shaping the Green Climate Fund to energy efficiency project needs ........................................... 51 Design requirements for EE finance ........................................................................................ 51
Recommendations for the Green Climate Fund ...................................................................... 52
Potential future role of international financial institutions ............................................. 54
Conclusions ..................................................................................................................................... 55
Acronyms and abbreviations ......................................................................................................... 56
© OECD/IEA 2012 Plugging the energy efficiency gap with climate finance
Page | 2
Annex A : Questionnaire sent to development banks .................................................................. 57
Annex B : Initiatives of MDBs to promote EE ................................................................................ 59 ADB .......................................................................................................................................... 59
EBRD ........................................................................................................................................ 59
EIB ............................................................................................................................................ 59
IDB ........................................................................................................................................... 59
WBG ......................................................................................................................................... 60
Annex C : Typology of mitigation activities according to the “Joint Approach” of MDBs on climate mitigation finance ............................................................................................................. 61
References ...................................................................................................................................... 65
List of Figures Figure 1 • World energy‐related CO2 emissions abatement in the 450 scenario relative to the New Policies Scenario .................................................................................................... 10 Figure 2 • Financial instruments by stage of market development................................................ 19 Figure 3 • Climate finance sources ................................................................................................. 21 Figure 4 • Climate finance flows for the year 2010/2011 (USD billion) .......................................... 23 Figure 5 • Share of credits up to 2012 by project type – all active projects, regular CDM ............ 27 Figure 6 • Share of credits up to 2020 by project type, all active projects, regular CDM .............. 28 Figure 7 • Share of credits up to 2012 by project type, all active PoAs .......................................... 29 Figure 8 • Share of energy efficiency projects in climate mitigation finance of 16 BFIs ................ 35 Figure 9 • MDB finance: energy efficiency vs. energy total 2011 (USD million) ............................. 39 Figure 10 • MDBs’ investments in energy efficiency 2008‐2011 (USD million) .............................. 40 Figure 11 • Regional breakdown (in value) of MDB finance for energy efficiency over the period 2008‐2011 .................................................................................................................... 40 Figure 12 • MDBs’ investments: energy efficiency finance and mitigation finance 2011 (USD million) .................................................................................................................. 42 Figure 13 • Credit lines mechanism ................................................................................................ 45
List of Tables Table 1 • Estimation of energy efficiency investments in BRICS countries in 2011 (USD million) . 14 Table 2 • Selected multilateral and bilateral financing sources ..................................................... 33 Table 3 • Energy efficiency sectors for selected MDBs .................................................................. 34 Table 4 • Use of different financial instruments by four BFIs in 2010 (USD millions) .................... 36 Table 5 • Multilateral Development Banks’ energy efficiency finance in 2011 and annual average
(USD million) .................................................................................................................... 38 Table 6 • Estimation of leverage ratios in climate finance by financial instrument ....................... 47 Table 7 • Estimation of leverage effect on IFI EE finance ............................................................... 48
List of Boxes Box 1 • Investment in energy efficiency in Mexico......................................................................... 15 Box 2 • Catalysing Energy Efficiency – the role of policy de‐risking from the experience of UNDP and the GEF. ..................................................................................................................... 20

Plugging the energy efficiency gap with climate finance © OECD/IEA 2012
Page | 3
Box 3 • The UNFCCC Financial Mechanism ..................................................................................... 26 Box 4 • CDM Programme of Activities for sustainable housing in Mexico ..................................... 30 Box 5 • Definition of EE for the purpose of EE finance calculations ............................................... 34 Box 6 • Technical assistance and regulatory framework ................................................................ 43 Box 7 • ESCOs .................................................................................................................................. 46 Box 8 • The Role of the Private Sector in the GCF .......................................................................... 50
© OECD/IEA 2012 Plugging the energy efficiency gap with climate finance
Page | 4
Acknowledgements The main authors of this report are Lisa Ryan of the Energy Efficiency Unit at the International Energy Agency (IEA), Nora Selmet, and Andre Aasrud, both previously of the Climate Change Unit in the Sustainable Technology Policy Directorate of the IEA.
The authors are grateful for the substantive guidance and support given by the Head of the Energy and Environment Division, Philippe Benoit, the Energy Efficiency Unit Head, Robert Tromop, and the previous Head of the Climate Change Unit, Richard Baron. Bo Diczfalusy, previous Director of the Sustainable Technology and Policy Directorate provided leadership and overall encouragement.
We appreciate inputs from Laura Cozzi and Jung Lee of the IEA Directorate of Global Energy Economics (GEE) and Jan Corfee‐Morlot (OECD) and Christa Clapp (previously OECD). Many thanks also to Cecilia Piemonte, Valerie Gaveau, Geraldine Ang, and Julia Kete of the OECD for assisting with access to OECD DAC statistics.
This report would not have been possible without the cooperation of many individuals in international financial institutions, governments and organisations who provided data and information on energy efficiency finance in developing countries. We would especially like to thank the following for their help:
ADB : Aiming Zhou and Pil‐Bae Song AfDB: Sebastian Veit AFD : Pierre Forestier , Christian de Gromard , Ophélie Risler , Mustapha Kleiche BNDES : Alexandre Siciliano Esposito ECREE: David Vilar EBRD : Nigel Jollands and Franka Klingel EIB : Ralf Goldmann HSBC: Charanjit Singh and Nick Robins IDB : Patrick Doyle , Arnaldo Vieira de Carvalho, Maria Netto de A.C. Schneider , Chris Sewell JBIC : Takashi Hongo JICA : Kyosuke Inada KfW : Christian Calov and Markus Elz Mexico: Jorge L. Wolpert Kuri (CONAVI); Luis Arias Osoyo, Rosa Alicia Garcia Becerril, Reina A. Velázquez Montes (SENER) South Africa: Barry Bredenkamp (SANEDI), Maphuti Legodi, Mokgadi Modise (Department of Energy); Andrew Etzinger (Eskom) UNDP : Marcel Alers, Lucas Black , Robert Kelly , Benoit Lebot World Bank : Ashok Sarkar , Jas Singh , Gary Stuggins , Zhihong Zhang
Substantial additional input was provided as part of the review process by Barbara Buchner (Climate Policy Institute), Sean Kidney (Climate Bonds Initiative), Dilip Limaye (SRC Global, Inc.), Sara Moarif (Center for Climate and Energy Solutions).
We are also very grateful for the time taken to review this report by OECD colleagues: Jane Ellis, Virginie Marchal, and Geraldine Ang.
This report is the result of these inputs and IEA analysis and does not necessarily represent the views of the contributors or the reviewers.
This publication has benefitted from the inputs of Muriel Custodio, Astrid Dumond, Greg Frost, Rebecca Gaghen, Angela Gosman, and Marilyn Smith in the IEA Communications and Information Office. Thank you also to Audrey Glynn of the IEA Energy Efficiency Unit for formatting the report.
Plugging the energy efficiency gap with climate finance © OECD/IEA 2012
Page | 5
Executive Summary Improving energy efficiency (EE) can reduce energy demand and greenhouse gas (GHG) emissions, and deliver a range of other benefits such as improved air quality, enhanced economic competitiveness and, at the national scale, a higher degree of energy security. Energy consumption is growing faster in developing countries than in developed countries and is forecast to continue to do so. Significant improvements in energy efficiency could provide greater opportunity for economic growth while also providing broader access to energy and related services even from limited energy resources.
Improvements in energy efficiency show the greatest potential of any single strategy to abate global GHG emissions from the energy sector. In the IEA World Outlook Energy 450 ppm Scenario, as much as 44% of the estimated global abatement potential in 2035 derives from energy efficiency measures (IEA, 2012).
Moving the developing world towards a low‐carbon economy requires a scaling up of financing for energy efficiency. However, several barriers limit the funding of EE projects in these regions (some are common also to developed countries). These include weak capital markets; immature EE markets and supply chains; low energy prices; lack of information and awareness; high transaction costs; inadequate governance capacity; lack of consensus on best practices; sovereign risk; and institutional fragility.
This report examines the current role of climate finance in funding EE projects and the potential to channel funds to relevant EE projects in developing countries under the new Green Climate Fund (GCF). The objectives of the report are to explore:
(i) whether anecdotal evidence of low levels of climate finance being used for energy efficiency investments is substantiated; and
(ii) how to ensure that energy efficiency projects are considered in the design of future climate finance.
The report focuses primarily on public climate finance flows from “north” to “south”, probing the current use of funds from multi‐lateral development banks (MDBs), bi‐lateral financial institutions (BFIs) and carbon markets for energy efficiency projects in developing countries.
Climate finance flows are estimated to be USD 343 billion to USD 385 billion yearly (Buchner et al., 2012) but energy efficiency appears to represent a very small share of it. For example, international financial institutions dedicate significantly more funds to renewable energy supply than energy efficiency projects. In addition, demand‐side energy efficiency accounts for only 1% of the credits from regular Clean Development Mechanism (CDM) projects.
The level of investment and the outcomes achieved in energy efficiency in the developing world are heterogeneous, reflecting the unique circumstances of each the country. Emerging economies, such as China or Brazil, are better able to finance energy efficiency with their own public budgets, which can be combined with international flows or domestic private finance. Governments in the lower income countries have priorities other than energy efficiency – water, sanitation and energy access, for example. International climate finance is often channelled to projects such as renewable energy that appear to better meet country priorities in the short‐term, although energy efficiency measures can often also provide opportunities to address these or other issues.
Multi‐lateral and bi‐lateral development banks can play an essential role in the poorest countries to address market barriers (high perceived risk, high transaction costs, low liquidity, etc.) and to leverage investment. This report estimates the annual average value of finance from

© OECD/IEA 2012 Plugging the energy efficiency gap with climate finance
Page | 6
multi‐lateral development banks (MDBs) for energy efficiency measures in developing countries over the period 2008‐2011 at USD 4.9 billion and from bi‐lateral financial institutions (BFIs) in non‐OECD countries at USD 18.9 billion in 2010. If leveraged with private funds (using leverage ratios between 2 and 8), this could mean that investment in energy efficiency directly leveraged in developing countries was between USD 47 billion and USD 190 billion in 2010, significantly higher than expected. Multi‐lateral development banks are increasingly incorporating EE finance in their project operations; however the focus on energy efficiency varies among banks. Energy efficiency financial support ranges between 2% and 15% of total lending in the five MDBs surveyed.1
The levels of EE finance are much higher in emerging economies than in other developing countries; MDBs do not currently play a large role in financing energy efficiency in these countries. This report estimates that total funding for energy efficiency (including climate finance and other sources) in the five BRICS (Brazil, Russia, India, China and South Africa) countries was approximately USD 43.7 billion in 2011, with the largest share in China. However, MDB finance of energy efficiency in these countries amounted to only USD 1.3 billion in 2011.
Various financial instruments adapted to energy efficiency projects are needed in all developing countries. In both emerging economies and low‐income countries, climate finance helps to mobilise private investment in energy efficiency. In low‐income countries, public financing vehicles, typically in the form of grants and subsidies, are essential to trigger initial investments and develop the financial and EE markets. In emerging economies with more liquidity in capital markets, the challenge is to overcome a perception on the part of private investors that EE projects are high risk; therefore, financial mechanisms such as loan guarantees and other public‐private partnerships are needed. In all cases technical and regulatory support is needed to create demand for energy efficiency and uptake.
Lessons for future climate finance can be learned from experiences with carbon finance and international financial institutions (IFIs) in financing energy efficiency projects. In carbon finance, the newer CDM Programme of Activities (PoAs) rules have proved more favourable to demand‐side EE projects than previous CDM rules. This is due to the programmatic nature of PoAs, which enables the clustering of many projects for funding under one programme, and the eligibility of voluntary policies and incentive schemes for funding. These two features facilitate the finance of small‐scale projects and the policy framework to require their development. Demand‐side EE projects amounted to 31% of CDM PoA credits up to 2012.
Governments and IFIs have mainly used grants or concessional loans to encourage investments in EE projects in developing countries. In markets that are more mature, the commercial financial sector gets involved and private financing instruments are combined with public financing vehicles, e.g. market rate loans can be consolidated by a public guarantee.
An innovative financing framework for energy efficiency in developing countries could emerge with the Green Climate Fund (GCF). This new mechanism for international climate finance was established through the United Nations Framework for the Convention on Climate Change (UNFCCC) at COP16 in Cancun. The GCF is currently under development and many of its modalities and procedures remain unclear. It is opportune to consider how the fund could be designed to suit the funding of EE projects so that GCF funds support cost‐effective energy efficiency actions with important co‐benefits for climate change mitigation and developing country economies.
1 The African Development Bank (AfDB); Asian Development Bank (ADB); the European Bank for Reconstruction and Development (EBRD); the Inter‐American Development Bank (IDB); and the World Bank Group (WBG).
Plugging the energy efficiency gap with climate finance © OECD/IEA 2012
Page | 7
The report makes eight recommendations on the design of climate and sustainable energy finance programmes to ensure that EE projects are not under‐represented in the portfolio of projects funded by climate finance in developing countries. Based on the analysis, this report recommends that the design of climate finance generally, and in particular the forthcoming GCF, should:
Consider dedicating a specific share of funding for EE projects: A specific funding window may be needed to ensure that adequate numbers of EE projects are funded through the GCF (perhaps in part through the private sector facility), given the many barriers to EE finance.
Set suitable, yet flexible, project eligibility criteria:
o The governing instrument for the GCF approved at COP17 in Durban specifies that a results‐based approach will be an important criterion for allocation of resources. EE projects that deliver reductions in energy demand and increased service (rather than the supply of easily metered energy) require more complex evaluation effort than other low‐carbon investments, and direct impacts are hard to measure. A results‐based approach should be structured such that it does not put EE projects at a disadvantage.
o Additionality criteria may require that projects are only eligible for funding which would reduce greenhouse gases emissions below those that would have occurred in the absence of the funding for the project activity. Since many EE projects are economically attractive even without the added cash flow from carbon finance payments or other international support this may render such EE projects ineligible for climate finance. Some flexibility to definitions and requirements for additionality should be maintained to make allowance for investments in EE projects that are cost‐effective on paper but in reality face other barriers that hinder their implementation without the carbon market. Projects that improve energy efficiency, mitigate emissions, and deliver additional social and economic benefits to society should be encouraged.
Allow funding for policy and programme development: Funds should be allocated to domestic programmes and policies as well as to strengthening of in‐country institutional capacity to support regulatory reform and capacity building, particularly for energy efficiency measures.2 Public funds may best be used in implementing regulations requiring energy efficiency that will then channel private investment. The GCF Transitional Committee has stated that the GCF will provide resources for “preparation or strengthening of low‐carbon strategies or plans” and for nationally appropriate mitigation actions (NAMAs), and will ensure adequate resources for capacity building.3 Such an approach would be good for energy efficiency measures for which policy frameworks, technical assistance and knowledge sharing are likely to be more important than direct project financing.
Facilitate project clustering: Given the small size of energy efficiency projects compared with other climate mitigation projects, applications for GCF or other climate funding for individual EE projects are likely to be inefficient and have high transaction costs proportionally. Clusters of projects and programmes should be encouraged on a national or regional basis, and the higher transaction costs associated with small‐scale projects could be shared or borne by the GCF. The experience with Programmes of Activities under CDM and with credit lines to local financial institutions from some IFIs illustrates the importance of clustering for implementing EE projects or measures.
Encourage development and implementation of appropriate financial instruments: It is important to ensure that GCF includes financial instruments suitable for supporting and financing
2 This could be aligned with the OECD DAC Programme‐based approaches (PBA) classification for ODA that engages in development co‐operation based on the principles of co‐ordinated support for a locally owned programme of development, such as a national development strategy, a sector programme, a thematic programme or a programme of a specific organisation. (www.oecd.org/site/dacsmpd11/glossary.htm#P) 3 The NAMAs concept was introduced in the UNFCCC Bali Action Plan in 2007; NAMAs can be defined as actions in developing countries to lower GHG emissions and contribute to sustainable development in the country.
© OECD/IEA 2012 Plugging the energy efficiency gap with climate finance
Page | 8
energy efficiency. Such instruments should include concessional loans, risk guarantees, public‐private partnerships and aggregation vehicles that allow smaller loans to be grouped to access lower interest capital markets re‐financing, all of which have been shown to be successful in financing energy efficiency projects.
Evaluate impact of EE funding on outcomes: Mechanisms should be put in place to ensure funding for formal and comprehensive evaluation of the full costs and outcomes of all projects.
Increase the access to and level of funding for energy efficiency by international financial institutions (IFIs): This will require better co‐ordination among lending portfolios for the energy sector and direct climate mitigation lending. The GCF, if operationalised, could represent an important part of future climate finance, but other international flows are also likely to continue to play a large role in financing climate mitigation in developing countries. Both multi‐lateral and bi‐lateral development banks are also likely to continue to fund GHG mitigation investments. Improved co‐ordination would reveal the multiple benefits of energy efficiency investments from both an energy sector and climate mitigation perspective. In addition, increased funding from MDBs and bi‐lateral development banks for policy development in developing countries could clear the path for increased investment from the private sector, as well as from international private sector investors.
Develop a new market mechanism under the UNFCCC that goes beyond the CDM to increase financing of energy efficiency. The main principles agreed for a new carbon market mechanism would allow for direct carbon financing to support establishment of broad domestic policy frameworks. The use of standardised or sectoral baselines could reduce transaction costs and obviate the need for additionality testing. Such a market mechanism could better support energy efficiency investments than the CDM has done to date.
Plugging the energy efficiency gap with climate finance © OECD/IEA 2012
Page | 9
Introduction Significant investment is needed to mitigate climate change and reduce greenhouse gas (GHG) emissions. The IEA World Energy Outlook estimates the additional gross investment needed to achieve a 450 scenario compared with carbon mitigation policies that are in place or planned (the New Policies scenario) is USD 16 trillion (2011 prices) over the period 2011‐2035.45 To respond to this challenge, increased investment is needed in (energy‐using) demand‐side technologies and efficiency measures globally. These investments will be offset by fuel and energy savings.
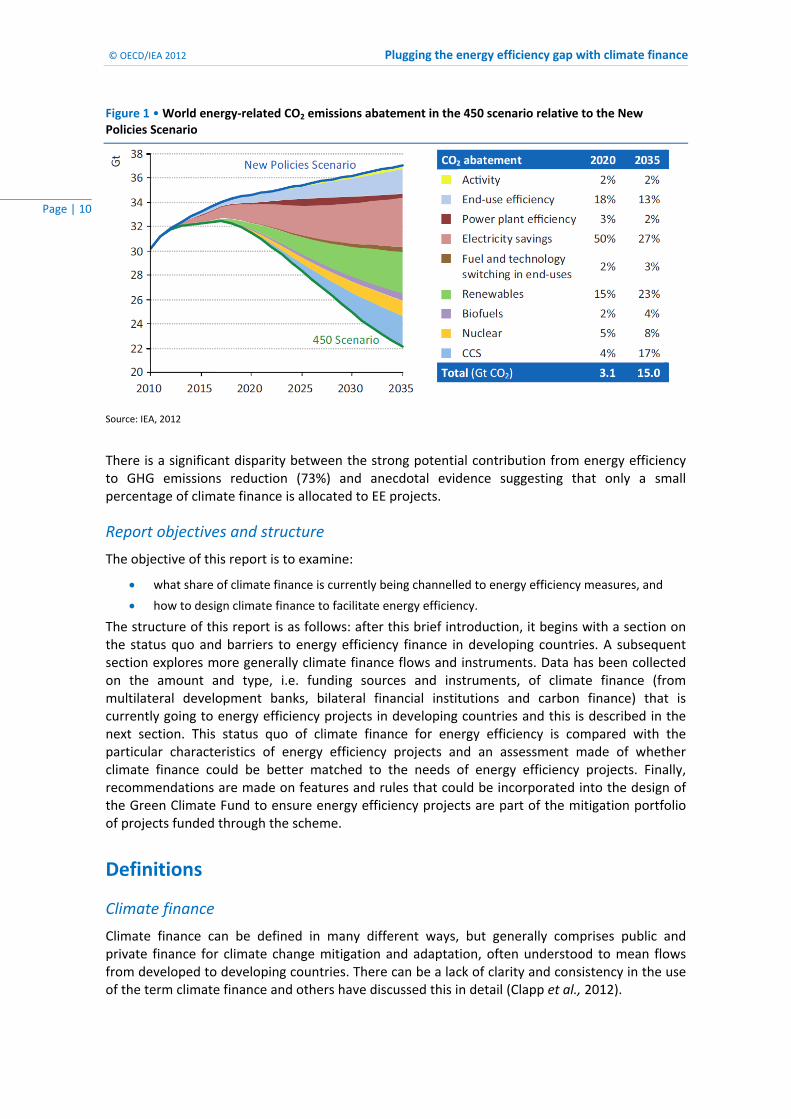
IEA analysis shows that measures to improve energy efficiency will play a major role in reducing GHG emissions. It is estimated that in 2020 71% of the abatement potential in the IEA World Energy Outlook 2012 450 scenario is through energy efficiency measures (Figure 1). The investments in energy efficiency needed to achieve this are substantial, with about USD 9.9 trillion needed over the period 2011‐2035 for energy efficiency improvements globally. The share of carbon mitigation is relatively lower (44% of abatement) in 2035 as renewable energy and carbon capture and storage play a bigger role.
The importance of energy efficiency improvements cannot be overstated, as without a global climate agreement, measures taken solely in pursuit of greater energy efficiency could significantly delay emissions lock‐in from existing infrastructure. If infrastructure investments were made in line with an Efficient World Scenario, new plants and facilities could continue to be built up to 2022 before the entire emissions budget of the 450 Scenario became locked‐in (compared with 2017 in the New Policies Scenario).6 Therefore it is estimated that the Efficient World Scenario can buy another five years grace in the effort to achieve a 2°C target (IEA, 2012). Energy demand is growing more rapidly in developing countries than developed countries and therefore improving EE is vital to ensuring efficient development, maximising national resources (IEA, 2012).
Barriers exist to financing energy efficiency and therefore public support is needed to trigger energy efficiency improvements. In developing countries, this support can be enhanced through international climate finance, mobilising developed countries’ funds to help developing countries going towards low‐carbon activities. For this reason, financing energy efficiency measures should be an integral part of financial packages for climate change mitigation.
In the COP15 Copenhagen Accord, developed countries committed to mobilising jointly USD 100 billion per year by 2020 in climate finance to developing countries as well as USD 30 billion in fast‐start financing over the period 2010‐2012. Other climate finance is already available through carbon markets and multilateral and bilateral financial institutions. Given the importance of energy efficiency measures in climate change mitigation, it would be expected that a significant portion of climate finance should be channelled into energy efficiency projects.
4 The 450 Scenario sets out an emissions pathway consistent with limiting global warming to 2 °C above pre‐industrial levels, considered the threshold for preventing dangerous anthropogenic interference with the climate system. The New Policies scenario includes all climate mitigation policies currently in place or planned (IEA 2012). 5 This includes industry, transport, and buildings, but not power generation. 6 The Efficient World Scenario (EWS) is a new scenario modelled in the 2012 IEA World Energy Outlook which that energy efficiency investments are made as long as they are economically viable with the market prices prevalent in the scenario and that market barriers obstructing their realisation have been removed. The energy efficiency potentials are determined for each sector and region following a thorough review of energy efficiency options and their associated payback periods.
© OECD/IEA 2012 Plugging the energy efficiency gap with climate finance
Page | 10
Figure 1 • World energy‐related CO2 emissions abatement in the 450 scenario relative to the New Policies Scenario
Source: IEA, 2012
There is a significant disparity between the strong potential contribution from energy efficiency to GHG emissions reduction (73%) and anecdotal evidence suggesting that only a small percentage of climate finance is allocated to EE projects.
Report objectives and structure
The objective of this report is to examine:
what share of climate finance is currently being channelled to energy efficiency measures, and
how to design climate finance to facilitate energy efficiency.
The structure of this report is as follows: after this brief introduction, it begins with a section on the status quo and barriers to energy efficiency finance in developing countries. A subsequent section explores more generally climate finance flows and instruments. Data has been collected on the amount and type, i.e. funding sources and instruments, of climate finance (from multilateral development banks, bilateral financial institutions and carbon finance) that is currently going to energy efficiency projects in developing countries and this is described in the next section. This status quo of climate finance for energy efficiency is compared with the particular characteristics of energy efficiency projects and an assessment made of whether climate finance could be better matched to the needs of energy efficiency projects. Finally, recommendations are made on features and rules that could be incorporated into the design of the Green Climate Fund to ensure energy efficiency projects are part of the mitigation portfolio of projects funded through the scheme.
Definitions
Climate finance
Climate finance can be defined in many different ways, but generally comprises public and private finance for climate change mitigation and adaptation, often understood to mean flows from developed to developing countries. There can be a lack of clarity and consistency in the use of the term climate finance and others have discussed this in detail (Clapp et al., 2012).

Plugging the energy efficiency gap with climate finance © OECD/IEA 2012
Page | 11
The scope of climate finance in this report includes public and private international financial flows from developed to developing countries (North‐South) for the purposes of greenhouse gas (GHG) mitigation.
In this paper we discuss the role of carbon finance within the broader term climate finance. Carbon finance can be defined in different ways, but for the purpose of this paper, and to differentiate it from the wider term climate finance, we apply the following narrow definition of carbon finance: investments in GHG emission reduction projects or programmes that create an asset used to offset an emission made elsewhere – in particular, GHG emission reduction credits generated through the Kyoto Protocol's flexibility mechanisms.
Energy efficiency finance
In the context of this report, energy efficiency is used to denote measures or projects that improve energy efficiency (in percentage) by either consuming less energy for the same or more energy services than previously provided or providing increased energy services for the same energy consumption. The type of measure covered by this definition includes:
Improvements in existing end‐use and sectoral energy performance, i.e. transport, buildings, industry, that include equipment upgrades and process improvements;
New equipment, facilities and buildings with better energy performance compared with business as usual;
Power generation efficiency improvements (excluding fuel switching).
A threshold level of improvement in energy performance to qualify projects as energy efficiency measures has not been set in this report. This may be an issue that could be important in determining whether climate finance should be channelled to energy efficiency projects in the future to ensure that a portfolio of projects are created with more and less ambitious energy performance improvements.
The term “finance” of energy efficiency measures can also be somewhat ambiguous. In some cases it is used interchangeably with “investment”, which may not always be appropriate when the financier does not take an equity stake in the project. In this report, we use the terms “investment” to mean only when the funder lends directly to projects, whereas the term “finance” is used more broadly to mean both lending to governments who lend to financial institutions which on‐lend and lending directly to energy efficiency projects (i.e. investment).
In addition, the share of the total investment or finance that can be classed as energy efficiency finance is often unclear. Is the amount of energy efficiency financing the total funds lent to a project where there is an energy efficiency improvement component? Or is it only the additional amount needed for the energy efficiency improvement? In this report it is attempted to account for the latter only, i.e. the finance of the upfront costs directly associated with an improvement in energy performance of a building, vehicle, industrial facility or power plant.
Unfortunately, financial institutions have different conceptions of energy efficiency finance. Some include the full cost of building new infrastructure, which although may contribute to energy efficiency improvements, only a small part is dedicated to improving energy efficiency, i.e. transport infrastructure or transmission lines can enable modern, more energy‐efficient transport and power systems, however the full cost of the infrastructure is not related to energy efficiency improvements. This makes tracking, reporting, and comparison of EE investments between different financial institutions very difficult. It was not possible to collect financial flow data strictly according to the definitions of energy efficiency measures above because there is no internationally agreed reporting system. Hence some investments in energy efficiency are aggregated with renewable energy (as clean energy finance) or cover the full capital cost of infrastructure when reported and impossible to separate. Whenever possible, we excluded

© OECD/IEA 2012 Plugging the energy efficiency gap with climate finance
Page | 12
figures for energy efficiency projects that were not consistent with our categorisation (e.g.: fuel switching, construction of new transmission lines).
Plugging the energy efficiency gap with climate finance © OECD/IEA 2012
Page | 13
Energy efficiency for developing countries Improvements in energy efficiency hold many benefits for developed and developing countries but the outcomes and goals are likely to be different. This section presents an overview of the status quo in energy efficiency finance for developing countries.7 It begins with current estimates of investment in energy efficiency globally and in developing countries based on recent IEA analysis for the World Energy Outlook 2012.
The significant benefits associated with improving energy efficiency in developing countries, as well as the barriers to investment in energy efficiency, are discussed in this section. It finishes with a description of the financing instruments mainly used to provide public funds to energy efficiency projects in developing countries to overcome the financing barriers outlined.
Estimates of energy efficiency finance in developing countries
For the first time, the IEA has attempted to estimate global investment in energy efficiency (IEA, 2012). Since investment in energy efficiency is not systematically tracked, it is difficult to track globally. A country‐by‐country analysis was carried out as part of this study to derive estimates of energy efficiency investment around the world. The approach taken was the following:
Country sources and estimates were used, wherever available. This proved possible for larger countries, particularly in the OECD.
Energy efficiency investment data were estimated from multilateral development banks and other sources of public funding invested in energy efficiency projects to which a multiplier is applied, based on the economic circumstances and practices of the individual country (AGF, 2010).
Using this method, total global investment in 2011 in energy efficiency measures is estimated at USD 180 billion. This is higher than previously estimated by others (IEA 2012; BNEF 2011; Hayes et al. 2012) but can be nonetheless considered as on the lower side due to the definition of energy efficiency finance/investment used, i.e. in transport and power infrastructure was largely excluded, and the difficulty associated with collecting private sector investment data. Of this, approximately one third is spent in non‐OECD countries and USD 45 billion is estimated to be invested in the five BRICS countries (see Table 1).8 The remainder (between USD is spread over the rest of the developing world.
Developing countries comprise a heterogeneous group of countries. A clear distinction can be made between upper middle income countries (or emerging economies) and low income countries. While low income countries depend heavily on international public support to develop, IEA analysis of multilateral development bank investment in energy efficiency in upper
7 There is no established definition of “developed” or “developing” countries under the United Nations system. In common practice, Japan, Canada, the United States, Australia and New Zealand in Oceania and Europe (OECD countries) are considered as “developed” regions. Eastern European countries and the former USSR are variably included in the category of developed or developing countries, and are classified as developing countries in this report. The “developing” countries category usually includes all other countries, including countries emerging from the former Yugoslavia. Within developing countries, three subcategories of countries emerge ‐ “emerging economies” or “upper middle income” countries, “lower middle income” countries, and the “least‐developed” countries (LDCs) or “low income” countries. We use the World Bank categorisation of these categories (data for 2011):
Low income countries or LDCs: gross national income (GNI) per capita of USD 1 025 or less
Lower middle income countries: GNI per capita between USD 1 026 and USD 4 035
Upper middle income countries or emerging economies: GNI per capita between USD 4 036 and USD 12 475 8 Brazil, the Russian Federation, India, China, and South Africa.
© OECD/IEA 2012 Plugging the energy efficiency gap with climate finance
Page | 14
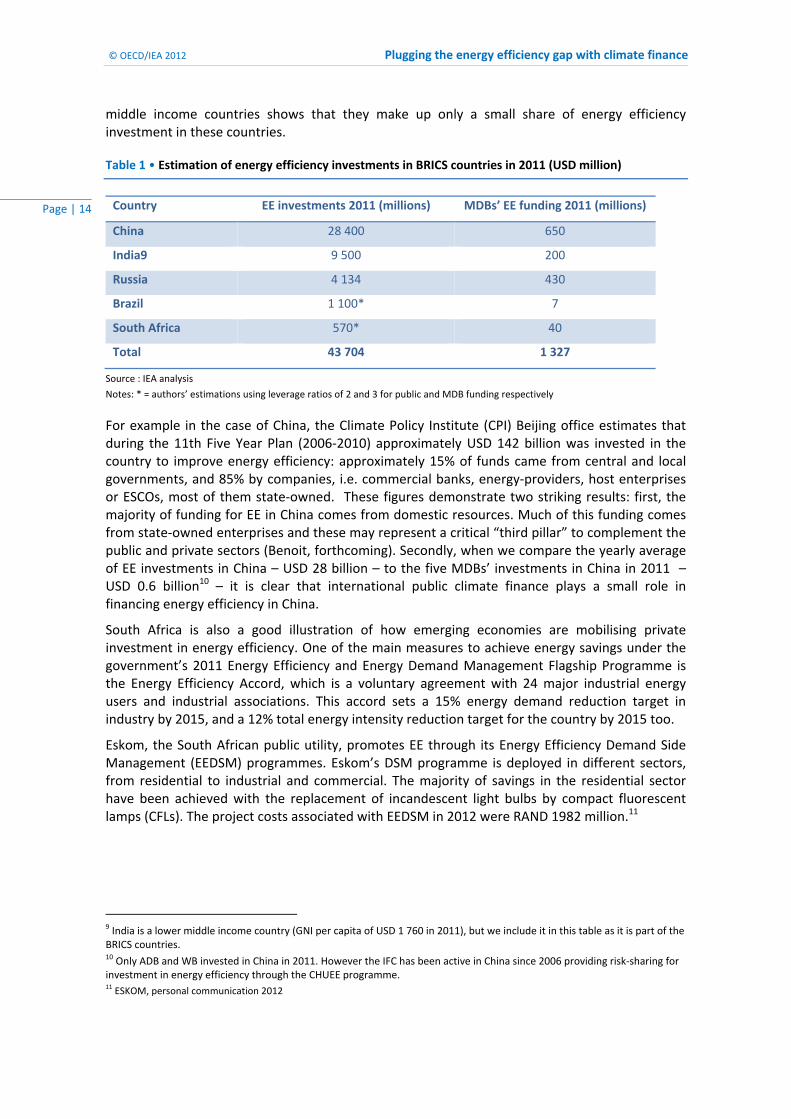
middle income countries shows that they make up only a small share of energy efficiency investment in these countries.
Table 1 • Estimation of energy efficiency investments in BRICS countries in 2011 (USD million)
Country EE investments 2011 (millions) MDBs’ EE funding 2011 (millions)
China 28 400 650
India9 9 500 200
Russia 4 134 430
Brazil 1 100* 7
South Africa 570* 40
Total 43 704 1 327
Source : IEA analysis
Notes: * = authors’ estimations using leverage ratios of 2 and 3 for public and MDB funding respectively
For example in the case of China, the Climate Policy Institute (CPI) Beijing office estimates that during the 11th Five Year Plan (2006‐2010) approximately USD 142 billion was invested in the country to improve energy efficiency: approximately 15% of funds came from central and local governments, and 85% by companies, i.e. commercial banks, energy‐providers, host enterprises or ESCOs, most of them state‐owned. These figures demonstrate two striking results: first, the majority of funding for EE in China comes from domestic resources. Much of this funding comes from state‐owned enterprises and these may represent a critical “third pillar” to complement the public and private sectors (Benoit, forthcoming). Secondly, when we compare the yearly average of EE investments in China – USD 28 billion – to the five MDBs’ investments in China in 2011 – USD 0.6 billion10 – it is clear that international public climate finance plays a small role in financing energy efficiency in China.
South Africa is also a good illustration of how emerging economies are mobilising private investment in energy efficiency. One of the main measures to achieve energy savings under the government’s 2011 Energy Efficiency and Energy Demand Management Flagship Programme is the Energy Efficiency Accord, which is a voluntary agreement with 24 major industrial energy users and industrial associations. This accord sets a 15% energy demand reduction target in industry by 2015, and a 12% total energy intensity reduction target for the country by 2015 too.
Eskom, the South African public utility, promotes EE through its Energy Efficiency Demand Side Management (EEDSM) programmes. Eskom’s DSM programme is deployed in different sectors, from residential to industrial and commercial. The majority of savings in the residential sector have been achieved with the replacement of incandescent light bulbs by compact fluorescent lamps (CFLs). The project costs associated with EEDSM in 2012 were RAND 1982 million.11
9 India is a lower middle income country (GNI per capita of USD 1 760 in 2011), but we include it in this table as it is part of the BRICS countries. 10 Only ADB and WB invested in China in 2011. However the IFC has been active in China since 2006 providing risk‐sharing for investment in energy efficiency through the CHUEE programme. 11 ESKOM, personal communication 2012

Plugging the energy efficiency gap with climate finance © OECD/IEA 2012
Page | 15
Box 1 • Investment in energy efficiency in Mexico
CONAVI SUBSIDIES (PUBLIC INVESTMENT)
No. of ACTIONS
Subsidy in USD TOTAL SUBSIDY IN USD
Other credit entities 1 563 4 462 6 974 217
INFONAVIT 67 014 3 718 249 143 977
INFONAVIT Green Mortgages (PRIVATE
INVESTMENT)
No. of ACTIONS
CREDIT IN USD TOTAL CREDIT IN USD
Developers and Beneificiaries
169 082 854 108 297 021
Source: CONAVI, 2012; UNEP, 2012.
Funding for energy efficiency in lower income countries however does not follow the same pattern. In many developing countries, public budgets and capital markets are not strong enough to support energy efficiency improvements. Funds available for the energy sector in these countries are often prioritised for other purposes (e.g. energy access or renewable energy sources). Energy efficiency development therefore needs to be triggered by climate finance, i.e. North‐South flows aimed at combating climate change.
Benefits of energy efficiency in developing countries
Future energy demand and the related costs associated are important issues in the economic development for developing countries. Most developing countries are energy importers and when this is the case, rising energy demand negatively impacts the trade balance, energy
The Mexican government has provided subsidies for energy‐efficient housing in Mexico since 2009. The Mexican National Housing Commission CONAVI provides grants as well as loan supplements for the purchase of homes equipped with energy‐efficient and renewable energy technologies. The subsidies are distributed mainly via the large residential mortgage issuers, who are, to varying degrees, also government entities. These mortgage‐issuing entities have complemented CONAVI’s programme with other programmes. The green mortgage programme, for example, is operated by the largest issuer of residential mortgages in Mexico, the National Fund for Housing (INFONAVIT). This special type of mortgage is an additional credit, above the borrower’s approved amount, for the purchase of a home that complies with a series of sustainability measures. Although these loans are often standalone, they are mainly distributed attached to a government subsidy to partially or fully cover the additional portion of the credit amount. Additionally, the green mortgage programme operates under the rules established by CONAVI.
Over the period 2009‐2012, nearly USD 1 billion has been provided in public subsidies and nearly USD 500 million in extra credit by mortgage providers for energy‐efficient housing. This programme is now registered as a PoA under the CDM and is in the process of seeking approval for registration as a NAMA (see Box 4).
2012 subsidies for energy‐efficient housing in Mexico in 2012
Further programmes are co‐financed by the Mexican government under the Fund for the Energy Transition and the Sustainable Use of Energy to replace lights and appliances with more energy‐efficient equivalents. The GEF, IBRD, CTF are providing over USD 700 million in subsidies for low‐income groups to replace their 10 year or older refrigerators and/or air conditioners for more energy‐efficient appliances. The Mexican government has provided nearly USD 300 million over the period 2009 ‐ June 2012 to this programme. In addition, incandescent light bulbs are also replaced with compact fluorescent lamp (CFL) light bulbs costing USD 126 million in 2011 and 2012. This has been co‐financed by the Mexican government and the World Bank.
© OECD/IEA 2012 Plugging the energy efficiency gap with climate finance
Page | 16
security, public budget, and competitiveness of a country. Even in the case of energy‐exporting countries, the commercial exploitation of their own resources involves long‐term infrastructure development, but financial resources are scarce.
Not only does improving energy efficiency (EE) reduce developing countries’ energy demand, it can also improve their energy security and enhance their economic competitiveness (Ryan and Campbell, 2012; IPCC, 2007).
Benefits of energy efficiency in developing countries are multiple and, aside from energy and GHG emissions savings, include:
Poverty alleviation: energy affordability and access: Energy affordability issues are both a cause and a symptom of poverty. Faced with high energy prices, the poor are often unable to afford good energy services, forced to under‐heat the home or to endure poor indoor air quality. Energy efficiency can address this by reducing energy bills through insulation and design, delivering efficient appliances for instance. Energy access is a particular concern for developing countries, and many of them look to increase the efficiency on the supply‐side to improve it. Energy efficiency measures undertaken by energy providers can free up additional resources by reducing technical losses in their energy generation and distribution systems.
Increased disposable income: Improvements in EE reduce energy bills for the same energy consumption, therefore increasing disposable income through monetary savings. This can free up funds to be spent in other sectors of the economy, creating jobs and economic growth. If the surplus is saved or spent in low‐energy intensive activities, overall welfare will be higher.
Industrial productivity and competitiveness: Energy efficiency can improve industrial productivity in different manners : increase profits, secure working conditions, reduce energy use, etc. Improved EE can not only bring benefits to individual firms, but also affect the competitiveness of industry at large.
Improvement of public budgets: Many countries use large shares of the public budget on energy‐related spending – either through fossil fuel imports or subsidising fuel to customers or industry and power generators. Improved energy efficiency can reduce this bill. Reduced energy imports also improve balance of trade and free up resources for other domestic investments.
Barriers to energy efficiency finance
Improvements in energy efficiency reduce costs over time with a positive return on investment but there remain barriers to uptake and finance of energy efficiency measures. A number of uncertainties surround EE projects which makes investors perceive them as too risky. In the absence of an internationally recognised protocol to measure and report energy savings, quantification of benefits is difficult. The absence of physical assets to grasp in case of default means that financiers cannot price adequately the risk they are facing and over evaluate it by precaution. Characteristics of EE projects that negatively influence their attractiveness to financial institutions can be grouped in the following categories (adapted from Limaye, 2011, reported in IEA, 2011; de T’Serclaes, 2010).
Intangibility: For any typical loan, financial institutions (FIs) will require information about borrowers’ income capacity. To secure their loans, FIsl base them on assets listed in the balance sheet. The interest rate proposed depends on the security of the asset or in other words, the risk it bears. The higher the risk, the higher the interest rate. Coming back to the particular case of EE projects, the benefits they provide are negawatts or cash flow from savings which investors or lenders do not know how to collateralise. When energy savings are intangible and unclear in the long‐term, FIs are reluctant to give loans perceived as unsecure.
Information, awareness and communication: Financiers often do not have enough knowledge of EE technologies and their potential to save energy, which makes it difficult for them to assess or understand their value. This leads to the perception that EE projects are more complex, costly,
Plugging the energy efficiency gap with climate finance © OECD/IEA 2012
Page | 17
risky and difficult to implement. Organisations implementing EE projects have the technical information on the potential to save energy but may not be able to communicate this information in an appropriate way for a financier to process. Communication between energy efficiency project managers and financial institutions (FIs) may be very poor, impeding sharing of relevant information.
Small size of projects : high transaction costs: Energy efficiency projects are often fragmented and too small to be attractive to lenders. Consequently project development and implementation costs represent a larger share of an EE project than for a traditional project in the energy sector. This high proportion of “soft costs” implies less securitisable assets and higher interest rates if they are perceived as riskier as a result.
Lack of data: There are no internationally recognized indicators to compare countries’ relative EE levels and EE financial flows. Private investors are less likely to provide funds if they do not have reliable data to compare projects in different countries and their relative EE potentials and may require performance risk guarantees where data is lacking. Information on the regulatory framework can also be important for investors, as it can indicate commitment to EE by policy makers in the longer term.
Lack of harmonised international monitoring and verification (M&V) protocols: Even though some M&V protocols for the assessment of energy savings from energy efficiency projects have been developed, there is no international harmonization and little communication of these protocols to bankers. Independent assessment of energy efficiency projects using international M&V protocols is needed to win the trust of financiers. Similarly, standardisation of loan underwriting of EE projects is required (Buonicore 2012). Financiers do not trust energy savings estimates provided by enterprises because M&V protocols used differ from one another and there is little transparency on methods developed to create the guidelines. M&V standards are also technical in nature and there are not enough experts to assess and manage them.
Lack of capacity: Actors involved in EE projects often lack skills and capacity: project developers and energy services companies (ESCOs) to develop understandable information for financiers, project hosts (energy users) on achieving energy savings potential of energy efficiency measure post‐upgrade , and FIs loan officers in familiarity with EE projects.
Lack of consensus on best practices to promote energy efficiency: Governments often do not have a clear view of an overall EE strategy to adopt. They do not agree on the best practices to promote EE as several mechanisms can be experimented : regulation vs. incentives, subsidies vs. market‐based schemes, etc. The government has to find the good mix between policies and the role it should play.
Lack of sufficient demand for energy efficiency: Many of the challenges to take‐up of EE measures are non‐financial. For all of the reasons given above, EE measures are a marginal activity and complex in many ways. It is likely that larger scale deal‐flow generation in EE measures will be dependent less on finance being available than a requirement for compliance with regulations. Without large‐scale adoption measures and volume of activity, transaction costs for EE projects are likely to remain high with rates of return that are too low to drive capital, and therefore requiring vast public funding.
Barriers particularly impacting developing countries
Barriers to the deployment of energy efficiency projects listed above apply to both developed and developing countries. There exist additional barriers however that particularly impact developing countries and which may not always be overcome through finance alone, see Box 2.
Inadequate or non‐existent EE governance: The IEA defines energy efficiency governance as “the combination of legislative frameworks and funding mechanisms, institutional arrangements, and co‐ordination mechanisms, which work together to support the implementation of energy efficiency strategies, policies and programmes” (IEA, 2010). Energy efficiency governance in developing countries is not well established.
The IEA recommends three areas to improve in EE practices for governments:

© OECD/IEA 2012 Plugging the energy efficiency gap with climate finance
Page | 18
The IEA recommends three areas to improve in EE practices for governments: o Enabling framework: Establishing steady and reliable mechanisms to fund EE
implementation is a critical aspect of good energy efficiency governance.
o Institutional arrangements: Institutional arrangements include both the political economy of EE governance – building consensus and mobilizing society – as well as the creation of practical instruments, e.g., implementing agencies for EE implementation and mobilisation of assistance from the private sector and international development agencies.
o Co‐ordination mechanisms: Co‐ordination can be intragovernmental (among national government ministries and agencies) or inter‐governmental (across various levels of government). Co‐ordination across levels of government (i.e. inter‐governmental) enables national governments to devolve implementation responsibility to local authorities, while retaining overall programmatic control.
These three aspects are often inadequate in developing countries. Governments do not have the good instruments to implement and enforce EE, and financial and human resources are lacking.
Small EE markets: Demand for EE goods and services is even smaller in developing countries than in developed countries because incomes are lower and awareness among consumers is strongly lacking. Energy prices are sometimes subsidised and limit demand for EE goods and services.
Weak or incomplete domestic capital markets: Upper middle income countries on the one hand have a reliable banking system and rapidly developing equity and debt markets, but capital may not be available for all types of investments, particularly EE investments. Low income countries on the other hand lack both effective banking systems and equity and debt markets (UN, 2010a).
Higher perceived national risk: Investors consider risks associated with a country before investing. As credit ratings from agencies are lower in developing countries, studies have shown that a given technology market in emerging economies needs to be more mature than the same technology market in a developed country. Sovereignty risk is more prevalent in developing countries than in developed countries for investors. Capital markets in developing countries need to provide risk mitigation tools. For instance, expected equity returns for infrastructure projects in the developed world range from 9‐11% whereas it ranges from 15‐17% in Mexico, 20‐25% in Turkey or 40‐60% in West Africa (UN, 2010a).
Institutional frailty: contract failure: Investors fear sudden regulatory changes in emerging economies which do not have a clear institutional framework for their EE policies yet. Even though regulatory changes also happen in developing countries, they are perceived as more risky in developing countries. ESCOs managers interviewed by the IEA in China and India underlined the importance of institutional frailty and uneven contract enforcement in preventing them from accessing enough equity (IEA, 2010).
Financing vehicles to scale up energy efficiency
Overcoming financial barriers to energy efficiency in developing countries is a real challenge. Financial instruments need to be selected in accordance with the specific characteristics of EE projects. The nature of financing vehicles used varies depending on the type of financier: funds from the private sector provide loans at market rates or participate directly in a project with equity shares, whereas a public institution is more likely to provide “soft loans” or subsidies.12 The public and the private sectors can also provide finance for EE projects together, through public‐private partnerships, which trigger private sector’s involvement. Overcoming the perception of risk through policies and capacity‐building is key to encouraging finance and adoption of energy efficiency in developing countries (see Box 2).
12 However, funding from public institutions is not necessarily “soft”. Many MDB and bilateral programmes apply “commercial” or close to commercial rates when the challenge is to provide finance at all, at reasonable maturities etc.
Plugging the energy efficiency gap with climate finance © OECD/IEA 2012
Page | 19
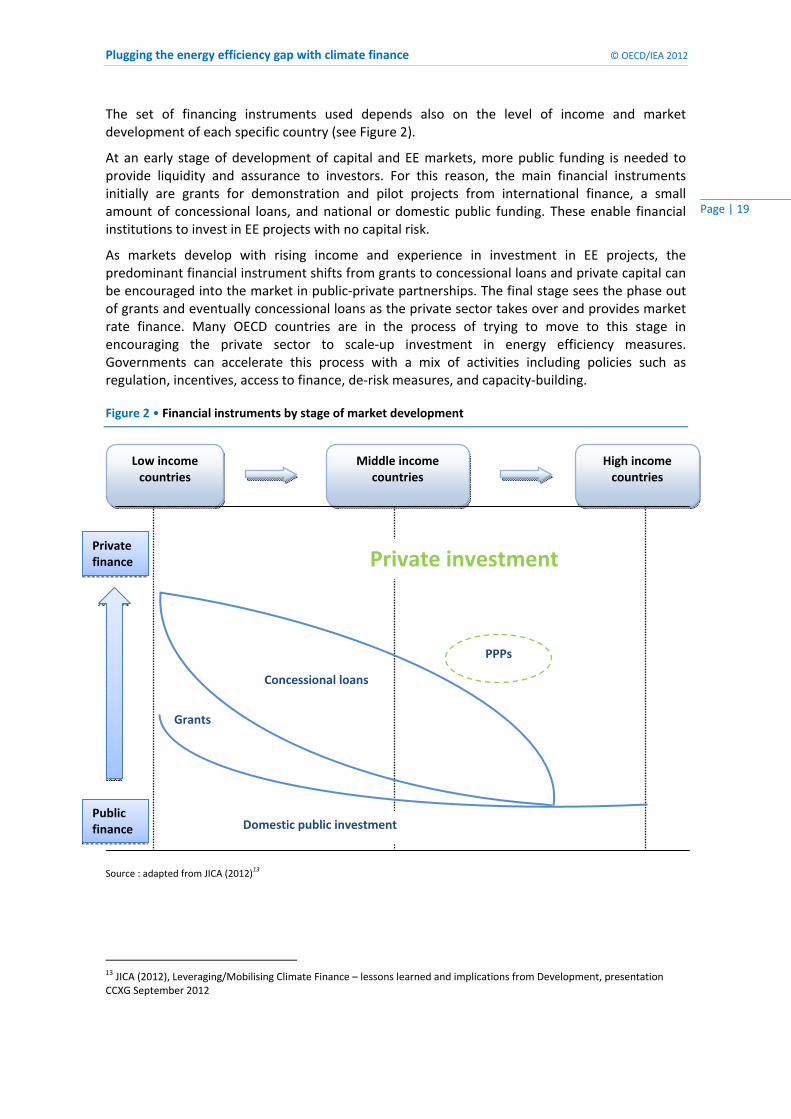
The set of financing instruments used depends also on the level of income and market development of each specific country (see Figure 2).
At an early stage of development of capital and EE markets, more public funding is needed to provide liquidity and assurance to investors. For this reason, the main financial instruments initially are grants for demonstration and pilot projects from international finance, a small amount of concessional loans, and national or domestic public funding. These enable financial institutions to invest in EE projects with no capital risk.
As markets develop with rising income and experience in investment in EE projects, the predominant financial instrument shifts from grants to concessional loans and private capital can be encouraged into the market in public‐private partnerships. The final stage sees the phase out of grants and eventually concessional loans as the private sector takes over and provides market rate finance. Many OECD countries are in the process of trying to move to this stage in encouraging the private sector to scale‐up investment in energy efficiency measures. Governments can accelerate this process with a mix of activities including policies such as regulation, incentives, access to finance, de‐risk measures, and capacity‐building.
Figure 2 • Financial instruments by stage of market development
Source : adapted from JICA (2012)13
13 JICA (2012), Leveraging/Mobilising Climate Finance – lessons learned and implications from Development, presentation CCXG September 2012
Private investment
Grants
Domestic public investment
Concessional loans
Low income countries
Middle income countries
High income countries
PPPs
Public finance
Private finance
© OECD/IEA 2012 Plugging the energy efficiency gap with climate finance
Page | 20
Box 2 • Catalysing Energy Efficiency – the role of policy de‐risking from the experience of UNDP and the GEF.
Source: Robert Kelly, UNDP.
Since 1992, the United Nations Development Programme (UNDP) has implemented over 230 Global Environment Facility sustainable energy projects in close to 100 developing countries. Of these projects, over 95 in 55 countries have focused specifically on energy efficiency. These energy efficiency projects have deployed approximately $326 million in GEF funds and $1.5 billion in associated co‐financing from national governments, international organizations, the private sector and NGOs. A 20‐year track record of UNDP‐GEF projects and long‐standing relationships with partner countries have created a unique base of institutional knowledge regarding the energy efficiency challenge in developing countries.
UNDP’s and GEF’s experience show that access to affordable finance is seldom the main or only barrier to energy efficiency projects. Although important, financing alone cannot address the range of barriers to scaling‐up energy efficiency investment. Removing barriers that dampen customer demand for energy efficiency products (information gaps, split incentives, performance uncertainty, limited local supply of technical skills, etc.) is also vital. While the first generation of UNDP’s energy efficiency GEF projects in the 1990s covered a wide range of interventions, successive generations of projects have progressively focused on creating customer demand, through promoting public interventions such as building codes, energy audits, technical skills development and awareness campaigns.
The language of ‘barrier removal’ is a familiar one in the literature, and this is the typical starting point for considerations of promoting investment in energy efficiency. However, UNDP prefers to frame the challenge in terms of risk. Risk is conceptually a richer measure than barriers, as risk not only captures the probability of a negative outcome occurring (driven by one or more underlying barriers), but also the financial impact of that negative outcome should it occur. The problem of kick‐starting energy efficiency investment then becomes one of risk reduction or de‐risking.
Risk reduction is at the core of UNDP‐GEF projects to promote energy efficiency. UNDP‐GEF’s approach to reducing risk involves creating an enabling environment under which elements such as the national policy framework for energy markets, financing channels, administrative procedures and domestic technical expertise are strengthened and aligned to support energy efficiency deployment.
When promoting energy efficiency investments through risk reduction, policy‐makers can utilize a range of different public measures. Broadly, these can be grouped into policy and financial de‐risking instruments:
• Policy de‐risking instruments seek to remove the underlying barriers that are the root causes of risks. As the name implies, these instruments utilize policy and programmatic interventions to mitigate risk and include, for example, support for policy design (such as building codes and standards & labels for energy‐consuming appliances), institutional capacity building, information campaigns and training programmes, among others.
• Financial de‐risking instruments do not seek to directly address the underlying barriers but, instead, transfer the risks that investors face to public actors, such as development banks. These instruments can include, for example, loan guarantees, political risk insurance and public co‐investments.
• Recognizing that not all risks can be eliminated through policy de‐risking or transferred through financial de‐risking, efforts to reduce risks can be complemented by additional financial incentives – such as rebates, grants, carbon finance and other nationally‐appropriate measures – to compensate for any residual above‐average risks and costs.
A detailed treatment of UNDP’s de‐risking approach is presented elsewhere (UNDP, 2011, 2012). UNDP’s experience is that policy de‐risking is vital to, and must accompany or precede, investment in energy efficiency. Policy de‐risking lowers the cost of capital, frees up scarce public resources and ‘crowds in’ private sector investment, allowing energy efficiency, at long last, to live up to its economic and environmental potential.
Plugging the energy efficiency gap with climate finance © OECD/IEA 2012
Page | 21
Climate finance flows and instruments This section examines the current climate financial flows and the main instruments used. This is useful to compare whether there is a match between current climate finance and the needs of energy efficiency finance.
Climate finance: where does the money come from?
There is no precise internationally agreed definition of climate finance, but the term broadly refers to resources that catalyse low‐carbon and climate‐resilient development (see e.g. Corfee‐Morlot et al 2011, Clapp et al 2012). It covers the costs and risks of climate action, supports an enabling environment and capacity for adaptation and mitigation, and encourages R&D and deployment of new technologies (World Bank Group et al., 2011). In this report, we will limit our scope to financial flows from developed to developing countries (North‐South).
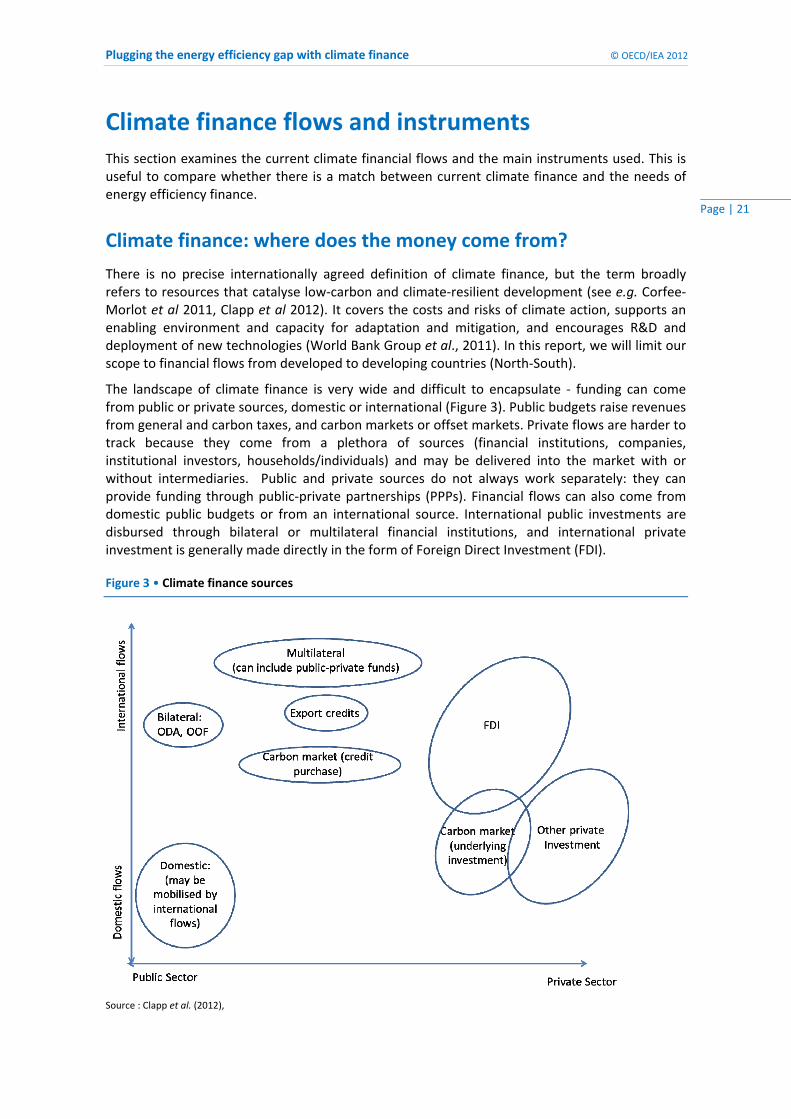
The landscape of climate finance is very wide and difficult to encapsulate ‐ funding can come from public or private sources, domestic or international (Figure 3). Public budgets raise revenues from general and carbon taxes, and carbon markets or offset markets. Private flows are harder to track because they come from a plethora of sources (financial institutions, companies, institutional investors, households/individuals) and may be delivered into the market with or without intermediaries. Public and private sources do not always work separately: they can provide funding through public‐private partnerships (PPPs). Financial flows can also come from domestic public budgets or from an international source. International public investments are disbursed through bilateral or multilateral financial institutions, and international private investment is generally made directly in the form of Foreign Direct Investment (FDI).
Figure 3 • Climate finance sources
Source : Clapp et al. (2012),
© OECD/IEA 2012 Plugging the energy efficiency gap with climate finance
Page | 22
Tracking climate financial flows dedicated to energy efficiency is very complex because energy efficiency can be achieved in a variety of very different sectors (industrial, transportation, buildings, power) and levels (individual, national, and international). Investments from the private sector are almost impossible to identify as they come from a multitude of companies investing worldwide in the form of debt or equity and there are no measurement or tracking systems for such investments.
The potential of energy efficiency improvements in the developing world is not achieved because of the financial barriers listed in the previous chapter. The public sector thus has a key role to play to lead investments up‐front and leverage additional flows.
Access to finance in developing countries, public or private, is very different from one country to another. In most middle income countries, access to private capital is les constrained because of a combination of domestic and international flows, and money is available to flow into climate‐relevant sectors. However, not enough funds are going to mitigation projects because of both activity‐specific and country‐specific barriers that can lead to low demand for EE measures (UN, 2010a). In the least developed countries, access to capital is a real issue as domestic budgets are insufficient and private investors extremely wary of risk. Private investors invest where projects are the most attractive, and select the project with the highest rate of return after considering various alternatives. Because international investors look across different countries to find best opportunities, one role of public institutions is to provide finance so that the terms of EE projects in developing countries are as attractive as similar opportunities in developed countries.
Climate finance: flows and instruments
Private finance, in the form of debt or equity, represents the biggest share of climate finance, and private investors are more likely to invest in mature markets to ensure an expected return. In emerging markets, such as EE markets in developing countries, it is likely that borrowers may have more difficulty in accessing private funds and therefore the support of public financing vehicles may be needed. Governments or development banks may use grants or concessional loans or even provide funding at close to commercial terms to facilitate investments in EE projects. Once markets have become more mature, the commercial sector gets involved and private instruments are combined with public vehicles, e.g. a market rate loan can be consolidated by a public guarantee.
The Climate Policy Initiative (CPI) classified climate finance by instruments in 2010/2011, providing a good overview of the relative importance of each instrument within the data limitations (Figure 4). The figure shows, from left to right, the source of climate finance through to the intermediaries disbursing finance with different instruments and to what purpose, mitigation or adaptation. Domestic public budgets and private finance make up the majority of climate finance. Public finance is disbursed by national, bilateral and multilateral financial institutions via a range of financial instruments. Total average annual climate finance for mitigation purposes is estimated at USD 350 billion, out of a total of USD 364 billion, for 2010/2011 (Buchner et al., 2012).
Private finance, through project developers and corporate actors, using balance sheet finance, and commercial financial institutions, represents the biggest share of climate finance, accounting for around USD 250‐286 billion or 74% of climate finance flows. Public finance, made up mainly of developmental financial institutions (including domestic, bilateral and multilateral financial institutions) and domestic government budgets makes up the rest.
Public and private financial institutions play an important role in climate finance flows; CPI estimates that they raise and channel USD 110‐120 billion of global climate finance. Public

Plugging the energy efficiency gap with climate finance © OECD/IEA 2012
Page | 23
development banks distribute USD 76.8 billion, or about two‐thirds of these resources. The instruments delivering climate finance vary depending on the source or intermediary. However, CPI find that most climate finance – USD 276 – USD 310 billion out of a total USD 343 – USD 385 billion – can be classified as investment or, more generally, instruments that include ownership or claims and that balance sheet financing is the instrument most widely used (59%), followed by project‐level market rate debt (16%), and low‐cost debt (15%). Other categories of instruments such as carbon offset flows, grants, and project‐level equity make up the remainder of climate finance (Buchner et al., 2012).
The small share (18%) of climate finance found as concessional financial instruments in the form of low cost debt and grants is not a good sign for energy efficiency projects in developing countries, as these are generally the type of financing vehicles that are most used to finance EE projects outside of climate finance (Buchner et al., 2012). Another interesting fact is that carbon offsets – financial instruments created by the Kyoto Protocol to reduce GHG emissions – represent a very small share of instruments used in climate finance overall.
As we will see in the next section, carbon markets have not delivered many EE projects since their creation, but new mechanisms could give more importance to energy efficiency in climate finance.
Figure 4 • Climate finance flows for the year 2010/2011 (USD billion)
Notes: Figures are indicative estimates of annual flows for the latest year available, 2010 or 2011 (variable according to the data source). Flows are expressed in USD billions and rounded to produce whole numbers. Estimates spanning multiple years are adjusted to produce annual‐equivalent estimates. Where ranges of estimates are available, the mid‐point is presented. The diagram distinguishes between ‘incremental costs,’ that is, financial resources that cover the price difference between a cheaper, more polluting options and costlier, climate‐friendly ones and do not need to be paid back — and ‘capital investment,’ which are tangible investments in mitigation or adaptation projects that need to be paid back. Categories not representing capital investment, or a mix of capital investment and incremental costs, are incremental costs only. The group of National Finance Institutions includes Sub‐regional entities. Most data presented relates to commitments in a given year due to limited availability of disbursement data.
Source: Buchner et al. 2012

© OECD/IEA 2012 Plugging the energy efficiency gap with climate finance
Page | 24
The analysis of this report begins where the CPI tracking stopped; namely it endeavours to analyse what part of the “different disbursement channels” (to the right of Figure 4) is routed to energy efficiency projects, as part of the climate mitigation category.

Plugging the energy efficiency gap with climate finance © OECD/IEA 2012
Page | 25
Climate finance for energy efficiency in developing countries This section examines the role of climate finance in funding energy efficiency measures in developing countries. We explore, in particular, how carbon finance and international financial institutions (IFIs) in the form of MDBs and BDBs provide funds for energy efficiency measures in developing countries. While carbon finance could be expected through the Clean Development Mechanism (CDM) and Joint Implementation (JI) to be an important source of funds for energy efficiency, this has not been the case and therefore there are some lessons that can be learned. MDBs, on the other hand, play a key role in providing funds for energy efficiency measures in developing countries, and therefore we examined in more detail what is happening there. Using the data available, we then use leverage ratios to derive some estimates for investment leveraged through MDB finance for energy efficiency in developing countries. The last part of this section presents the Green Climate Fund (GCF) as a future source of climate finance and opportunity to fund energy efficiency measures.
Carbon finance and energy efficiency
Although a great success in many respects, carbon finance in the form of the Kyoto offset mechanisms and other international carbon offset flows have so far played a relatively modest role in the overall climate finance picture. Out of USD 343 – USD 386 billion estimated in annual international climate finance only USD 4.7 – USD 4.8 billion originated from international carbon offset markets (Buchner et al., 2012). The World Bank estimated the volume of primary Clean Development Mechanism (CDM) transactions in 2011 to almost USD 3 billion and the size of the voluntary carbon offset market to a little under USD 0.6 billion. The size of the carbon market has steadily fallen since its highest level in 2007 of USD 7.4 billion (World Bank, 2011; World Bank, 2012). The fall in market size can to a large extent be attributed to lack of ambition in developed countries Kyoto commitment as well as the uncertainty on the continuation of the Kyoto Protocol and its flexibility mechanisms post‐2012 and/or who will have access to them.
However, when comparing these numbers to the estimated cumulative additional (above planned and current) investments needed in non‐OECD countries to be on track for a 2°C scenario, USD 524 billion over 2011‐2020, it seems clear that international carbon finance will only be part of the solution in closing the funding gap (IEA, 2012). A large part of the financing needed is equity and debt financing of the underlying and initial investment for climate mitigation activities, while carbon finance is typically an instrument to finance the incremental costs of investing in low‐carbon options versus other options.
Furthermore, mechanisms like CDM lead to a shift in emissions, but not to a net reduction in global emissions, although they do facilitate the compliance of Kyoto Parties with their emission commitments. As substantial net reduction of emissions is also necessary in developing countries
to have a chance to stay within 2C, offset mechanisms like CDM at the current level of funding generated will never provide the full solution to the financing needs in developing countries.
Much of the financing needed, in particular in the large emerging economies, will need to come from domestic sources and not only through international carbon finance. At the same time carbon finance in the form of offset mechanisms will be an important part of the overall climate financing picture, as carbon finance often leverages much larger amounts of additional capital for underlying investments. The World Bank has estimated that between 2002 and 2009 about USD 25 billion worth of CDM credits leveraged more than an estimated USD 100 billion in underlying

© OECD/IEA 2012 Plugging the energy efficiency gap with climate finance
Page | 26
low‐carbon investments (WB, 2010). Carbon markets have also been mentioned as a potential source of financing for the GCF. It is therefore worth taking a closer look at how a current carbon finance mechanism like the CDM has supported EE projects to date.
Box 3 • The UNFCCC Financial Mechanism
Source : UNDP, personal communication
Financing of energy efficiency projects under CDM
CDM is one of the flexibility mechanisms included in the Kyoto Protocol. It allows countries with
The United Nations Framework Convention on Climate Change (the Convention) and the Kyoto Protocol both foresee financial assistance from Parties with more resources to those less endowed and more vulnerable. Developed country Parties (Annex I Parties) are expected to provide financial resources to assist developing country Parties in implementing the Convention. To facilitate this, the Convention established a ‘financial mechanism’ to provide funds to developing country Parties. The Convention, under its Article 11, states that the operation of the financial mechanism is entrusted to one or more existing international entities. Article 11.1 provides for “a mechanism for the provision of financial resources on a grant or concessional basis, including for the transfer of technology”.
The Global Environment Facility (the GEF) began as a pilot facility in 1990, and in 1992 became an interim operating entity of the financial mechanism of the Convention. In 1994, the GEF was formally confirmed as being an operating entity of the financial mechanism of the Convention. This arrangement is subject to review every 4 years.
The strengths of having the GEF as the operating entity of the financial mechanism of the Convention have historically been:
• The fact that the GEF is financial mechanism of 4 Conventions (UNFCCC, Convention on Biological Diversity (CBD), Stockholm Convention on Persistent Organic Pollutants (POPs) and the UN Convention to Combat Desertification (UNCCD) – and well as supporting implementation of the Montreal Protocol on Substances that Deplete the Ozone Layer (MP) in economies in transition – means that, in principle at least, synergies and coherence between the Conventions can be sought.
• Through its family of implementing agencies – originally three (UNDP, UNEP, the World Bank) and currently ten (UNDP, UNEP, UNIDO, FAO, IFAD, WB, African Development Bank, Asian Development Bank, European Bank for Reconstruction and Development, Inter‐American Development Bank) – the GEF avoided the need to create a new set of international institutions but, instead, could leverage the infrastructure of already‐existing institutions.
The weakness of the GEF as the operating entity of the financial mechanism of the Convention is that its relationship with the Conference of the Parties (COP) is indirect. It reports to the COP but it is responsible to the GEF Council for overall governance. Some Parties have expressed concern that, as a result, the GEF is subject to divergent demands, that the GEF Secretariat has over time accumulated greater discretionary powers, and that the GEF is not sufficiently ‘linked’ to the COP.
It seems likely that more GEF agencies will be accredited ‐ at its June 2012 meeting, the GEF Council decided to approve 11 agencies to progress onto Stage 2 of the accreditation process. As part of this expansion process, for the first time national institutions will – subject to meeting fiduciary and other standards – be permitted to become GEF agencies. This represents a move towards a ‘direct access’ modality, whereby countries will be able to access STAR resources directly, without going through an international GEF agency.
The arrival of the Green Climate Fund (GCF) under the Convention means that the GEF is no longer the sole operating entity of the financial mechanism of the Convention but is now one of two. The UNFCCC Secretariat and the GEF Secretariat are providing intermediate secretariat services to the GCF until such time that an independent GCF secretariat is established
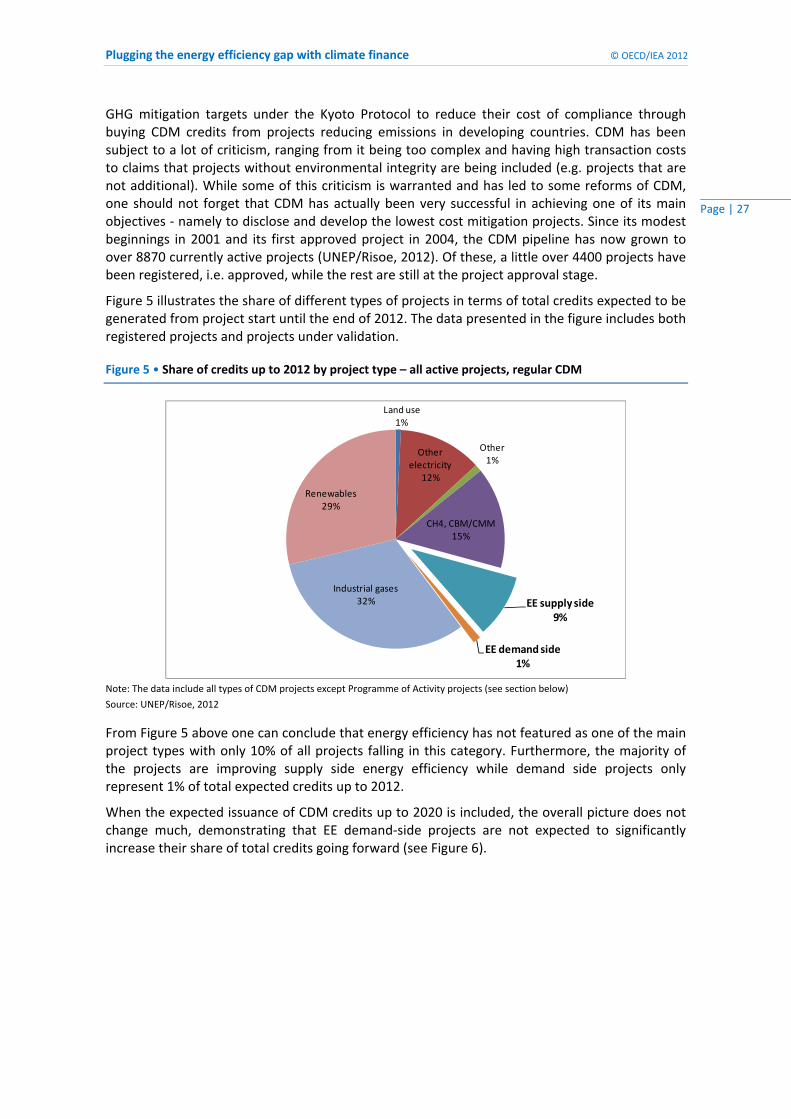
Plugging the energy efficiency gap with climate finance © OECD/IEA 2012
Page | 27
GHG mitigation targets under the Kyoto Protocol to reduce their cost of compliance through buying CDM credits from projects reducing emissions in developing countries. CDM has been subject to a lot of criticism, ranging from it being too complex and having high transaction costs to claims that projects without environmental integrity are being included (e.g. projects that are not additional). While some of this criticism is warranted and has led to some reforms of CDM, one should not forget that CDM has actually been very successful in achieving one of its main objectives ‐ namely to disclose and develop the lowest cost mitigation projects. Since its modest beginnings in 2001 and its first approved project in 2004, the CDM pipeline has now grown to over 8870 currently active projects (UNEP/Risoe, 2012). Of these, a little over 4400 projects have been registered, i.e. approved, while the rest are still at the project approval stage.
Figure 5 illustrates the share of different types of projects in terms of total credits expected to be generated from project start until the end of 2012. The data presented in the figure includes both registered projects and projects under validation.
Figure 5 • Share of credits up to 2012 by project type – all active projects, regular CDM
Land use1%
Other electricity
12%
Other1%
CH4, CBM/CMM15%
EE supply side9%
EE demand side1%
Industrial gases32%
Renewables29%
Note: The data include all types of CDM projects except Programme of Activity projects (see section below)
Source: UNEP/Risoe, 2012
From Figure 5 above one can conclude that energy efficiency has not featured as one of the main project types with only 10% of all projects falling in this category. Furthermore, the majority of the projects are improving supply side energy efficiency while demand side projects only represent 1% of total expected credits up to 2012.
When the expected issuance of CDM credits up to 2020 is included, the overall picture does not change much, demonstrating that EE demand‐side projects are not expected to significantly increase their share of total credits going forward (see Figure 6).
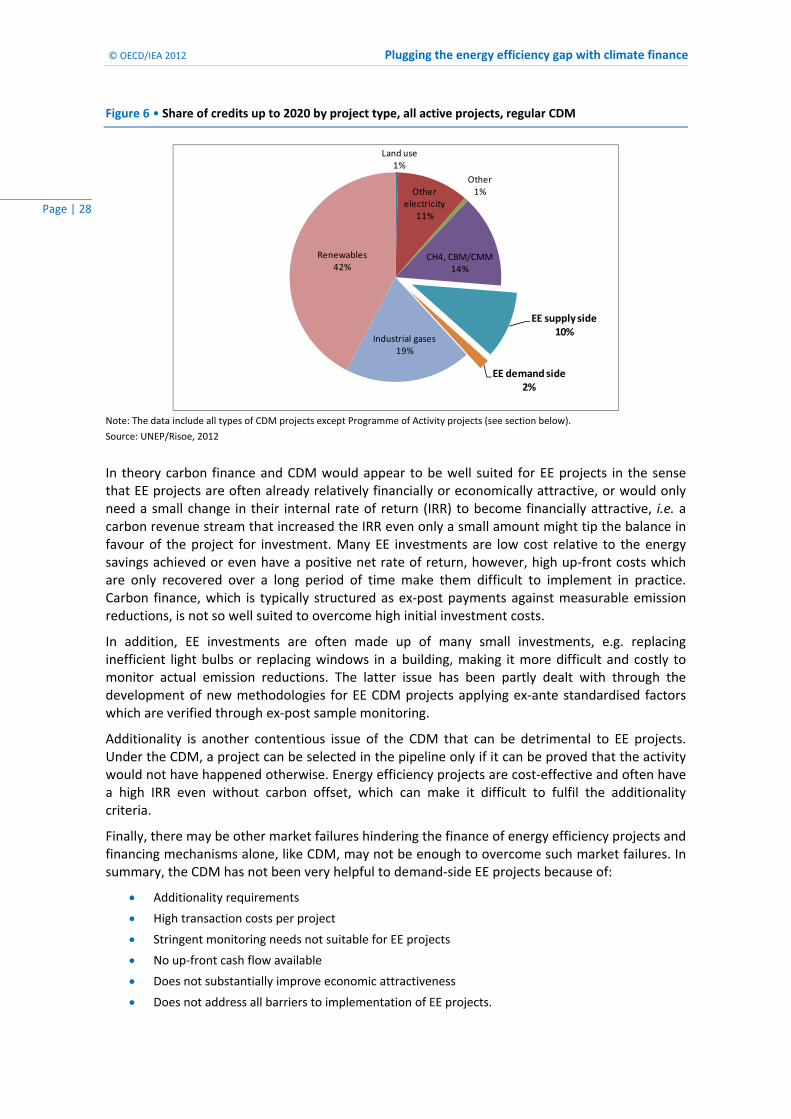
© OECD/IEA 2012 Plugging the energy efficiency gap with climate finance
Page | 28
Figure 6 • Share of credits up to 2020 by project type, all active projects, regular CDM
Land use
1%
Other electricity
11%
Other1%
CH4, CBM/CMM14%
EE supply side10%
EE demand side2%
Industrial gases19%
Renewables42%
Note: The data include all types of CDM projects except Programme of Activity projects (see section below).
Source: UNEP/Risoe, 2012
In theory carbon finance and CDM would appear to be well suited for EE projects in the sense that EE projects are often already relatively financially or economically attractive, or would only need a small change in their internal rate of return (IRR) to become financially attractive, i.e. a carbon revenue stream that increased the IRR even only a small amount might tip the balance in favour of the project for investment. Many EE investments are low cost relative to the energy savings achieved or even have a positive net rate of return, however, high up‐front costs which are only recovered over a long period of time make them difficult to implement in practice. Carbon finance, which is typically structured as ex‐post payments against measurable emission reductions, is not so well suited to overcome high initial investment costs.
In addition, EE investments are often made up of many small investments, e.g. replacing inefficient light bulbs or replacing windows in a building, making it more difficult and costly to monitor actual emission reductions. The latter issue has been partly dealt with through the development of new methodologies for EE CDM projects applying ex‐ante standardised factors which are verified through ex‐post sample monitoring.
Additionality is another contentious issue of the CDM that can be detrimental to EE projects. Under the CDM, a project can be selected in the pipeline only if it can be proved that the activity would not have happened otherwise. Energy efficiency projects are cost‐effective and often have a high IRR even without carbon offset, which can make it difficult to fulfil the additionality criteria.
Finally, there may be other market failures hindering the finance of energy efficiency projects and financing mechanisms alone, like CDM, may not be enough to overcome such market failures. In summary, the CDM has not been very helpful to demand‐side EE projects because of:
Additionality requirements
High transaction costs per project
Stringent monitoring needs not suitable for EE projects
No up‐front cash flow available
Does not substantially improve economic attractiveness
Does not address all barriers to implementation of EE projects.

Plugging the energy efficiency gap with climate finance © OECD/IEA 2012
Page | 29
Page | 29
CDM Programme of Activities
During the first meeting of the parties of the Kyoto Protocol (MOP1) a new category of CDM projects, Programmes of Activities (PoAs), was introduced. The idea behind PoAs was to allow replicable projects with low and physically dispersed GHG emissions reductions activities to be combined into a programme of activities. This would facilitate the realisation of CDM projects that would have been difficult and costly to develop on a project-by-project basis.14 The introduction of PoAs would therefore seem to hold much promise for energy efficiency, and demand side efficiency in particular.
After a relatively slow start following the adoption of the initial PoA rules and forms in 2007 there are as of August, 2012 28 PoAs approved, and under these 108 actual programme activities have been registered. In addition there are 342 PoAs at the validation stage. Figure 7 illustrates, based on data for all active PoAs, the shares of different types of PoAs in terms of total credits expected to be generated from PoA start until the end of 2012.
Figure 7 • Share of credits up to 2012 by project type, all active PoAs
Source: UNEP/Risoe, 2012
Comparing Figure 7 above to the equivalent analysis for regular CDM projects (see Figure 5) two points stand out. Firstly, the overall share of EE is much higher in the case of PoAs. Secondly, demand-side EE, as supposed to supply side EE, dominates the general EE category for PoAs. The is the opposite result of the analysis of regular CDM projects. Within the demand side category residential EE projects dominates, which further underline the applicability of PoAs for projects with many and dispersed mitigation activities. It should be noted, however, the overall volume of credits from PoAs expected is still much lower than from regular CDM projects. Total volume of credits from PoAs until the end of 2012 represents only 1% of expected total credits from regular CDM projects, but PoAs have of course also been in existence much shorter than regular CDM.
14 For further details on the rules and procedures of PoAs see for instance: Baker & McKenzie, CDM Rulebook (http://cdmrulebook.org/452) or UNEP (2009): A Primer on CDM Programme of Activities (http://cd4cdm.org/Publications/PrimerCMDPoA.pdf)

© OECD/IEA 2012 Plugging the energy efficiency gap with climate finance
Page | 30
Up to 2020 the volume of expected credits from PoAs represent 21% of the expected volume from regular CDM.
The much higher share of EE demand‐side activites for PoAs compared to the share of regular CDM projects shows that part of the original objective of the PoA instrument ‐ to facilitate the implementation of clusters of projects that are difficult to develop on a project‐by project basis ‐ has been successful. The flexibility to package many small project activites into a large programme, and being able to add projects over time, clearly has made EE demand side projects much easier to develop under PoAs. The experience from CDM illustrates that reaching the full potential of EE as mitigation measures may require funding instruments that are dedicted to EE projects, or at least are structured to overcome some of the particular barriers to EE investments.
Box 4 • CDM Programme of Activities for sustainable housing in Mexico
Source: IEA (2012) ; UNEP, 2012 pp. 44‐45
www.unepp. org/urban_environment/PDFs/UNEP_UrbanCDMreport.pdf
Improving PoA and new carbon market mechanisms for EE
The PoA rules could be further improved to facilitate EE projects. For example, current PoA rules specify that the adoption of mandatory policies and regulations cannot be submitted as a PoA. This is only allowed if it can be demonstrated that these policies and regulations are systematically not enforced without the PoA. Some of the barriers to EE finance are directly related to the lack of policies and regulations for EE and PoA as an instrument will not directly help in overcoming these barriers.
In addition, it is required that emission reductions can be traced to the implementation of the PoA. Against this background, analysis has shown that EE programmes that provide direct incentives to replace inefficient technologies are more likely to be approved under PoA rules. For policy‐based EE programmes, such as reducing import tariffs on energy‐efficient equipment, it is more difficult to demonstrate the direct link between policy implementation and emission reductions (Figueres and Philips, 2007).
Following the latest Conference of the Parties (COP) in December 2011 there is now a mandate to develop a new market‐based mechanism under the UNFCCC.15 While the detailed modalities
15 See FCCC/CP/2011/9/Add.1 (http://unfccc.int/resource/docs/2011/cop17/eng/09a01.pdf) and http://unfccc.int/files/bodies/awg‐lca/application/pdf/information_note__nmm_rev.pdf
The Mexican National Housing Commission CONAVI has registered a small‐scale PoA project which provides subsidies as well as loan supplements for the purchase of homes equipped with energy efficient and renewable energy technologies. Originally, the programme was created in 2007 to provide subsidies to low‐income families for the purchase of affordable houses. The programme has evolved to also include environmental concerns. Energy efficient technologies used include CFL lighting and thermal insulation. As the subsidies are distributed via mortgage issuers, they have often been combined with loan programmes and used as partial debt relief. Mortgage providers have also developed new schemes, such as the green mortgage programme implemented by the National Fund for Housing, which is the largest provider of residential mortgages in Mexico. Mexico has applied for registration of these programmes as a CDM PoA. All green residential financing in Mexico is eligible under this PoA, meeting the additionality criteria. Given the long lead times of registration and issuance of certified emission reductions (CER), the programmes will benefit from a successful registration only from 2013 onwards. Funds acquired through the mechanism could then be used to refund the participating programmes.
Plugging the energy efficiency gap with climate finance © OECD/IEA 2012
Page | 31
and procedures are still to be developed, some core elements were agreed at the previous COP in Cancun that indicate that EE projects might be better supported in the future.
The general principles for a new market mechanism agreed at COP 16 include, inter alia, the following principles:
That a new market mechanism should achieve net global emission reductions which means that credits would only be awarded for action demonstrated as "beyond business‐as‐usual". This again implies a move away from a pure offsetting mechanism in the sense that countries would first have to realise some domestic emission reductions taking them beyond business‐as‐usual emission levels before being credited. This principle also means that policies that are already being enforced could still qualify for crediting, i.e. they could be part of the crediting baseline.
Secondly, the new market mechanism should stimulate mitigation across broad segments of the economy. This is not more closely defined in the negotiation text but points to a market mechanism that would focus on broad programmes with sector wide impacts rather than a project‐based approach.
Both these principles indicate a new market mechanism could be established that could provide more targeted support for putting in place broad domestic policy frameworks. This would facilitate the implementation of more comprehensive policies, including policy‐based EE programmes for which the PoA instrument may not be applicable. The use of standardised or sectoral baselines could also reduce transaction costs and obviate the need for additionality testing. A new market mechanisms established under the COP could therefore help overcome some of the barriers to EE investments that CDM, including PoAs, cannot.
© OECD/IEA 2012 Plugging the energy efficiency gap with climate finance
Page | 32
International financial institutions: key investors in energy efficiency
Multilateral, bilateral and national financial institutions play a key role in climate finance and can be expected to do so also in energy efficiency. It is estimated that in 2011 they provided approximately USD 76.8 billion, 21% of total climate finance (Buchner et al., 2012). It is problematic to estimate what share of that is used to finance EE measures.
International financial institutions or IFIs are important in addressing market barriers to EE finance (high perceived risk, high transaction costs, etc.). The role of national financial institutions in financing energy efficiency in developing countries is also growing but is less documented and is not the focus of this study. As the bulk of climate investments should come from the private sector, the role of multilateral financial institutions (MFIs) and bilateral financial institutions (BFIs) is to use their resources and instruments in the most efficient way to both familiarise the market and leverage private finance for EE projects.
Multilateral and bilateral financial institutions, collectively IFIs, are broadly defined as development institutions with a banking business model which promotes economic growth and development. They provide concessional and non‐concessional lending, but also technical assistance, development research and advisory services.
IFIs raise funds in international debt markets and their credit quality is usually very high (AAA rating), given the strong support they have from member countries. This good credit raking allows them to borrow at the lowest cost, and then to lend at concessional rates. Bilateral development banks also provide concessional funding in developing countries, but unlike MDBs they are generally answerable to a single government and are often part of a government ministry. The term “bilateral” can be misleading as it implies a single‐country ownership, but BFIs can be connected to a group of countries.
There is a multitude of multilateral and bilateral financial institutions around the world engaged at a regional or global level. Table 2 presents a selection of the most important institutions acting in climate mitigation, a list that can of course be extended.

Plugging the energy efficiency gap with climate finance © OECD/IEA 2012
Page | 33
Table 2 • Selected multilateral and bilateral financing sources
Financing institutions Geographic coverage
Multilateral sources African Development Bank (AfDB) Africa
Asian Development Bank (ADB) Asia and Pacific
European Bank for Reconstruction and Development (EBRD)
EU, Central and Eastern Europe
European Investment Bank (EIB) EU, Central and Eastern Europe
Global Environment Facility (GEF) Worldwide
Inter-American Development Bank (IDB) Latin America and Caribbean
International Finance Corporation (IFC) Worldwide
United Nations Development Programme (UNDP) Worldwide
United Nations Environment Programme (UNEP) Worldwide
World Bank Group (WBG) Worldwide
Bilateral sources
Australian Aid Agency (AusAID) Southeast Asia and Pacific
Canadian International Development Agency (CIDA) Worldwide
Danish International Development Agency (DANIDA) Worldwide
Department of International Development (DfID) Worldwide
French Development Agency (AFD) Worldwide
German Bank for Reconstruction and Development (KfW) Worldwide
Japanese Bank for International Cooperation (JBIC) Worldwide
Japan International Cooperation Agency (JICA) Worldwide
Norwegian Agency for Development Cooperation (NORAD) Worldwide
Swedish International Development Agency (SIDA) Worldwide
US Agency for International Development (USAID) Worldwide
Export-Import Bank of the United States (USEx-Im) Worldwide
Note : EIB, the European Commission, the Nordic Development Fund, the Islamic Development Bank and the OPEC Fund are MFIs but not MDBs. For simplification in our report, we will include EIB in the category of MDBs.
Source: adapted from Limaye, D. and X. Zhou, 2012
Data and methodology
The data on all EE finance and especially as part of climate finance, in developing countries is lacking. In an attempt to fill this gap, the IEA surveyed as part of this project the five main multilateral development banks (MDBs) funding energy efficiency: the Asian Development Bank (ADB), the European Bank for Reconstruction and Development (EBRD), the European Investment Bank (EIB), The Inter‐American Development Bank (IDB) and the World Bank Group (WBG),16 and several BFIs: KfW, AfD, BNDES, JICA, JBIC. The purpose of this survey was to understand IFIs’ experience with the financing and implementation of energy efficiency projects in developing countries. Since fewer bilateral sources involved in EE finance were surveyed, the overall picture of EE finance by BFIs in this report is less complete. However the results of the BFI survey, combined with recent literature, should provide an overview of the state of play of EE finance with BFIs. The information provided by bilateral banks also provided helpful context for the current EE funding environment in developing countries. Annex A presents the model of questionnaires sent to financial institutions before in‐depth interviews.
IFIs do not have a common definition of energy efficiency, and thus consider different sectors for energy efficiency. This heterogeneity makes comparison between sectors impossible, stressing the need for harmonisation of reporting.
16 The World Bank Group includes five agencies : the International Bank for Reconstruction and Development (IBRD), the International Development Association (IDA), the International Finance Corporation (IFC), the Multilateral Guarantee Agency (MIGA) and the International Center for the Settlement of Investment Disputes (ICSID).

© OECD/IEA 2012 Plugging the energy efficiency gap with climate finance
Page | 34
Table 3 shows some examples of EE categorisations for three of the MDBs surveyed.
Table 3 • Energy efficiency sectors for selected MDBs
ADB EBRD EIB
Energy Industry Industry
Finance Sustainable Energy Financing Facilities Buildings
Multi sector Cleaner Energy Production District heating
Waste and municipal infrastructure services
Municipal infrastructure Cogeneration (combined heat and power)
The majority of IFIs do not categorise their energy efficiency commitments by specific EE sector, but by business areas or projects that can include EE. Also energy efficiency projects are often categorised together with renewable energy projects as “clean energy”, making it difficult to identify energy efficiency projects without examining many individual project evaluation reports that may be difficult to obtain and contain a time lag.
Despite all of these challenges, we attempted to collect IFIs’ financial support for energy efficiency only, asking IFIs to exclude everything that was not energy efficiency (e.g.: exclude the part of a common project renewable/energy efficiency dedicated to renewable energies). Details on the methodology for calculation are provided on Box 5.
Box 5 • Definition of EE for the purpose of EE finance calculations
BFIs funding of energy efficiency
Several reports have examined the role of BFIs in climate finance and have reported values for the share spent on energy efficiency. A report by Ecofys for the International Development Finance Club (IDFC) examined green financing activities of 19 bilateral and national financial institutions amounted to USD 89 billion in 2011, of which USD 45 billion was spent by OECD BFIs and USD 44 billion by non‐OECD BFIs. The OECD BFIs invested USD 15 billion in non‐OECD countries and the non‐OECD BFIs invested 100% of their green finance in their home countries.
Collecting energy efficiency finance data from IFIs is a challenge because of the difficulty defining investments in energy efficiency. Even with large‐scale projects, i.e. in industry, it is difficult to separate what finance may be classed as used for energy efficiency investments, as distinct from “normal” capital investments or upgrades or process improvements
To deal with this issue, for this analysis we have not counted some categories when they could be clearly identified. Transport finance was excluded since this mainly relates to refurbishment of rolling stock and other infrastructure. Similarly, the power sector has mainly been left out, except where it is clear the funding has been for process improvements, as big portions of so‐called energy efficiency funding in the power sector are allocated to improving transmission lines and networks or fuel‐switching. This means that most of the funds reported are for end‐use industrial and buildings energy efficiency measures.
For example, to estimate IDB's finance of energy efficiency measures, we excluded all "transmission lines" projects since they often include construction of new infrastructure leading to a reduction of technical losses, but the minimisation of technical losses part ‐ that we consider as an energy efficiency improvement ‐ could not be identified separately. For this reason, we did not account transmission projects at all. Hence, it should be noticed that the numbers we present here for IDB are just estimations, and that real investments in energy efficiency led by IDB might be higher.
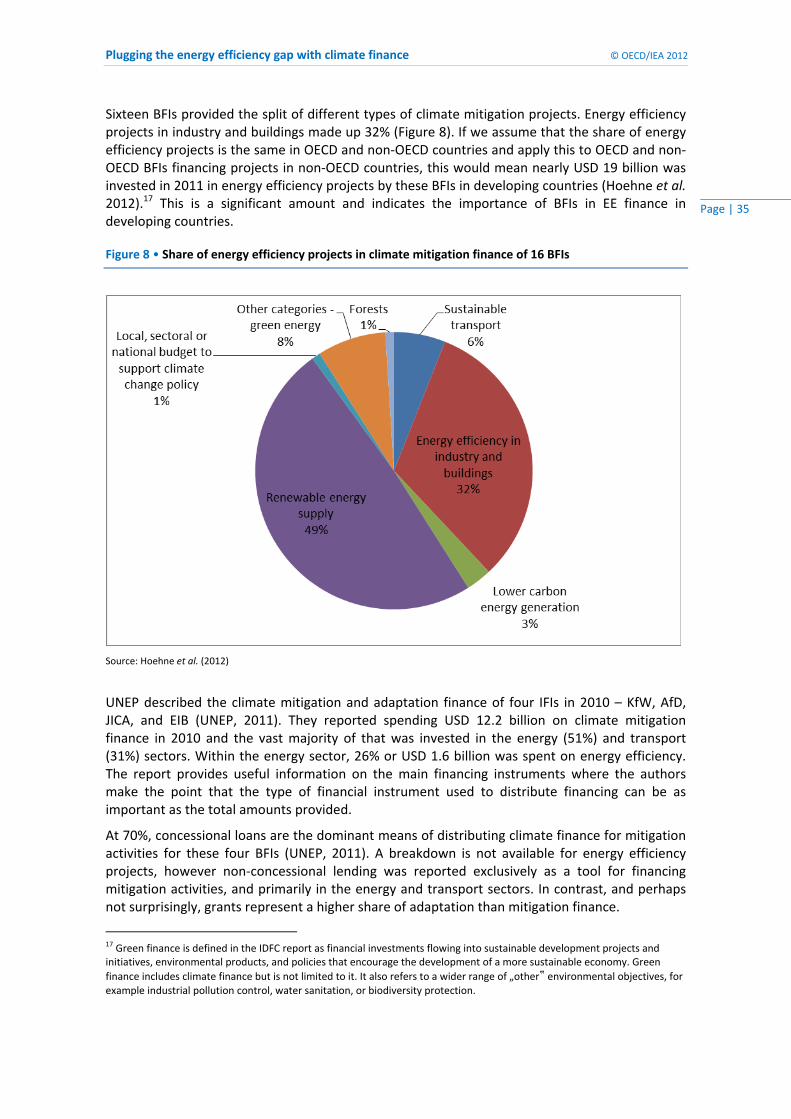
Plugging the energy efficiency gap with climate finance © OECD/IEA 2012
Page | 35
Sixteen BFIs provided the split of different types of climate mitigation projects. Energy efficiency projects in industry and buildings made up 32% (Figure 8). If we assume that the share of energy efficiency projects is the same in OECD and non‐OECD countries and apply this to OECD and non‐OECD BFIs financing projects in non‐OECD countries, this would mean nearly USD 19 billion was invested in 2011 in energy efficiency projects by these BFIs in developing countries (Hoehne et al. 2012).17 This is a significant amount and indicates the importance of BFIs in EE finance in developing countries.
Figure 8 • Share of energy efficiency projects in climate mitigation finance of 16 BFIs
Source: Hoehne et al. (2012)
UNEP described the climate mitigation and adaptation finance of four IFIs in 2010 – KfW, AfD, JICA, and EIB (UNEP, 2011). They reported spending USD 12.2 billion on climate mitigation finance in 2010 and the vast majority of that was invested in the energy (51%) and transport (31%) sectors. Within the energy sector, 26% or USD 1.6 billion was spent on energy efficiency. The report provides useful information on the main financing instruments where the authors make the point that the type of financial instrument used to distribute financing can be as important as the total amounts provided.
At 70%, concessional loans are the dominant means of distributing climate finance for mitigation activities for these four BFIs (UNEP, 2011). A breakdown is not available for energy efficiency projects, however non‐concessional lending was reported exclusively as a tool for financing mitigation activities, and primarily in the energy and transport sectors. In contrast, and perhaps not surprisingly, grants represent a higher share of adaptation than mitigation finance.
17 Green finance is defined in the IDFC report as financial investments flowing into sustainable development projects and initiatives, environmental products, and policies that encourage the development of a more sustainable economy. Green
finance includes climate finance but is not limited to it. It also refers to a wider range of „other‟ environmental objectives, for example industrial pollution control, water sanitation, or biodiversity protection.

© OECD/IEA 2012 Plugging the energy efficiency gap with climate finance
Page | 36
Table 4 • Use of different financial instruments by four BFIs in 2010 (USD millions)
Financial instrument Mitigation Adaptation Total
Grants 857 771 1628 Concessional loans 8904 2030 10934 Non‐concessional loans
3100 54 3154
Other 4 0 4 Total 12865 2855 15720
Source: UNEP (2011)
The IEA survey of BFIs provided some more details and context to BFI lending to EE projects in developing countries.
Lending to EE projects makes up 20‐25% of mitigation climate change lending by the French development agency AFD amounting to approximately USD 500‐700 million annually.18 The average size for AFD project lending is USD 19‐25 million and therefore there is very little lending directly to EE projects, as they are generally too small. However the energy efficiency project portfolio grew in 2011 to EUR 175 million with several large projects in China in district heating and buildings.
A significant share of EE finance is in the form of credit lines to local banks to be on‐lent for smaller EE projects, however it is difficult to ex ante track the projects that are beneficiaries of the loans. A challenge is to encourage banks to see EE lending as an attractive proposition and to help them create their own assessment capacities and product lines for this kind of project. Grants to finance capacity building and to share assessment and feasibility costs can help break this barrier and then credit lines can subsequently be rolled out. To be classified as “climate”, all AFD EE financing requires projects to achieve carbon savings compared to the situation without project/investment. It means that no EE greenfield project can be classified as “climate” nor projects that reduce carbon intensity but lead to a net increase in GHG emissions (those projects are called green technology projects). In terms of geographic regions, the region with most EE projects financed by AFD is Asia and Turkey is the single country receiving the highest amount of finance for EE where a USD 1.3 billion credit line is planned for EE projects, mainly in industry. In the past, funding for technical assistance was provided but this is now limited and technical assistance tends to be funding through EU and FFEM programmes.19 A subsidiary of AFD, Proparco, is dedicated to financing the private sector and provides equity, credit line and guarantees (in cooperation with local banks) to SMEs for EE projects. As renewable energy technology because more established, these projects are increasingly being financed by Proparco, while EE projects are gaining in importance for AFD climate mitigation portfolio."
In 2011, the energy efficiency portfolio of KfW development bank consisted of 97 projects with a total amount of USD 3.16 billion and an additional USD 42 million for technical assistance. Geographically, the focus has been on Asia (27 projects – USD 1.46 billion) and Europe/Caucasus (57 projects – USD 1.26 billion), but there are also considerably smaller commitments to Sub‐Saharan Africa, the MENA region and Latin America. The share of EE projects in overall commitments has been increasing annually.
The number of EE projects split between supply‐ and demand‐side projects is nearly even, however the amount of funding is significantly higher for supply‐side projects (USD 2.32 billion for 51 projects) compared with demand‐side projects (USD 0.84 billion for 46 projects). On the
18 (depends what you include in EE : fuel switch? Transport ?) 19 Fonds Francais pour l’Environment Mondial (www.ffem.fr)

Plugging the energy efficiency gap with climate finance © OECD/IEA 2012
Page | 37
demand‐side, energy efficiency in industries as well as SMEs comprise USD 275 million or 12 projects and projects that improve energy efficiency in public, private and commercial buildings make up 12 projects worth USD 223 million. The remaining 22 projects (USD 349 million) contain measures concerning industries and buildings. The majority of projects have been financed via loan contracts (67 projects); grants were used to finance the other 30 EE projects which mainly covered technical assistance complementary to loan‐financed investment measures.
KfW co‐funds the Global Climate Partnership Fund (GCPF) with the German Ministry of Environment, Nature Conservation and Nuclear Safety (BMU), Danida, the IFC and Deutsche Bank. These shareholders committed 204 million EUR for EE projects that are separated into a junior‐, a mezzanine‐ and a senior tranche. By offering tranches of different risk to investors GCPF helps to mobilize private capital for energy efficiency investments in PPP structures (Public Private Partnership). In 2011 the GCPF committed funds amounting to 90 million EUR to Ukreximbank (Ukraine – 30 million EUR), Sekerbank (Turkey – 25 million EUR), Banco Pichincha (Ecuador ‐ 15 million EUR), Banco ProCredit (Ecuador – 10 milllion EUR) and Vietinbank (Vietnam – 10 million EUR) for EE investments.
The Japanese development bank JICA reported spending USD 637 million on energy efficiency projects in developing countries in 2010. JICA provides highly concessional loans for climate change projects, ranging from 0.2% – 0.6%; countries with lower income receive lowest interest rates. JICA also provides assistance for the training of energy management staff, particularly in Thailand, Turkey and Poland. The Japanese Bank for International Cooperation (JBIC) is another important actor in funding EE projects in developing countries. It promotes Japanese external policy (often through export credit) and provides climate finance covering infrastructure, renewable energy, energy efficiency and CDM/JI. The Global action for Reconciling Economic growth and ENvironmental preservation (GREEN) initiative requires monitoring reporting and verification (MRV) and funding is only provided when project developers can confirm reductions using a standardised method (Hongo, 2012). Due to the small size of EE projects, credit lines are often provided to local banks. Most of the EE projects funded by JBIC are on the supply‐side and USD 1.75 billion was provided in loans, credit lines and guarantees for energy efficiency projects over 2010‐2011. JBIC is required to supplement private finance and therefore to co‐finance, typically making up around 60% of finance.
MFIs’ funding of energy efficiency
As part of this work, the IEA surveyed seven MFIs – the World Bank Group, EIB, EBRD, ADB, IDB, UNEP and UNDP. The first five are multilateral development banks (MDBs) whereas the latter two are agencies of the United Nations and play a role in supporting EE projects technically and financial in many of the poorest countries and as agents disbursing the Global Environment Fund.
Total funding for EE projects from the five MDBs is estimated at USD 5.5 billion at 2011. The EBRD leads in terms of funding by MDBs in energy efficiency in developing countries, with nearly than USD 2 billion in 2011, followed by the World Bank Group which financed energy efficiency projects for USD 1.5 billion in 2011. EE funding by the ADB and the IDB is lower in absolute numbers – respectively USD 0.9 billion and USD 0.5 billion. The small figure for the EIB – USD 0.48 billion – can be explained by the fact that the EIB mainly invests in EU (European Union) member countries, but we counted here only flows going to developing countries, to be consistent with

© OECD/IEA 2012 Plugging the energy efficiency gap with climate finance
Page | 38
the definition of climate finance (flows from developed to developing countries) used for this report.20
Table 5 • Multilateral Development Banks’ energy efficiency finance in 2011 and annual average (USD million)
MDB 2011
(USD million) Annual average (2008-2011)
(USD million)
ADB
949
564
EBRD
1 993
1 727
EIB
482
557
IDB
508
419
WBG
1 532
1 636
TOTAL
5 464
4 901 Note: EIB funding includes non EU member countries + EU Eastern European countries (Bulgaria, Czech Republic, Hungary, Poland, Romania, Slovakia, Slovenia) only (not the rest of the EU)
Source: IEA survey and analysis.
Energy efficiency represents a very small share of MDB’s overall activities (Figure 9). Energy efficiency financial support ranges between 2% and 7% of total lending, except for the EBRD for which EE is a core activity. Since its creation in 1991, the EBRD had had a mandate to work on environment, including energy efficiency, and dedicated 15% of its total commitments to EE in 2011. Annex B presents in more detail the strategies of MDBs to address climate change and energy efficiency. There are clear differences in mandate between the MDBs, which are reflected in the priority given to the energy sector, and energy efficiency in particular, by the individual MDBs.
20 EIB finance is reported for non EU countries and EU Eastern European countries below the USD 12 450 threshold for developing countries (Bulgaria, Czech Republic, Hungary, Poland, Romania, Slovakia, Slovenia).
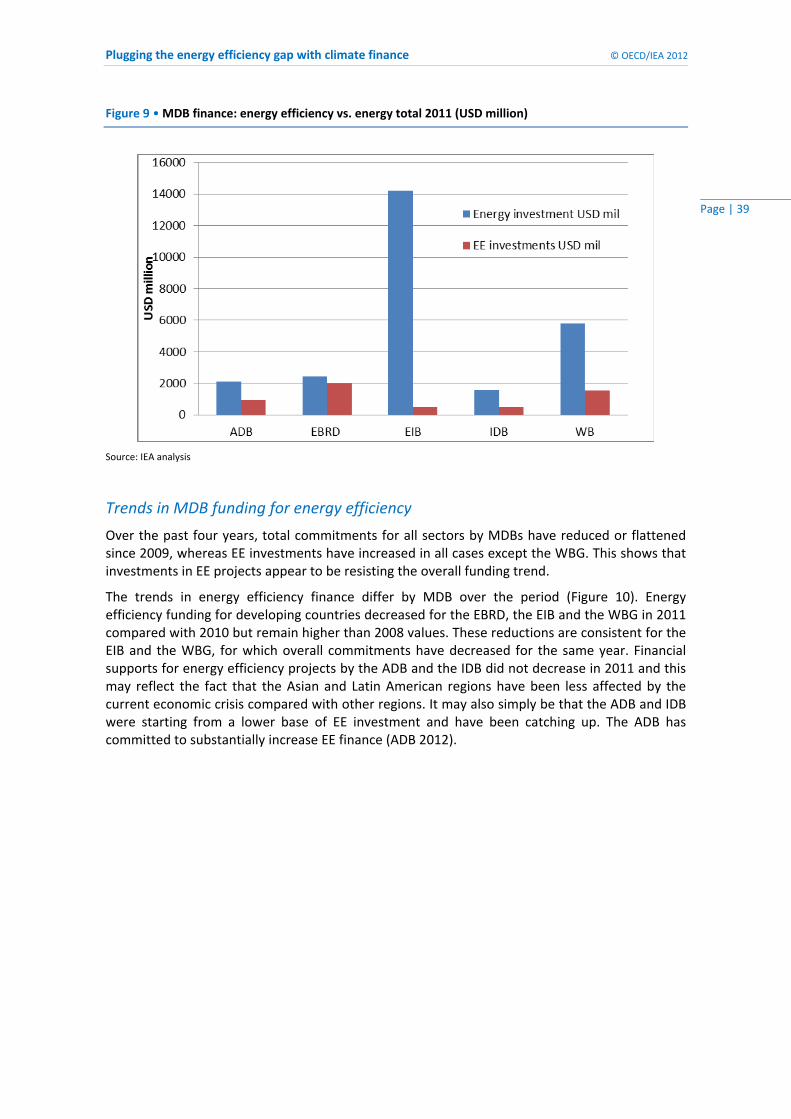
Plugging the energy efficiency gap with climate finance © OECD/IEA 2012
Page | 39
Figure 9 • MDB finance: energy efficiency vs. energy total 2011 (USD million)
Source: IEA analysis
Trends in MDB funding for energy efficiency
Over the past four years, total commitments for all sectors by MDBs have reduced or flattened since 2009, whereas EE investments have increased in all cases except the WBG. This shows that investments in EE projects appear to be resisting the overall funding trend.
The trends in energy efficiency finance differ by MDB over the period (Figure 10). Energy efficiency funding for developing countries decreased for the EBRD, the EIB and the WBG in 2011 compared with 2010 but remain higher than 2008 values. These reductions are consistent for the EIB and the WBG, for which overall commitments have decreased for the same year. Financial supports for energy efficiency projects by the ADB and the IDB did not decrease in 2011 and this may reflect the fact that the Asian and Latin American regions have been less affected by the current economic crisis compared with other regions. It may also simply be that the ADB and IDB were starting from a lower base of EE investment and have been catching up. The ADB has committed to substantially increase EE finance (ADB 2012).

© OECD/IEA 2012 Plugging the energy efficiency gap with climate finance
Page | 40
Figure 10 • MDBs’ investments in energy efficiency 2008‐2011 (USD million)
Source : IEA analysis
Most multilateral development banks provide funding within a specific region: the ADB in Asia; the IDB in Latin America; the EBRD in Central Europe and Central Asia. Eastern Europe and Central Asia attract the majority of investments, due to EIB, ADB and EBRD funding in the region (USD 2.5 billion of EE finance in 2011 for the two MDBs).
Figure 11 • Regional breakdown (in value) of MDB finance for energy efficiency over the period 2008‐2011
Source : IEA analysis

Plugging the energy efficiency gap with climate finance © OECD/IEA 2012
Page | 41
The World Bank Group is the only institution of the five MDBs examined providing financial support worldwide. In 2011, the WBG realised the highest share of its EE funding in Latin America (29%), followed by Eastern Asia and Pacific (28%), and Europe and Central Asia (26%). The split of funding is even between the three regions, while lending in Africa (sub‐Saharan), and in North Africa and the Middle East is behind with respectively 16% and 1% of the WBG’s energy efficiency funding in 2011. This distribution is quite representative of the general situation: middle income countries receive most MDB’s lending for EE.
Multilateral Development Banks encounter some barriers when financing EE in the poorest countries. Energy efficiency loans or grants need to be accompanied by technical capacity and knowledge to success, which may be weaker in LDCs. Mature financial markets and conducive policy and regulatory environments are also often lacking. The African Development Bank (AfDB) reported as part of the IEA survey that EE investments in Africa were not carried out because these features were absent. This statement highlights the urgent need to implement an “EE framework” in developing countries.
Energy efficiency and reported climate mitigation finance
MDB funding of energy efficiency can also be compared to their reported climate mitigation finance. There is no common agreed definition of “climate mitigation finance” (see e.g. Clapp et al. 2012) and each institution usually reports its commitments according to its own methodology. To address this issue, a group of MDBs, including the five development banks tracked in this report, recently developed a joint approach for mitigation finance reporting (a summary of the mitigation part of the report was published for Rio+20 in June 2012, a more detailed report is to be published by the end of 2012). According to this new methodology, MDBs’ activities need to fulfil a list of criteria to be accounted as mitigation finance. Climate mitigation activities should reduce GHGs emissions based on past experience or technical analysis, but the joint approach measures financial flows rather than GHG emission reductions. Also to avoid double counting, external resources managed by MDBs (e.g.: funding from the Global Environment Facility or the Climate Investment Funds) are clearly separated from MDBs’ own resources. Annex C presents the typology of mitigation activities retained by MDBs.
Figure 12 shows mitigation finance of the five MDBs according to the joint MDB approach, compared to energy efficiency finance calculated by the IEA from MDB data.
This comparison of mitigation finance vs. EE finance highlights the complexity of reporting. In the case of the EIB for instance, the mitigation finance in 2011 reported in the joint approach is USD 2.5 billion), however the bank reported investing more than USD 9 billion in renewable projects in the EU in the same year, which normally would be expected to fall under climate mitigation projects. EIB finance of EE calculated by IEA would account for 65% of the climate mitigation finance reported under the Joint Approach.
The split of funds between energy efficiency measures and renewable energy finance varies between MDBs. The ADB has the closest share of funds going to renewable energy and energy efficiency (respectively 55% and 45% in 2011); the WBG clearly puts the priority on renewable energies – USD 2.9 billion in 2011 compared to approximately USD 1.5 billion or about 30% of its mitigation finance on energy efficiency; the EBRD on the contrary favours energy efficiency with 75% of its Sustainable Energy Initiative (for more details, refer to Annex B) funding going to EE by region. Since the MDBs, with the exception of the WBG, operate on a regional basis, this
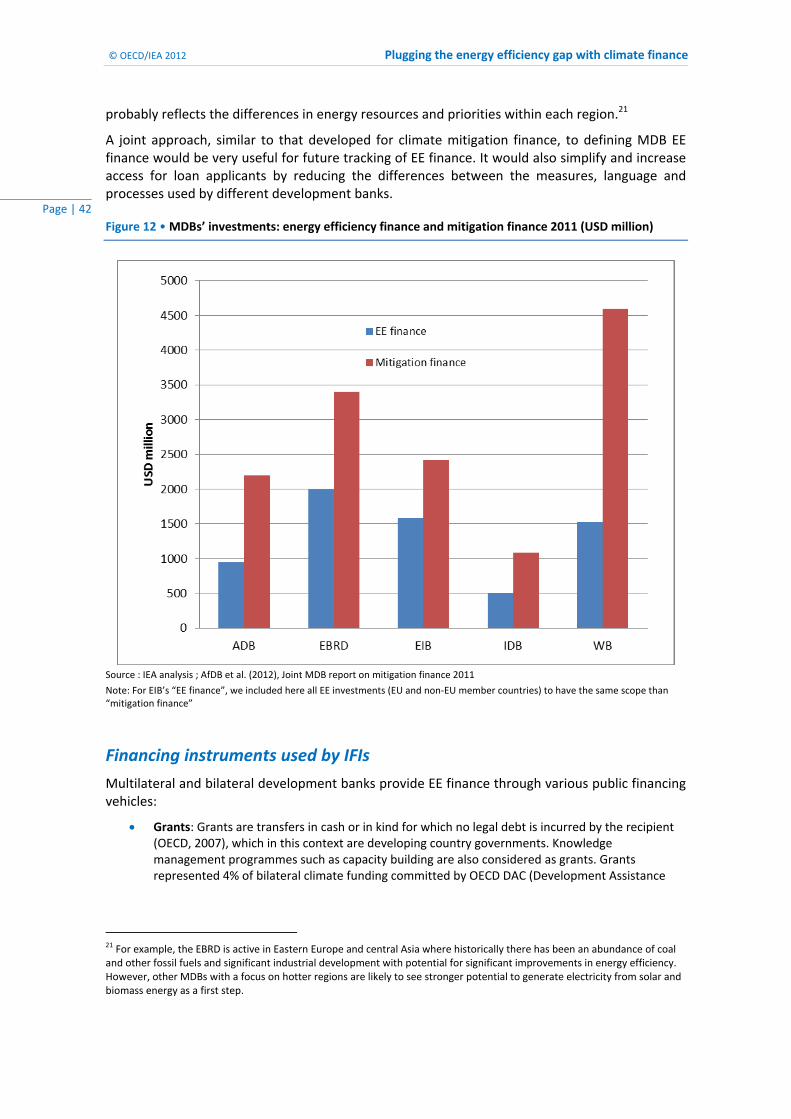
© OECD/IEA 2012 Plugging the energy efficiency gap with climate finance
Page | 42
probably reflects the differences in energy resources and priorities within each region.21
A joint approach, similar to that developed for climate mitigation finance, to defining MDB EE finance would be very useful for future tracking of EE finance. It would also simplify and increase access for loan applicants by reducing the differences between the measures, language and processes used by different development banks.
Figure 12 • MDBs’ investments: energy efficiency finance and mitigation finance 2011 (USD million)
Source : IEA analysis ; AfDB et al. (2012), Joint MDB report on mitigation finance 2011
Note: For EIB’s “EE finance”, we included here all EE investments (EU and non‐EU member countries) to have the same scope than “mitigation finance”
Financing instruments used by IFIs
Multilateral and bilateral development banks provide EE finance through various public financing vehicles:
Grants: Grants are transfers in cash or in kind for which no legal debt is incurred by the recipient (OECD, 2007), which in this context are developing country governments. Knowledge management programmes such as capacity building are also considered as grants. Grants represented 4% of bilateral climate funding committed by OECD DAC (Development Assistance
21 For example, the EBRD is active in Eastern Europe and central Asia where historically there has been an abundance of coal and other fossil fuels and significant industrial development with potential for significant improvements in energy efficiency. However, other MDBs with a focus on hotter regions are likely to see stronger potential to generate electricity from solar and biomass energy as a first step.
Plugging the energy efficiency gap with climate finance © OECD/IEA 2012
Page | 43
Committee) countries in 2009.22 Subsidies and grants can be used effectively in the short‐term to overcome initial high costs and reduce perceived risks, but they may not address market barriers in the longer term if systems are not developed as part of the process to support sustainable lending once grants are no longer awarded for EE projects. They tend to be small, generally fund pilot and demonstration projects and cannot be considered a sustainable funding source. Grants may be more appropriate to support commercial transactions where the credit barrier is too high or the banking sector is still underdeveloped (Sarkar and Singh, 2010).
Concessional loans: Concessional loans are loans provided at an interest rate below the market rate either to governments for on‐lending or directly to EE projects. Public funds subsidise interest rates or provide partial debt relief on the loan. The remaining loan amount may be provided by fully participating financial institutions or third parties. These kinds of loans are linked to official development assistance, since the OECD defines an ODA loan as a concessional loan that conveys a grant element above 25% and has an interest rate below the prevailing market rate. Multilateral development banks provide concessional loans mainly to allow investors in developing countries access EE finance at a lower cost.
Box 6 • Technical assistance and regulatory framework
Public‐private approaches
In developing countries with more developed capital markets, MDBs engage in public‐private approaches or partnerships (PPPs) as a way to engage the private sector on EE projects, usually by risk sharing. The IEA defines PPPs as “voluntary efforts in which government and the private sector collaborate to analyse public policy problems and jointly implement solutions” and in the context of financing energy efficiency measures as “mechanisms that use public policies, regulations or financing to leverage private‐sector financing for EE projects”(IEA, 2010, 2011).23 Different types of PPPs exist, but they generally involve a contract between a public agency and a private party, in which the private party provides a public service and bears a substantial part of the risk. Even when the contract is between two public entities such as an IFI and a government, such as a loan guarantee or credit line, the guarantee is then applied to local financial institution lending and can be considered a public‐private approach. This mechanism allows governments to
22 The Development Assistance Committee is the committee of the OECD which deals with development co‐operation matters. 23 Others traditional definitions of PPPs: http://www.oecd.org/gov/regulatorypolicy/public‐privatepartnershipsinpursuitofrisksharingandvalueformoney.htm
Regardless of the financial instrument used to fund energy efficiency measures, accompanying measures are needed to ensure that the requisite regulatory frameworks and technical capacity exist to generate demand and enable implementation of energy efficiency measures. Regulatory frameworks including long‐term energy efficiency and climate change mitigation strategies that mandate improvement in energy efficiency provide longer‐term security to investors that there will be demand for energy efficiency measures. Technical capacity is necessary in energy efficiency to undertake energy audits, identify opportunities of improvements and provide solutions. Energy efficiency lending programmes in developing countries need to be accompanied by technical assistance to be successful. Technical assistance (TA) can be combined with public finance vehicles to implement suitable EE frameworks in developing countries. Development banks and agencies, e.g. UNDP, often provide or facilitate TA without any actual lending, to build partnerships with local financial institutions and create capacity building at initial stages. Private actors in the developing world may not invest in energy efficiency because they simply do not have the requisite skills and knowledge. Overcoming cash flow challenges may be less important than creating demand and capacity in the market to invest in energy efficiency measures.

© OECD/IEA 2012 Plugging the energy efficiency gap with climate finance
Page | 44
implement projects rapidly thanks to private sector funding. Public‐private partnerships have been used increasingly in EE finance as they deliver market‐oriented solutions to EE barriers. These partnerships help governments meet their EE targets without burdening their public finances, with the private sector taking on both the financial and performance risks (IEA, 2011b).
Multilateral development banks are engaged in three forms of PPPs, particularly appropriate and relevant to energy efficiency: loan guarantees, dedicated credit lines and energy performance contracting.
Loan guarantees: Our survey of MDBs and bilateral financial institutions showed growing interest in loan guarantees to support EE projects in developing countries. The OECD defines a loan guarantee as “a legally binding agreement under which the guarantor agrees to pay some or all of the amount due on a loan instrument in the event of non‐payment by the borrower.”24 A loan guarantee extends the reach of private financing in developing countries. In the case of EE projects, future energy savings and technical performance for instance can be guaranteed. The Multilateral Investment Guarantee Agency (MIGA), member of the World Bank Group, plays an important role by providing guarantees for clean investments in developing countries.25 In 2011, MIGA issued USD 2.1 billion in investment guarantees over the world, but guarantees in support of EE projects remain very low, with only USD 40 million over the period 1990‐2009 (10 times lower than guarantees for renewable energy over the same period). Another example of loan guarantees in operation is the China Utility Energy Efficiency (CHUEE I & II) programmes where the IFC, in cooperation with the GEF, initiated a substantial loan guarantee. The GEF covered 50% of the first loss with a commitment of USD 8.4 million and it was estimated to leverage 42 times this amount in private investment in EE projects.
Guarantees granted by IFIs are essential for projects that involve the private sector. For many EE projects, IFIs do not even need to provide funding as private investors already take charge of it, but their guarantees in case of failure reassures investors, who might have not committed to the project without the public sector’s involvement. MDB loan guarantees for EE are provided almost always to partner financial institutions rather than to individual projects or project developers. This is a major difference between guarantees for EE vs. renewable energy projects.
Credit lines: A line of credit (LOC) is a loan to a participating financial institution (PFI), for on lending to customers who are expected to repay their loans with interest. The PFI assumes the credit risk, so the LOC is a liability for the intermediary organization. More than 100 credit lines have been provided by MDBs and BFIs to governments and local financial institutions in developing countries for EE projects.26 Funds are on‐lent to projects at below or at regular market rates.
Credit lines allow MDBs to delegate funding and reporting to local institutions, better designed to finance small EE projects than multilateral financial institutions. The China Energy Efficiency Financing Programme (CHEEF) for instance was initiated by the World Bank to encourage Chinese banks to provide EE loans (WB, 2008). The line of credit was structured as a financial intermediary lending operation with a sovereign guarantee provided by the Chinese Ministry of Finance.
24 http://stats.oecd.org/glossary/search.asp 25 MIGA is an investment insurance facility of the World Bank providing political risk insurance guarantees to private sector lenders and investors. 26 Limaye, D., personal communication (2012).

Plugging the energy efficiency gap with climate finance © OECD/IEA 2012
Page | 45
Figure 13 • Credit lines mechanism
Source : IEA, 2011
Energy performance contracting – ESCOs: Energy performance contracting (EPC) is not a financing vehicle, but is often discussed among EE financing instruments because it helps organize or facilitate project financing to capture EE potentials and overcome market barriers. EPC involves an Energy Service Company (ESCO) which can provide a variety of services including finance in some cases, but most importantly will guarantee energy savings. The remuneration of the ESCO will ultimately be contingent on the achievement of certain guaranteed performance parameters. ESCOs are useful for implementing and financing EE projects in the commercial, public and industrial sectors, i.e. projects larger than individual household size.
IFIs have given wide support to ESCOs in developing countries, mainly with technical assistance, grants and concessional loans. The transition from public international support to commercial financing as soon as possible is not easy but necessary, in order to create a sustainable market for EE projects financed by commercial banks.
Donor agency or government
Bank or financial institution
Project A
Project B
Project C
Provides funds at low interest
Adds funds, lends at rates below or at market rate
Obtain project financing

© OECD/IEA 2012 Plugging the energy efficiency gap with climate finance
Page | 46
Box 7 • ESCOs
Source: IEA, 2011 and Singh et al. 2010
Estimate of investments in energy efficiency through leverage of IFI funds
Public finance seeks to catalyse or leverage private funds and this subsection attempts to estimate the investment leveraged in EE through IFI funds. The leverage ratio provides an estimate of the ratio of public funds invested per unit private finance generated in related activities. Public institutions however have different definitions of leverage, resulting in different numbers that are hard to compare.
Definitions of leverage and leverage ratios
Financial institutions have various conceptions of the term “leverage” and there is no definition of what leverage means – it differs depending on the circumstance, project, financial institution, instrument etc. The most generic definition refers to the ratio of debt to equity financing for an investment. A broader definition of leveraging refers to “a set of instruments provided by a financial institution that encourage and catalyse other public and private investment by reducing investment risk or increasing project returns enough to attract private investors” (Brown et al., 2011). Examples of risk reduction instruments are guarantees, or long loans provided by development banks that can be repaid over many years.
Three main models exist for energy performance contracting (EPC), the “shared savings”, the “guaranteed savings, and the energy supply contracting or “Chauffage”.
Under the “shared savings” model, the energy cost savings are shared by the ESCO and the client at a pre‐determined percentage for a fixed number of years. The ESCO bears upfront investment costs and faces not only the energy performance risk but also the customer credit risk. Under a “guaranteed savings” contract, the ESCO guarantees a certain level of energy savings but does not provide the financing. This model has the advantage that interest rates are usually much lower. In the Chauffage model the ESCO takes over the operation and maintenance of the energy‐using equipment and sells the energy output to the customer at an agreed price. The ESCO bears the costs of all equipment upgrades, operation and maintenance, and the customer pays a fee based on the original energy bill minus a percentage of the energy savings (often 3‐10%).
ESCOs emerged in the United States in the 1970s, and still represent the biggest ESCO market, with an annual turnover of over USD 5 billion in 2011, most of it delivered via guaranteed savings contracts. In developing countries, the first ESCOs were created in the 1990s. Today some developing countries have more ESCOs than developed countries. The development of ESCOs in developing countries has proved complicated (Sarkar and Singh, 2010). Legal and financial policies are lacking to enforce energy performance contracting, a model still perceived as too complex. The deployment of ESCOs has been slow and sometimes ineffective in the developing world because energy companies do not have adequate proper skills and funding. Whereas ESCOs in developed countries can count on a mature financing sector to take care of the investment, ESCOs in developing countries have to concentrate their efforts on sources of funding that need to be secured. These efforts to find reliable financing sources are time‐consuming when ESCOs should focus on technical and energy‐savings improvements. International ESCOs often do not want to invest in these countries because customer credit‐worthiness and local credit are not assured. On the demand side, customers are reluctant to accept ESCO contracts because they are not well informed and do not possess a good understanding of the mechanism. ESCOs development is a long‐term process that needs government support to succeed. While the ‘‘full service ESCO’’ model has been more common in North America, simpler models may be more appropriate in developing countries, at least until the market evolves over time.

Plugging the energy efficiency gap with climate finance © OECD/IEA 2012
Page | 47
However, for most institutions, leverage simply equals co‐financing. Co‐financing can be seen as leverage in the sense that without public intervention, the private sector would not have been forthcoming. Public finance attracts money that would not have been invested otherwise. However, co‐financing figures might not be enough for some investors interested in specific ratios, who may be more interested in private sector money raised as a result of a concessional loan.
The level of the leverage ratio however is not the only factor of significance in determining whether public finance has been effectively used for EE projects. Supporting a project with the highest leverage ratio might not be optimal because the value of an investment may not always measurable in cash terms or only be a function of the private sector finance involved. Project sustainability may be more important than a high leverage ratio. Energy efficiency projects typically belong to the category of investments for which results are often intangible and difficult to evaluate. A project with a low leverage ratio could be more effective in reducing greenhouse gas emissions than other projects that raise more private funds, but have little impact towards climate mitigation (Stadelmann et al., 2011).
Public financial institutions need to agree on a common definition of leverage for more consistency. Different methods of calculation can confuse private investors who look at leverage ratios as a proxy for profitability.
The AGF methodology to calculate leverage in climate finance
The United Nations’ High‐Level Advisory Group on Climate Change Financing (AGF) published a report in 2010 deriving a methodology for calculating the potential leverage ratio of public interventions to stimulate private investment in climate finance (UN, 2010a). The report calculates an average leverage factor of 3 for private investment in climate mitigation activities. This average is derived from the varying public financing instruments and their leverage ratios associated (Table 6).
Table 6 • Estimation of leverage ratios in climate finance by financial instrument
Instrument Leverage ratio
Non-concessional debt Between 2 and 5
Debt financed via grant (concessional) funds Between 8 and 10
Equity and guarantees financed via grants Between 10 and 20
Donor financed climate funds Between 3 and 8.5
Carbon offset financing Between 4 and 9
Source: UN, 2010
Non‐concessional finance is estimated to leverage less private funds than concessional finance. This is because the leverage ratio relates only to private funds leveraged directly through climate finance. In developing countries it is assumed there is little private sector funding of climate mitigation activities, and therefore all private finance is directly related to the concessional finance provided by MDBs. However, in more developed countries where non‐concessional finance is provided, less private sector finance is leveraged directly but rather exists independently of the MDB finance.
It is important to note that in most cases these leverage ratios are based on generic investments rather than climate‐specific investments. Due to the lack of data and a common agreed definition on leverage, it is likely that the AGF took into account leverage ratios published by financial institutions and so the numbers in Table 6 may need to be treated with caution.

© OECD/IEA 2012 Plugging the energy efficiency gap with climate finance
Page | 48
Estimation of investments in energy efficiency in the developing world
We have attempted to estimate the amount of EE finance that IFIs are potentially leveraging in developing regions by applying leverage ratios to MDB and BFI EE finance numbers collected. The estimation gives a first estimate of co‐financing, or leverage, potential for energy efficiency in developing countries. IFIs provide different kinds of financial instruments to their beneficiaries, depending on the country context in terms of level of development of the EE and capital markets. As shown in Table 6, the leverage ratio is likely to be different, depending on the financial instrument and country applied. We estimate the potential private finance leveraged using two leverage ratios to take account of a lower and upper bound
Table 7 • Estimation of leverage effect on IFI EE finance
IFI category Average EE finance (2008‐2011) (USD billion)
Lower LR1 (USD billion)
Higher LR2 (USD billion)
MDI3 4.90 9.80 39.21
BFI4 18.88 37.76 151.04
Total 23.78 47.56 190.25
Notes:
1. Lower Leverage ratio = 2
2. Higher leverage ratio = 8
3. MDB value represents the average annual spend on EE over the period 2008‐2011.
4. BFI value is estimated from the IDFC report for EE finance in non‐OECD countries from 16 bilateral and national financial institutions (Hoehne et al. 2012).
Adding up potential funding by 5 MDBs, BFIs (from IDFC report) and co‐finance estimated through leverage ratios, the total funding of energy efficiency in all developing countries could amount to between USD 48 – USD 190 billion in 2010.
The estimated funding through leverage of MDB funds for EE projects is relatively low in upper middle income countries compared for instance to the reported total estimates of EE investments compiled in Table 1 (e.g., USD 30 billion per year in China alone in 2011). In reality, it appears that private funds for energy efficiency fostered by public climate finance are of much higher magnitude than USD 24 billion, particularly in upper middle income countries, which may have important amounts of domestic public funding dedicated to energy efficiency.

Plugging the energy efficiency gap with climate finance © OECD/IEA 2012
Page | 49
The Green Climate Fund – a new source of funds for energy efficiency?
Context
The United Nations Framework Convention on Climate Change (UNFCCC) sets out a framework for international political action towards climate change. Parties to the Convention pledged during COP15 in Copenhagen to commit USD 100 billion per year by 2020 to meet the needs of developing countries and to provide USD 30 billion of Fast‐Start finance between 2010 and 2012. The 16th Conference of the Parties (COP16), which took place in December 2010 in Cancun, recognised both climate finance commitments. Parties also established different agreements, among which was the Green Climate Fund (GCF). The GCF was designated to be a new operating entity of the Convention’s financial mechanism and expected by many to be the adequate and appropriate solution to address climate mitigation and adaptation.
The Fund will need to be settled under a clear framework to be efficient but a number of issues remain unresolved: governance, sources and disbursements. A Transitional Committee was created during COP15 to work out the design of the Green Climate Fund. The group of experts was tasked to find solutions on funding and access modalities, independent evaluation of the Fund’s performance, and stakeholders input and participation. At COP17 in Durban the COP adopted a decision on the launching of the GCF and approved the governing instrument for the fund (UNFCCC, 2011a).
The Cancun conference established that a Board of 24 members would govern the Fund.27 The Board will comprise an equal number of members from developing and developed countries. The Board will have full responsibility for funding decisions and will submit annual reports to the COP. The World Bank serves as an interim trustee, subject to a review by the Parties after three years. The WBG will not be implicated in the Fund design or decision making, but some developing countries fear that it will favour developed countries’ interests, as they give more money to the Bank.
A Transitional Committee (TC) of experts is in charge of designing the Fund, and is divided between 25 members from developing countries and 15 members from developed countries. In Cancun, it was stipulated that the Committee should have “necessary experience and skills, notably in the area of finance” (UNFCCC, 2011b). However, no member so far of the TC comes from the private finance sector, although private finance has been identified as the most important source of climate (Corfee et al., 2011; Buchner et al., 2011, 2012; Clapp et al., 2012). The private finance world could still participate to the GCF if the Transitional Committee allows active participation of outside observers, which could give guidance based on their experience in the field. The Transitional Committee will also have to decide what funding windows should be part of the fund, opening a possibility for a dedicated EE window in the GCF.
Sources of funding
While confirming the financial accord to mobilise USD 100 billion per year from Copenhagen, Parties in Cancun failed to establish a time‐table for scaling up from the 2010‐2012 Fast Start Finance to the long‐term finance global commitment. Sources of funding for climate finance are very diverse, but it is unclear how much will pass through existing channels. Some richer
27 For more details on the board, see http://gcfund.net/board/composition.html
© OECD/IEA 2012 Plugging the energy efficiency gap with climate finance
Page | 50
countries appear to see a sizeable part of climate finance leveraged private sector investment, with only a small part of the USD 100 billion coming in the form of funds from governments. Therefore it is becoming increasingly important to devise how best to leverage public sector funds.
The High‐Level Advisory Group on Climate Change Financing (AGF) was created by the UN Secretary‐General in 2010 to identify potential sources of funding for the climate finance pledges made at COP15. The AGF report (UN, 2010b) lists four main sources to level up international climate finance: private capital, public finance, development banks, and carbon markets. Multilateral development banks will certainly play a leading role to provide their expertise on this issue of funding. The place where the GCF will stand between the numerous bilateral and multilateral financial institutions remains unsure. The global architecture of climate finance is already complex, and if the GCF turns out to be just an additional co‐existing entity, its potential impact will be weakened. Many early proponents for a global climate fund had expected an institution such as the GCF to play the role of “fund of funds” to catalyse investments. This framework would however require donor countries to delegate their climate actions to the UNFCCC instead of managing their own funds, which is real challenge.
Use of GCF for energy efficiency
The Cancun Agreement mentions that the GCF will provide some of the funding through “direct access”, which would allow recipient countries to access funding for their own priority programmes directly or through an implementing agency of their own choosing. Direct access finance can minimise transaction costs and secure greater national ownership, as third parties, such as multilateral financial institutions, are unnecessary. This could be a valuable facility for EE projects, if they can be clustered together as a programme. The Private Sector Facility could also be very useful for EE projects (Box 8).
How large a share of the GCF is obtained for EE projects will be dependent on the design of the GCF and the suitability of the financing vehicles available for EE projects.
Box 8 • The Role of the Private Sector in the GCF
Source: Liane Schalatek et al. (2012)
The GCF will have a private sector facility, which should allow direct and indirect financing by the GCF for private sector activities. This was a priority for many developed countries, many of which are currently financially constrained and would liketheir financial support for the GCF to leverage and crowd in private sector investments. This is viewed as key to a “transformational” funding role for the GCF. In contrast, many developing countries would like public finance support to be the main source of GCF financing, with only a supplementary role for the private sector, especially for small and medium‐sized enterprises in recipient countries. There are concerns regarding the possibility that private sector actions may be inconsistent with national priorities. In order to ensure country ownership of GCF disbursement, which is a guiding governance principle for the GCF, countries will be able to review proposed private sector projects on a “no objections” basis, which gives a recipient country de‐facto veto power over business activities it considers inconsistent with national climate policies. National designated authorities (NDAs) will be set up to serve this role, although the concrete functions of these institutions has not yet been clarified.

Plugging the energy efficiency gap with climate finance © OECD/IEA 2012
Page | 51
Shaping the Green Climate Fund to energy efficiency project needs Energy efficiency is an opportunity that needs innovative models of financing to become a more widely used solution to energy and GHG challenges in developing countries. Most developing countries dedicate a higher share of finance in the energy sector to energy supply. This is partly due to the barriers to energy efficiency finance listed in section II of this report. This section outlines the types of finance needed specifically for energy efficiency projects to overcome these barriers and makes recommendations on how the Green Climate Fund, in particular, could be designed to ensure that it is a viable source of funding for energy efficiency projects.
Design requirements for EE finance
Finance for EE projects needs to be designed to deal with some of the major challenges associated with energy efficiency measures – the small size of EE projects, the relatively high transaction costs per project; the perceived intangibility of future energy savings and the uncertain value of those savings due to fluctuating energy prices; the lack of understanding and communication on efficient technologies; the lack of standardisation or universally accepted protocols to assess the potential energy savings associated with the project.
To overcome these barriers in developing countries, climate finance should be designed that encourages the funding of EE projects. Public financing vehicles will be needed that are adapted to the needs of energy efficiency and in under‐developed markets will be required to offer better conditions than market‐rated debt or equity to increase interest in EE projects. These kinds of instruments are already successfully in use in domestic, MDB and BFI funding of EE projects.
The experience of climate finance to date through the CDM and IFIs in funding EE projects in developing countries provides valuable, if somewhat limited, lessons on successful finance of EE measures that can be drawn upon to ensure future climate finance is suited to EE projects. These can be summarised as the following:
Knowledge‐sharing and capacity‐building are two essential pillars to implement EE in the developing world in order to develop and make ready the EE market. Technical assistance to both local financial institutions and the EE industry, e.g. energy assessors, the construction industry, and energy managers, is crucial in the ability of public funds to scale‐up and ensure the durability of EE finance so that commercial financing markets are developed within the countries eventually.
Public funds at concessional rates are needed to (i) resolve liquidity issues or (ii) to lower financing costs where private financiers perceive a high risk and do not invest. However, concessional loans to end borrowers should be time‐limited, otherwise they may not be conducive to building sustainable commercial markets. The financing vehicles that have been successfully used by MDBs and domestic public funds for energy efficiency measures are mainly:
o Grants in the least developed countries that are not able to access commercial or even concessional lending for energy efficiency;
o Concessional loans in middle income countries;
o Public‐private partnerships: credit lines, risk guarantees, energy performance contracting in more developed financial markets to encourage the private and public sectors to engage in EE projects.
Involvement of local financial institutions in sourcing customers for EE projects and disbursing funds can help overcome the “small‐size” problem of EE projects. Credit lines and loan guarantees, which provide funds or guarantees to financial institutions that enable loans at

© OECD/IEA 2012 Plugging the energy efficiency gap with climate finance
Page | 52
concessional rates are often more adapted to small‐scale EE projects than large sums for direct investment in individual projects.
Policy frameworks are needed to develop market demand for energy efficiency projects. Overarching national energy efficiency action plans or climate change mitigation strategies can provide long‐term goals and hence some investment security for investors. Specific sectoral regulations such as fuel economy standards, transport infrastructure improvements, building energy performance regulations etc. generate demand for investment in energy efficiency.
Climate finance should facilitate financing vehicles and complementary measures that integrate these lessons in the successful funding of EE projects.
Recommendations for the Green Climate Fund
The GCF could play a key role in the coming years in directly funding and attracting private and public investment in climate mitigation measures. It could promote energy efficiency as one of the best and least‐costly solutions for climate change mitigation in the near term and consideration needs to be given to how it can best be designed to do so.
Climate finance can be disbursed in a variety of forms, from grants and concessional loans to private equity. The financing vehicles used in the GCF will have to be chosen carefully, but at the same time remain flexible, and not exclude instruments, to ensure efficiency and cost‐effective mitigation measures.28 Some of the financing instruments found to be suitable to EE projects are grants and subsidies in least developed markets, concessional loans in middle income countries, and loan guarantees in more developed markets. The GCF should have the capability to disburse funds for energy efficiency projects using different financing vehicles that are suitable for markets in different stages of development.
Financial instruments also need to be adaptable to different countries and projects. Development banks should be able to provide some guidance to the GCF, as they know how to combine different financial instruments in the context of development finance. Achieving an equitable allocation of funding between countries, from the least developed to emerging economies is likely to be a major challenge. The GCF should also learn from development banks how to work inside national systems, an essential condition for long‐term success.
Scaling up financing for energy efficiency policies should be one important mechanism for the GCF to support developing countries achieve a sustainable growth path, but this requires design and rules that are appropriate for EE measures.
From this analysis of current status and gaps in EE finance in developing countries, the authors recommend the following “EE‐friendly” considerations be included in the design of the GCF:
Consider dedicating a specific share of funding for EE projects: A specific funding window may be needed to ensure that adequate numbers of EE projects are funded through the GCF (perhaps in part through the private sector facility), given the many barriers to EE finance. This may not be needed if the GCF is designed to encourage the finance of EE projects and measures.
Set suitable, yet flexible, project eligibility criteria: The governing instrument for the GCF approved at COP17 in Durban specifies that a results‐based approach will be an important criterion for allocation of resources. EE projects that deliver reductions in energy demand and increased service (rather than the supply of easily metered energy) require more complex evaluation effort than other low‐carbon investments, and direct impacts are hard to measure. A results‐based approach should be structured such that it does not put EE projects at a disadvantage.
28 There might be other more political criteria like co‐benefits, geographical spread etc. but these are not considered here.

Plugging the energy efficiency gap with climate finance © OECD/IEA 2012
Page | 53
Allow funding for policy and programme development: Funds should be allocated to domestic programmes and policies as well as to strengthening of in‐country institutional capacity to support regulatory reform and capacity building, particularly for energy efficiency measures.29 Public funds may best be used in implementing regulations requiring energy efficiency that will then channel private investment. The GCF Transitional Committee has stated that the GCF will provide resources for “preparation or strengthening of low‐carbon strategies or plans” and for nationally appropriate mitigation actions (NAMAs), and will ensure adequate resources for capacity building.30 Such an approach would be good for energy efficiency measures for which policy frameworks, technical assistance and knowledge sharing are likely to be more important than direct project financing.
Encourage project clustering: Given the small size of energy efficiency projects compared with other climate mitigation projects, applications for GCF or other climate funding for individual EE projects are likely to be inefficient and have high transaction costs proportionally. Clusters of projects and programmes should be encouraged on a national or regional basis, and the higher transaction costs associated with small‐scale projects could be shared or borne by the GCF. The experience with Programmes of Activities under CDM and with credit lines to local financial institutions from some IFIs illustrates the importance of clustering for implementing EE projects or measures.
Encourage development and implementation of appropriate financial instruments: It is important to ensure that GCF includes financial instruments suitable for supporting and financing energy efficiency. Such instruments should include concessional loans, risk guarantees, public‐private partnerships and aggregation vehicles that allow smaller loans to be grouped to access lower interest capital markets re‐financing, all of which have been shown to be successful in financing energy efficiency projects.
Evaluate impact of EE funding on outcomes: Mechanisms should be put in place to ensure funding for formal and comprehensive evaluation of the full costs and outcomes of all projects.
Increase the access to and level of funding for energy efficiency by international financial institutions (IFIs): This will require better co‐ordination among lending portfolios for the energy sector and direct climate mitigation lending. The GCF, if operationalised, could represent an important part of future climate finance, but other international flows are also likely to continue to play a large role in financing climate mitigation in developing countries. Both multi‐lateral and bi‐lateral development banks are also likely to continue to fund GHG mitigation investments. Improved co‐ordination would reveal the multiple benefits of energy efficiency investments from both an energy sector and climate mitigation perspective. In addition, increased funding from MDBs and bi‐lateral development banks for policy development in developing countries could clear the path for increased investment from the private sector, as well as from international private sector investors.
Develop a new market mechanism under the UNFCCC that goes beyond the CDM to increase financing of energy efficiency. The main principles agreed for a new carbon market mechanism would allow for direct carbon financing to support establishment of broad domestic policy frameworks. The use of standardised or sectoral baselines could reduce transaction costs and obviate the need for additionality testing. Such a market mechanism could better support energy efficiency investments than the CDM has done to date.
The level of energy efficiency investments in climate finance for the forthcoming years is impacted by decisions taken by the international community today. The GCF could either play a central role in the future climate landscape, or miss an opportunity if governing, design and
29 This could be aligned with the OECD DAC Programme‐based approaches (PBA) classification for ODA that engages in development co‐operation based on the principles of co‐ordinated support for a locally owned programme of development, such as a national development strategy, a sector programme, a thematic programme or a programme of a specific organisation. (www.oecd.org/site/dacsmpd11/glossary.htm#P) 30 The NAMAs concept was introduced in the UNFCCC Bali Action Plan in 2007; NAMAs can be defined as actions in developing countries to lower GHG emissions and contribute to sustainable development in the country.
© OECD/IEA 2012 Plugging the energy efficiency gap with climate finance
Page | 54
funding issues are not tackled appropriately. The GCF should help developing countries to implement policies in order to ensure sustainability, and not solely provide short‐term assistance from developed countries.
The latest climate change negotiations took place in Bangkok in August 2012. Delegates faced high expectations to operationalise financial mechanisms established in Cancun and Durban. Developing countries drew attention to the funding gap from 2013 to 2020 and to the urgent need to scale up climate finance today. In finance contact group discussions, parties considered an informal note on “enhanced action on the provision of financial resources and investment to support action on mitigation and adaptation and technology cooperation,” highlighting framing elements and questions on: financing during the period 2012‐2020; linkages with other bodies and financial institutions; MRV; fast‐start finance; GCF; and long‐term finance.31 The EU and the US assured their commitment to long‐term finance but many doubts remain. Negotiations are slow moving but action for short‐term mitigation up to 2020 needs to be taken now, and energy efficiency is one of the best available and least costly solutions.
Potential future role of international financial institutions
Most governments in developing countries can now raise money on international capital markets, without any financial intermediary. In 2010 for instance, total private capital inflows to Latin America reached USD 280 billion, which is 10 times higher than combined loans to the same region of the World Bank and IDB for the same year (Rathbone, 2012). The GCF could play an important role in co‐ordinating and disbursing climate finance from domestic sources and IFIs in developing countries. Despite the current, and likely future, relatively low funding compared to private and GCF flows, IFIs are likely to still have a role to play in climate finance, particularly for investments in EE.
With the rapid growth of developing economies, the core model of IFIs has shifted from “solving shortages of finance” to “harnessing available finance”. IFIs have new missions now, such as:
To provide counter‐cyclical funds: during the 2008‐2009 economic crisis, MDBs raised their disbursements to support developing economies. Between 2008 and 2009, the World Bank Group increased its funding for energy efficiency by 10%, the ADB by 15% and the EBRD by 35% for instance.
To collaborate with the private sector, expanding massively in emerging economies: public‐private partnerships are essential to foster maximum private sector involvement.
Both of these goals are very compatible with financing EE in developing countries. Investment in EE measures is especially important in times of recession as EE measures promote economic development. Also, since the cost‐effective nature of EE projects means that they should mainly be funded by the private sector, once initial financing barriers have been overcome, the development of public‐private partnerships for EE through MDBs is a logical step.
The IFIs can be important in providing co‐finance with the GCF for EE projects. Another role for IFIs may be to source EE projects in least developed countries as part of development programmes and recommend them to the GCF for climate finance.
31 Summary of the Bangkok Climate talks, Earth Negotiations Bulletin, Volume 12 Number 555, 8 September 2012. Available at http://www.iisd.ca/vol12/enb12555e.html

Plugging the energy efficiency gap with climate finance © OECD/IEA 2012
Page | 55
Conclusions Energy efficiency should be a priority for climate finance and the GCF in particular. EE can deliver significant climate mitigation and other benefits contributing to sustainable development at relatively low cost in many cases.
To deliver the full potential of energy efficiency improvements, the share of climate finance going to EE measures should be scaled up. Emerging economies have better developed capital and EE markets and can raise investments in EE from both public and private sources of funds. We estimate that emerging economies (the BRICS) countries are currently investing about USD 44 billion annually in energy efficiency. However, in less developed countries energy efficiency is generally not a priority and funding is heavily dependent on MDBs and bilateral development banks. While MDBs and BFIs have been key funders of EE measures in developing countries, the amounts remain quite small compared to funding for renewable and other energy projects for most IFIs. Scarce public resources should be focused on leveraging the maximum uptake of energy efficiency. This may involve focusing a greater share of public EE finance on policy making in order to channel private investment in EE measures.
The GCF is an opportunity to develop new financing sources for energy efficiency measures in developing countries under the UNFCCC system. The right design choices could make GCF an instrument to overcome some of the EE investment barriers outlined above and play a valuable role in coordinating international public finance of energy efficiency. Some lessons learned from IFI and CDM experiences in developing countries can help ensure that EE projects are eligible and attractive for GCF finance.
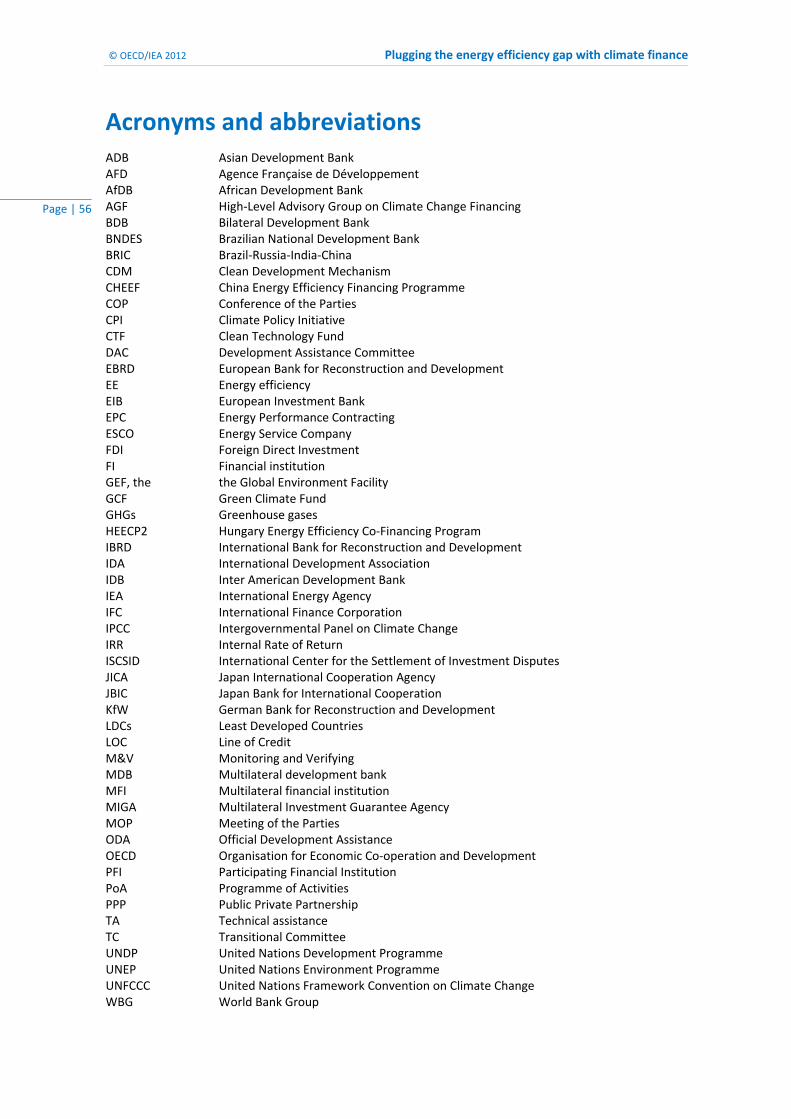
© OECD/IEA 2012 Plugging the energy efficiency gap with climate finance
Page | 56
Acronyms and abbreviations ADB Asian Development Bank AFD Agence Française de Développement AfDB African Development Bank AGF High‐Level Advisory Group on Climate Change Financing BDB Bilateral Development Bank BNDES Brazilian National Development Bank BRIC Brazil‐Russia‐India‐China CDM Clean Development Mechanism CHEEF China Energy Efficiency Financing Programme COP Conference of the Parties CPI Climate Policy Initiative CTF Clean Technology Fund DAC Development Assistance Committee EBRD European Bank for Reconstruction and Development EE Energy efficiency EIB European Investment Bank EPC Energy Performance Contracting ESCO Energy Service Company FDI Foreign Direct Investment FI Financial institution GEF, the the Global Environment Facility GCF Green Climate Fund GHGs Greenhouse gases HEECP2 Hungary Energy Efficiency Co‐Financing Program IBRD International Bank for Reconstruction and Development IDA International Development Association IDB Inter American Development Bank IEA International Energy Agency IFC International Finance Corporation IPCC Intergovernmental Panel on Climate Change IRR Internal Rate of Return ISCSID International Center for the Settlement of Investment Disputes JICA Japan International Cooperation Agency JBIC Japan Bank for International Cooperation KfW German Bank for Reconstruction and Development LDCs Least Developed Countries LOC Line of Credit M&V Monitoring and Verifying MDB Multilateral development bank MFI Multilateral financial institution MIGA Multilateral Investment Guarantee Agency MOP Meeting of the Parties ODA Official Development Assistance OECD Organisation for Economic Co‐operation and Development PFI Participating Financial Institution PoA Programme of Activities PPP Public Private Partnership TA Technical assistance TC Transitional Committee UNDP United Nations Development Programme UNEP United Nations Environment Programme UNFCCC United Nations Framework Convention on Climate Change WBG World Bank Group
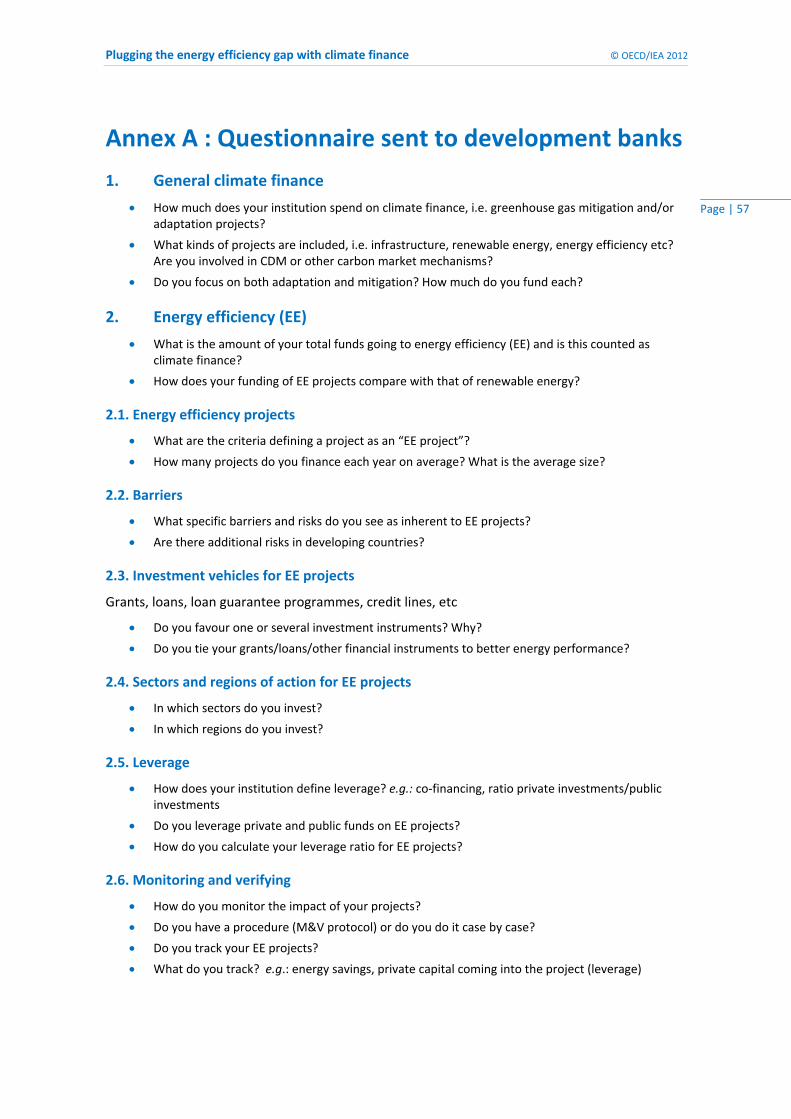
Plugging the energy efficiency gap with climate finance © OECD/IEA 2012
Page | 57
Annex A : Questionnaire sent to development banks
1. General climate finance
How much does your institution spend on climate finance, i.e. greenhouse gas mitigation and/or adaptation projects?
What kinds of projects are included, i.e. infrastructure, renewable energy, energy efficiency etc? Are you involved in CDM or other carbon market mechanisms?
Do you focus on both adaptation and mitigation? How much do you fund each?
2. Energy efficiency (EE)
What is the amount of your total funds going to energy efficiency (EE) and is this counted as climate finance?
How does your funding of EE projects compare with that of renewable energy?
2.1. Energy efficiency projects
What are the criteria defining a project as an “EE project”?
How many projects do you finance each year on average? What is the average size?
2.2. Barriers
What specific barriers and risks do you see as inherent to EE projects?
Are there additional risks in developing countries?
2.3. Investment vehicles for EE projects
Grants, loans, loan guarantee programmes, credit lines, etc
Do you favour one or several investment instruments? Why?
Do you tie your grants/loans/other financial instruments to better energy performance?
2.4. Sectors and regions of action for EE projects
In which sectors do you invest?
In which regions do you invest?
2.5. Leverage
How does your institution define leverage? e.g.: co‐financing, ratio private investments/public investments
Do you leverage private and public funds on EE projects?
How do you calculate your leverage ratio for EE projects?
2.6. Monitoring and verifying
How do you monitor the impact of your projects?
Do you have a procedure (M&V protocol) or do you do it case by case?
Do you track your EE projects?
What do you track? e.g.: energy savings, private capital coming into the project (leverage)

© OECD/IEA 2012 Plugging the energy efficiency gap with climate finance
Page | 58
2.7. Local institutions
How do you interact with: local governments? local banks? local private companies?
What role do these institutions play in funding and implementing your EE projects?
3. Expectations going forward
What types of EE projects do you plan to fund in the future?
Do you see funding for EE projects increasing or decreasing?
How do you see your role in funding EE investments vs. the role of the private sector?
What role do you see for the Green Climate Fund (the fund set up for channelling climate finance pledged under the UNFCCC)?

Plugging the energy efficiency gap with climate finance © OECD/IEA 2012
Page | 59
Annex B : Initiatives of MDBs to promote EE
ADB
The Asian Development Bank promotes energy efficiency in Asia and the Pacific region through its Clean Energy Program. This programme seeks to improve energy efficiency in the region, but also to develop renewable energies sources and increase energy access. The ADB set a target of USD 2 billion of clean energy investments annually by 2013, and this target was met in 2011 with USD 2.1 billion of investments. Energy efficiency accounted for 44% of it – USD 949 million – with the majority of investments made on the demand side (60%).
In order to increase its future investments in clean energy the ADB also relies on the Clean Energy Financing Partnership Facility (CEFPF), a partnership platform established in 2007 between ADB and its financing partners. At the end of 2011, USD 107 million have been remitted to the ADB for CEFPF, USD 15 million of which have been allocated to energy efficiency projects since the creation of the fund. This investment figure is very small compared to ADB’s overall lending for EE, but CEFPF is an emerging structure that the ADB aims to extend with its partners in the forthcoming years.
EBRD
The European Bank for Reconstruction and Development addresses the challenges of climate change and energy efficiency through its Sustainable Energy Initiative (SEI) launched in 2006. Since 2006, USD 12 billion has been invested under the SEI in Central Europe and Central Asia. SEI market segments include: large‐scale industrial EE; sustainable energy financing facilities through financial intermediaries; power sector EE; renewable energy; municipal infrastructure EE (including district heating and public transport network rehabilitation); buildings EE; transport EE and carbon market development. The SEI operational model combines project financing (with estimates of energy savings and CO2 emissions reductions), technical assistance and policy dialogue to scale up energy efficiency; the area of main focus of the initiative with USD 9 billion spent since 2006.
The third phase of the Sustainable Energy Initiative (SEI3) aims to channel between USD 6 billion and USD 8 billion to clean projects through 2012‐2014, and energy efficiency should be scaled up during SEI3 with comprehensive energy audits, technical assistance, and enhanced monitoring and measurement of impacts.
EIB
The European Investment Bank typically finances energy efficiency projects that include retrofitting and expansion of existing infrastructure and services (e.g.: district heating and cooling, cogeneration, improvement of industrial processes). The bank initiated two programmes with the European Commission that promote energy efficiency: ELENA (European Local Energy Assistance) and JESSICA (Joint European Support for Sustainable Investment in City Areas). ELENA is managed by the EIB but funded by the European Commission, and was designed to help local and regional authorities to prepare large‐scale energy efficiency or renewable energy projects. The second initiative, JESSICA, uses existing structural fund grant allocations to support urban development including EE projects.
IDB
The Inter‐American Development Bank established its strategy for climate change mitigation and

© OECD/IEA 2012 Plugging the energy efficiency gap with climate finance
Page | 60
adaptation in 2011. The bank does not have any quantitative target for energy efficiency as yet, but plans to implement more EE programmes in Latin America. Capacity building will be a priority as local financial institutions in the region lack relevant expertise to structure project finance appropriately. The IDB also plans to implement national and regional climate change strategic action plans, as well as supporting policy frameworks.
WBG
The World Bank Group has financed energy efficiency around the world since 1990, with a total cumulated amount of USD 3.1 billion. The WBG’s Renewable Energy and Energy Efficiency Action Plan includes a target of 20% average annual growth in renewable energy and energy efficiency commitments.
An Energy Efficiency Community of Practice (EE CoP) was launched by the WBG in 2012 to help overcome barriers to EE development (WB, 2012a). This new initiative aims to: increase share of knowledge on EE practices, with the WBG acting as a “global connector of knowledge”; create synergies between small groups within the energy sector (finance, policy, technologies, etc); build partnerships with external clients or practitioners. The EE CoP is at a very early stage at the time of writing (September, 2012), but its progresses should be followed.
The World Bank is the trustee for the Clean Investment Funds – the Clean Technology Fund (CTF) and the Strategic Climate Fund (SCF). The CTF provides concessional finance to developing countries to scale‐up GHG mitigation investments. The funds are channelled and disbursed through the MDBs, of which 20% is spent on energy efficiency projects. These funds have not been counted separately in the analysis of MDBs in this report, as this would be double‐counting.
Plugging the energy efficiency gap with climate finance © OECD/IEA 2012
Page | 61
Annex C : Typology of mitigation activities according to the “Joint Approach” of MDBs on climate mitigation finance
Demand‐side, brownfield energy efficiency
1. Commercial and residential sectors (buildings)
Energy‐efficiency improvement in lighting, appliances and equipment
Substitution of existing heating/cooling systems for buildings by cogeneration plants that generate electricity in addition to providing heating/cooling
Retrofit of existing buildings: Architectural or building changes that enable reducing energy consumption
Waste heat recovery improvements
2. Public services
Energy‐efficiency improvement in utilities and public services through the installation of more efficient lighting or equipment
Rehabilitation of district heating systems
Utility heat loss reduction and/or increased waste heat recovery
Improvement in utility scale energy efficiency through efficient energy use, and loss reduction.
3. Agriculture
Reduction in energy use in traction (e.g. efficient tillage), irrigation, and other agriculture processes
4. Industry
Industrial energy‐efficiency improvements through the installation of more efficient equipment, changes in processes, reduction of heat losses and/or increased waste heat recovery
Installation of cogeneration plants
More efficient facility replacement of an older facility (old facility retired)
Demand‐side, greenfield energy efficiency
1. Construction of new buildings
Use of highly efficient architectural designs or building techniques that enable reducing energy consumption for heating and air conditioning, exceeding available standards and complying with high energy efficiency certification or rating schemes
Supply‐side, brownfield energy efficiency
1. Transmission and distribution systems
Retrofit of transmission lines or substations to reduce energy use and/or technical losses, excluding capacity expansion
Retrofit of distribution systems to reduce energy use and/or technical losses, excluding capacity expansion

© OECD/IEA 2012 Plugging the energy efficiency gap with climate finance
Page | 62
Improving existing systems to facilitate the integration of renewable energy sources into the grid
2. Power plants
Renewable energy power plant retrofits
Energy‐efficiency improvement in existing thermal power plant
Thermal power plant retrofit to fuel switch from a more GHG‐intensive fuel to a different, less GHG‐intensive fuel type
Waste heat recovery improvements
Renewable Energy
1. Electricity generation, greenfield projects
Wind power
Geothermal power
Solar power (concentrated solar power, photovoltaic power)
Biomass or biogas power that does not decrease biomass and soil carbon pools
Ocean power (wave, tidal, ocean currents, salt gradient, etc.)
Hydropower plants only if net emission reductions can be demonstrated
2. Transmission systems, greenfield
New transmission systems (lines, substations) or new systems (e.g., new information and communication technology, storage facility, etc.) to facilitate the integration of renewable energy sources into the grid
3. Heat production, greenfield or brownfield projects
Solar water heating and other thermal applications of solar power in all sectors
Thermal applications of geothermal power in all sectors
Thermal applications of sustainably‐produced bioenergy in all sectors, including efficient, improved biomass stoves
Transport
1. Vehicle energy efficiency fleet retrofit
Existing vehicles, rail or boat fleet retrofit or replacement (including the use of lower‐carbon fuels, electric or hydrogen technologies, etc.)
2. Urban transport modal change
Urban mass transit
Non‐motorized transport (bicycles and pedestrian mobility)
3. Urban development
Integration of transport and urban development planning (dense development, multiple land‐use, walking communities, transit connectivity, etc.), leading to a reduction in the use of passenger cars
Transport demand management measures to reduce GHG emissions (e.g., speed limits, high‐occupancy vehicle lanes, congestion charging/road pricing, parking management, restriction or auctioning of license plates, car‐free city areas, low‐emission zones)

Plugging the energy efficiency gap with climate finance © OECD/IEA 2012
Page | 63
4. Inter‐urban transport and freight transport
Improvement of general transport logistics to increase energy efficiency of infrastructure and transport, e.g. reduction of empty running
Railway transport ensuring a modal shift of freight and/or passenger transport from road to rail (improvement of existing lines or construction of new lines)
Waterways transport ensuring a modal shift of freight and/or passenger transport from road to waterways (improvement of existing infrastructure or construction of new infrastructure)
Agriculture, forestry and land use
1. Afforestation and reforestation
Afforestation (plantations) on non‐forested land
Reforestation on previously forested land
2. Reducing emissions from the deforestation or degradation of ecosystems
Biosphere conservation projects (including payments for ecosystem services)
3. Sustainable forest management
Forest management activities that increase carbon stocks or reduce the impact of forestry activities
4. Agriculture
Agriculture projects that do not deplete and/or improve existing carbon pools (Reduction in fertilizer use, rangeland management, collection and use of bagasse, rice husks, or other agricultural waste, low tillage techniques that increase carbon contents of soil, rehabilitation of degraded lands, etc.)
5. Livestock
Livestock projects that reduce methane or other GHG emissions (manure management with biodigestors, etc.)
6. Biofuels
Production of biofuels (including biodiesel and bioethanol)
Waste and wastewater
Solid waste management that reduce methane emissions (e.g. incineration of waste, landfill gas capture, and landfill gas combustion)
Treatment of wastewater if not a compliance requirement (e.g. performance standard or safeguard) as part of a larger project
Waste recycling projects that recover or reuse materials and waste as inputs into new products or as a resource
Non‐energy GHG reductions
1. Industrial processes
Reduction in GHG emissions resulting from industrial process improvements and cleaner production (e.g. cement, chemical)

© OECD/IEA 2012 Plugging the energy efficiency gap with climate finance
Page | 64
2. Air conditioning and cooling
Retrofit of existing industrial, commercial and residential infrastructure to switch to cooling agent with lower global warming potential
3. Fugitive emissions and carbon capture
Carbon capture and storage projects (including enhanced oil recovery)
Reduction of gas flaring or methane fugitive emissions in the oil and gas industry
Coal mine methane capture
Cross‐sector activities
1. Policy and regulation
National mitigation policy/planning/institutions
Energy sector policies and regulations (energy efficiency standards or certification schemes; energy efficiency procurement schemes; renewable energy policies)
Systems for monitoring the emissions of greenhouse gases
Efficient pricing of fuels and electricity (subsidy rationalization, efficient end‐user tariffs, and efficient regulations on electricity generation, transmission, or distribution),
Education, training, capacity building and awareness raising on climate change mitigation / sustainable energy / sustainable transport; mitigation research
2. Energy audits
Energy audits to energy end‐users, including industries, buildings, and transport systems
3. Supply chain
Improvements in energy efficiency and GHG reductions in existing product supply chains
4. Financing instruments
Carbon markets and finance (purchase, sale, trading, financing, guarantee and other technical assistance). Includes all activities related to compliance‐grade carbon assets and mechanisms, such as Clean Development Mechanism (CDM), Joint Implementation (JI), Assigned Amount Units (AAUs), as well as well‐established voluntary carbon standards like the Verified Carbon Standard (VCS) or the Gold Standard.
Renewable energy and energy efficiency financing through financial intermediaries or similar (e.g. earmarked lines of credit; lines for microfinance institutions, cooperatives, etc.)
5. Low‐carbon technologies
Research and development of renewable energy or energy efficiency technologies
Manufacture of renewable energy and energy efficiency technologies and products
6. Activities with greenhouse gas accounting
Any other activity not included in this list for which the results of an ex‐ante greenhouse gas accounting (undertaken according to commonly agreed methodologies) show emission reductions that are higher than a commonly agreed threshold

Plugging the energy efficiency gap with climate finance © OECD/IEA 2012
Page | 65
References ADB (2012a), 2011 Clean Energy Investments‐Project summaries, ADB, Manila, Philippines.
ADB (2012b), Annual report 2011, ADB, Philippines
AfDB (African Development Bank), the Asian Development Bank (ADB), the European Bank for Reconstruction and Development (EBRD), the European Investment Bank (EIB), the Inter‐Amercan Development Bank IDB), the World Bank (WB), and the International Finance Corporation (IFC) (2012), Joint MDB report on mitigation finance 2011 . http://climatechange.worldbank.org/sites/default/files/MMF_2011_version_21.pdf
Benoit, Philippe (forthcoming), State‐Owned Enterprises: The Third Pillar In Financing Our Low‐Carbon Future, IEA, Paris
Bird, N., J. Brown and L. Schalatek (2011), “Design challenges for the Green Climate Fund”, Climate Finance Policy Brief No.4, Heinrich Böll Stiftung North America/Overseas Department Institute, http://www.odi.org.uk/publications/5256‐design‐challenges‐green‐climate‐fund
Bloomberg New Energy Finance (BNEF) (2012), Solar Surge Drives Record Clean Energy Investment in 2011, http://bnef.com/PressReleases/view/180
Brown, J.,B. Buchner, G. Wagner, K. Sierra (2011), Improving the effectiveness of climate finance: a survey of leveraging methodologies, Overseas Development Institute/Climate Policy Initiative/Environmental Defense Fund/Brookings Institute, http://climatepolicyinitiative.org/wp‐content/uploads/2011/11/Effectiveness‐of‐Climate‐Finance‐Methodology.pdf
Buchner, B., A. Falconer, M. Herve‐Mignucci, C. Trabacchi (2012), The Landscape of Climate Finance, CPI, Venice.
Buchner, B., A. Falconer, M. Herve‐Mignucci, C. Trabacchi, and M. Brinkman (2011), The Landscape of Climate Finance, CPI, Venice.
Buonicore, A. (2012), “Emerging Best Practice for Underwriting Commercially‐Attractive Energy Efficiency Loans”, Paper No 12‐002 BEPAnews, April 20.
Clapp, C., J. Ellis, J. Benn, and J. Corfee‐Morlot (2012), Tracking climate finance: what and how?, OECD/IEA, Paris.
CPI (Climate Policy Initiative) (2012), Annual review of low‐carbon development in China, CPI/Tsinghua Univeristy, Beijing.
Earth Negotiations Bulletin (2012), Summary of the Bonn climate change conference: 14‐25 May 2012, Vol.12 No.546, International Institute for Sustainable Development
EBRD (European Bank for Reconstruction and Development) (2009), Sustainable Energy Initiative – Action and Results 2006‐2008, London.
EBRD (2012a), Annual report 2011, London.
EBRD (2012b), Sustainable Energy Initiative ‐ Phase 3 2012‐2014, London.
EIB (European Investment Bank) (2012), Activity report 2011, EIB, Luxembourg
Figueres, C. and M. Philips (2007), Scaling Up Demand–Side Energy Efficiency Improvements through Programmatic CDM, World Bank, Washington DC.

© OECD/IEA 2012 Plugging the energy efficiency gap with climate finance
Page | 66
Hayes, S., R. Young, and M. Sciortino (2012), The ACEEE 2012 International Energy Efficiency Scorecard, ACEEE Report no. E12A, Washington D.C. http://www.aceee.org/research‐report/e12a.
Hoehne, N., S. Khosla, H. Fekete, and A. Gilbert (2012), Mapping of Green Finance delivered by IDFC members in 2011, Ecofys report CLIDE12246, Koeln, Germany.
Hongo, T. (2012), Climate Finance: Reforms for Private Finance towards Green Growth in Asia, Mitsui Global Strategic Studies Institute, Tokyo.
IDB (2011), Integrated strategy for climate change adaptation and mitigation, and sustainable and renewable energy, IDB, Washington DC
IDB (2012), Annual report 2011, IDB, Washington DC
IEA (International Energy Agency) (2010), Energy Efficiency Governance, OECD/IEA, Paris
IEA (2011a), World Energy Outlook 2011, OECD/IEA, Paris
IEA (2011b), Joint Public‐Private approaches for energy efficiency finance, IEA policy pathway series, OECD/IEA, Paris
IEA (2012), World Energy Outlook 2012, OECD/IEA, Paris
IPCC (Intergovernmental Panel on Climate Change) (2007), Climate Change 2007: Synthesis Report, IPCC, Geneva.
Kossoy, A. and Guigon, P. (2012), State and Trends of the Carbon Market 2012, The World Bank, Washington DC.
Liebrich, M. (2011), Towards a Green Climate Finance Network, White paper, Bloomberg New Energy Finance, London.
Limaye, D. (2011), Overcoming Energy Efficiency Financing Barriers in the ASEAN Region, Presentation at workshop sponsored by IPEEC/WEACT and MEMR, Jakarta, October 2011.
Limaye, D.R. and X. Zhu (2012), Accessing International Financing for Climate Change Mitigation‐A guidebook for developing countries, UNEP.
Linacre, N., A. Kossoy, and P. Ambrosi, (2011), State and Trends of the Carbon Market 2011, The World Bank, Washington DC.
Rathbone, J.P. (2012), “Globalisation changed the movement of capital funds”, Financial Times Special Report: The Future of Development Banks, 24 September 2012, Financial Times, p.2.
Ryan, L. and N. Campbell (2012), Spreading the Net – The Multiple Benefits of Energy Efficiency Improvements, OECD/IEA, Paris.
Sarkar, A. and Singh, J. (2010), Financing energy efficiency in developing countries‐lessons learned and remaining challenges, Energy Policy, No.38.
Schalatek, L., S. Nakhooda and N. Bird (2012), “The Green Climate Fund”, Climate Finance Fundamentals, Brief 11, Heinrich Boell Stiftung North America and Overseas Development Institute, February.
Singh, J., D. R. Limaye, B. Henderson, and X. Shi (2010), Public Procurement of Energy Efficiency Services, the World Bank, Washington DC.
Stadelmann, M., P. Castro, A. Michaleowa (2011), Is there a leverage paradox in Climate finance ? ‐Efficiency of the CDM and the GEF in leveraging funds and reducing CO2, Climate Strategies, Working Paper, May 2011.

Plugging the energy efficiency gap with climate finance © OECD/IEA 2012
Page | 67
T’Serclaes, Philippine de (2010), Money matters – Mitigating risk to spark private investments in energy efficiency, OECD/IEA, Paris
UN (United Nations) (2010a), AGF (Advisory Group on Climate Change Financing) Work Stream 7 Paper: Public interventions to stimulate private investment in adaptation and mitigation, UN.
UN (2010b), Report of the Secretary‐General’s High Level Advisory Group on Climate Change Financing, UN.
UNDP (2011), Catalysing Climate Finance – A Guidebook on Policy and Financing Options to Support Green, Low‐Emission and Climate‐Resilient Development, New York, USA.
UNDP (2012), Transforming On‐Grid Renewable Energy Markets – A Review of UDDP‐GEF Support for Feed‐in Tariffs and Related Price and Market‐Access Instruments, New York, USA.
UNEP (2009), Energy Efficiency and the finance sector – A survey on lending activities and policy issues, UNEP.
UNEP (2011), Bilateral Finance Institutions & Climate Change: A Mapping of Public Financial Flows for Mitigation and Adaptation to Developing Countries in 2010, Bilateral Finance Institutions Climate Change Working Group (UNEP BFI CCWG), Paris.
UNFCCC (2009), “FCCC/SB/2009/2/Summary”, Recommendations on future financing options for enhancing the development, deployment, diffusion and transfer of technologies under the Convention – Report by the Chair of the Expert Group on Technology Transfer, UNFCCC.
UNFCCC (2011a), “Decision 3/CP.17, FCCC/CP/2011/9/Add.1”, Report of the Conference of the Parties on its seventeenth session, held in Durban from 28 November to 11 December 2011, UNFCCC.
UNFCCC (2011b), “Decision 1/CP.16, FCCC/CP/2010/Add.1”, Report of the Conference of the Parties on its sixteenth session, held in Cancun from 29 November to 10 December 2010, UNFCCC.
UNFCCC (2011c), Report of the Transitional Committee for the Design of the Green Climate Fund, Conference of the Parties on its seventeenth session, held in Durban from 28 November to 11 December 2011, UNFCCC.
WB (World Bank) (2008), Project appraisal document on a proposed loan in the amount of US $200 million and a proposed grant from the Global Environment Facility Trust Fund in the amount of US $13.5 million to the People’s Republic of China in support of the Energy Efficiency Financing Project, April 21.
WB (2009), Beyond Bonn – World Bank Group progress on renewable energy and energy efficiency in fiscal 2005‐2009, WB/IFC/MIGA, Washington DC.
WB (2010), 10 Years of Experience in Carbon Finance – Insights from working with the Kyoto mechanisms, Carbon Finance at the World Bank, World Bank, 2010.
WB (2010), “Beyond the sum of its parts – Combining financial instruments for impact and efficiency”, Issues Brief #3, WB, Washington DC.
WB (2012a), Energy Efficiency Community of Practice (EE CoP) – Progress Report for Fiscal Year 2012, Washington DC
WB (2012b), Annual Report 2011, Washington DC.
World Bank Group, International Monetary Fund, OECD, Regional Development Banks, (2011), Mobilizing climate finance, Prepared at the request of G20 finance ministers, Washington DC. Available at http://www.imf.org/external/np/g20/pdf/110411c.pdf

© OECD/IEA 2012 Plugging the energy efficiency gap with climate finance
Page | 68
Websites :
World Bank (2012): http://data.worldbank.org/about/country‐classifications, accessed September, 2012
UNEP/Risoe (2012): UNEP/Risoe website, http://cdmpipeline.org, accessed August, 2012

International Energy Agency • 9 rue de la Fédération • 75739 Paris Cedex 15, France
Buy IEA publications online:
www.iea.org/books
PDF versions available at 20% discount
Books published before January 2011
- except statistics publications -
are freely available in pdf
Onlinebookshop
Tel: +33 (0)1 40 57 66 90
E-mail: [email protected]
