epri/iea workshop: renewables and clean energy for...
TRANSCRIPT
Steve CapannaDirector of Strategic Priorities & Impact Analysis
11/30/2016
EPRI/IEA Workshop: Renewables and Clean Energy for IndustriesUS National Perspective and Enabling Policies

2
Outline
• Recent US Government Developments
• Short term drivers of renewable energy
• The challenge of clean energy deployment in the industrial sector

3
Recent US Government Developments

4
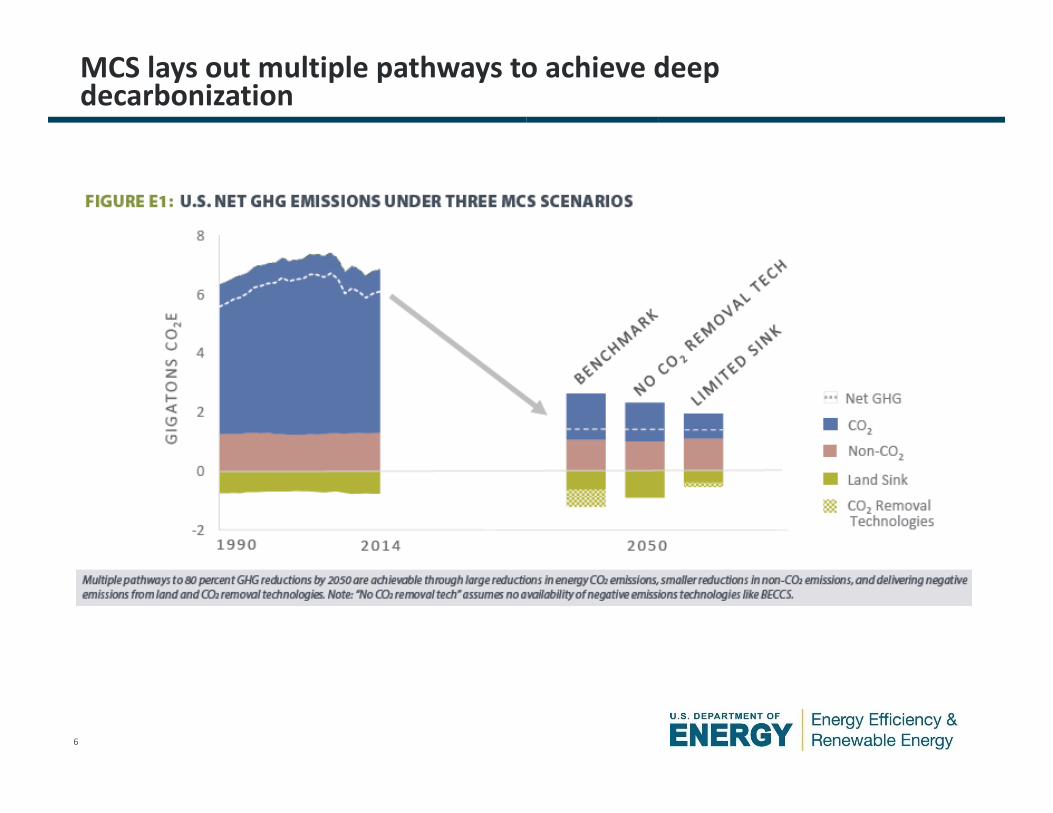
First ever Federal Government report laying out how to achieve economy‐wide 80% emissions reductions
• The MCS is not a political strategy or a new target – it’s a technical document illustrating pathways to achieve 80% economy‐wide emission reductions
• Consistent both with the 2025 target in the U.S. NDC and the global ambition needed to meet the long‐term Paris Agreement aim to limit increases in global average temperatures to well below 2°C above pre‐industrial levels

5
Energy related emissions come from many different sources
6
MCS lays out multiple pathways to achieve deep decarbonization

7
Achieving these goals will require dramatic increases in the deployment of clean energy

8
Short‐Term Drivers of Renewable Energy
9
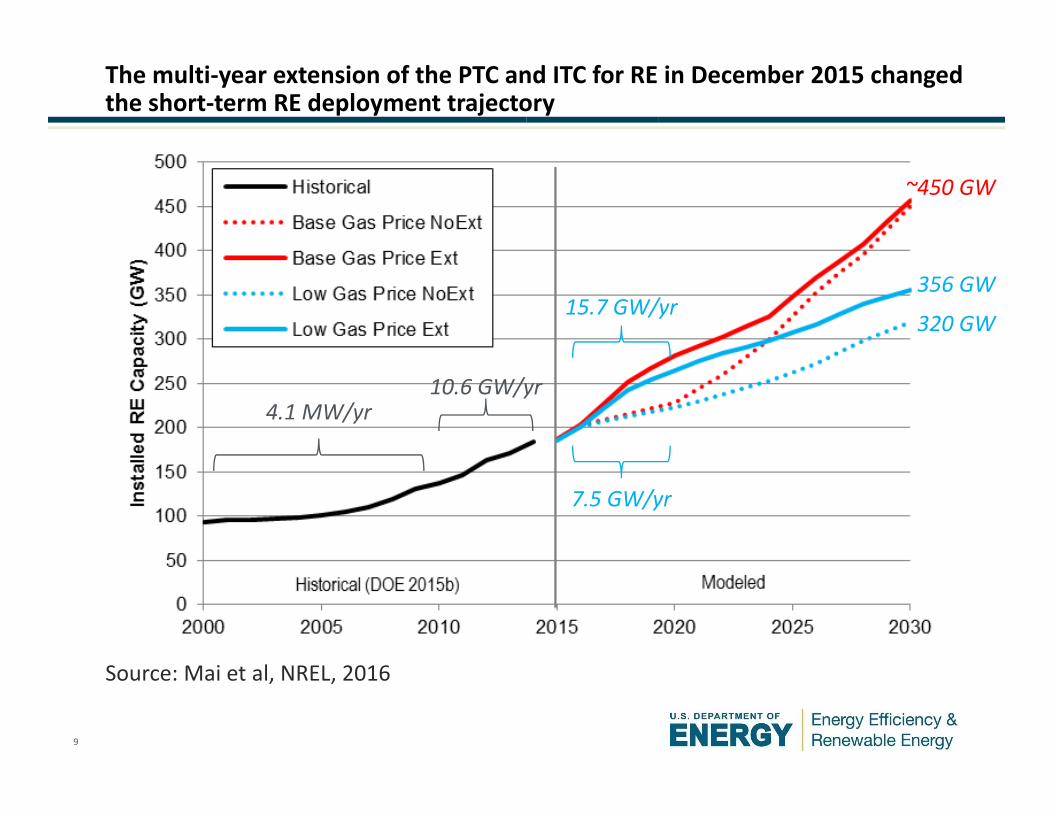
The multi‐year extension of the PTC and ITC for RE in December 2015 changed the short‐term RE deployment trajectory
Source: Mai et al, NREL, 2016
4.1 MW/yr10.6 GW/yr
7.5 GW/yr
~450 GW
15.7 GW/yr356 GW
320 GW

10
Low natural gas prices and RE tax extensions can lead to medium‐term power sector emissions below CPP requirements
RE tax credit extensions help drive even lower emissions and with longer lasting avoided emissionsSource: Mai et al, NREL, 2016
28‐33% belowin 2020
32% below
36% below

11
Continued deployment of clean energy is also enabled by enormous cost reductions over recent years
Source: Revolution…Now, DOE, 2016 Update

12
…As well as by increasing demand for voluntary renewable energy purchases
‐
50
100
150
200
250
300
35020
0620
0720
0820
0920
1020
1120
1220
1320
1420
15
Millions of M
Wh
Other renewables
Voluntary
Compliance (newrenewables)
Compliance (existingrenewables)
• Voluntary REC market grew ~10% from 2014‐2015, and represented 25% of non‐hydro renewables in 2015
• Other renewables –those built for purely economic reasons, represented 11% of non‐hydro RE in 2015
Sources: EIA (2016), Barbose (2016), O’Shaughnessy et al. (2016), as cited in Heeter, “Status and Trends in the Voluntary Market” (2016)

13
Renewable Portfolio Standard Policieswww.dsireusa.org / August 2016
WA: 15% x 2020*
OR: 50%x 2040* (large utilities)
CA: 50% x 2030
MT: 15% x 2015
NV: 25% x2025* UT: 20% x
2025*†
AZ: 15% x 2025*
ND: 10% x 2015
NM: 20%x 2020 (IOUs)
HI: 100% x 2045
CO: 30% x 2020 (IOUs) *†
OK: 15% x 2015
MN:26.5% x 2025 (IOUs)
31.5% x 2020 (Xcel)MI: 10% x
2015*†WI: 10% 2015
MO:15% x 2021
IA: 105 MW IN:10% x 2025†
IL: 25% x 2026
OH: 12.5% x 2026
NC: 12.5% x 2021 (IOUs)
VA: 15% x 2025†KS: 20% x 2020
ME: 40% x 2017
29 States + Washington DC + 3 territories have a Renewable Portfolio Standard (8 states and 1 territories have renewable portfolio goals)Renewable portfolio standard
Renewable portfolio goal Includes non-renewable alternative resources* Extra credit for solar or customer-sited renewables
†
U.S. Territories
DC
TX: 5,880 MW x 2015*
SD: 10% x 2015
SC: 2% 2021
NMI: 20% x 2016
PR: 20% x 2035
Guam: 25% x 2035
USVI: 30% x 2025
NH: 24.8%x 2025VT: 75% x 2032MA: 15% x 2020(new resources) 6.03% x 2016 (existing resources)
RI: 38.5% x 2035CT: 27% x 2020
NY:50% x 2030
PA: 18% x 2021†
NJ: 20.38% RE x 2020 + 4.1% solar by 2027
DE: 25% x 2026*MD: 20% x 2022DC: 20% x 2020
State Policy has also been essential to increased RE deployment

14
There is substantial remaining growth in existing RPS demand
• Under current state targets, total U.S. RPS demand will increase from 215 TWh in 2015 to 431 TWh in 2030 (though RE‐portion in figure is slightly lower: 393 TWh in 2030)
• California represents roughly 40% of that growth; most of the remainder associated with relatively large states
Source: Barbose, “U.S. Renewables Portfolio Standards, 2016 Annual Status Report,” 2016

15
More aggressive RPS targets could drive significant growth in RE deployment
0%
10%
20%
30%
40%
50%
2015 2020 2025 2030 2035 2040 2045 2050
Rene
wab
le Pen
etratio
n
High RE Existing RPS No RPS
• No RPS: no further growth in RPS requirements beyond 2015 and limited economic growth in RE
• Existing RPS: RPS requirements continue to grow based on existing state RPS policies as of July 2016
• High RE: nearly all states adopt an RPS with relatively aggressive targets.
Source: Preliminary Report, LBNL & NREL, A Prospective Analysis of the Costs, Benefits, and Impacts of U.S. Renewable Portfolio Standards, 2016 (forthcoming)
16
The challenge of clean energy deployment in the industrial sector
17
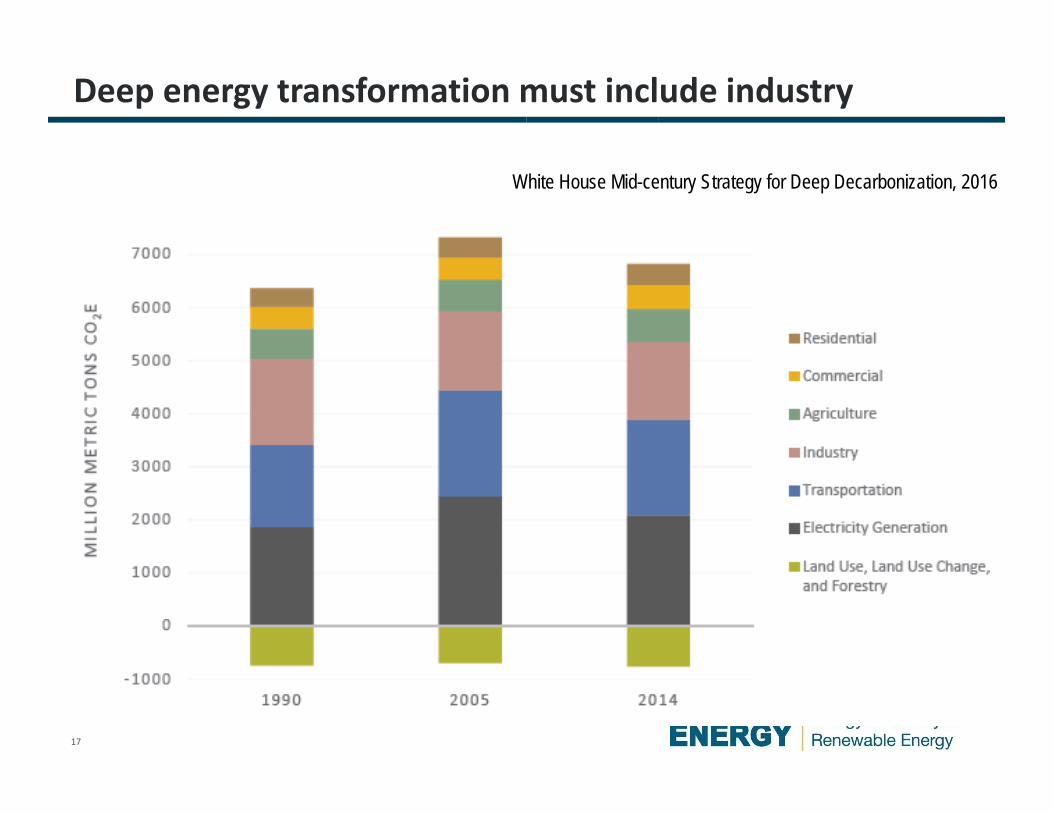
Deep energy transformation must include industry
White House Mid-century Strategy for Deep Decarbonization, 2016

18
Diversity of industrial energy use makes this sector especially challenging
Generation and Use of Thermal Energy in the U.S. Industrial Sector and Opportunities to Remove its Carbon Emissions (McMillan, Boardman et al. INL‐NREL, forthcoming)

19
Pulp & Paper: Current and R&D Energy Savings Bandwidths

20
Forthcoming project: Potential for Widespread Electrification to Reduce Unwanted Pollution (POWER‐UP) Study – www.nrel.gov/analysis/power‐up.html
1. What end‐use services are the best candidates for electrification and how might adoption barriers be overcome?2. How might mass electrification impact national and regional electricity consumption and consumption patterns?3. How would the U.S. electricity system transform to meet the growing consumption needs from mass
electrification and, at the same time, decarbonize?4. How would a decarbonized grid operate to serve an electrified economy and what role might demand‐side
flexibility play to support reliable operations?5. What impacts would this pathway have for GHG emissions, consumer costs, and other environmental, public
health, and social implications?
Goal: Detailed system‐wide exploration of the potential and impact of widespread electrification

21
But many industrial resources are hard to electrify
The largest source of industry GHGs is associated with fossil fuel combustion for process heating
0%
20%
40%
60%
80%
100%Other process use
Facility HVAC
Process heating
Machine drive
Non‐process use
Fuel and Steam Consumption by End Use
77%
Data source: U.S. DOE. 2015. “Manufacturing Energy and Carbon Footprints (2010 MECS)”
Alternative heat supplies could include: • Geothermal • Solar industry process
heat• Small nuclear reactors • Biomass• Hydrogen
22
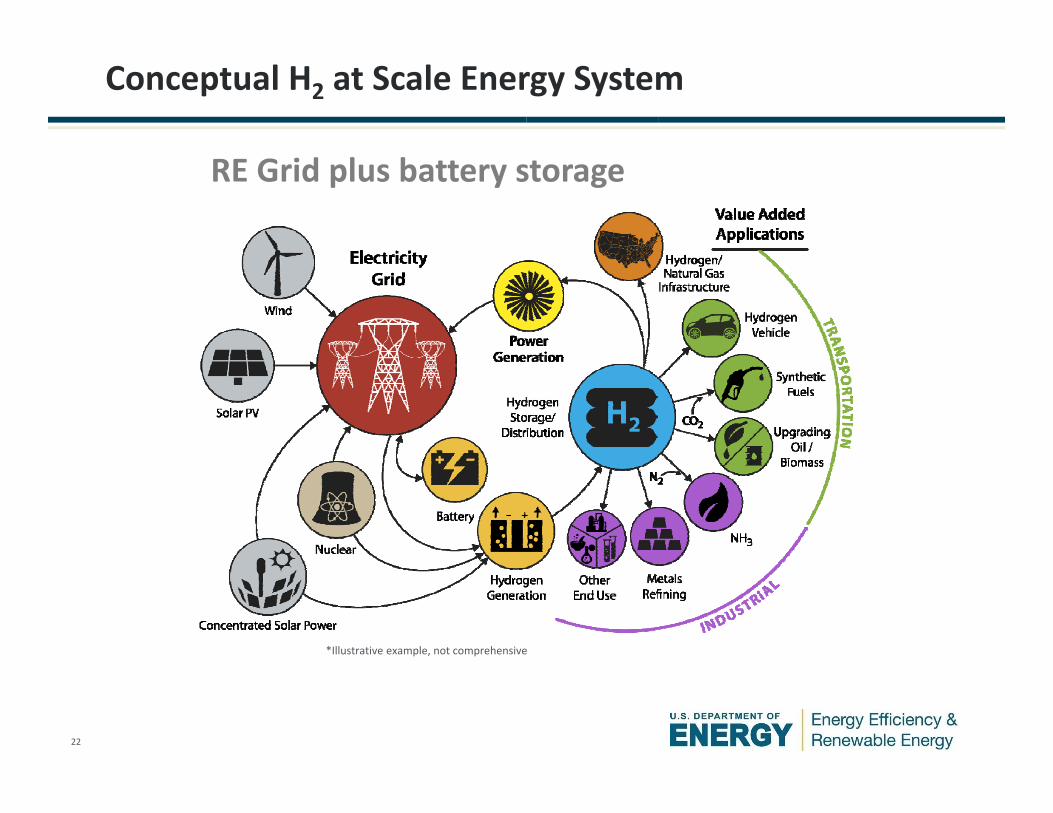
RE Grid plus battery storage
Conceptual H2 at Scale Energy System
*Illustrative example, not comprehensive