the evolution of northeast atlantic gadfly petrels using ... · the evolution of north-east...
TRANSCRIPT
The evolution of north-east Atlantic gadfly petrels usingstatistical phylogeography
B. GANGLOFF,* F . ZINO,† H. SHIRIHAI ,‡ J . GONZALEZ-SOL IS ,§ A. COULOUX,¶ E. PASQUET**
and V. BRETAGNOLLE*
*Centre d’Etudes Biologiques de Chize, CNRS UPR 1934, 79360 Villiers en Bois, France, †Freiras- Associacao para a
Conservacao e Proteccao da Natureza – Freira Conservation Project:- Av., Do Infante 26, 9000-015 Funchal, Madeira, Portugal,
‡c/o Ausserdorfstraße 6, 8052 Zurich Switzerland, §Institute for Research on Biodiversity (IRBio), Department of Animal
Biology, University of Barcelona, Av Diagonal 643, Barcelona 08028, Spain, ¶Genoscope, Centre National de Sequencage, 2, rue
Gaston Cremieux, CP5706, 91057 Evry Cedex, France, **Departement Systematique et Evolution, Museum National d’Histoire
Naturelle, UMR7205 Origine, Structure et Evolution de la Biodiversite, 55 rue Buffon, 75005 Paris, France
Abstract
Macaronesia (north-east Atlantic archipelagos) has been host to complex patterns of
colonization and differentiation in many groups of organisms including seabirds such
as gadfly petrels (genus Pterodroma). Considering the subspecies of widely distributed
soft-plumaged petrel for many years, the taxonomic status of the three gadfly petrel
taxa breeding in Macaronesia is not yet settled, some authors advocating the presence
of three, two or one species. These birds have already been the subject of genetic stud-
ies with only one mtDNA gene and relatively modest sample sizes. In this study,
using a total of five genes (two mitochondrial genes and three nuclear introns), we
investigated the population and phylogeographical histories of petrel populations
breeding on Madeira and Cape Verde archipelagos. Despite confirming complete line-
age sorting with mtDNA, analyses with nucDNA failed to reveal any population struc-
turing and Isolation with Migration analysis revealed the absence of gene flow during
the differentiation process of these populations. It appears that the three populations
diverged in the late Pleistocene in the last 150 000 years, that is 10 times more recently
than previous estimates based solely on one mtDNA gene. Finally, our results suggest
that the Madeira petrel population is ancestral rather than that from Cape Verde. This
study strongly advocates the use of nuclear loci in addition to mtDNA in demographical
and phylogeographical history studies.
Keywords: intron, mitochondrial DNA, petrel, procellariiformes, seabird
Received 22 December 2012; revision received 10 October 2012; accepted 16 October 2012
Introduction
Processes of population differentiation, potentially lead-
ing to speciation, have been particularly well studied in
birds in the last 50 years (Price 2008). Some bird species
have, however, been less studied than others: oceanic
seabirds, for instance, have been poorly studied, and
the most recent major review of speciation in birds pro-
vides only seven examples from this group, concerning
only three genera (but see Friesen 2007; Friesen et al.
2007a; Price 2008). Pelagic seabirds that usually breed
on oceanic islands are regarded as challenging models
when investigating the processes of population differen-
tiation. They are indeed highly mobile organisms, and
physical barriers to their dispersal are virtually nonexis-
tent, which is expected to enhance high gene flow
between populations. However, although rare, physical
barriers to gene flow can affect the population structure
and differentiation of pelagic seabirds. The best exam-
ple is probably the Isthmus of Panama, which has been
identified as the main cause of isolation between
populations of pantropical seabirds such as boobies
(Steeves et al. 2003, 2005a; but see Hailer et al. 2011). InCorrespondence: Benoit Gangloff, E-mail: benoitgangloff@
yahoo.fr
© 2012 Blackwell Publishing Ltd
Molecular Ecology (2013) 22, 495–507 doi: 10.1111/mec.12119
regions where such physical barriers are absent, it has
been shown that nonvisible barriers such as oceanic
fronts can act as barriers to gene flow (e.g. in Calonectris
shearwaters, Gomez-Diaz et al. 2006). Furthermore, non-
physical causes such as the discrete location of their
breeding localities associated with their extreme philop-
atric behaviour can enhance population differentiation
in seabirds (e.g. in boobies, Steeves et al. 2005b). Pro-
cesses acting on seabird population genetics are there-
fore particularly complex. The petrels (order
Procellariiformes), containing 113 recognized species
(BirdLife International 2012), are probably the most
extreme seabirds in this regard. First, they are the most
pelagic seabirds, with almost all species breeding on
oceanic islands (Brooke 2004). Second, they also show
an extreme degree of philopatric behaviour (Austin
1996; Brooke 2004). Third, because many species show
nocturnal habits on the breeding grounds, their commu-
nication system (and presumably behavioural pre-isolat-
ing mechanism: Bretagnolle 1996) almost never rely on
visual cues, and many taxa show cryptic and highly
convergent plumages. This has resulted in obscure tax-
onomy, many cases of phylogenetic uncertainties,
including cryptic species with unclear phylogeographi-
cal histories, which causes frequent revisions of their
taxonomy (Brooke 2004). The recent use of phylogenetic
information has indeed led to several taxonomic revi-
sions (Abbott & Double 2003; Burg & Croxall 2004; Aus-
tin et al. 2004; Bolton et al. 2008), or the discovery of
cryptic species and strong genetic population structur-
ing (Friesen et al. 2006, 2007b; Smith & Friesen 2007;
Bolton et al. 2008).
Perhaps one of the best examples of Procellariiformes
phylogenetic complexity exists in the north-east Atlantic
islands, where gadfly petrels (genus Pterodroma) breed-
ing in Madeira and Cape Verde archipelagos have led
to never-ending taxonomic debates (reviews in Zino
et al. 2008 and Shirihai et al. 2010). Three Pterodroma
taxa breed in these islands: one on Madeira Island itself
(Zino’s petrel; taxon madeira), one on Bugio Island
(Deserta petrel; taxon deserta) just 40 km south-east of
Madeira and one in the Cape Verde archipelago (Cape
Verde petrel; taxon feae) about 2000 km to the south, on
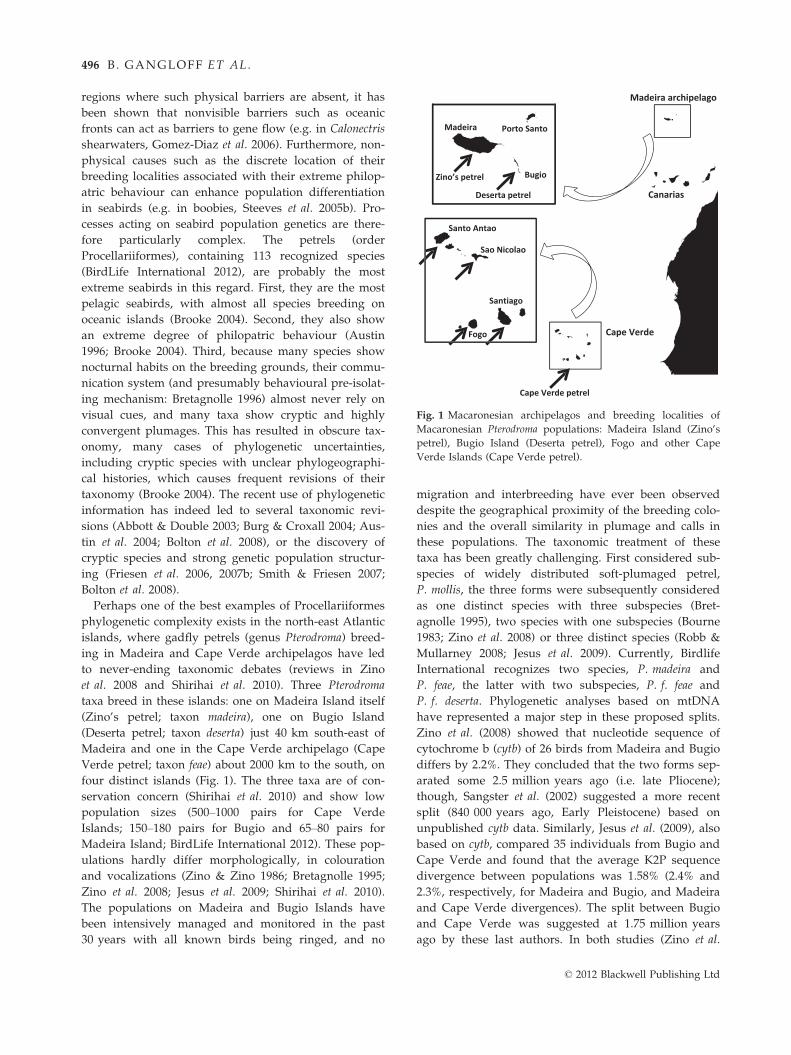
four distinct islands (Fig. 1). The three taxa are of con-
servation concern (Shirihai et al. 2010) and show low
population sizes (500–1000 pairs for Cape Verde
Islands; 150–180 pairs for Bugio and 65–80 pairs for
Madeira Island; BirdLife International 2012). These pop-
ulations hardly differ morphologically, in colouration
and vocalizations (Zino & Zino 1986; Bretagnolle 1995;
Zino et al. 2008; Jesus et al. 2009; Shirihai et al. 2010).
The populations on Madeira and Bugio Islands have
been intensively managed and monitored in the past
30 years with all known birds being ringed, and no
migration and interbreeding have ever been observed
despite the geographical proximity of the breeding colo-
nies and the overall similarity in plumage and calls in
these populations. The taxonomic treatment of these
taxa has been greatly challenging. First considered sub-
species of widely distributed soft-plumaged petrel,
P. mollis, the three forms were subsequently considered
as one distinct species with three subspecies (Bret-
agnolle 1995), two species with one subspecies (Bourne
1983; Zino et al. 2008) or three distinct species (Robb &
Mullarney 2008; Jesus et al. 2009). Currently, Birdlife
International recognizes two species, P. madeira and
P. feae, the latter with two subspecies, P. f. feae and
P. f. deserta. Phylogenetic analyses based on mtDNA
have represented a major step in these proposed splits.
Zino et al. (2008) showed that nucleotide sequence of
cytochrome b (cytb) of 26 birds from Madeira and Bugio
differs by 2.2%. They concluded that the two forms sep-
arated some 2.5 million years ago (i.e. late Pliocene);
though, Sangster et al. (2002) suggested a more recent
split (840 000 years ago, Early Pleistocene) based on
unpublished cytb data. Similarly, Jesus et al. (2009), also
based on cytb, compared 35 individuals from Bugio and
Cape Verde and found that the average K2P sequence
divergence between populations was 1.58% (2.4% and
2.3%, respectively, for Madeira and Bugio, and Madeira
and Cape Verde divergences). The split between Bugio
and Cape Verde was suggested at 1.75 million years
ago by these last authors. In both studies (Zino et al.
Madeira archipelago
Cape Verde
Canarias
Madeira
Bugio
Porto Santo
Santo Antao
Santiago
Sao Nicolao
Fogo
Deserta petrel
Zino’s petrel
Cape Verde petrel
Fig. 1 Macaronesian archipelagos and breeding localities of
Macaronesian Pterodroma populations: Madeira Island (Zino’s
petrel), Bugio Island (Deserta petrel), Fogo and other Cape
Verde Islands (Cape Verde petrel).
© 2012 Blackwell Publishing Ltd
496 B. GANGLOFF ET AL.

2008; Jesus et al. 2009), the three populations were recip-
rocally monophyletic, and no cytb haplotypes were
shared. Although this is not what Jesus et al. (2009)
conclude, trees recovered in their study indicate that
Zino’s petrel is basal to the sister taxa Cape Verde and
Deserta petrels. Although never tested accurately, the
acknowledged historical scenario suggests that the
Madeiran archipelago might have been colonized twice
– Zino’s petrel evolving when the climate was cooler
and wetter in the Early Pleistocene, and petrels from
Cape Verde colonizing Bugio and potentially other
islands more recently when the climate became warmer
and dryer (Bourne 1983). This could explain the
differences between Madeira and Bugio birds despite
the close proximity of these islands; though in his
scenario, Bourne (1983) did not explicitly suggest that
birds from Cape Verde colonized both Madeira and
Bugio.
The separation of the three Macaronesian gadfly pet-
rel taxa into three species, supported by the cytb data of
Zino et al. (2008) and Jesus et al. (2009), is currently
uncorroborated by other criteria such as morphology
(Shirihai et al. 2010) or vocalizations (Bretagnolle 1995;
but see Robb & Mullarney 2008). It is known that few
migrants per generation can prevent population differ-
entiation (Wright 1931) and even limited male-mediated
gene flow might explain this lack of morphological and
behavioural differentiation between the three taxa in
spite of apparent complete lineage sorting in mtDNA.
Disentangling patterns of divergence between popula-
tions can have broad implications both for our under-
standing of divergence processes and for defining
species boundaries in threatened taxa. It is therefore
necessary to further investigate these three petrel popu-
lations of the north-east Atlantic by other means than
mitochondrial DNA.
Indeed, the supremacy of mitochondrial DNA
(mtDNA) in vertebrate phylogenetic and phylogeo-
graphical studies has recently been challenged by the
increasing use of, and the sometimes conflicting results
that emerged from, nuclear genes (Edwards et al. 2005;
Zink & Barrowclough 2008; Edwards & Bensch 2009). It
thus appears that complex phylogeographical patterns
lying between intraspecific population genetics and
interspecific phylogenetics cannot be described with the
use of a single mitochondrial gene. Nuclear genes were
not available until fairly recently (Lee & Edwards 2008),
and mitochondrial DNA was mostly used, given its
nonrecombining properties and its high mutation rate
(Avise et al. 1987; Zink & Barrowclough 2008). In addi-
tion, because of its lower effective population size (Ne)
compared to nuclear DNA (approximately 4 Ne), line-
age sorting will occur faster for mtDNA than for
nucDNA, thus allowing the detection of more recent
split events (Zink & Barrowclough 2008). However,
with the increasing use of nuclear markers along with
mtDNA, a growing body of evidence has indicated that
inferences based on mtDNA should be regarded with
caution (Funk & Omland 2003; Chan & Levin 2005).
Many studies revealed discrepant results between
mtDNA and nuclear genes and even sometimes incon-
gruences between the two types of markers (e.g. Shaw
2002; Spinks & Shaffer 2009; see also Zink & Barrowc-
lough 2008 and Lee & Edwards 2008 for a review and a
recent example in birds). Such discrepancies or incon-
gruences have been explained by lower mutation rate
of the nuclear genes, incomplete lineage sorting and
possibly more complicated evolutionary scenarios
including hybridization or natural selection that may
actually act on mtDNA (Avise et al. 1987; Edwards et al.
2005; Bazin et al. 2006; Spinks & Shaffer 2009). Although
the respective merits of nuclear vs. mtDNA markers are
disputed in regard to disentangling the pattern and
process in evolution and speciation (see Zink & Bar-
rowclough 2008; Edwards & Bensch 2009), consensus
has eventually emerged that their combination provides
powerful tools for phylogeographical investigations. In
addition, the recent advances in methodology have pro-
vided analytical frameworks to investigate the origin
and evolution of taxa by integrating simultaneously
several genes histories, for example multilocus phyloge-
netic inference (Heled & Drummond 2010) and statisti-
cal phylogeography (Hey 2010).
In this study, we used a statistical phylogeography
method with two mitochondrial markers and three
nuclear introns to investigate (i) whether nuclear DNA
confirms the reciprocal monophyly of the three taxa
observed with mtDNA (Zino et al. 2008; Jesus et al.
2009) and the evolutionary relationships among them,
(ii) the timing of divergence in these threatened sea-
birds and whether divergence occurred with or without
gene flow and (iii) whether further genetic data can
resolve current uncertainties around the species status
of these three petrel populations.
Materials and methods
Sample collection and laboratory methods
Because of the taxonomic uncertainties surrounding the
three taxa under study, we refer to them hereafter by
their taxon or vernacular names as opposed to their
potential species names. Blood samples were obtained
from the island of Bugio (Desertas islands, off
Madeira), Madeira and two islands of the Cape Verde
archipelago, Fogo and Santo Antao Islands (Fig. 1).
Blood was collected from the veins on the leg or wing
using insulin syringes and microcapillaries and stored
© 2012 Blackwell Publishing Ltd
NORTH-EAST ATLANTIC GADFLY PETRELS’ PHYLOGEOGRAPHY 497
in 70% ethanol and then frozen at �20 °C until process-
ing.
Total genomic DNA was extracted using the DNeasy
Tissue Extraction kit (Qiagen, Valencia, CA, USA) fol-
lowing manufacturer’s instructions except that we
increased the time of proteinase digestion to 2 h. Cyto-
chrome oxydase 1 gene (CO1) was amplified using
primers F1B 5′-AACCGATGACTATTYTCAACC-3′ and
R1B 5′-TACTACRTGYGARATGATTCC-3′ (Gangloff
et al. 2012). The PCR consisted of 37 cycles at 94 °C for
30 s, 51 °C for 40 s and 72 °C for 50 s. Cytochrome b
gene was amplified using primers L14987 5′-TAT-
TTCTGCTTGATGAAACT-3′ and H16025 5′-CTAGGG-
CTCCAATGATGGGGA-3′ (Jesus et al. 2009) and 40
PCR cycles consisting of 30 s at 94 °C, 50 s at 58 °C,50 s at 72 °C. Primers FIB-BI7U 5′-GGAGAAAACA-
GGACAATGACAATTCAC-3′ and FIB-BI7L 5′-TCCC-
CAGTAGTATCTGC-CATTAGGGTT-3′ (Prychitko &
Moore 1997) were used to amplify the beta-fibrinogen
intron 7 (bFibint7). We ran thirty-nine PCR cycles
consisting of 1 min at 94 °C, 40 s at 58 °C and 50 s at
72 °C. For these three markers, PCR cycles were
preceded by an initial denaturation step of 4 min at
94 °C and were followed by a 5 min final extension
step at 72 °C.PCR amplification of the nuclear cold shock domain
containing E1 (CSDE1) and PAX interacting protein 1
(PAXIP1) introns followed protocols and used primers
described by Kimball et al. (2009).
Sequencing was conducted under BigDyeTM termina-
tor cycling conditions at the ‘Genoscope – Centre
National de Sequencage’, France. DNA sequences were
aligned using CodonCode Aligner 3.0.3 (CodonCode
Corporation, 2009) and ClustalW (Thompson et al. 1994)
as implemented in Mega version 4 (Tamura et al. 2007)
and checked by eye.
Before conducting analyses, mitochondrial origin of
mitochondrial gene sequences was confirmed by trans-
lating these to check for the presence of stop codons
and other indices of their potential nuclear origin.
Preliminary analyses indicated no differentiation
between the two colonies within Cape Verde, and there-
fore, we pooled the data from Fogo and Santo Antao
Islands. Sequencing of PAXIP1 and CSDE1, initially not
planned, was carried out opportunistically after the
analyses had started, by randomly selecting a small
number of individuals of the three populations, explain-
ing the unbalanced sample size between these two
markers and the three others (Table 1). To estimate
genetic diversity and genetic structure, we used all
available sequences for each gene. For the analysis of
phylogenetic relationships and estimates of gene flow
and divergence times, to reduce computational time, we
used all available sequences for PAXIP1 and CSDE1
and subsampled randomly eight individuals (Felsen-
stein 2006; Kuhner 2009) from each taxon for the three
other genes (CO1, cytb and bFibint7). We repeated this
subsampling and analyses three times; results were sim-
ilar among replicates for all analyses, so results of one
replicate are presented here. Prior to species tree and
Isolation with Migration analyses, recombination in
nuclear loci was tested with the four-gamete test (Hud-
son & Kaplan 1985) implemented in DnaSp v5 (Librado
& Rozas 2009). In addition, because the Isolation with
Migration analysis required having known phase for
nuclear sequences, we determined the gametic phase
using the program PHASE (Stephens et al. 2001) imple-
mented in DnaSp v5. Phased haplotypic data of nuclear
introns were then used in analyses, individuals thus
being represented by two sequences.
Genetic diversity and structure
Nucleotide diversity (p) and haplotype diversity (h)
were calculated with Arlequin v3.5 (Excoffier & Lischer
2010).
To investigate whether populations at Cape Verde,
Madeira and Bugio are differentiated, we conducted an
exact test of population differentiation (Raymond &
Rousset 1995) for each genetic marker. Proportion
of genetic variation explained by interpopulation
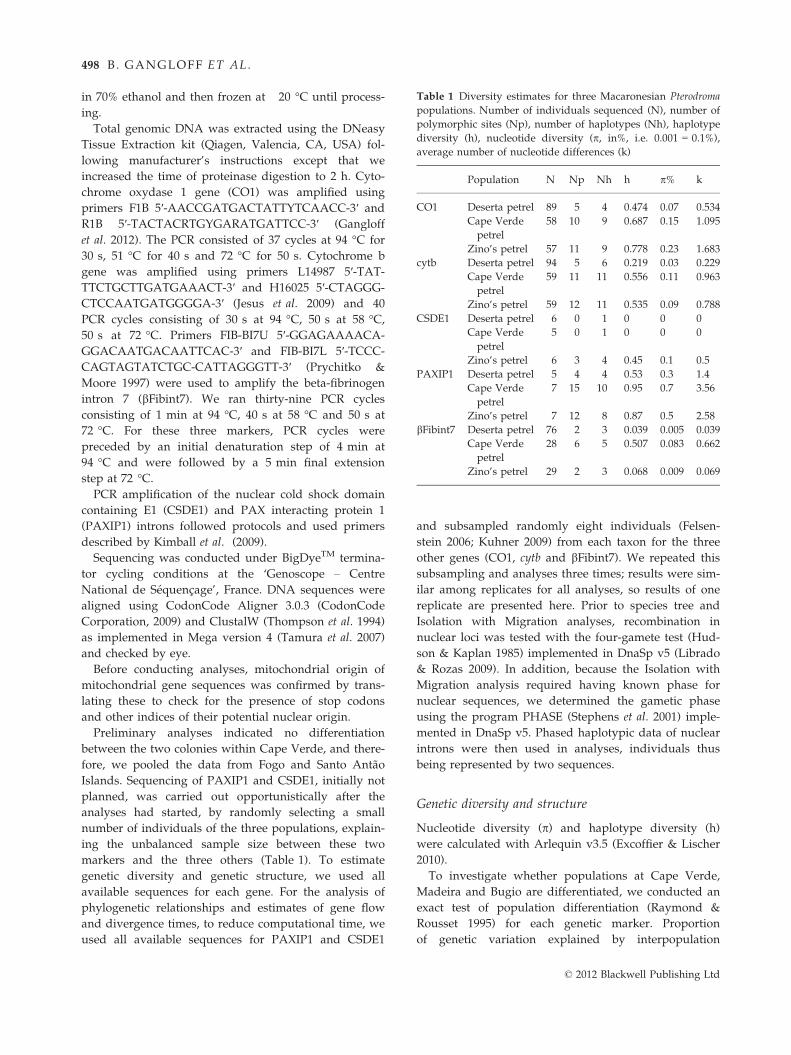
Table 1 Diversity estimates for three Macaronesian Pterodroma
populations. Number of individuals sequenced (N), number of
polymorphic sites (Np), number of haplotypes (Nh), haplotype
diversity (h), nucleotide diversity (p, in%, i.e. 0.001 = 0.1%),
average number of nucleotide differences (k)
Population N Np Nh h p% k
CO1 Deserta petrel 89 5 4 0.474 0.07 0.534
Cape Verde
petrel
58 10 9 0.687 0.15 1.095
Zino’s petrel 57 11 9 0.778 0.23 1.683
cytb Deserta petrel 94 5 6 0.219 0.03 0.229
Cape Verde
petrel
59 11 11 0.556 0.11 0.963
Zino’s petrel 59 12 11 0.535 0.09 0.788
CSDE1 Deserta petrel 6 0 1 0 0 0
Cape Verde
petrel
5 0 1 0 0 0
Zino’s petrel 6 3 4 0.45 0.1 0.5
PAXIP1 Deserta petrel 5 4 4 0.53 0.3 1.4
Cape Verde
petrel
7 15 10 0.95 0.7 3.56
Zino’s petrel 7 12 8 0.87 0.5 2.58
bFibint7 Deserta petrel 76 2 3 0.039 0.005 0.039
Cape Verde
petrel
28 6 5 0.507 0.083 0.662
Zino’s petrel 29 2 3 0.068 0.009 0.069
© 2012 Blackwell Publishing Ltd
498 B. GANGLOFF ET AL.
differences was investigated for each marker with an
analysis of molecular variance (AMOVA). AMOVA allows
estimating the proportion of total variance accounted
for within and among populations. Statistical signifi-
cance of the variance components was determined by
1000 permutations of genotypes. All these analyses
were performed in Arlequin v3.5
Evolutionary relationships estimation
For all five markers, phylogenetic relationships between
haplotypes were inferred using haplotype network
reconstruction, with the median-joining networks
method implemented in NETWORK v4.5.1 (Bandlet
et al. 1999). Haplotype networks, contrary to phyloge-
netic tree reconstruction, do not impose bifurcating
relationships between sequences and are well suited
for intraspecific investigations (Posada & Crandall 2001;
Forister et al. 2008).
To estimate the phylogenetic relationships among the
three populations, we used the *BEAST method (Heled
& Drummond 2010) implemented in the software
BEAST v. 1.6.1 (Drummond & Rambaut 2007). This
method, using the multispecies coalescent (Degnan &
Rosenberg 2009), models the lineage sorting process
between taxonomic units for groups of individuals not
connected by gene flow above, at or below the species
level and does not require inclusion of an outgroup
(Heled & Drummond 2010). Four runs of 5 9 107 gen-
erations, sampling every 1000 generations and with a
burnin of 1.25 9 107, were performed and then com-
bined in LogCombiner v.1.6.1 (Heled & Drummond
2010). Nucleotide substitution models were determined
with jModelTest v0.1.1 (Guindon & Gascuel 2003;
Posada 2008), and we used a relaxed clock model with
an uncorrelated lognormal distribution. We used a
mutation rate fix mean value of 0.794 ± 0.115% per mil-
lion year for CO1 (Pereira & Baker 2006), 1.89 ± 0.35%
per million year obtained for Procellariiformes cytb
(Weir & Schluter 2008) and 0.36% per million year for
nuclear introns (Axelsson et al. 2004). We specified a
Yule process species tree prior under a continuous pop-
ulation size model. We used the software TRACER v1.5
(Drummond & Rambaut 2007) to visualize the results of
the runs as well as for checking effective sample size of
each parameter.
Estimation of gene flow and population divergence
We estimated gene flow and divergence time among
Macaronesian petrel populations using IMa2 (Hey
2010). This software, using the Isolation with Migration
model (Hey & Nielsen 2007), tests whether or not popu-
lations diverged in the presence of gene flow, but
requires an a priori tree topology of the populations
under study. We thus used the species tree obtained
with *BEAST to provide this required topology. We
first ran an analysis with the ‘M mode’ applying the
infinite sites mutation model for the nuclear introns and
HKY model for the mitochondrial data. We used 40
independent Markov chain with a geometric heating
scheme (ha = 0.975, hb = 0.75). Runs consisted of 1.106
sampled steps following a discarded burnin of 1.106
steps. Because posterior probabilities of gene flow
between populations all peaked at zero, we then ran an
M mode analysis adding a ‘no gene flow’ prior. Proce-
dures for this analysis were similar to the previous M
mode analysis.
To scale parameters in demographical units, a range
of mutation rates can be given as prior to the analysis.
For mitochondrial data, we used the estimates of
0.794 9 10�8 and 1.89 9 10�8 substitutions/site/year
estimated for Procellariiformes for CO1 (Pereira &
Baker 2006) and cytb (Weir & Schluter 2008), respec-
tively. For introns, we used a mutation rate of
3.6 9 10�9 substitutions/site/year found by Axelsson
et al. (2004) for birds from 33 autosomal loci. In addi-
tion, evaluating the degree of gene flow, divergence
time and population sizes in a demographical unit is
possible provided that a generation time is available for
the studied taxa. Pterodroma petrels are long-lived sea-
birds, but no accurate estimation of generation time cur-
rently exists for these species. However, assuming a
stable population, it is possible to estimate this parame-
ter based on age at maturity and adult survival as
T = A + p/(1-p) (1) with T the generation time, A the
age at maturity and p the adult survival rate (Lande
et al. 2003; Saether et al. 2004). Available estimated adult
survival rate in other Pterodroma is 0.93 (Simons 1984;
Brooke et al. 2010), and age of sexual maturity in other
Pterodroma is approximately 6 years of age (Simons
1984; Warham 1990). Thus, using values of 0.93 and 6
for p and A, respectively, equation (1) gives a genera-
tion time T of approximately 20 years. This value was
also found by Cuthbert (2004) in Atlantic petrel (Ptero-
droma incerta), and here, we used an approximate gener-
ation time of 20 years. Runs were monitored by
observing effective sample size (ESS) values and
inspecting parameter plots for trends (see manual rec-
ommendations). Analyses were run three times to
ensure convergence, and because all results were simi-
lar, only one is presented here.
Results
We obtained samples from 98 petrels from Bugio, 84
petrels from Madeira and 59 from Cape Verde. We
sequenced 794, 481 and 478 bp for bFibint7, CSDE1 and
© 2012 Blackwell Publishing Ltd
NORTH-EAST ATLANTIC GADFLY PETRELS’ PHYLOGEOGRAPHY 499
PAXIP1, respectively, and 732 and 872bp for CO1 and
cytb, respectively. Numbers of individuals sequenced
per population for each gene are shown in Table 1. No
recombination was detected in the nuclear intron data.
After translation of mitochondrial sequences, no non-
sense or stop codons were found and no insertion or
deletions were observed in these sequences. Further-
more, DNA was amplified with specific primers
designed for Procellariiformes (Jesus et al. 2009; Gangl-
off et al. 2012) rather than universal primers, which is
supposed to reduce the risk of Numts amplification
(Sorenson & Quinn 1998). In addition, cytb sequences
obtained were similar to those obtained with the same
taxon previously (Zino et al. 2008; Jesus et al. 2009).
Finally, we also checked forward and reverse sequences
and checked for the presence of double peaks that are
characteristics of Numts. No duplications were
detected, and true mitochondrial origin of obtained
sequences is very likely. Mitochondrial data contained
54 polymorphic sites (26 and 28 for CO1 and cytb,
respectively; Table 1), while combined nuclear data
exhibited 44 variable sites (10 in bFibint7, 3 in CSDE1,
31 in PAXIP1; Table 1).
These variable sites defined a total of 22 and 28 hapl-
otypes in CO1 and cytb, respectively, while after phas-
ing the nuclear intron data, 6, 22 and 11 haplotypes
were found in CSDE1, PAXIP1 and bFibint7, respec-
tively (Table 1).
With all five markers, petrels from Bugio showed
lower haplotypic diversity (range 0 in CSDE1 to 0.53 in
PAXIP1) than Cape Verde and Madeira (range 0 in
CSDE1 for Cape Verde petrel to 0.95 in PAXIP1 again
for Cape Verde petrel) despite having a sample size 1.5-
2 times greater in CO1, cytb and bFibint7. The trend
was similar with nucleotide diversity (Table 1).
Population structure
Mitochondrial and nuclear markers exhibited discrepant
pattern in terms of population structure. Exact test of
population differentiation indicated a significant
differentiation among the three populations taken
together (P < 0.001) in mitochondrial markers. With
pairwise comparisons, the pattern was similar, all pair-
wise tests indicating statistically significant differentia-
tion (all P < 0.001) between pairs of populations in
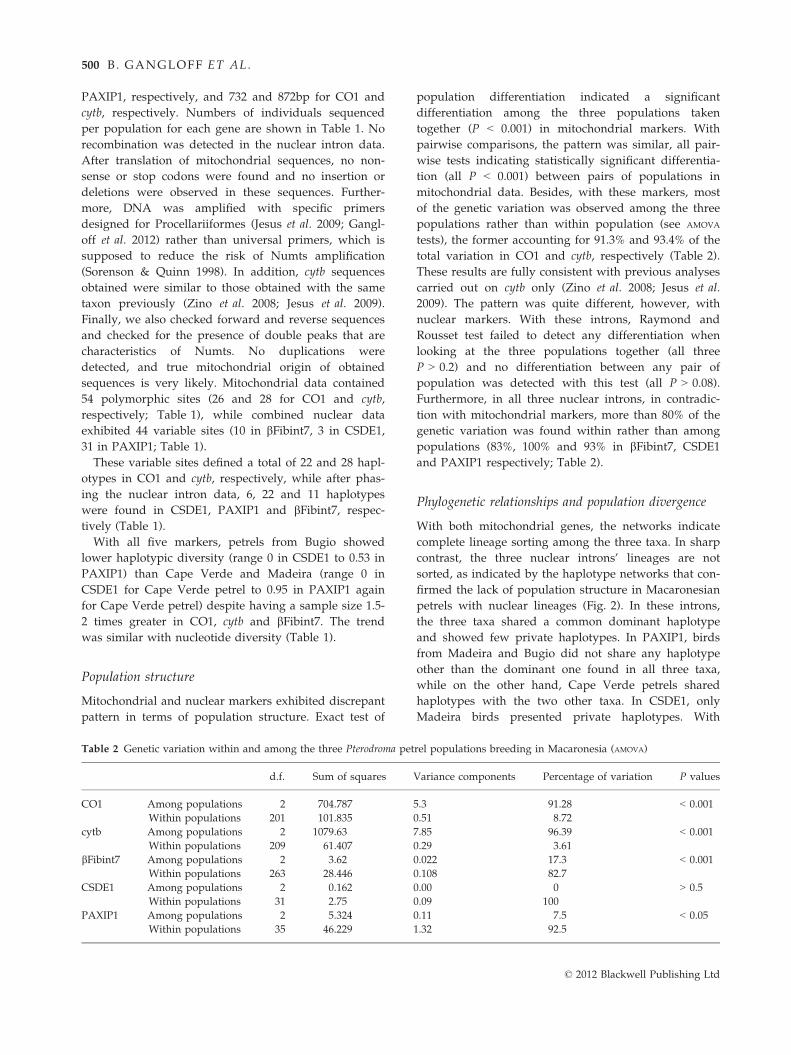
mitochondrial data. Besides, with these markers, most
of the genetic variation was observed among the three
populations rather than within population (see AMOVA
tests), the former accounting for 91.3% and 93.4% of the
total variation in CO1 and cytb, respectively (Table 2).
These results are fully consistent with previous analyses
carried out on cytb only (Zino et al. 2008; Jesus et al.
2009). The pattern was quite different, however, with
nuclear markers. With these introns, Raymond and
Rousset test failed to detect any differentiation when
looking at the three populations together (all three
P > 0.2) and no differentiation between any pair of
population was detected with this test (all P > 0.08).
Furthermore, in all three nuclear introns, in contradic-
tion with mitochondrial markers, more than 80% of the
genetic variation was found within rather than among
populations (83%, 100% and 93% in bFibint7, CSDE1
and PAXIP1 respectively; Table 2).
Phylogenetic relationships and population divergence
With both mitochondrial genes, the networks indicate
complete lineage sorting among the three taxa. In sharp
contrast, the three nuclear introns’ lineages are not
sorted, as indicated by the haplotype networks that con-
firmed the lack of population structure in Macaronesian
petrels with nuclear lineages (Fig. 2). In these introns,
the three taxa shared a common dominant haplotype
and showed few private haplotypes. In PAXIP1, birds
from Madeira and Bugio did not share any haplotype
other than the dominant one found in all three taxa,
while on the other hand, Cape Verde petrels shared
haplotypes with the two other taxa. In CSDE1, only
Madeira birds presented private haplotypes. With
Table 2 Genetic variation within and among the three Pterodroma petrel populations breeding in Macaronesia (AMOVA)
d.f. Sum of squares Variance components Percentage of variation P values
CO1 Among populations 2 704.787 5.3 91.28 < 0.001
Within populations 201 101.835 0.51 8.72
cytb Among populations 2 1079.63 7.85 96.39 < 0.001
Within populations 209 61.407 0.29 3.61
bFibint7 Among populations 2 3.62 0.022 17.3 < 0.001
Within populations 263 28.446 0.108 82.7
CSDE1 Among populations 2 0.162 0.00 0 > 0.5
Within populations 31 2.75 0.09 100
PAXIP1 Among populations 2 5.324 0.11 7.5 < 0.05
Within populations 35 46.229 1.32 92.5
© 2012 Blackwell Publishing Ltd
500 B. GANGLOFF ET AL.
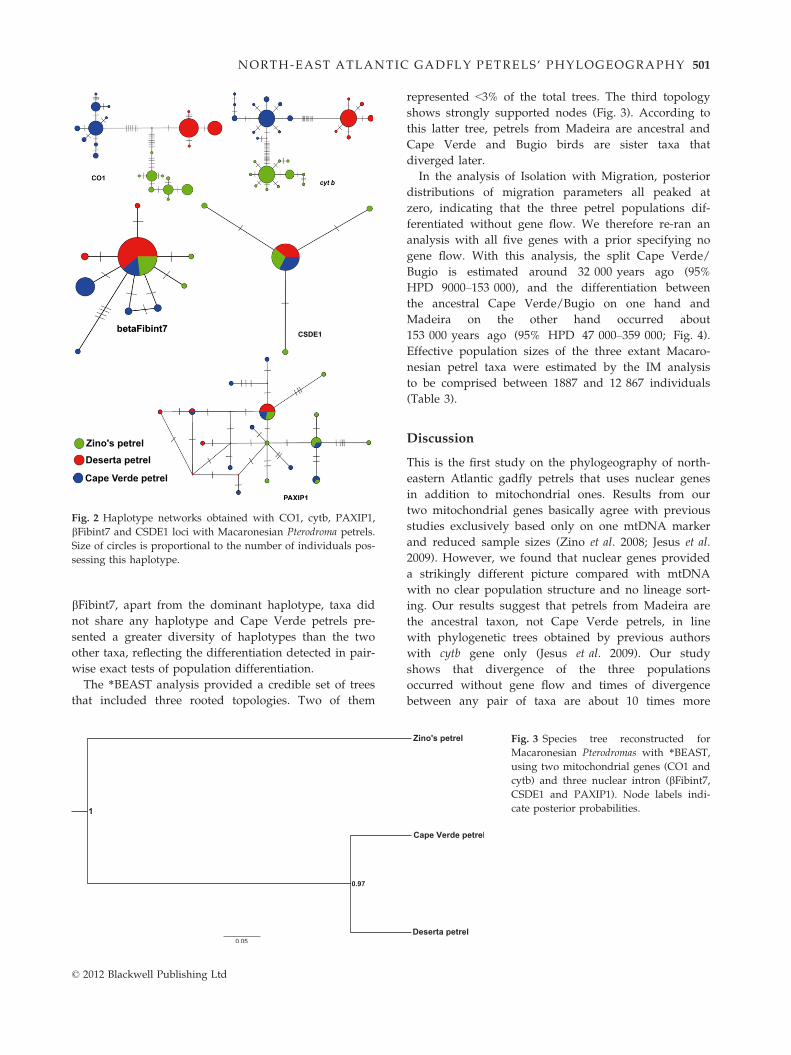
bFibint7, apart from the dominant haplotype, taxa did
not share any haplotype and Cape Verde petrels pre-
sented a greater diversity of haplotypes than the two
other taxa, reflecting the differentiation detected in pair-
wise exact tests of population differentiation.
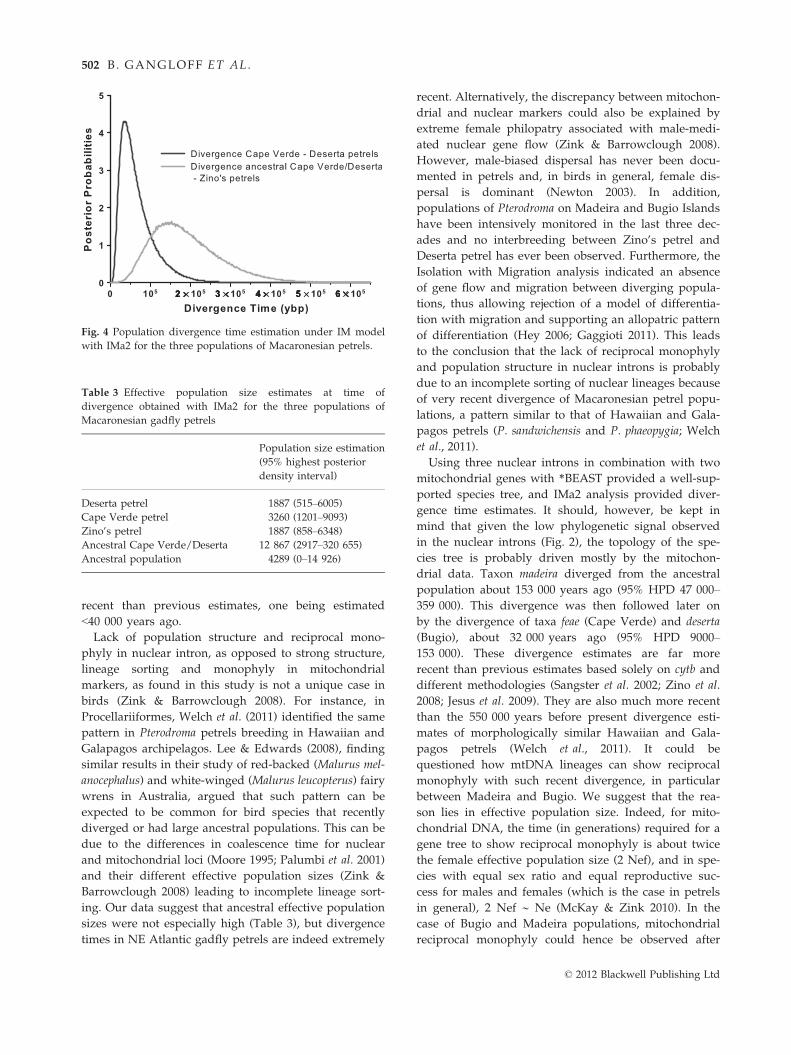
The *BEAST analysis provided a credible set of trees
that included three rooted topologies. Two of them
represented <3% of the total trees. The third topology
shows strongly supported nodes (Fig. 3). According to
this latter tree, petrels from Madeira are ancestral and
Cape Verde and Bugio birds are sister taxa that
diverged later.
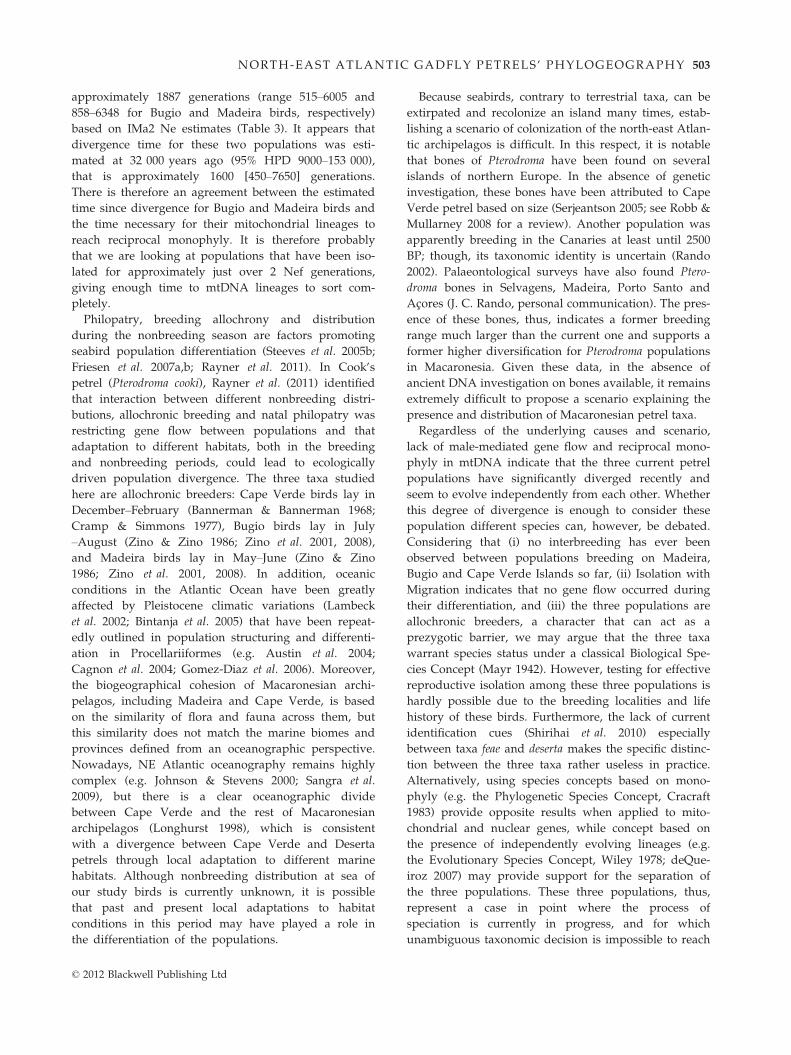
In the analysis of Isolation with Migration, posterior
distributions of migration parameters all peaked at
zero, indicating that the three petrel populations dif-
ferentiated without gene flow. We therefore re-ran an
analysis with all five genes with a prior specifying no
gene flow. With this analysis, the split Cape Verde/
Bugio is estimated around 32 000 years ago (95%
HPD 9000–153 000), and the differentiation between
the ancestral Cape Verde/Bugio on one hand and
Madeira on the other hand occurred about
153 000 years ago (95% HPD 47 000–359 000; Fig. 4).
Effective population sizes of the three extant Macaro-
nesian petrel taxa were estimated by the IM analysis
to be comprised between 1887 and 12 867 individuals
(Table 3).
Discussion
This is the first study on the phylogeography of north-
eastern Atlantic gadfly petrels that uses nuclear genes
in addition to mitochondrial ones. Results from our
two mitochondrial genes basically agree with previous
studies exclusively based only on one mtDNA marker
and reduced sample sizes (Zino et al. 2008; Jesus et al.
2009). However, we found that nuclear genes provided
a strikingly different picture compared with mtDNA
with no clear population structure and no lineage sort-
ing. Our results suggest that petrels from Madeira are
the ancestral taxon, not Cape Verde petrels, in line
with phylogenetic trees obtained by previous authors
with cytb gene only (Jesus et al. 2009). Our study
shows that divergence of the three populations
occurred without gene flow and times of divergence
between any pair of taxa are about 10 times more
Fig. 2 Haplotype networks obtained with CO1, cytb, PAXIP1,
bFibint7 and CSDE1 loci with Macaronesian Pterodroma petrels.
Size of circles is proportional to the number of individuals pos-
sessing this haplotype.
Fig. 3 Species tree reconstructed for
Macaronesian Pterodromas with *BEAST,
using two mitochondrial genes (CO1 and
cytb) and three nuclear intron (bFibint7,CSDE1 and PAXIP1). Node labels indi-
cate posterior probabilities.
© 2012 Blackwell Publishing Ltd
NORTH-EAST ATLANTIC GADFLY PETRELS’ PHYLOGEOGRAPHY 501
recent than previous estimates, one being estimated
<40 000 years ago.
Lack of population structure and reciprocal mono-
phyly in nuclear intron, as opposed to strong structure,
lineage sorting and monophyly in mitochondrial
markers, as found in this study is not a unique case in
birds (Zink & Barrowclough 2008). For instance, in
Procellariiformes, Welch et al. (2011) identified the same
pattern in Pterodroma petrels breeding in Hawaiian and
Galapagos archipelagos. Lee & Edwards (2008), finding
similar results in their study of red-backed (Malurus mel-
anocephalus) and white-winged (Malurus leucopterus) fairy
wrens in Australia, argued that such pattern can be
expected to be common for bird species that recently
diverged or had large ancestral populations. This can be
due to the differences in coalescence time for nuclear
and mitochondrial loci (Moore 1995; Palumbi et al. 2001)
and their different effective population sizes (Zink &
Barrowclough 2008) leading to incomplete lineage sort-
ing. Our data suggest that ancestral effective population
sizes were not especially high (Table 3), but divergence
times in NE Atlantic gadfly petrels are indeed extremely
recent. Alternatively, the discrepancy between mitochon-
drial and nuclear markers could also be explained by
extreme female philopatry associated with male-medi-
ated nuclear gene flow (Zink & Barrowclough 2008).
However, male-biased dispersal has never been docu-
mented in petrels and, in birds in general, female dis-
persal is dominant (Newton 2003). In addition,
populations of Pterodroma on Madeira and Bugio Islands
have been intensively monitored in the last three dec-
ades and no interbreeding between Zino’s petrel and
Deserta petrel has ever been observed. Furthermore, the
Isolation with Migration analysis indicated an absence
of gene flow and migration between diverging popula-
tions, thus allowing rejection of a model of differentia-
tion with migration and supporting an allopatric pattern
of differentiation (Hey 2006; Gaggioti 2011). This leads
to the conclusion that the lack of reciprocal monophyly
and population structure in nuclear introns is probably
due to an incomplete sorting of nuclear lineages because
of very recent divergence of Macaronesian petrel popu-
lations, a pattern similar to that of Hawaiian and Gala-
pagos petrels (P. sandwichensis and P. phaeopygia; Welch
et al., 2011).
Using three nuclear introns in combination with two
mitochondrial genes with *BEAST provided a well-sup-
ported species tree, and IMa2 analysis provided diver-
gence time estimates. It should, however, be kept in
mind that given the low phylogenetic signal observed
in the nuclear introns (Fig. 2), the topology of the spe-
cies tree is probably driven mostly by the mitochon-
drial data. Taxon madeira diverged from the ancestral
population about 153 000 years ago (95% HPD 47 000–
359 000). This divergence was then followed later on
by the divergence of taxa feae (Cape Verde) and deserta
(Bugio), about 32 000 years ago (95% HPD 9000–
153 000). These divergence estimates are far more
recent than previous estimates based solely on cytb and
different methodologies (Sangster et al. 2002; Zino et al.
2008; Jesus et al. 2009). They are also much more recent
than the 550 000 years before present divergence esti-
mates of morphologically similar Hawaiian and Gala-
pagos petrels (Welch et al., 2011). It could be
questioned how mtDNA lineages can show reciprocal
monophyly with such recent divergence, in particular
between Madeira and Bugio. We suggest that the rea-
son lies in effective population size. Indeed, for mito-
chondrial DNA, the time (in generations) required for a
gene tree to show reciprocal monophyly is about twice
the female effective population size (2 Nef), and in spe-
cies with equal sex ratio and equal reproductive suc-
cess for males and females (which is the case in petrels
in general), 2 Nef ∼ Ne (McKay & Zink 2010). In the
case of Bugio and Madeira populations, mitochondrial
reciprocal monophyly could hence be observed after
Fig. 4 Population divergence time estimation under IM model
with IMa2 for the three populations of Macaronesian petrels.
Table 3 Effective population size estimates at time of
divergence obtained with IMa2 for the three populations of
Macaronesian gadfly petrels
Population size estimation
(95% highest posterior
density interval)
Deserta petrel 1887 (515–6005)Cape Verde petrel 3260 (1201–9093)
Zino’s petrel 1887 (858–6348)Ancestral Cape Verde/Deserta 12 867 (2917–320 655)
Ancestral population 4289 (0–14 926)
© 2012 Blackwell Publishing Ltd
502 B. GANGLOFF ET AL.
approximately 1887 generations (range 515–6005 and
858–6348 for Bugio and Madeira birds, respectively)
based on IMa2 Ne estimates (Table 3). It appears that
divergence time for these two populations was esti-
mated at 32 000 years ago (95% HPD 9000–153 000),
that is approximately 1600 [450–7650] generations.
There is therefore an agreement between the estimated
time since divergence for Bugio and Madeira birds and
the time necessary for their mitochondrial lineages to
reach reciprocal monophyly. It is therefore probably
that we are looking at populations that have been iso-
lated for approximately just over 2 Nef generations,
giving enough time to mtDNA lineages to sort com-
pletely.
Philopatry, breeding allochrony and distribution
during the nonbreeding season are factors promoting
seabird population differentiation (Steeves et al. 2005b;
Friesen et al. 2007a,b; Rayner et al. 2011). In Cook’s
petrel (Pterodroma cooki), Rayner et al. (2011) identified
that interaction between different nonbreeding distri-
butions, allochronic breeding and natal philopatry was
restricting gene flow between populations and that
adaptation to different habitats, both in the breeding
and nonbreeding periods, could lead to ecologically
driven population divergence. The three taxa studied
here are allochronic breeders: Cape Verde birds lay in
December–February (Bannerman & Bannerman 1968;
Cramp & Simmons 1977), Bugio birds lay in July
–August (Zino & Zino 1986; Zino et al. 2001, 2008),
and Madeira birds lay in May–June (Zino & Zino
1986; Zino et al. 2001, 2008). In addition, oceanic
conditions in the Atlantic Ocean have been greatly
affected by Pleistocene climatic variations (Lambeck
et al. 2002; Bintanja et al. 2005) that have been repeat-
edly outlined in population structuring and differenti-
ation in Procellariiformes (e.g. Austin et al. 2004;
Cagnon et al. 2004; Gomez-Diaz et al. 2006). Moreover,
the biogeographical cohesion of Macaronesian archi-
pelagos, including Madeira and Cape Verde, is based
on the similarity of flora and fauna across them, but
this similarity does not match the marine biomes and
provinces defined from an oceanographic perspective.
Nowadays, NE Atlantic oceanography remains highly
complex (e.g. Johnson & Stevens 2000; Sangra et al.
2009), but there is a clear oceanographic divide
between Cape Verde and the rest of Macaronesian
archipelagos (Longhurst 1998), which is consistent
with a divergence between Cape Verde and Deserta
petrels through local adaptation to different marine
habitats. Although nonbreeding distribution at sea of
our study birds is currently unknown, it is possible
that past and present local adaptations to habitat
conditions in this period may have played a role in
the differentiation of the populations.
Because seabirds, contrary to terrestrial taxa, can be
extirpated and recolonize an island many times, estab-
lishing a scenario of colonization of the north-east Atlan-
tic archipelagos is difficult. In this respect, it is notable
that bones of Pterodroma have been found on several
islands of northern Europe. In the absence of genetic
investigation, these bones have been attributed to Cape
Verde petrel based on size (Serjeantson 2005; see Robb &
Mullarney 2008 for a review). Another population was
apparently breeding in the Canaries at least until 2500
BP; though, its taxonomic identity is uncertain (Rando
2002). Palaeontological surveys have also found Ptero-
droma bones in Selvagens, Madeira, Porto Santo and
Acores (J. C. Rando, personal communication). The pres-
ence of these bones, thus, indicates a former breeding
range much larger than the current one and supports a
former higher diversification for Pterodroma populations
in Macaronesia. Given these data, in the absence of
ancient DNA investigation on bones available, it remains
extremely difficult to propose a scenario explaining the
presence and distribution of Macaronesian petrel taxa.
Regardless of the underlying causes and scenario,
lack of male-mediated gene flow and reciprocal mono-
phyly in mtDNA indicate that the three current petrel
populations have significantly diverged recently and
seem to evolve independently from each other. Whether
this degree of divergence is enough to consider these
population different species can, however, be debated.
Considering that (i) no interbreeding has ever been
observed between populations breeding on Madeira,
Bugio and Cape Verde Islands so far, (ii) Isolation with
Migration indicates that no gene flow occurred during
their differentiation, and (iii) the three populations are
allochronic breeders, a character that can act as a
prezygotic barrier, we may argue that the three taxa
warrant species status under a classical Biological Spe-
cies Concept (Mayr 1942). However, testing for effective
reproductive isolation among these three populations is
hardly possible due to the breeding localities and life
history of these birds. Furthermore, the lack of current
identification cues (Shirihai et al. 2010) especially
between taxa feae and deserta makes the specific distinc-
tion between the three taxa rather useless in practice.
Alternatively, using species concepts based on mono-
phyly (e.g. the Phylogenetic Species Concept, Cracraft
1983) provide opposite results when applied to mito-
chondrial and nuclear genes, while concept based on
the presence of independently evolving lineages (e.g.
the Evolutionary Species Concept, Wiley 1978; deQue-
iroz 2007) may provide support for the separation of
the three populations. These three populations, thus,
represent a case in point where the process of
speciation is currently in progress, and for which
unambiguous taxonomic decision is impossible to reach
© 2012 Blackwell Publishing Ltd
NORTH-EAST ATLANTIC GADFLY PETRELS’ PHYLOGEOGRAPHY 503

and will depend on species concept (i.e. which charac-
ter is prioritized). We can, however, state that (i) evolu-
tionary lineages are reciprocally monophyletic for one
class of genes but not for another (nuclear genes),
because time of divergence is too short; (ii) there is no
gene flow since divergence started, this being probably
reinforced by geographical (distribution of breeding col-
onies and, to some extent, distribution at sea) as well as
temporal isolation (in breeding phenology); (iii) diver-
gence did not lead (yet) to morphological or behaviour-
al divergence and (iv) taxa madeira and deserta are more
divergent than taxa deserta and feae.
Acknowledgements
We would like to thank the late Annie Tillier from the Service
de Systematique Moleculaire (MNHN, Paris) for her help dur-
ing the laboratory work. IM analyses were run on the cluster
of the National Museum of Natural History in Paris (MNHN),
and we are very grateful for the help provided there by Julio
Pedraza. We also wish to thank Elena Gomez-Dıaz, Juan Carlos
Rando and three anonymous referees who made insightful
comments to improve the manuscript. This work was sup-
ported by the ‘Consortium National de Recherche en Genomi-
que’, the ‘Service de Systematique Moleculaire’ of the Museum
National d’Histoire Naturelle in Paris (CNRS UMS 2700) and
the Ministerio de Ciencia e Innovacion from Spain and Fondos
FEDER (CGL2009-11278/BOS). It is part of the agreement no.
2005/67 between the Genoscope and the Museum National
d’Histoire Naturelle on the project ‘Macrophylogeny of life’
directed by Guillaume Lecointre. We would also like to thank
the authorities of Parque Natural da Madeira (PNM), Min-
isterio do Ambiente (Cabo Verde) and Parque Natural do Fogo
(PNF) for permission to work within the protected areas at
Pico do Areeiro, Desertas and PNF. We would like to thank
the PNM’s expert climbers for assistance when working on the
breeding ledges of Zino’s petrel. Many thanks also to the team
from the FCP for assistance in netting at night, to the Portu-
guese Air Force for their generous transport on and off Bugio,
and to the crews of the EH101 Merlin helicopters who carried
out the transport and the staff of the Natural History Museum
of Funchal, who accompanied us to Bugio, provided most
valuable logistical help and organization. Thanks to the PNM
wardens who helped us on Bugio. Finally, thanks to Elizabeth
Zino, always present at Areeiro and on Bugio to take notes
and provide us all with meals on Bugio.
References
Abbott C, Double M (2003) Phylogeography of Shy and White-
capped Albatrosses inferred from mitochondrial DNA
sequences: implications for population history and taxon-
omy. Molecular Ecology, 12, 2747–2758.
Austin JJ (1996) Molecular phylogenetics of Puffinus shearwa-
ters: preliminary evidence from mitochondrial cytochrome b
gene sequences. Molecular Phylogenetics and Evolution, 6, 77–88.Austin JJ, Bretagnolle V, Pasquet E (2004) A global molecular
phylogeny of the small Puffinus shearwaters and implications
for systematics of the Little-Audubon’s shearwater complex.
The Auk, 121, 847–864.Avise JC, Arnold J, Ball RM, et al. (1987) Intraspecific phyloge-
ography: the mitochondrial DNA bridge between population
genetics and systematics. Annual Review of Ecology and
Systematics, 18, 489–522.Axelsson E, Smith NGC, Sundstrom H, Berlin S, Ellegren H
(2004) Male-biased mutation rate and divergence in autoso-
mal, Z-linked and W-linked introns of chicken and turkey.
Molecular Biology and Evolution, 21, 1538–1547.Bandlet HJ, Forster P, Rohl A (1999) Median-joining networks
for inferring intraspecific phylogenies. Molecular Biology and
Evolution, 16, 37–48.
Bannerman DA, Bannerman WM (1968) History of the Birds of
the Cape Verde Islands. Birds of the Atlantic Islands, Vol. IV.
Oliver and Boyd, Edinburgh.
Bazin E, Glemin S, Galtier N (2006) Population size does not
influence mitochondrial genetic diversity in animals. Science,
312, 570–572.
Bintanja R, Van de Wal RSW, Oerlemans J (2005) Modelled
atmospheric temperatures and global sea levels over the past
million years. Nature, 437, 125–128.BirdLife International (2012) IUCN Red List for birds. Avail-
able at: http://www.birdlife.org (accessed 27 August 2012).
Bolton M, Smith AL, Gomez-Diaz E et al. (2008) Monteiro’s
storm petrel Oceanodroma monteiroi: a new species from the
Azores. Ibis, 150, 717–727.
Bourne W (1983) The Soft-plumaged petrel, the Gongon and
the Freira, Pterodroma mollis, P. feae and P. madeira. Bulletin of
the British Ornithologist Club, 103, 52–58.
Bretagnolle V (1995) Systematics of the Soft-plumaged Petrel
Pterodroma mollis complex: new insight from vocalizations.
Ibis, 137, 207–218.Bretagnolle V (1996) Acoustic communication in a group of
non-passerine birds, the petrels. In: Ecology and Evolution of
Acoustic Communication in Birds (eds Kroodsma DE, Miller
EH), pp. 230. Cornell University Press, Ithaca, New York,
USA.
Brooke M (2004) Albatrosses and Petrels across the World. Oxford
University Press, Oxford, UK.
de Brooke ML, O’Connell TC, Wingate D, Madeiros J, Hilton
GM, Ratcliffe N (2010) Potential for rat predation to cause
decline of the globally threatened Henderson petrel Ptero-
droma atrata: evidence from the field, stable isotopes and
population modelling. Endangered Species Research, 11, 47–59.Burg T, Croxall JP (2004) Global population structure and
taxonomy of the Wandering Albatross species complex.
Molecular Ecology, 13, 2345–2355.
Cagnon C, Lauga B, Hemery G, Mouches C (2004) Phylogeo-
graphic differentiation of storm-petrels (Hydrobates pelagicus)
based on cytochrome b mitochondrial DNA variation. Marine
Biology, 145, 1247–1254.
Chan KMA, Levin SA (2005) Leaky prezygotic isolation and
porous genomes: rapid introgression of maternally inherited
DNA. Evolution, 59, 720–729.CodonCode Corporation 2009 Codoncode Aligner [3.0.3]. Com-
puter program. CodonCode Corporation Dedham, MA, USA.
Cracraft J (1983) ‘Species concepts and speciation analysis’.
Current Ornithology, 1, 159–187.Cramp S, Simmons KEL (eds) (1977) The Birds of the Western
Palearctic, Vol. 1. Oxford University Press, Oxford, UK.
© 2012 Blackwell Publishing Ltd
504 B. GANGLOFF ET AL.
Cuthbert R (2004) Breeding biology of the Atlantic petrel, Ptero-
droma incerta, and a population estimate of this and other
burrowing petrels on Gough Island, South Atlantic Ocean.
Emu, 104, 221–228.Degnan JH, Rosenberg NA (2009) Gene tree discordance, phy-
logenetic inference and the multispecies coalescent. Trends in
Ecology and Evolution, 24, 332–340.
Drummond AJ, Rambaut A (2007) BEAST: Bayesian evolution-
ary analysis by sampling trees. BMC Evolutionary Biology, 7,
214–221.Edwards SV, Bensch S (2009) Looking forwards or looking
backwards in avian phylogeography? A comment on Zink
and Barrowclough 2008. Molecular Ecology, 18, 2930–2933.
Edwards SV, Kingan SB, Calkins JD et al. (2005) Speciation in
birds: genes, geography and sexual selection. Proceedings of
the National Academy of Science of the United States of America,
102, 6550–6557.
Excoffier L, Lischer HEL (2010) Arlequin suite ver 3.5: a new
series of programs to perform population genetics analyses
under Linux and Windows. Molecular Ecology Resources, 10,
564–567.
Felsenstein J (2006) Accuracy of coalescent likelihood estimates:
do we need more sites, more sequences, or more loci? Molec-
ular Biology and Evolution, 23, 691–700.Forister ML, Nice CC, Fordyce JA, Gompert Z, Shapiro AM
(2008) Considering evolutionary processes in the use of
single-locus genetic data for conservation, with examples
from the Lepidoptera. Journal of Insect Conservation, 12,
37–51.Friesen VL (2007) New roles for molecular genetics in under-
standing seabird evolution, ecology and conservation. Marine
Ornithology, 35, 89–96.
Friesen VL, Gonzalez JA, Cruz-Delgado F (2006) Popula-
tion genetic structure and conservation of the Galapagos
petrel (Pterodroma phaeopygia). Conservation Genetics, 7, 107–115.
Friesen VL, Burg TM, McCoy KD (2007a) Mechanisms of
population differentiation in seabirds. Molecular Ecology, 16,
1765–1785.Friesen VL, Smith AL, Gomez-Dıaz E et al. (2007b) Sympatric
speciation by allochrony in a seabird. Proceedings of the
National Academy of Science of the United States of America, 104,
18589–18594.Funk DJ, Omland KE (2003) Species-level paraphyly and poly-
phyly: frequency, causes, and consequences, with insights
from animal mitochondrial DNA. Annual Review of Ecology,
Evolution, and Systematics, 34, 397–423.Gaggioti OE (2011) Making inference about speciation using
sophisticated statistical genetics methods: look before you
leap. Molecular Ecology, 20, 2229–2232.
Gangloff B, Shirihai H, Watling D et al. (2012) The complete
phylogeny of Pseudobulweria, the most endangered seabird
genus: systematics, species status and conservation implica-
tions. Conservation Genetics, 13, 39–52.
Gomez-Diaz E, Gonzales-Solis J, Peinado MA, Page RDM
(2006) Phylogeography of the Calonectris shearwaters using
molecular and morphometric data. Molecular Phylogenetics
and Evolution, 41, 322–332.
Guindon S, Gascuel O (2003) A simple, fast and accurate
method to estimate large phylogenies by maximum-likeli-
hood’. Systematic Biology, 52, 696–704.
Hailer F, Schreiber EA, Miller JM et al. (2011) Long-term isola-
tion of a highly mobile seabird on the Galapagos. Proceedings
of the Royal Society B, 278, 817–825.
Heled J, Drummond AJ (2010) Bayesian inference of species
trees from multilocus data. Molecular Biology and Evolution,
27, 570–580.Hey J (2006) Recent advances in assessing gene flow between
diverging populations and species. Current Opinions in Genet-
ics & Development, 16, 592–596.
Hey J (2010) Isolation with migration model for more than two
populations. Molecular Biology and Evolution, 27, 905–920.
Hey J, Nielsen R (2007) Integration within the Felsenstein equa-
tion for improved Markov chain Monte Carlo methods in
population genetics. Proceedings of the National Academy of
Science of the United States of America, 104, 2785–2790.
Hudson RR, Kaplan NL (1985) Statistical properties of the
number of recombination events in the history of a sample
of DNA sequences. Genetics, 111, 147–164.Jesus J, Menezes D, Gomes S, Oliveira P, Nogales M, Brehm A
(2009) Phylogenetic relationships of gadfly petrels Pterodroma
spp. from the Northeastern Atlantic Ocean: molecular evi-
dence for specific status of Bugio and Cape Verde petrels
and implications for conservation. Bird Conservation Interna-
tional, 19, 1–16.Johnson J, Stevens I (2000) A fine resolution model of the East-
ern North Atlantic between the Azores, the Canarys and the
Gibraltar Strait. Deep-Sea Research I, 47, 875–899.
Kimball RT, et al. (2009) A well-tested set of primers to amplify
regions spread across the avian genome. Molecular Phyloge-
netics and Evolution, 50, 654–660.
Kuhner MK (2009) Coalescent genealogy samplers: windows
into population history. Trends in Ecology and Evolution, 24,
86–93.Lambeck K, Esat TM, Potter E-K (2002) Links between climate
and sea levels for the last three millions years. Nature, 419,
199–206.
Lande R, Engen S, Sæther B-E (2003) Stochastic Population
Dynamics in Ecology and Conservation. Oxford University
Press, Oxford.
Lee JY, Edwards SV (2008) Divergence across Australia’s Car-
pentarian barrier: statistical phylogeography of the Red-
backed Fairy Wren (Malurus melanocephalus). Evolution, 62,
3117–3134.Librado P, Rozas J (2009) DnaSP v5: a software for comprehen-
sive analysis of DNA polymorphism data. Bioinformatics, 25,
1451–1452.
Longhurst A (1998) Ecological Geography of the Sea. Academic
Press, San Diego, CA.
Mayr E (1942) Systematics and the Origin of Species. Columbia
University Press, New York.
McKay BD, Zink RM (2010) The causes of mitochondrial DNA
gene tree paraphyly in birds. Molecular Phylogenetics and Evo-
lution, 54, 647–650.Moore WS (1995) Inferring phylogenies from mtDNA variation:
mitochondrial-gene trees versus nuclear-gene trees. Evolution,
49, 718–726.
Newton I (2003). The Speciation and Biogeography of Birds.
Academic Press, San Diego, CA, USA.
Palumbi SR, Cipriano F, Hare MP (2001) Predicting nuclear
gene coalescence from mitochondrial data: the three-times
rule. Evolution, 55, 859–868.
© 2012 Blackwell Publishing Ltd
NORTH-EAST ATLANTIC GADFLY PETRELS’ PHYLOGEOGRAPHY 505

Pereira SL, Baker AJ (2006) A mitogenomic timescale for birds
detects variable phylogenetic rates of molecular evolution
and refutes the standard molecular clock. Molecular Biology
and Evolution, 23, 1731–1740.Posada D (2008) jModelTest: phylogenetic Model Averaging.
Molecular Biology and Evolution, 25, 1253–1256.Posada D, Crandall KA (2001) Intraspecific phylogenetics:
trees grafting into networks. Trends in Ecology and Evolution,
16, 37–45.
Price TD (2008) Speciation in Birds. Roberts & Company Pub-
lishers, Greenwood village, Colorado, USA.
Prychitko TM, Moore WS (1997) The utility of DNA sequences
of an intron from the b-fibrinogen gene in phylogenetic anal-
ysis of woodpeckers (Aves: Picidae). Molecular Phylogenetics
and Evolution, 8, 193–204.
deQueiroz K (2007) Species concepts and species delimitations.
Systematic Biology, 56, 879–886.
Rando JC (2002) New data of fossil birds from El Hierro (Can-
ary Islands): probable causes of extinction and some biogeo-
graphical considerations. Ardeola, 49, 39–49.Raymond M, Rousset F (1995) An exact test for population dif-
ferentiation. Evolution, 49, 1280–1283.Rayner MJ, Hauber ME, Steeves TE, et al. (2011) Contemporary
and historical separation of transequatorial migration
between genetically distinct seabird populations. Nature Com-
munication, 2, doi:10.1038/ncomms1330
Robb M, Mullarney K (2008) Petrels Night and Day. Sound
Approach, Dorset, UK.
Saether B-E, Engen S, Møller AP, et al. (2004) Life-history
variation predicts the effects of demographic stochasticity
on avian population dynamics. The American Naturalist, 164,
793–802.
Sangra P, Pascual A, Rodriguez-Santana A, et al. (2009) The
Canary Eddy Corridor: a major pathway for long-lived
eddies in the subtropical North Atlantic. Deep-Sea Research I,
56, 2100–2114.
Sangster G, Knox AG, Helbig AJ, Parkin DT (2002) Taxonomic
recommendations for European birds. Ibis, 144, 153–159.
Serjeantson D (2005) Archaeological records of a gadfly petrel
Pterodroma sp. from Scotland in the first millennium AD.
In: Feathers, grit and symbolism; Birds and humans in the ancient
Old and New Worlds. Proceedings of the 5th meeting of the
ICAZ bird working group in Munich (26.7.-28.7.2004), (eds
Grupe S, Peters S), pp. 235–246. Verlag Marie Leidorf GmbH,
Germany.
Shaw KL (2002) Conflict between nuclear and mitochondrial
phylogenies of a recent species radiation: what mtDNA
reveals and conceals about modes of speciation in Hawaiian
crickets. Proceedings of the National Academy of Science of the
United States of America, 99, 16122–16127.
Shirihai H, Bretagnolle V, Zino F (2010) Identification of
Feae’s, Desertas and Zino’s petrels at sea. Birding World, 23,
239–275.Simons TR (1984) A population model of the endangered
Hawaiian dark-rumped petrel. Journal of Wildlife Management,
48, 1065–1076.
Smith AL, Friesen VL (2007) Differentiation of sympatric popu-
lations of the band-rumped storm petrel in the Galapagos
Islands: an examination of genetics, morphology and vocal-
izations. Molecular Ecology, 16, 1593–1603.Sorenson MD, Quinn TW (1998) Numts: a challenge for
avian systematics and population biology. Auk, 115, 214–221.
Spinks PQ, Shaffer HG (2009) Conflicting Mitochondrial and
Nuclear Phylogenies for the Widely Disjunct Emys (Testu-
dines: Emydidae) Species Complex, and What They Tell Us
about Biogeography and Hybridization. Systematic Biology,
58, 1–20.Steeves TE, Anderson DJ, McNally H, Kim MH, Friesen VL
(2003) Phylogeography of Sula: the role of physical barriers
to gene flow in the diversification of tropical seabirds. Journal
of Avian Biology, 34, 217–223.Steeves TE, Anderson DJ, Friesen VL (2005a) The Isthmus of
Panama: a major physical barrier to gene flow in a highly
mobile pantropical seabird. Journal of Evolutionary Biology, 18,
1000–1008.Steeves TE, Anderson DJ, Friesen VL (2005b) A role for non
physical barriers to gene flow in the diversification of a very
vagile seabird, the masked booby (Sula dactylatra). Molecular
Ecology, 14, 3877–3887.Stephens M, Smith N, Donnelly P (2001) A new statistical
method for haplotype reconstruction from population data.
American Journal of Human Genetics, 68, 978–989.
Tamura K, Dudley J, Nei M, Kumar S (2007) MEGA4:
Molecular Evolutionary Genetics Analysis (MEGA) Soft-
ware Version 4.0. Molecular Biology and Evolution, 24, 1596–
1599.
Thompson JD, Higgins DG, Gibson TJ (1994) CLUSTAL W:
improving the sensitivity of progressive multiple sequence
alignment through sequence weighting, position-specific gap
penalties and weight matrix choice. Nucleic Acids Research,
22, 4673–4680.
Warham J (1990) The Petrels: Their ecology and breeding systems.
Academic Press, London.
Weir JT, Schluter D (2008) Calibrating the avian molecular
clock. Molecular Ecology, 17, 2321–2328.
Welch AJ, Yoshida AA, Fleischer RC (2011) Mitochondrial and
nuclear DNA sequences reveal recent divergence in morpho-
logically indistinguishable petrels. Molecular Ecology, 20, 1364
–1377.
Wiley EO (1978) The evolutionary species concept reconsid-
ered. Systematic Biology, 27, 17–26.
Wright S (1931) Evolution in Mendelian populations. Genetics,
16, 97–159.
Zink RM, Barrowclough GF (2008) Mitochondrial DNA under
siege in avian phylogeography. Molecular Ecology, 17, 2107–
2121.
Zino PA, Zino F (1986) Contribution to the study of the petrels
of the genus Pterodroma in the archipelago of Madeira. Bolle-
tim do Museu Municipal do Funchal, 38, 141–165.
Zino F, Oliveira P, King S et al. (2001) Conservation of Zino’s
petrel Pterodroma madeira in the archipelago of Madeira.
Oryx, 35, 128–135.Zino F, Brown R, Biscoito M (2008) The separation of Ptero-
droma madeira (Zino’s petrel) from Pterodroma feae (Feae’s pet-
rel) (Aves: Procellariidae). Ibis, 150, 326–334.
© 2012 Blackwell Publishing Ltd
506 B. GANGLOFF ET AL.
This work was part of B.G. PhD research under the supervi-
sion of V.B.B.G. and V.B. designed the research. V.B., F.Z. and
J.G.-S provided samples. B.G. extracted and amplified DNA.
A.C. sequenced the DNA. B.G. conducted all analyses and
wrote the manuscript and all authors discussed the results and
contributed to the manuscript.
Data accessibility
DNA sequences are available on GenBank under
accession numbers: JX 674073 to JX 674826. GenBank
accession numbers for all sequenced individuals
uploaded as online Table S1 (Supporting information).
Supporting information
Additional supporting information may be found in the online ver-
sion of this article.
Table S1 GenBank accession numbers for all the sequenced
individuals.
© 2012 Blackwell Publishing Ltd
NORTH-EAST ATLANTIC GADFLY PETRELS’ PHYLOGEOGRAPHY 507