the evolution of retirement: an american economic history, · of economic research volume title:...
TRANSCRIPT
This PDF is a selection from an out-of-print volume from the National Bureauof Economic Research
Volume Title: The Evolution of Retirement: An American Economic History,1880-1990
Volume Author/Editor: Dora L. Costa
Volume Publisher: University of Chicago Press
Volume ISBN: 0-226-11608-5
Volume URL: http://www.nber.org/books/cost98-1
Publication Date: January 1998
Chapter Title: The Evolution of Retirement
Chapter Author: Dora L. Costa
Chapter URL: http://www.nber.org/chapters/c6108
Chapter pages in book: (p. 6 - 31)
2 The Evolution of Retirement
The past is but the beginning of a beginning, and all that is and has been is but the twilight of the dawn.
H. G. Wells (1901)
The rise of retirement began, not with Medicare or the beginning of Social Security, but more than a century ago. In 1880 the majority of men older than sixty-four toiled in the labor force. That proportion fell steadily and continu- ously, and today men older than sixty-four in the labor force are in the minority. More recently, participation rates among younger men, those aged fifty-five to sixty-four, have been falling as well. At the same time that the age of retirement has fallen, life expectancy has risen, and the average number of years spent in retirement has increased. If present trends continue, those aged twenty today can expect to spend up to a third of their lives in retirement (Lee 1996).
The rise of retirement was already documented by the social reformers of the 1920s and 1930s (e.g., U.S. Committee on Economic Security 1935) and is familiar to many researchers. These researchers generally agree on the trend in retirement rates but disagree on explanations, citing both factors that have enticed men out of the labor force, such as the growth of Social Security, pri- vate pension plans, and income, and factors that have driven them out, such as sectoral shifts in the composition of the labor force, poor job opportunities, and ill health. In this chapter I first reexamine trends in the retirement of older men by individual characteristics (e.g., age, foreign birth, race, and residence) to provide insight into the rise of retirement. I then review explanations, ending with a discussion of how for many individuals retirement has evolved to be- come a recreation-filled life stage.
2.1 Retirement Trends
The term retirement generally connotes a complete and permanent with- drawal from paid labor, and entering retirement is often thought of as an abrupt change in the life of an elderly person. This conception of retirement accu- rately reflects the experience of most men today. Although some men do switch
6

7 The Evolution of Retirement
to part-time work at the end of their careers (Fuchs 1982; Ruhm 1990), about 75 percent of all retirement sequences today are transitions from a full-time job to being out of the labor force (Rust 1990). But we cannot be certain that defining retirement as a departure from paid labor, regardless of the number of hours worked, captures the meaning that the term had in the past. In the past men may have been more likely to phase work out of their lives slowly. Histori- ans of New England colonial economies found that older property owners re- mained closely involved in farming or preindustrial enterprises, supervising the family members and others who provided the labor supply (e.g., Fischer 1977). The continued importance of farming and of artisanal enterprises to the American economy may have allowed owners to reduce hours of work and continue to operate their enterprises with the help of family members and hired labor. Nonetheless, the labor force participation rate is perhaps the best simple indicator of economic activity by the elderly.
Readily calculated from census data, the labor force participation rate states whether the elderly as a group are more likely to be consumers than producers. Although changing definitions of labor force attachment obscure its precise meaning, most historical work is based on the concept of “gainful” employ- ment. This construct measures the proportion of individuals who claim to have had an occupation in the year before the census was taken. The current defini- tion of labor force, initiated in 1940, depends, not on whether an individual had an occupation, but instead on whether an individual either worked for pay or sought employment during the survey week.
It is still possible to construct a consistent series of labor force participation rates on the basis of the construct gainful employment because one of the new questions that the census enumerators began to ask in 1940 was about employ- ment and occupation in the past year. Participation rates can therefore be calcu- lated for anyone who claimed to have had an occupation in the past year. Moen (1987) used this procedure to construct a labor force participation series for men aged sixty-five and over from 1860 to 1980, and I extend his series back- ward to 1850 and forward to 1990. I also calculate a labor force participation series for men aged fifty-five to sixty-four for every year in which machine- readable census samples are available. Figure 2.1 shows that, among men older than sixty-four, participation rates fell steadily, from 78 percent in 1880 to 65 percent in 1900. By 1930 the figure had dropped to 58 percent andin 1990 to less than 20 percent. Among men aged fifty-five to sixty-four the decline from a peak of 95 percent in 1880 was somewhat less precipitous, falling to 82 percent in 1940 and 67 percent in 1990. Although the series based on the con- cept of gainful employment yields participation rates that are somewhat higher than those calculated under the current definition, both series exhibit the same patterns.
Questions have been raised about the estimation of labor force participation rates prior to 1940. Directions to the enumerators were often ambiguous and are open to different interpretations. Ransom and Sutch (1986) presented esti-

8 Chapter2
100
Y m a 80 C 2 70 -
6 0 -
2 50-
(0 40 -
Y
d
4- L
n
Age 65t Current Oefin i t ion '
m o _J ' O I 185018601870188018901900191019201930194019501960197019801990
Year
Labor force participation rates of men aged sixty-five or over and of Fig. 2.1 men aged fifty-five to sixty-four Nore: The series for men aged sixty-five or over calculated under the concept of gainful employ- ment is Moen's (1987) series extended backward to 1850 and forward to 1990 using the integrated public-use census samples (Ruggles and Sobek 1995). The series for men aged sixty-five or over based on the current definition of the labor force is from Series D 29-41 in U.S. Bureau of the Census (1975, 132) and from table 622 in U.S. Bureau of the Census (1993). The series for men aged fifty-five to sixty-four were estimated from the integrated public-use census samples (Rug- gles and Sobek 1995).
mates of labor force participation rates for men aged sixty or older for the period 1870-1900 that show no decline in male labor force participation rates until the institution of Social Security in 1935. Their estimates hinge on the argument that men who reported six or more months of unemployment in 1900 were retired and have been mistakenly classified as labor force participants. This view has been rejected by a statistical comparison of the characteristics of the retired with those of older men who reported six or more months of unemployment (Margo 1993), implying that the series presented in figure 2.1 accurately portray changes in the economic role of the elderly.
The United States was not the only country to experience declining labor force participation rates of men older than sixty-four since the end of the nine- teenth century. Figure 2.2 shows that the U.S., British, French, and German series all follow the same long-term trend. Although the definition of the labor force also changed in Europe, the British series was compiled under a consis- tent definition because the British continued to collect data under both old and new definitions. The early participation rates in the French series were reestimated using the contemporary definition. The German series, estimated neither under a consistent definition nor for a consistent age group, provides a rougher indication of the true trend but nonetheless exhibits the same pattern. Among men aged fifty to sixty-four, the trends in the United States, Britain, France, and Germany are similar as well, evincing a marked decline after 1970 (see Johnson and Falkingham 1992, 90-91). The similarities in these series

9 The Evolution of Retirement
3 80 , United States
-
a, 75 70
I? 65 C 60
m 50
z 40 35
a 30 25
LL 15
; 55 ; 45
& 20
L 10 0 5 0
5 0
1 Great Britain\\\
I
185016601870188016901900191019201930194019501960197019801990 1 / 1 1 1 1 1 1 1 1 1 1 1
Year
Fig. 2.2 Labor force participation rates of men aged sixty-five and over, 1850-1990, United States, Britain, France, and Germany Note: Participation rates for the United States are from Moen (1987) extended backward to 1850 and forward to 1990 using the integrated public-use census samples (Ruggles and Sobek 1995). Participation rates for Great Britain are from Matthews, Feinstein, and Odling-Smee (1982). and those for France are from Marchand (1991). Those for Germany for 1925 and later are from Ja- cobs, Kohli, and Rein (1991). German participation rates for 1882, 1895, and 1907 are Conrad’s (1990) estimates based on participation rates for men aged sixty to sixty-nine and seventy or older.
suggest that an analysis of the factors that fostered high retirement rates in the United States can explain, not just the rise of American retirement, but also that of European.
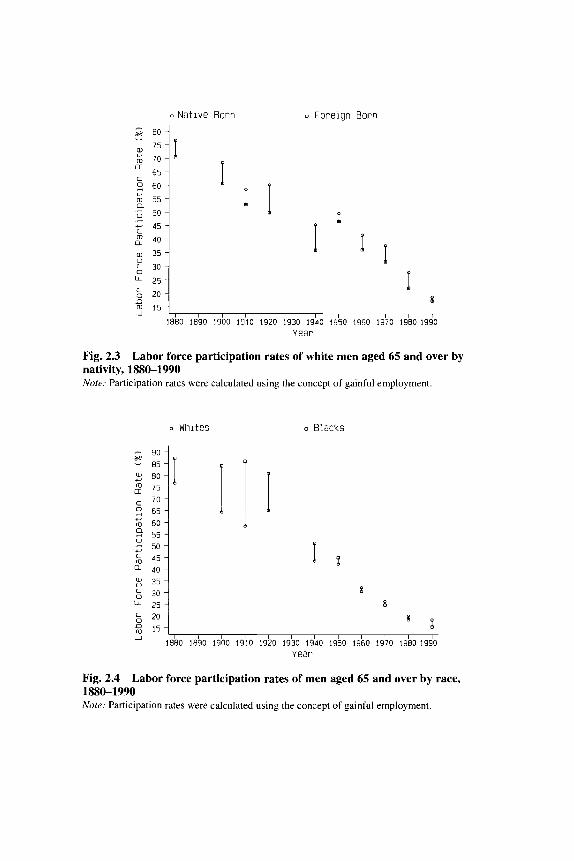
Labor force participation rates fell for Americans of all backgrounds. Al- though participation rates have always been higher among native-born whites compared to the foreign born, participation rates have fallen for both groups (see fig. 2.3). As seen in figure 2.4, black participation rates have fallen as well, with an especially sharp decline since 1920. Black men had much higher participation rates than white men from 1880 to 1950. The lifetime earnings of black men were much lower than those of whites, and they therefore would not have been able to save much money for their retirement. When the gap between white and black earnings began to narrow sharply after 1940, differ- ences in participation rates at older ages narrowed as well. By 1960 white participation rates began to exceed those of black men, perhaps because the earnings opportunities of black men relative to Social Security retirement or disability payments were lower than those of whites.
2.2 The Timing of Retirement
Age sixty-five now marks the beginning of “old age.” Participation rates of elderly males, for example, traditionally are given as those of men age sixty- five or over. This convention is largely due to the formulation of Social Security
o N a t i v e Born
70 - a
65 ~
5 60 -
ro 55 -
5 0 -
* 45 -
2 4 0 -
c)
*
D b 2 0 j m qF1
Fore ign Born
I Q
1880 1890 1900 1910 1920 1930 1940 1950 1960 1970 1980 1990 Year
Fig. 2.3 Labor force participation rates of white men aged 65 and over by nativity, 1880-1990 Note: Participation rates were calculated using the concept of gainful employment.
Whites Blacks
8
8 b 20
m 15 D
1 I l l I I I I I I I I 1880 1890 1900 1910 1920 1’330 1940 1950 1960 1970 1980 1990
Year
Fig. 2.4 1880-1990 Nore: Participation rates were calculated using the concept of gainful employment.
Labor force participation rates of men aged 65 and over by race,
11 The Evolution of Retirement
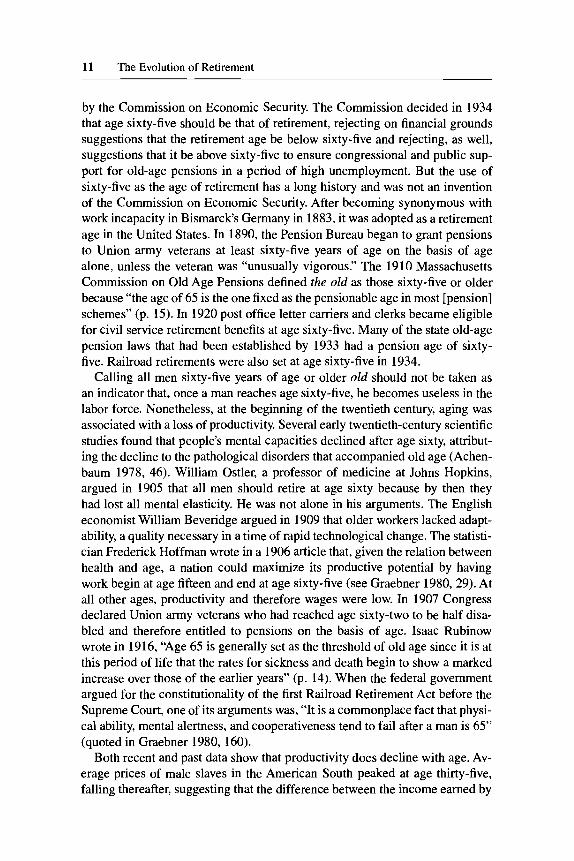
by the Commission on Economic Security. The Commission decided in 1934 that age sixty-five should be that of retirement, rejecting on financial grounds suggestions that the retirement age be below sixty-five and rejecting, as well, suggestions that it be above sixty-five to ensure congressional and public sup- port for old-age pensions in a period of high unemployment. But the use of sixty-five as the age of retirement has a long history and was not an invention of the Commission on Economic Security. After becoming synonymous with work incapacity in Bismarck’s Germany in 1883, it was adopted as a retirement age in the United States. In 1890, the Pension Bureau began to grant pensions to Union army veterans at least sixty-five years of age on the basis of age alone, unless the veteran was “unusually vigorous.” The 1910 Massachusetts Commission on Old Age Pensions defined the old as those sixty-five or older because “the age of 65 is the one fixed as the pensionable age in most [pension] schemes” (p. 15). In 1920 post office letter carriers and clerks became eligible for civil service retirement benefits at age sixty-five. Many of the state old-age pension laws that had been established by 1933 had a pension age of sixty- five. Railroad retirements were also set at age sixty-five in 1934.
Calling all men sixty-five years of age or older old should not be taken as an indicator that, once a man reaches age sixty-five, he becomes useless in the labor force. Nonetheless, at the beginning of the twentieth century, aging was associated with a loss of productivity. Several early twentieth-century scientific studies found that people’s mental capacities declined after age sixty, attribut- ing the decline to the pathological disorders that accompanied old age (Achen- baum 1978, 46). William Ostler, a professor of medicine at Johns Hopkins, argued in 1905 that all men should retire at age sixty because by then they had lost all mental elasticity. He was not alone in his arguments. The English economist William Beveridge argued in 1909 that older workers lacked adapt- ability, a quality necessary in a time of rapid technological change. The statisti- cian Frederick Hoffman wrote in a 1906 article that, given the relation between health and age, a nation could maximize its productive potential by having work begin at age fifteen and end at age sixty-five (see Graebner 1980,29). At all other ages, productivity and therefore wages were low. In 1907 Congress declared Union army veterans who had reached age sixty-two to be half disa- bled and therefore entitled to pensions on the basis of age. Isaac Rubinow wrote in 1916, “Age 65 is generally set as the threshold of old age since it is at this period of life that the rates for sickness and death begin to show a marked increase over those of the earlier years” (p. 14). When the federal government argued for the constitutionality of the first Railroad Retirement Act before the Supreme Court, one of its arguments was, “It is a commonplace fact that physi- cal ability, mental alertness, and cooperativeness tend to fail after a man is 65” (quoted in Graebner 1980, 160).
Both recent and past data show that productivity does decline with age. Av- erage prices of male slaves in the American South peaked at age thirty-five, falling thereafter, suggesting that the difference between the income earned by

12 Chapter2
a slave and the cost to the planter of maintaining him fell after age thirty-five (Fogel 1989,69). The decline of earnings with age observed among working- class households after age thirty-nine in the early 1890s and the late 1910s suggests that there was a deterioration in productivity with age (Haber and Gratton 1994,73). Among workers today productivity declines with age (Kot- likoff 1988). However, productivity has never declined sharply at any particu- lar age. The decline has always been continuous. In fact, the net earnings of slaves were positive until they reached their late seventies, suggesting that the old were far from redundant in the labor force (Fogel 1989,53). Thus, it is not that age sixty-five marks a discrete decrease in mental and physical abilities. But, because many policy makers believed that it did, it became codified in the Social Security Act and became a traditional age for retirement.
When labor force participation rates are calculated by single year of age, it is evident that work life is being increasingly compressed. Participation rates have fallen at younger ages because of the growth in schooling. They have also fallen at all older ages. The average decline in labor force participation rates of men older than sixty-four therefore does not arise from changes in the age composition of the population. Participation rates between ages sixty and sixty-five have fallen sharply since 1900 (see fig. 2.5). In 1880, 96 percent of all sixty-year-olds and 90 percent of all sixty-five-year-olds were still in the labor force, but, by 1940, the figures had fallen to 81 and 68 percent and, by 1990, to 66 and 39 percent, respectively. The decline in participation rates at older ages has been even greater. Eighty-one percent of all seventy-year-olds were still in the labor force in 1880, but only 22 percent were in 1990. Thus, it is not the aging of the population that has caused declines in labor force participation rates at older ages. Participation rates have been falling at all ages
3 100 - - 95- w 90 - ro 85 -
8 0 - c 75 -
70 - 6 5 -
2 6 0 -
A- 50 -
a 40 -
p 30 - o 25 -
L 15 -
+.
0
u, 55 -
b 4 5 -
a, 35 -
LL 20 -
g 10 -
20 25 30 35 40 45 50 55 60 65 70 75 80 85
Age
Fig. 2.5 Labor force participation rates of men aged eighteen to eighty-five by age, 1880-1990 Note: Participation rates were calculated using the concept of gainful employment. All years were smoothed using Cleveland's lowess running line smoother with a band width of 0.2.

13 The Evolution of Retirement
0.25 -
0.2 - D L 0.15 - m
I 2 0.1 -
ow - 0 -
above sixty-five. In fact, Bowen and Finegan (1969) estimated that the sharp rise in the elderly population above age seventy-five between 1948 and 1965 caused participation rates of those age sixty-five and older to decline by only 0.8 percent. More recently, participation rates have fallen for those age fifty to fifty-nine, with half the decline in participation rates at age fifty-five occurring between 1960 and 1990. In contrast, only one-third of the decline in labor force participation rates at age seventy occurred between 1960 and 1990.
Figure 2.5 does not give us the clearest picture of how the timing of retire- ment over the life cycle has changed. To determine changes in the timing of retirement, we must estimate the probability that a man retires at a particular age given that he has reached that age without having yet retired. This probabil- ity is often called the hazard rate and can be calculated from estimates of labor force participation rates at every single age. A high hazard rate at a given age indicates that a large fraction of men are likely to retire at that age.
Figure 2.6 plots hazard rates by age for the census years 1900-20, 1940-60,
1900-20
Smoothed
Hazard, Gainful Employment -,~ P - 7 \.
L 0.15 m r;l 0.1
= 0.05
0
Hazard, Current De f in i t i on
Hazard, Gainful Employment
Fig. 2.6 Probability of retirement at single age given that have reached that age without having yet retired (hazard rate) under different labor force definitions, men aged thirty-five to seventy-five, 1900-1990 Note: Participation rates were averaged over the census years 1900-1920, 1940-60, and 1970-90. The smoothed hazard was estimated using Cleveland’s lowess running line smoother with a band width of 0.2.

14 Chapter2
and 1970-90. Between 1900 and 1920, the probability of retirement at older ages rose fairly continuously, and no single age demarcated the shift to retire- ment. But, when Social Security was instituted in 1935, men became eligible for benefits at age sixty-five. The use of sixty-five as a retirement age for Social Security also led to its adoption as a retirement age, often mandatory, by many private pension plans. By 1940-60 there was a pronounced increase in the probability of age-sixty-five retirements, and this probability increased be- tween 1940-60 and 1970-90. A spike in age-sixty-two retirements first be- comes evident after 1960. In 1961 Congress amended the Social Security program to permit retirement at age sixty-two with reduced benefits. Age sixty-two is also a common early retirement age in private pension plans. When hazard rates are estimated by single census year, the spike at age sixty- two is much sharper in 1990 than in previous census years, overtaking that at age sixty-five. A small spike at age fifty-five, the age at which many private pension plans allow benefits for less than actuarial reductions, first becomes evident in 1990.
Thus, although the retirement age was always higher for men in their sixties, it was only after the introduction of Social Security that sixty-five (and later sixty-two) became the dominant retirement age. The existence of a dominant retirement age does not imply that health and productivity deteriorate rapidly after a fixed period. Rather, it suggests that the timing of retirement is deter- mined by economic considerations and perhaps by custom as well.
2.3 Explanations
Retirement requires the individual to have accumulated assets to maintain consumption. By postponing the age of retirement, workers are able to enjoy a higher level of consumption both before and after retirement. The steady withdrawal of workers from the labor force at younger ages suggests either that the retirement income available to workers has increased or that workers are increasingly being forced out of the labor force only to face impoverishment in old age. The belief that the elderly were in need of assistance was pro- pounded by the Social Security Board, which in 1935 argued that “the major part of the industrial population earns . . . scarcely enough to provide for its existence,” leading industrial workers to “reach old age with few resources” (Shearon 1938, 3, 33). According to the Social Security Board, older workers were forced out of the labor force because modern industry had no use for them. Recent research has placed more emphasis on the increase in retirement income. This section examines both factors that have pulled workers out of the labor force and factors that have pushed them out.
2.3.1 Rising Retirement Income
Among the most popular explanations for the rise of retirement is that indi- viduals can afford it. Rather than retiring because they are debilitated, they are
15 The Evolution of Retirement
-
retiring to enjoy leisure. If this explanation is true, then it is likely that more individuals are approaching old age with the wealth to support a comfortable retirement.
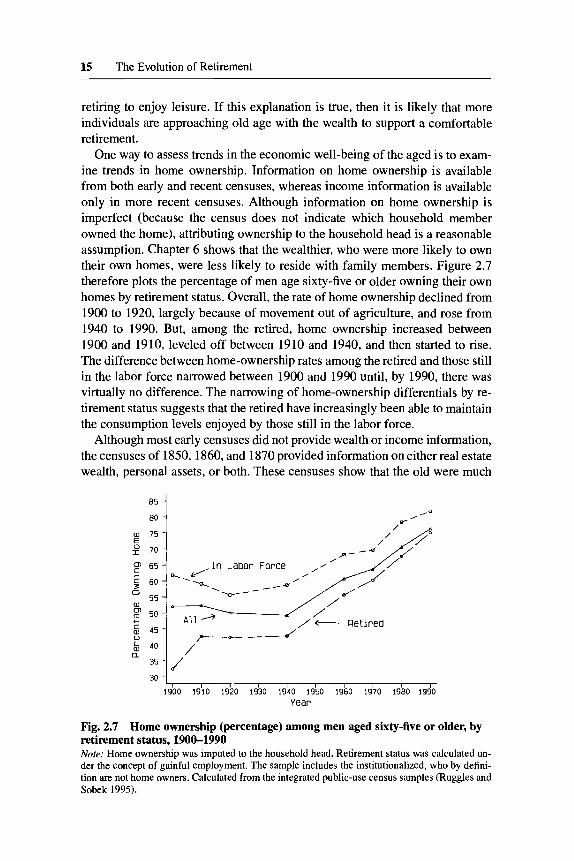
One way to assess trends in the economic well-being of the aged is to exam- ine trends in home ownership. Information on home ownership is available from both early and recent censuses, whereas income information is available only in more recent censuses. Although information on home ownership is imperfect (because the census does not indicate which household member owned the home), attributing ownership to the household head is a reasonable assumption. Chapter 6 shows that the wealthier, who were more likely to own their own homes, were less likely to reside with family members. Figure 2.7 therefore plots the percentage of men age sixty-five or older owning their own homes by retirement status. Overall, the rate of home ownership declined from 1900 to 1920, largely because of movement out of agriculture, and rose from 1940 to 1990. But, among the retired, home ownership increased between 1900 and 1910, leveled off between 1910 and 1940, and then started to rise. The difference between home-ownership rates among the retired and those still in the labor force narrowed between 1900 and 1990 until, by 1990, there was virtually no difference. The narrowing of home-ownership differentials by re- tirement status suggests that the retired have increasingly been able to maintain the consumption levels enjoyed by those still in the labor force.
Although most early censuses did not provide wealth or income information, the censuses of 1850, 1860, and 1870 provided information on either real estate wealth, personal assets, or both. These censuses show that the old were much
/' -1
aJ 75
I" 70 E
'2' 65 L d
E 60
55
50
0
aJ
Y
5 45 V & 40 a
35
30
- /'- Reti red
1 p---+-----(
Fig. 2.7 Home ownership (percentage) among men aged sixty-five or older, by retirement status, 1900-1990 Note: Home ownership was imputed to the household head. Retirement status was calculated un- der the concept of gainful employment. The sample includes the institutionalized, who by defini- tion are not home owners. Calculated from the integrated public-use census samples (Ruggles and Sobek 1995).
16 Chapter2
wealthier than the young and were becoming more so. Free males in 1850 older than sixty-nine were not as rich in real estate as men in their late fifties, but they still held real estate worth ten times that of men aged twenty to twenty- nine. Taking both real estate and personal wealth into account, men aged sixty- five and over in 1870 were much wealthier than any other age group (Haber and Gratton 1994, 71).
Additional evidence can be garnered from the early Consumer Expenditure Surveys of urban middle- and upper-working-class families still participating in the labor force. In both the Consumer Expenditure Surveys of 1889-90 and 19 17-19, there is evidence that families were accumulating modest surpluses at all ages. Although the earnings of the male household head fell rapidly with age, the earnings of children allowed the family to maintain surpluses. Haber and Gratton (1994, 78) found that summing median savings between age twenty-five and age sixty-five yielded assets, in 1918 dollars, of $1,745 in 1888-90 and $3,015 in 1917-19. Mean surpluses yielded about $5,000 in each survey, suggesting that the typical household could expect to save between $2,500 and $5,000 in assets by the time the head of the household reached age sixty-five. The range in the general population is likely to be greater. The early Consumer Expenditure Surveys did not survey the unemployed, the retired, the young, and the dependent elderly. They surveyed very few professionals. The population mean may be greater and the median lower. Nonetheless, estimates from these surveys are upheld by studies of the wealth of older people in indus- trial states in the mid-l920s, in which about 40 percent of the elderly reported wealth of $4,245 or more.
By annuitizing wealth, Haber and Gratton (1994,79) provide a rough assess- ment of trends in the economic well-being of elderly couples from 1870 to the mid-1 920s. They find that mean wealth in 1870 implies that about 20 percent of men age sixty-five and over could have financed a ten-year annuity of $23 1 in 19 17 dollars. The 19 17-1 9 Consumer Expenditure Survey and studies from the 1920s therefore indicate that, by the late 1910s and early 1920s, 40-50 percent of men could finance a ten-year annuity of $616 in 1917 dollars.
Today, the median nonhousing wealth of households with heads aged sixty to sixty-five is $19,19 1 in 19 17 dollars.' Since the median wealth of an elderly couple was about $3,000 in 1917, the assets of the elderly have risen over sixfold, an increase greater than that in GNP since 1917. Furthermore, the composition of these assets has changed. Among households with heads aged sixty-five to sixty-nine in 1991 the median of Social Security and pension wealth combined was $1 15,200, whereas the median of liquid financial assets was only $14,000 (Poterba, Venti, and Wise 1994). In the past retirees were largely dependent on their own savings and on their families for support. Pri- vate pensions were rare, and old-age assistance programs had not yet been in- stituted.
The first private pension plan was founded by American Express in 1875, but growth in pensions was slow. Only twelve private pensions existed in 1900.
17 The Evolution of Retirement
0
c m 15 - Y
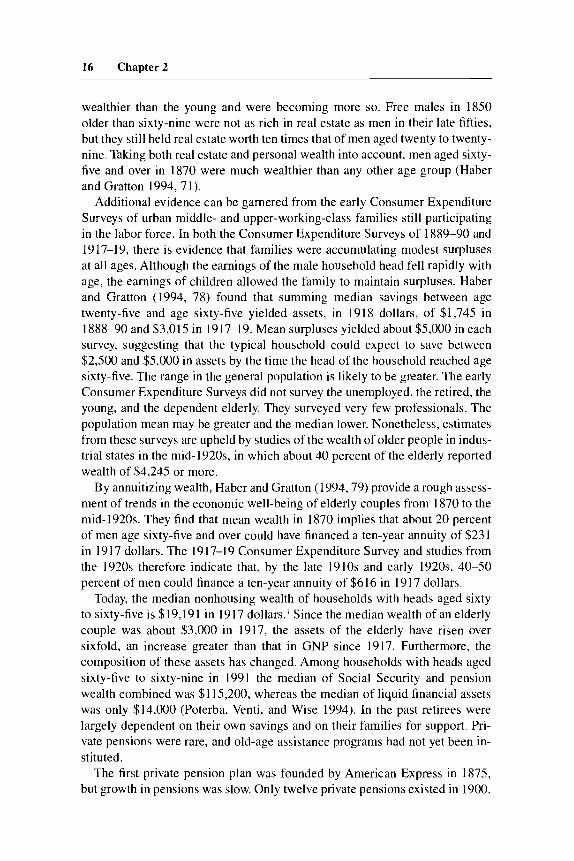
The plans were typically noncontributory, paid out only very small sums of money, and could be withdrawn at any time at the discretion of the employer.* The federal government had no regular retirement or pension system for its employees until 1920. In the 1920s, changes in state laws led to the growth of contributory plans with mandatory deductions. By 1930, 2.7 million employ- ees, about 10 percent of all private wage and salary workers, were covered by retirement plans. The tax incentives incorporated in the Revenue Act of 1942 assisted the expansion of pension plans after World War 11, and 41 percent of all private wage and salary workers were covered by 1960, almost 50 percent by the mid-1980s (see fig. 2.8).
For the median elderly household today, Social Security, not pension pay- ments, constitutes the major portion of income. The first state-provided old- age pensions were instituted in Arizona and Alaska in 1915.3 Similar programs were enacted in Montana, Nevada, and Pennsylvania by 1923, and by 1929 pension programs were in place in Wisconsin, Kentucky, Washington, Colo- rado, Maryland, California, Utah, Minnesota, and New York. By the end of 1934 there were old-age pension laws in twenty-eight states, plus Alaska and Hawaii. These state programs were limited in scope. States did not necessarily make their programs mandatory. In many states, the pensionable age was sev- enty, and pensions were restricted to the very poor who did not have financially responsible relatives. In addition, pensions were given only to those who had resided within the state for a period of, generally, fifteen years, that is, a long time.
As first instituted in 1935, Social Security contained two programs provid- ing assistance to the elderly. One was Old Age Insurance, which in 1939 be- - 55 4
----%
m 45 F u l l T ime Workers
/ /'/All Workers p 4 0
a, * 3 0 4
1930 1935 1940 1945 1950 1955 1960 1965 1970 1975 1980 19651990
Year
Fig. 2.8 Percentage of private wage and salary workers covered by pension plans, 1930-87 Nore: Compiled from Series H 287-304 in U.S. Bureau of the Census (1975,353) and table 4.1 in Beller and Lawrence (1992,75).

18 Chapter2
came Old Age and Survivors Insurance. The other was Old Age Assistance, which was a joint federal-state venture with the federal government matching state expenditures on a one-to-one basis up to a specified maximum per recipi- ent. By 1940, all states had a program, and 22 percent of all individuals sixty- five and older were receiving benefits. Old Age Assistance remained the major income program supporting the elderly until 1950.4
The Social Security Old Age and Survivors Insurance program was initially small and inc~nsequential.~ One-time lump-sum benefits were paid in 1937, but it was not until 1940 that monthly benefits first became payable. The pro- gram remained small until 1950, when coverage was extended to an additional 10 million persons, eligibility conditions were liberalized, and benefits were increased by 77 percent. The liberalization continued throughout the 1950s with increases in benefits, the expansion of coverage to farmers, farm laborers, domestic workers, and the self-employed, and the provision of monthly bene- fits to disabled workers aged fifty to sixty-four. The liberalization of qualifying rules for disability benefits and the increasing generosity of these benefits may be partially responsible for declines in labor force participation rates among workers aged fifty to sixty-four. In 1961 men were permitted to retire at sixty- two with reduced benefits, and in 1965 hospital insurance was provided to men sixty-five and over. Between 1968 and 1973 benefits were increased in every single year. Retrenchment did not come until 1977, when the indexation for- mula for benefits that produced an overadjustment was corrected, and until the 1980s, in the form of delays in cost-of-living adjustments, taxing half the benefits of upper-income recipients, and changes in the age of retirement for twenty-first-century retirees.
Most individuals today finance their retirement primarily through the Social Security system. Poterba, Venti, and Wise (1994) find that, for those aged sixty-five to sixty-nine in 199 1, median Social Security wealth was three times as large as financial assets and employer-provided pensions combined. Hurd (1994) finds that, in 1986, 81 percent of elderly households received over half their income from Social Security, with 40 percent having no income from assets and 74 percent no income from private pensions or annuities. In 1987 Social Security was the only source of income for 14 percent of beneficiaries (Sherman 1989,6). This need not be so. The elderly could finance their retire- ment through employer-provided pensions or private savings. Ultimately, what determines the amount of money available for retirement is income. The rise of private and government pensions, Social Security, and private savings re- flects the growth of incomes. Those with higher incomes are better able to save and still maintain a high consumption standard while working. Pension and, to a lesser extent, Social Security benefits are determined by past wages. Individ- uals may simply have substituted away from other forms of savings (see, e.g., Ippolito 1986). After all, why keep money in a savings vehicle whose earnings are subject to taxation? But the form that workers’ savings take does matter for retirement decisions. The growth of private and government pensions un-

19 The Evolution of Retirement
doubtedly made savings more convenient and efficient and provided tax incen- tives for saving for old age. The first cohorts to collect Social Security benefits received unexpected retirement windfalls. In addition, both Social Security and most private pension plans incorporate substantial financial incentives to retire early. The incentives provided by firm pension plans are far greater than those provided by Social Security benefits. Workers who retire later do so un- der less advantageous conditions. In fact, the empirical estimates discussed below suggest that the magnitude of the effect of a dollar in private pension wealth is very different from that of a dollar in Social Security wealth, which in turn is very different from that of a dollar in asset holdings.
The financial incentives toward retirement incorporated in Social Security and private pension plans come in two forms. The wealth provided by Social Security and private pension plans encourages more retirement. But how bene- fits accumulate matters. Under Social Security, workers who retire after sixty- five do not receive an actuarially fair increase in benefits to account for the reduction in the number of years that they will be collecting benefits. Because Social Security accrual is a small proportion of wage earnings for high-wage workers but a significant proportion for low-wage workers, the inducement to leave the labor force at age sixty-five is inversely related to wage earnings. Because higher-paid workers are more likely to be covered by private pension programs, they are more likely to be affected by the work disincentives of private pension programs. The typical formulas used in determining firm pen- sion benefits encourage continued employment until a given age, generally between fifty-five and sixty, and then provide incentives to leave the firm be- cause the annual additions to retirement wealth are reduced or even negative. In most firms the addition to retirement wealth after age sixty-five is negative.
Estimates of the effect of private pensions on labor supply are typically large. For example, Stock and Wise (1990) estimate that raising the early re- tirement age from fifty-five to sixty would reduce the number of employees who are retired by age sixty by 35 percent: Nonetheless, there is considerable disagreement about the overall effect of pensions on retirement trends. Ander- son, Gustman, and Steinmeier (1997) attribute about a quarter of the trend toward earlier retirement by men in their early sixties from 1970 to the mid- 1980s to the combined effects of private pensions and Social Security. One problem in trying to identify the effect of pensions is that nationally represen- tative data cannot be used to draw inferences about labor supply behavior be- cause they lack detailed pension plan information. But firm data tell us only whether a worker leaves the firm, not whether he withdraws from the labor force. An additional difficulty is that, if firms shape pensions to suit the tastes of workers, researchers may overestimate the effect of pension incentives on retirement. Finally, models that incorporate pension accrual patterns into the retirement decision may incorrectly assume that the exact details of pension plans and the complex calculation of accrual are fully understood by both workers and managers.
20 Chapter2
The accrual patterns of private pensions that provide incentives to retire at specific ages cannot explain why so many men retire at ages sixty-two and sixty-five. The economic inducements to retire at sixty-five, instead of sixty- four or sixty-six, are relatively small (Lumsdaine, Stock, and Wise 1996). Pen- sion accrual patterns are an even less likely explanation for the increase in retirements at age sixty-two. Kotlikoff and Wise (1987) found that only 2 per- cent of the 988 pension plans that they surveyed exhibited any large change in pension accrual that would induce extra retirement at sixty-two. The availabil- ity of Social Security benefits may explain why so many men retire at sixty- two. If workers are liquidity constrained, they will retire only on becoming eligible to receive Social Security benefits.
Estimates of the effect of Social Security on labor supply tend to be smaller than those of private pensions and suggest that the existence of Social Security is an inadequate explanation of recent retirement trends. Hausman and Wise (1985) estimate that an extra $10,000 in Social Security wealth at ages sixty- two to sixty-four leads to only a 1.7 percent increase in the probability of retire- ment and at ages sixty-five or older to about a 4.0 percent increase. They estimate that increases in Social Security benefits from 1969 to 1973 could account for at most one-third of the decrease in labor force participation rates among men aged sixty to sixty-four and less for men sixty-five years of age or older. Burtless (1 986) finds that these increases played an even smaller Moffitt (1987) estimates that the growth of Social Security accounted for only 15 percent of labor force participation reductions in the 1970s. Krueger and Pischke (1992) use time-series data to examine cohorts whose Social Security wealth was reduced because of the 1977 amendments to the Social Security Act. They find that Social Security wealth had only a small and statistically insignificant effect on the retirement rate.
The labor force participation rates of men age sixty-five and over, as plotted in figure 2.2 above, provide no evidence that the institution of Social Security affected the trend in retirement. By the time Social Security began to pay monthly benefits in 1940, 58 percent of the total decline in male labor force participation rates from 1880 to 1990 had already occurred. No discernible effect of old-age insurance programs is seen in the participation rates of other countries either. In Britain the first means-tested old-age pensions were paid to people age seventy and over in 1909, but the British labor force participation rates plotted in figure 2.2 show no acceleration in trend. Beginning in 1928, contributory pensions were paid to workers over age sixty-five who had made the requisite number of contributions, but there was no retirement condition. It was not until the National Insurance Act of 1946 that workers were required to withdraw from full-time employment in order to qualify for benefits. But this date does not mark a deviation from the aggregate trend either. The devia- tion in trend in the German series coincides with the financial crisis of the Weimar Republic, not with changes in invalidity and old-age insurance. Al- though invalidity and old-age pensions were established in 1883 and 1889,

21 The Evolution of Retirement
respectively, participation rates barely declined between 1882 and 1895. In France voluntary old-age insurance was instituted in 1895 and made compul- sory in 1910, but participation rates increased somewhat after 1910.
Researchers have found that increased assets also have a small effect on retirement rates and, for an equal discounted present value of wealth, a smaller effect than Social Security. Hurd and Boskin (1984) find that, although workers in the highest asset quartile retire more frequently, variation in retirement prob- ability with assets is small. Hausman and Wise (1985) find that, on average, an extra $10,000 in liquid assets leads to only a 0.16 percent increase in the proba- bility of retirement. Diamond and Hausman (1984) find that, on average, an extra $1,000 in wealth reduces time until retirement by 6 percent, whereas an extra $1,000 in Social Security wealth reduces time until retirement by about 15 percent. The observed effect of assets on retirement may be relatively small because, in contrast to Social Security wealth, assets holdings are more likely to be accurately predicted by individuals. That many Social Security increases were unexpected may have induced more retirements. Alternatively, assets may have little effect on the labor force participation decision because asset hold- ings are relatively small. A survey by Memll Lynch (“Employees Need to Save More Money for Retirement” 1994) reported that only 61 percent of preretirees had savings and investments apart from an employer-sponsored pension plan.
The empirical evidence on the role of rising retirement income has been mixed. One problem has been that most research on the subject has used cross- sectional data for the period after the 1960s even though the labor force partici- pation rates of older men have been declining since 1880. For men age sixty- five and over, 70 percent of the decline in participation rates occurred before 1960. If we are to understand the long-term trend, we cannot apply cross- sectional estimates from the period after the 196Os, when retirement rates were already high, to the past. In chapter 3 I therefore use data from 1900 and 1910 on Union army veterans receiving Union army pensions, data that allow me to examine the effect of the first major pension program in the United States.
In chapter 3 I argue that, at the beginning of the century, increased wealth had a substantial effect on retirement. This implies that rising incomes could account for much of the rise in retirement since 1880. But increasing incomes cannot be the only explanation. In chapter 3 I also show that the responsiveness of retirement to income has decreased, suggesting that the role of other fac- tors-such as declining health, sectoral shifts in the economy, technological change, or an increased demand for retirement because it has become relatively more attractive and inexpensive-must be investigated.
2.3.2 hshing Out the Old
The notion that older men were pushed out of the labor force by such factors as declining health, increased unemployment, sectoral shifts in the economy, and technological change has a long history. Early twentieth-century writers on the old argued that technological change in manufacturing was forcing

22 Chapter2
older men out of the labor force. Machinery was increasingly operated at such fast speeds that older workers could not keep pace and were relegated to the “industrial scrap heap.” They were condemned to be casual laborers or county charges because no firm would hire them. A manager interviewed by the Lynds in their study of Middletown in 1924 claimed that “in production work 40 to 45 is the age limit because of the speed needed in work” (Lynd and Lynd 1929, 33). The U.S. Committee on Economic Security (1935) justified the Social Security Act on the grounds that a worker’s “advanced age or invalidity renders him incapable of an effective part in productive enterprise” (p. 137). The tech- nological explanation persisted into later decades, becoming prominent in the writing of gerontologists in the 1960s.
But behind the indictment of technology lies the myth of a rural American past in which workers could labor into old age because there were always jobs for old men on farms or in leisurely self-employment. The Lynds described the older, rural world as one “where the physical decline is gradual and even the very old are useful,” contrasting it with the rapid and abrupt superannuation faced by industrial workers (Lynd and Lynd 1929, 35). This appeal to a pasto- ral, rural past was echoed by Supreme Court Justice Cardozo when he upheld the constitutionality of Social Security in 1937, arguing that the number of the aged “unable to take care of themselves is growing at a threatening pace. More and more of our population is becoming urban and industrial instead of rural and agricultural.”*
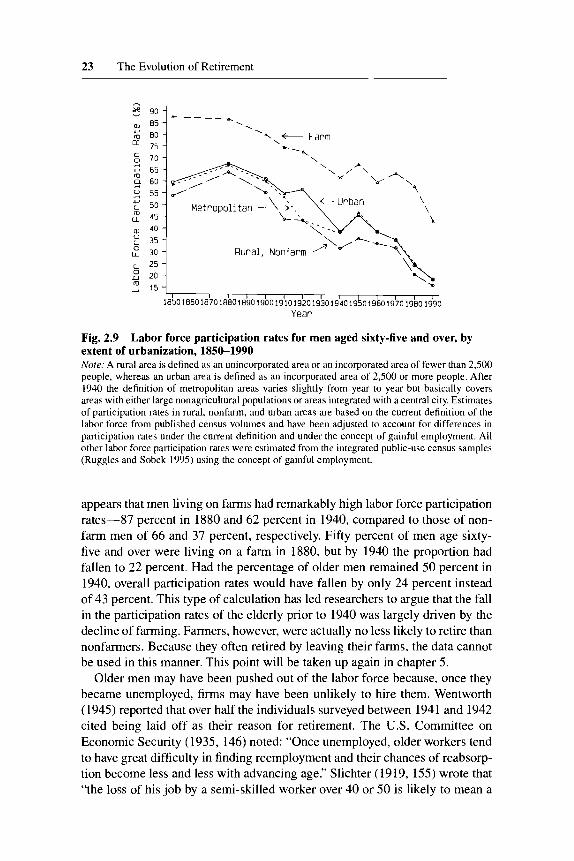
Trends in labor force participation rates arrayed by extent of urbanization belie the view that the experience of the elderly in urban areas represented a dramatic departure from that of the elderly in rural areas. Figure 2.9 plots labor force participation rates for men age sixty-five or older by farm residence, resi- dence in a rural area but not on a farm (an unincorporated area or an incorpo- rated area of fewer than twenty-five hundred people), residence in an urban area (an incorporated area of twenty-five hundred or more), and residence in a metropolitan area (either an area with a large agricultural population or an area integrated with a central city). These areas would differ not just in the extent of agricultural employment but also in the degree of self-employment. In 1910, 24 percent of older workers not living on a farm but living in a rural area were self-employed, as opposed to 19 percent in urban areas and 17 percent in metropolitan areas.
Labor force participation rates were falling for all men after 1880 regardless of residence, as figure 2.9 shows. Although the 1880-1940 decline was espe- cially pronounced in metropolitan areas, there were declines in rural areas and among farm residents as well. When an aggregate participation rate is calcu- lated for both farm residents and rural, nonfarm residents, this overall partici- pation rate is higher than that observed in urban areas. The early social reform- ers’ idealized view of rural employment might explain the difference in levels, but it cannot explain the trend common to both rural and urban areas.
One further aspect of the data presented in figure 2.9 must be mentioned. It
23 The Evolution of Retirement
- 9 0 -
w 85 - m 80 - = 7 5 -
7 0 -
6 5 - 4 6 0 -
42
: 5 5 -
L 50 - a“ 4 5 -
w 40 - y 3 5 -
LL 30 -
u
0
\ . .
4 + Farm
-4 ‘b
kP\, 1 \
Metropol i tan \ 1
Rural, Nonfarm 25 - x 2 0 -
5 1 5 - I I I I , , , I , ,
1850166016701880189019001910192019301940~9~019~019~019~01~90
Year
Fig. 2.9 Labor force participation rates for men aged sixty-five and over, by extent of urbanization, 1850-1990 Nore: A rural area is defined as an unincorporated area or an incorporated area of fewer than 2,500 people, whereas an urban area is defined as an incorporated area of 2,500 or more people. After 1940 the definition of metropolitan areas varies slightly from year to year but basically covers areas with either large nonagricultural populations or areas integrated with a central city. Estimates of participation rates in rural, nonfarm, and urban areas are based on the current definition of the labor force from published census volumes and have been adjusted to account for differences in participation rates under the current definition and under the concept of gainful employment. All other labor force participation rates were estimated from the integrated public-use census samples (Ruggles and Sobek 1995) using the concept of gainful employment.
appears that men living on farms had remarkably high labor force participation rates-87 percent in 1880 and 62 percent in 1940, compared to those of non- farm men of 66 and 37 percent, respectively. Fifty percent of men age sixty- five and over were living on a farm in 1880, but by 1940 the proportion had fallen to 22 percent. Had the percentage of older men remained 50 percent in 1940, overall participation rates would have fallen by only 24 percent instead of 43 percent. This type of calculation has led researchers to argue that the fall in the participation rates of the elderly prior to 1940 was largely driven by the decline of farming. Farmers, however, were actually no less likely to retire than nonfarmers. Because they often retired by leaving their farms, the data cannot be used in this manner. This point will be taken up again in chapter 5.
Older men may have been pushed out of the labor force because, once they became unemployed, firms may have been unlikely to hire them. Wentworth (1945) reported that over half the individuals surveyed between 1941 and 1942 cited being laid off as their reason for retirement. The U.S. Committee on Economic Security (1935, 146) noted: “Once unemployed, older workers tend to have great difficulty in finding reemployment and their chances of reabsorp- tion become less and less with advancing age.” Slichter (1919, 155) wrote that “the loss of his job by a semi-skilled worker over 40 or 50 is likely to mean a

24 Chapter2
permanent reduction in his earnings capacity, for he will have great difficulty in obtaining a job as good as his previous one.” In the 1920s many firms began to prohibit or restrict the hire of new workers older than forty-five or fifty. In his ruling on Social Security Supreme Court Justice Cardozo cited a study reporting that, in 1930, “out of 224 American factories investigated, 71, or almost one third, had fixed maximum hiring age limits; in four plants the limit was under 40; in 41 it was under 46. In the other 153 plants there were no fixed limits, but in practice few were hired if they were over 50 years of age.” A firm that needs to train its workers would much rather train a younger worker than an older worker because it can recoup its investment costs over many years. Younger workers had the advantage of physical strength at a time when many jobs were dangerous and physically exhausting. They also had an additional advantage. The rapid advances in high school education in the 1920s meant that younger workers had a much better general training.
The difficulties faced by older workers can be seen in the 1900 and 1910 census data. Margo (1993), for example, finds that the probability of long-term unemployment rose with age and that, the older a worker was when he became unemployed, the more likely he was to retire subsequently. A worker’s proba- bility of entering unemployment did not increase with age, but his probability of leaving unemployment declined with age. Lee (1996) finds that long-term unemployment in 1900 or 1910 greatly increased the odds of retirement within the next ten years. The difficulties faced by older workers may be even greater today because the probability that an unemployed worker will leave unemploy- ment has decreased since 1910. In chapter 5 I examine the effect of increases in unemployment spells on retirement rates and investigate why unemploy- ment spells have increased, concluding that the probability of leaving unem- ployment may have fallen because better income prospects now enable work- ers to reject the first job that becomes available, not because finding a new job has become increasingly difficult. Long-term unemployment could be a causal factor behind increasing retirement rates, but only if workers can afford to reject the first job that becomes available. Once unemployed, older workers will retire on not being able to find a satisfactory job, if they can afford to.
When firms adopted pension plans, many also adopted mandatory retire- ment provisions. One reason employers might want to impose mandatory re- tirement on their workers is if they offered wages tied to seniority rather than marginal product (Lazear 1979). Although such a wage structure would reduce turnover, it would lead younger workers to be paid less and older workers more than their marginal product. Compulsory retirement would allow firms to re- move more expensive older workers and to offer younger workers incentives, in the form of promotions, to remain with the firm. The outlawing of manda- tory retirement before age seventy by the 1978 Age Discrimination Act has allowed researchers to assess the effect of mandatory retirement (e.g., Burk- hauser and Quinn 1983). On the whole, the effects of mandatory retirement
25 The Evolution of Retirement
appear to have been small, perhaps because it has been intertwined with finan- cial incentives to retire and these have remained in place.
Another factor that pushes older men out of the labor force is poor health. One-third of the retirees studied by Wentworth (1945) between 1941 and 1942 stated that they had retired because of illness or failing health. Older men today still commonly cite poor health as one of their main reasons for withdrawing from the labor force. Recent data indicate that health plays an important role in retirement deci~ions.~ Some researchers have pointed to increasing morbid- ity and disability rates as evidence that average health has worsened (e.g., Riley 1989; Verbrugge 1984) and therefore has led to rising retirement rates. Ac- cording to this view, improvements in medical efficacy have led to an increased burden of chronic conditions by permitting the survival past age sixty-five of impaired individuals who in higher-mortality regimes would have died from acute diseases at earlier ages. I address the issue in chapter 4, in which I show that, not only has average health improved, but health has also become less, not more, important to the labor force participation decision.
2.4 Development of a Retirement Lifestyle
A man who retired in 1880 could expect a very different life from that of a man retiring today. In the past retirees were much more dependent on their families and friends for assistance. The 1919 Ohio Commission on Health In- surance and Old Age Pensions estimated that, in the cities of Hamilton and Cincinnati, 15-25 percent of people over age fifty were dependent on relatives or friends (cited in Epstein 1928, 50), a dependence necessitated by the fact that, at the turn of the century, a time when incomes were low, a large segment of the population had little in the form of savings, the only other source of retirement income. For example, around 1900, roughly one-fifth of working- class households had accumulated almost no financial savings (James, Pa- lumbo, and Thomas 1997). Surveys of the nondependent aged in the Northeast in the mid-1920s suggest that 20 percent had assets and property worth less than $850 in 1917 dollars (Gratton and Rotondo 1991), a sum that could cover about one year's worth of a retired couple's expenditures.'O Those who had accumulated more assets could not be assured that these were enough because either spouse might live longer than expected.
Dependence on the family is evident in elderly living arrangements. One useful indicator of household authority and of dependence is whether elderly males were household heads. Although there was little change from 1880 to 1940 in the probability that any man sixty-five years of age was the head of his household, there has been a steady increase since 1880 in the probability that a retired man was the head of his own household (see fig. 2.10). In fact, 48 percent of the increase in retired men heading their own households occurred between 1880 and 1940. The sharp differences in living arrangements by re-

26 Chapter2
Ln U
a, I (0 90 -
2 r“ B O -
a, 7 0 -
85 -
a, m 0 I
3 75 -
a 6 5 -
U 60 -
C a,
m---- In Labor Force
/ P
/ H ,
7 All
50 I I I I I I I I I l l I
1880 1890 1900 1910 1920 1930 1940 1950 1960 1970 1980 1990 Year
Fig. 2.10 Percentage of noninstitutionalized men aged sixty-five or older who were household heads, by retirement status Nure: Estimated from the integrated public-use census sample (Ruggles and Sobek 1995). The basic pattern remains unchanged if the institutionalized are included.
tirement status observed at the beginning of the century suggest that, in the past, only men who worked retained their independence. Those who did not either remained in the same household, relinquishing their position of authority to their children, or moved into the households of their children. I discuss these patterns in more detail in chapter 6, showing that, while the elderly of the past would have preferred to maintain their own households, the majority simply did not have the necessary income.
The elderly who retired were faced with a circumscribed choice, not just of living arrangements, but of activities as well. Old age, according to nineteenth- century essayists, was to be a time of rest and disengagement, serenity and peace (Fischer 1977, 122). Yeats imagined an elderly Maude Gonne as being “old and grey and full of sleep, And nodding by the fire.” Advice given to the elderly in a 1904 article published in the medical journal Practitioner was to “lead an absolutely quiet and uneventful life.” The old were to withdraw from all work, abandon all vigorous exercise, and prepare for the afterlife (Haber and Gratton 1994, 160-61). When Eleanor Roosevelt emphasized that the ma- jor benefit of Social Security would be to enable the elderly to remain in their own homes, she envisioned the old as resting in their chairs, content in familiar surroundings (see Graebner 1980, 200). She did not envision the large-scale development of retirement communities with residents putting to make par on a golf course.
Sleepy inactivity could not have been the lot of all the elderly. Local clubs founded by and for older people sprang up in the 1930s (Achenbaum 1978, 118). Retirement communities were already mushrooming in the 1920s and 1930s. Florida, where initially only wealthy New York families had winter

27 The Evolution of Retirement
homes, had become accessible to the middle class by the 1910s, when a rail- road system was completed. It became accessible to an even larger segment of the population after highways were built in the 1930s and ownership of automobiles became more widespread. Once highways were built, California also received a major infusion of elderly migrants. The first census that pro- vided information on migration in the past five years, that of 1940, showed that, between 1935 and 1940, the elderly were moving to the Pacific Coast and South Atlantic regions. This migration pattern has persisted to this day (Lon- gino 1990). Some of the elderly clearly were enjoying recreational activities during their retirement, but, compared with the period after World War 11, this was a relatively small group of well-to-do individuals. Isaac Rubinow could ask rhetorically in 1934, “Where will you and I be at 65? Behind an imposing desk of an executive office, shaping destinies of other people, or in an institu- tion for mental disease? Clipping coupons while enjoying Florida in the winter and the Michigan lake in the summer, or in a comfortable old folks’ home, or less comfortable poorhouse?” (p. 243). A recreation-filled retirement was lim- ited to the fortunate few.”
Since the 1950s, a much more positive view of retirement has emerged, far removed from early reformers’ conception of retirement as protection against the insecurities of an industrialized economy. Retirement is now viewed as a period of enjoyment and creative experience and as a reward for a lifetime of labor, increasingly shorter. Mass tourism, low-impact sports such as golf, and mass entertainment such as films, television, and spectator sports provide ac- tivities for the elderly at a low price. Data from the mid-1980s show that, among men, the amount of time spent on recreational activities increases with age (see table 2.1). Work occupied 26 percent of the time of twenty-five- to fifty-four-year-olds, 15 percent of the time of fifty-five- to sixty-four-year-olds, and 7 percent of the time of those older than sixty-four. About half the decline in work time was absorbed by recreation, which accounted for only 19 percent of time use at ages twenty-five to fifty-four but 28 percent after age sixty-four.
Table 2.1 Time Use in a 24-Hour Day for Men in 1985 (%)
Activity
Age
25-54 55-64 65 +
Sleeping, including naps On job or commuting Recreation (including travel time) Eating, preparing food House cleaning, repair, gardening Personal care, care for others (travel time excluded) Shopping for goods and services Other
32.5 25.6 18.6 6.1 4.6 3.4 2.9 5.5
34.4 15.0 24.0 8.6 5.3 3.8 3.2 5.7
34.9 7.4
27.8 9.1 1.4 3.9 3.6 5.9
Source: Calculated from Robinson (1993)
28 Chapter2
The remaining half was spread over several activities, some of which, such as leisurely meals, gardening, or certain forms of shopping, contain a recreational component. Increases in recreational activities with age are observed in other surveys as well. A 1978 survey of 1,031 retirees found that the retired sharply increased time spent on their favorite hobbies or recreational activities. The biggest increases were in active sports, general household repairs, gardening, and travel. Whereas only 13 percent of the sample claimed to have traveled frequently before retirement, 37 percent did so afterward (Morse and Gray
As I argue in chapter 7, this new conception of retirement could not have been possible had it not been for increases in income, changes in technology, and the public provision of recreational goods. Rising income and technologi- cal change that has lowered the price of recreation has made recreational goods more affordable and thus increased access to them. The lower price and in- creased variety of recreational goods have made retirement much more attrac- tive than it was in the past. This, in turn, may have induced more retirement.
An issue facing current generations is whether this new conception of retire- ment can continue to be the norm. The elderly have in part been able to finance retirement consumption by taxing younger generations. But, by 2029, if not sooner, the Social Security trust fund will be exhausted, and only payroll tax increases would maintain current benefit levels. Clearly, some reforms are needed. In chapter 8 I examine the history of old-age programs to determine what reforms are likely to produce a viable system, given that the political power of the elderly places demands for liberalization on old-age programs.
1980,58-60).
2.5 Summary
This chapter has shown that the decline in labor force participation rates among older men has proceeded at a steady pace since 1880. The downward trend was evident among many different subgroups of the population. Labor force participation rates fell among both white and black men, among both sixty-five- and seventy-five-year-olds, and among both rural and urban men. A review of explanations suggested that several factors could have contributed to the downward trend in labor force participation rates. After 1940 these factors included the provision of private pension plans and rising Social Security pay- ments, both of which led to sharp increases in retirement probabilities at spe- cific ages. Explanations for the decline prior to the establishment of Social Security have focused on the shift from agriculture to manufacturing. Finally, reasons for the decline in labor force participation observed from 1880 to the present included the worsening average health of the elderly population and an increased demand for leisure arising from higher incomes and from the growth of the entertainment and tourism industries. Although it was not possible to test competing explanations, the steady downward trend in labor force partici- pation rates suggests that long-term factors may be at work.

29 The Evolution of Retirement
Appendix 2A
Table 2A.1 Labor Force Participation Rates of Men Aged 65 or over and of Men Aged 55-64
Age 65 + Age 55-64
Year Gainful Current Gainful Current
1850 76.6 92.2 1860 76.0 I880 78.0 95.2 1890 73.8 1900 65.4 91.0 1910 58.1 91.1 1920 60.1 89.1 1930 58.0 1940 43.5 41.8 82.2 86.1 1950 47.0 41.4 88.1 85.8 1960 40.8 30.5 83.8 84.6 1970 35.2 24.8 86.7 81.5 1980 24.7 19.9 77.4 71.9 1990 18.4 16.3 67.0 67.6
Sources: See fig. 2.1. The series for men aged 65 or over calculated under the concept of gainful employment is Moen’s (1987) series extended backward to 1850 and forward to 1990 using the integrated public-use census samples (Ruggles and Sobek 1995). The series for men aged 65 or over based on the current definition of the labor force is from Series D 29-41 in U S . Bureau of the Census (1975, 132) and from table 622 in U S . Bureau of the Census (1993). The series for men aged 55-64 were estimated from the integrated public-use census samples (Ruggles and Sobek 1995).
Table 2A.2 Labor Force Participation Rates of Men Aged 65 and over, 1850-1990, United States, Britain, France, and Germany
Year us . Britain France Germany
1850 1860 1880 1881 1882 1890 1891 1895 I896 1900 1901 1907 1910 191 1 1920 1921 I925
76.6 76.0 78.0
73.6 59
73.8 65.6
58 54.1
65.4 61.4
52 58.1
60.1 56.9 51.1
58.9 53.5 47.4
(continued)

Table 2A.2 (continued)
Year us . Britain France Germany
1930 1931 1933 1936 I939 1940 1950 195 1 1954 1960 1961 1962 1970 1973 1975 1980 1982 1985 1989 I990
58.0 47.9
43.5 47.0
31.1
40.8 24.4
35.2 18.6
48.1
42.7 29.7
29.5
26.8
36.2
22.9
17.2 27.8
10.6 24.1
8.2 5.0
3.5 5.1
18.4
Sources: See fig. 2.2. Participation rates for the United States are from Moen (1987) extended backward to 1850 and forward to 1990 using the integrated public-use census samples (Ruggles and Sobek 1995). Participation rates for Great Britain are from Matthews, Feinstein, and Odling- Smee (1982). and those for France are from Marchand (1991). Those for Germany for 1925 and later are from Jacobs, Kohli, and Rein (1991) and for 1882, 1895, and 1907 are Conrad's (1990) estimates based on participation rates for men aged 60-69 and 70 or older.
Table 2A.3 Labor Force Participation Rates of Men Aged 65 and over, by Race and Nativity
White
Year All Native Born Foreign Born Black
1880 76.7 16.6 70.5 1900 64.4 68.5 60.7 1910 58.5 58.6 52.9 1920 57.0 60.1 49.9 1940 44.1 45.4 36.1 1950 48.7 49.6 46.7 1960 40.3 41.6 36.2 1970 36.6 37.7 31.8 I980 27.1 27.9 22. I 1990 18.6 18.7 17.4
87.3 84.1 86.0 16.8 54.6 51.3 37.3 33.8 23.7 15.7
Sources: See figs. 2.3 and 2.4. Participation rates were calculated using the concept of gainful em- ployment.

31 The Evolution of Retirement
Notes
I . Median pension, Social Security, and liquid asset wealth was $123,400 in 1984
2. The plans introduced by the railroads were typical. A worker received a pension
3. For a review of state old-age pension programs, see Weaver (1982, 54-75). 4. For studies of the effect of Old Age Assistance on the labor force participation
rates of the elderly, see Friedberg (1996) and Parsons (1991). 5. For a history of Social Security, see Berkowitz (1991). 6. They examined only one firm. 7. Most other studies also find that the effect of Social Security is small. An exception
is Hurd and Boskin (1984), whose estimates lead them to attribute all the change in retirement rates between 1968 and 1973 to increases in Social Security.
8. Helvering v. Davis, 1937, reprinted in National Conference on Social Welfare (1985, 129).
9. For a review, see Quinn and Burkhauser (1990). 10. Lee (1996) estimates that the needs of an elderly couple in 1917-19 were about
$789 per year. 11. A retirement spent in an institution was limited to the unfortunate few. Less than
6 percent of the U.S. population age sixty-five or older has ever been institutionalized.
(Lumsdaine and Wise 1994).
equal to 1 percent of his wage multiplied by his years of service.