the evolving broadcast sector (review report)
TRANSCRIPT
Media & Broadcasting Technology – The evolving broadcast sector (Review Report) DMTC1195 / Published 06/2006
© Datamonitor. This brief is a licensed product and is not to be photocopied Page 1
DATAMONITOR VIEW
CATALYST
Competition across the digital TV sector is now greater than ever before, prompting operators to develop their offerings to
both attract and retain subscribers. Operators are increasingly embracing new technologies to achieve this goal –
Datamonitor expects 2006 to be a watershed year for new services such as high-definition TV, IPTV and mobile TV.
SUMMARY
The five components of the evolving broadcast sector theme provide an overview of developments across the digital TV
sector, including a focus on the potential impact of technologies including high definition, PVRs and mobile TV.
• Digital TV markets: Europe & the US (Market Focus)
• Technology developments in the digital TV sector (Technology Focus)
• Digital TV development - major European TV markets and the US (Databook)
• Digital TV development - small European TV markets (Databook)
• Technology developments in the digital TV Sector (Databook)
METHODOLOGY
Industry opinion research Interviews with leading market participants.
Market data Historic and current market values are based on Datamonitor’s ongoing research into the media sector.
REVIEW REPORT
Media & Broadcasting Technology – The evolving broadcast sector (Review Report) Driving the transition to digital
Reference Code: DMTC1195
Publication Date: June 2006
Media & Broadcasting Technology – The evolving broadcast sector (Review Report)
Media & Broadcasting Technology – The evolving broadcast sector (Review Report) DMTC1195 / Published 06/2006
© Datamonitor. This brief is a licensed product and is not to be photocopied Page 2
EXECUTIVE SUMMARY
Introduction
This report combines the two briefs from the evolving broadcast sector theme for Q2 2006. While the market focus
section provides an overview of key developments across the digital TV sector, the technology focus brief
considers developments with regard to the deployment of technologies such as high definition, PVRs and mobile
TV. Three databooks showcasing relevant datasets from the interactive model are also included.
Digital TV markets: Europe & the US (Market Focus)
The Market Focus section discusses key recent developments across the European and US digital TV markets.
The European and the US digital TV markets are expected to show strong growth by the end of the decade, with
the emergence of IPTV acting to boost levels of competition and add new impetus to the plans of established
operators. The rate and nature of market development will continue to differ considerably between individual
country markets, although all will show a significant increase in the penetration of digital services by the end of
2010. Key findings of this brief include:
• strong digital growth expected across Europe;
• IPTV set to shake up the digital TV competitive environment;
• consolidation continues to have an impact on market dynamics.
Technology developments in the digital TV sector (Technology Focus)
The Technology Focus section examines the potential impact of technologies – including high definition, PVRs
and mobile TV – on the digital TV sector. Competition across the broadcast sector is now greater than ever
before, prompting operators to develop their offerings to both attract and retain subscribers. Operators are
increasingly embracing new technologies to achieve this goal – Datamonitor expects 2006 to be a watershed year
in Europe for new services such as high-definition TV, IPTV and mobile TV, while uptake of PVR technology is set
to increase rapidly over the next five years. Key findings of this brief include:
• high definition expected to become a major service differentiator;
• increasing penetration of PVRs could disrupt existing broadcast business models;
• mobile TV offers new opportunities for broadcasters.

Media & Broadcasting Technology – The evolving broadcast sector (Review Report)
Media & Broadcasting Technology – The evolving broadcast sector (Review Report) DMTC1195 / Published 06/2006
© Datamonitor. This brief is a licensed product and is not to be photocopied Page 3
Databooks
The final section provides datasets relating to the evolving broadcast sector theme. Three databooks are included
in this review report:
• Digital TV development: major European TV markets and the US (Databook) – provides a breakdown
of digital households by both platform (satellite, cable, DTT and IPTV) and operator across major
European TV markets (France, Germany, Italy, Spain and the UK) and the US.
• Digital TV development: small European TV markets (Databook) – provides a breakdown of digital
households by both platform (satellite, cable, DTT and IPTV) and operator across the smaller European
TV markets (Austria, Belgium, Denmark, Finland, the Netherlands, Norway, Portugal, Sweden and
Switzerland).
• Technology developments in the digital TV Sector (Databook) – provides forecast market data relating
to the penetration of PVR, high definition and mobile TV technologies across western Europe and the
US.
Sources used for this research include:
• interviews with leading market participants;
• Datamonitor’s ongoing research into the media sector.

Media & Broadcasting Technology – The evolving broadcast sector (Review Report)
Media & Broadcasting Technology – The evolving broadcast sector (Review Report) DMTC1195 / Published 06/2006
© Datamonitor. This brief is a licensed product and is not to be photocopied Page 4
TABLE OF CONTENTS
DATAMONITOR VIEW 1
CATALYST 1
SUMMARY 1
METHODOLOGY 1
EXECUTIVE SUMMARY 2
Introduction 2
Digital TV markets: Europe & the US (Market Focus) 2
Technology developments in the digital TV sector (Technology Focus) 2
Databooks 3
DIGITAL TV MARKETS: EUROPE & THE US (MARKET FOCUS) 8
Summary 8
Strong digital growth expected across Europe 8
IPTV set to shake up the digital TV competitive environment 15
Consolidation continues to have an impact on market dynamics 20
TECHNOLOGY DEVELOPMENTS IN THE DIGITAL TV SECTOR (TECHNOLOGY FOCUS) 24
Summary 24
High definition expected to become a major service differentiator 24
Increasing penetration of PVRs could disrupt existing broadcast business models 32
Mobile TV offers new opportunities for broadcasters 36

Media & Broadcasting Technology – The evolving broadcast sector (Review Report)
Media & Broadcasting Technology – The evolving broadcast sector (Review Report) DMTC1195 / Published 06/2006
© Datamonitor. This brief is a licensed product and is not to be photocopied Page 5
DIGITAL TV DEVELOPMENT: MAJOR EUROPEAN MARKETS & THE US (DATABOOK) 42
Introduction 42
Market development comparison: Europe & US 43
Digital TV growth in France 46
Digital TV growth in Germany 48
Digital TV growth in Italy 50
Digital TV growth in Spain 52
Digital TV growth in the UK 54
Digital TV growth in the US 56
DIGITAL TV DEVELOPMENT: SMALL EUROPEAN TV MARKETS (DATABOOK) 58
Introduction 58
Digital TV growth in Austria 59
Digital TV growth in Belgium 61
Digital TV growth in Denmark 63
Digital TV growth in Finland 65
Digital TV growth in the Netherlands 67
Digital TV growth in Norway 69
Digital TV growth in Portugal 71
Digital TV growth in Sweden 73
Digital TV growth in Switzerland 75
TECHNOLOGY DEVELOPMENTS IN THE DIGITAL TV SECTOR (DATABOOK) 76
Introduction 76
High definition uptake comparison: Europe vs. the US, 2006-2010 78

Media & Broadcasting Technology – The evolving broadcast sector (Review Report)
Media & Broadcasting Technology – The evolving broadcast sector (Review Report) DMTC1195 / Published 06/2006
© Datamonitor. This brief is a licensed product and is not to be photocopied Page 6
High definition TV households in Austria, 2006-2010 79
High definition TV households in Belgium, 2006-2010 80
High definition TV households in Denmark, 2006-2010 81
High definition TV households in Finland, 2006-2010 82
High definition TV households in France, 2006-2010 83
High definition TV households in Germany, 2006-2010 84
High definition TV households in Italy, 2006-2010 85
High definition TV households in the Netherlands, 2006-2010 86
High definition TV households in Norway, 2006-2010 87
High definition TV households in Portugal, 2006-2010 88
High definition TV households in Spain, 2006-2010 89
High definition TV households in Sweden, 2006-2010 90
High definition TV households in Switzerland, 2006-2010 91
High definition TV households in the UK, 2006-2010 92
High definition TV households in the US, 2006-2010 93
PVR uptake comparison: Europe vs. the US, 2006-2010 94
PVR households in Austria, 2006-2010 95
PVR households in Belgium, 2006-2010 96
PVR households in Denmark, 2006-2010 97
PVR households in Finland, 2006-2010 98
PVR households in France, 2006-2010 99
PVR households in Germany, 2006-2010 100
PVR households in Italy, 2006-2010 101
PVR households in the Netherlands, 2006-2010 102
Media & Broadcasting Technology – The evolving broadcast sector (Review Report)
Media & Broadcasting Technology – The evolving broadcast sector (Review Report) DMTC1195 / Published 06/2006
© Datamonitor. This brief is a licensed product and is not to be photocopied Page 7
PVR households in Norway, 2006-2010 103
PVR households in Portugal, 2006-2010 104
PVR households in Spain, 2006-2010 105
PVR households in Sweden, 2006-2010 106
PVR households in Switzerland, 2006-2010 107
PVR households in the UK, 2006-2010 108
PVR households in the US, 2006-2010 109
Mobile TV subscribers in Europe and the US, 2006-2009 110
Mobile TV handset shipments by broadcast technology, 2006-2009 111
APPENDIX 112
Definitions 112
Further reading 113
Ask the analyst 113

Media & Broadcasting Technology – The evolving broadcast sector (Review Report)
Media & Broadcasting Technology – The evolving broadcast sector (Review Report) DMTC1195 / Published 06/2006
© Datamonitor. This brief is a licensed product and is not to be photocopied Page 8
DIGITAL TV MARKETS: EUROPE & THE US (MARKET FOCUS)
Summary
The European and the US digital TV markets are expected to show strong growth by the end of the decade, with
the emergence of IPTV acting to boost levels of competition and add new impetus to the plans of established
operators. The rate and nature of market development will continue to differ considerably between individual
country markets, although all will show a significant increase in the penetration of digital services by the end of
2010. Key findings of this brief include:
• strong digital growth expected across Europe;
• IPTV set to shake up the digital TV competitive environment;
• consolidation continues to have an impact on market dynamics.
Strong digital growth expected across Europe
The digital TV market continued to exhibit strong growth across Europe and the US in 2005, with more than 100
million households across the two regions having made the transition from analog services by the end of the year.
However, the pace of progress with regard to the penetration of digital services continues to vary significantly
between individual country markets, with the UK remaining the only market where more than half of households
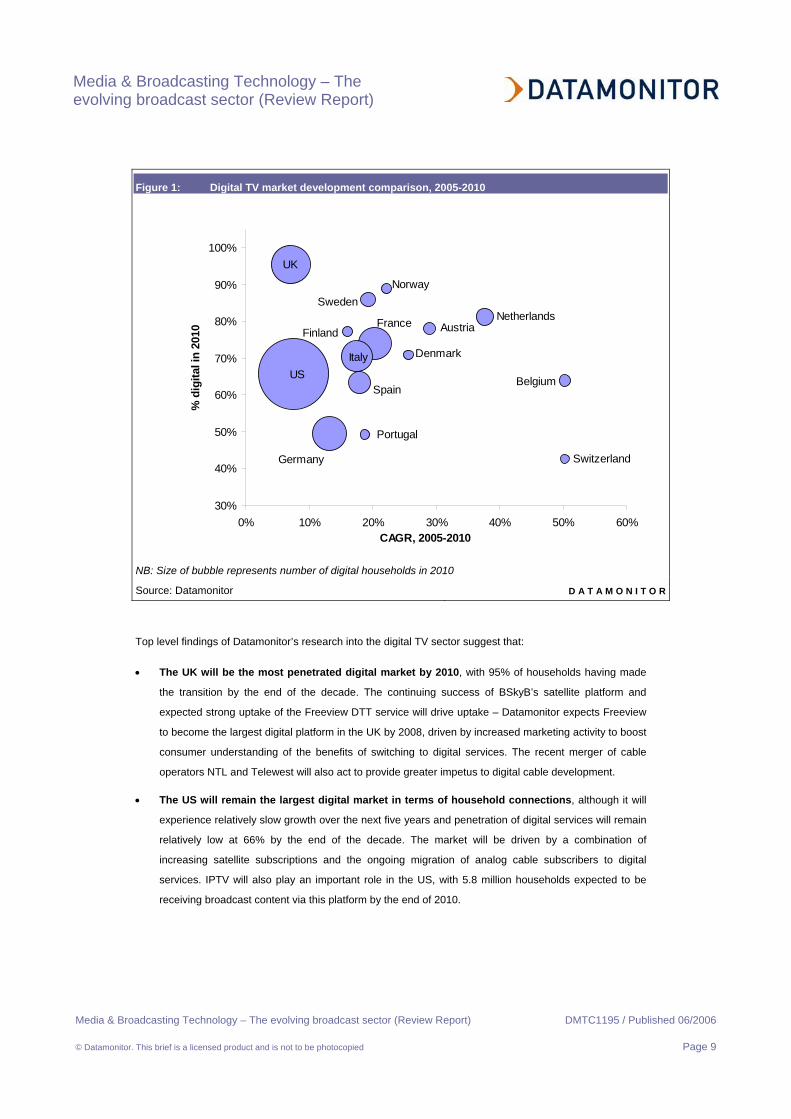
had made the transition by the end of 2005. The following figure compares current and future development in
Western Europe and the US from 2005 to 2010, highlighting the fact both expected uptake of digital TV services
and the rate at which individual markets will grow over the forecast period will continue to differ considerably.
Media & Broadcasting Technology – The evolving broadcast sector (Review Report)
Media & Broadcasting Technology – The evolving broadcast sector (Review Report) DMTC1195 / Published 06/2006
© Datamonitor. This brief is a licensed product and is not to be photocopied Page 9
Figure 1: Digital TV market development comparison, 2005-2010
Italy
Germany
Portugal
Denmark
Finland France
Spain
Netherlands Austria
Switzerland
Sweden Norway
Belgium US
UK
30%
40%
50%
60%
70%
80%
90%
100%
0% 10% 20% 30% 40% 50% 60%CAGR, 2005-2010
% d
igita
l in
2010
NB: Size of bubble represents number of digital households in 2010
Source: Datamonitor D A T A M O N I T O R
Top level findings of Datamonitor’s research into the digital TV sector suggest that:
• The UK will be the most penetrated digital market by 2010, with 95% of households having made
the transition by the end of the decade. The continuing success of BSkyB’s satellite platform and
expected strong uptake of the Freeview DTT service will drive uptake – Datamonitor expects Freeview
to become the largest digital platform in the UK by 2008, driven by increased marketing activity to boost
consumer understanding of the benefits of switching to digital services. The recent merger of cable
operators NTL and Telewest will also act to provide greater impetus to digital cable development.
• The US will remain the largest digital market in terms of household connections, although it will
experience relatively slow growth over the next five years and penetration of digital services will remain
relatively low at 66% by the end of the decade. The market will be driven by a combination of
increasing satellite subscriptions and the ongoing migration of analog cable subscribers to digital
services. IPTV will also play an important role in the US, with 5.8 million households expected to be
receiving broadcast content via this platform by the end of 2010.
Media & Broadcasting Technology – The evolving broadcast sector (Review Report)
Media & Broadcasting Technology – The evolving broadcast sector (Review Report) DMTC1195 / Published 06/2006
© Datamonitor. This brief is a licensed product and is not to be photocopied Page 10
• Belgium will experience the strongest growth over the forecast period, driven by the development
of the digital cable sector, which is currently very underdeveloped. IPTV will also have an impact on the
Belgian market, with over 300,000 households expected on Belgacom’s platform by the end of 2010.
• In Germany, Europe’s largest TV market, the digital value proposition has proved less powerful
than in many markets – the sizable multi-channel subscriber base that currently receives a broad
range of channels via analog cable services is in no rush to migrate to digital, making rapid
infrastructure investment an unattractive option for operators. However, Datamonitor believes that
recent cable consolidation will to drive digital development plans, helping to boost digital penetration to
nearly 50% of households by the end of 2010.
Europe set to overtake the US in 2006
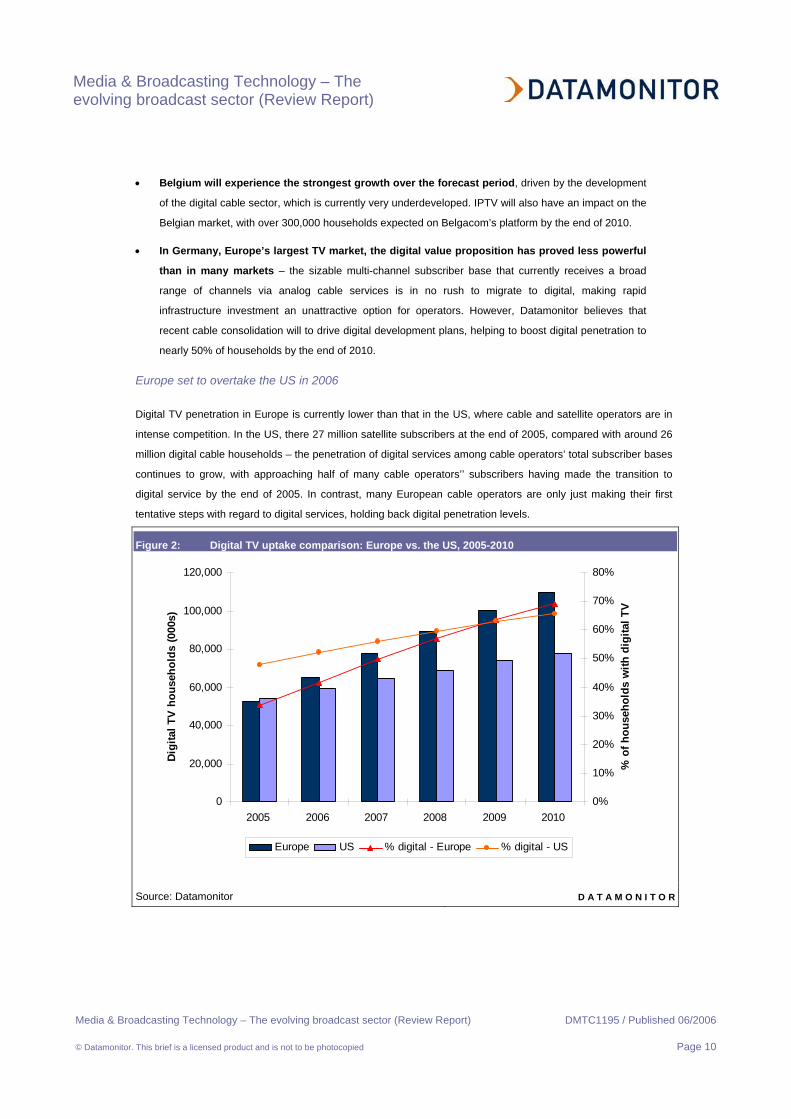
Digital TV penetration in Europe is currently lower than that in the US, where cable and satellite operators are in
intense competition. In the US, there 27 million satellite subscribers at the end of 2005, compared with around 26
million digital cable households – the penetration of digital services among cable operators’ total subscriber bases
continues to grow, with approaching half of many cable operators’’ subscribers having made the transition to
digital service by the end of 2005. In contrast, many European cable operators are only just making their first
tentative steps with regard to digital services, holding back digital penetration levels.
Figure 2: Digital TV uptake comparison: Europe vs. the US, 2005-2010
0
20,000
40,000
60,000
80,000
100,000
120,000
2005 2006 2007 2008 2009 2010
Digi
tal T
V h
ouse
hold
s (0
00s)
0%
10%
20%
30%
40%
50%
60%
70%
80%
% o
f hou
seho
lds
with
dig
ital T
V
Europe US % digital - Europe % digital - US
Source: Datamonitor D A T A M O N I T O R
Media & Broadcasting Technology – The evolving broadcast sector (Review Report)
Media & Broadcasting Technology – The evolving broadcast sector (Review Report) DMTC1195 / Published 06/2006
© Datamonitor. This brief is a licensed product and is not to be photocopied Page 11
As shown in the figure above, Datamonitor expects the European digital TV market to overtake the US in absolute
terms by the end of 2006, at which point almost 65 million households across the region will have made the
transition to digital TV services. However, digital penetration will remain higher in the US until the end of 2009 – at
this point, around 63% of households in both the US and Europe will be receiving digital TV services. The key
driver of European digital TV uptake over the forecast period is expected to be DTT, which will to drive uptake to
109 million by the end of 2010 – compared to 78 million in the US at the same period.
European market growth dependent on DTT and migration to digital cable services
Across Europe as a whole, cable infrastructure is slowly being upgraded to digital, with customer migration to
digital services proving to be rather limited in many markets. However, strong growth is expected across Europe,
driven by a number of key factors:
• Strong growth in DTT in France, Italy, Spain and the UK, driven by the EU analog switch-off dates.
All of these major TV markets have a relatively strong reliance on terrestrial reception compared to
other more cable-centric markets, and hence migrating analog households to DTT will be a key
requirement over the next five years.
• Increasing migration of analog cable subscribers to digital services, driven by operators’ desire to
deploy triple play services in order to strengthen their competitive offerings relative to both satellite and,
increasingly, IPTV.
• Continued growth of satellite services in the UK, Italy, Spain and the Nordics, driven by the
deployment of new services (HD in particular) and the strong content offerings that these operators
provide.
• The emergence of IPTV services, which are already gaining a foothold in a number of markets
including France, Spain and Italy. Datamonitor expects strong growth across this platform as incumbent
operators seek to strengthen their market position by adding TV services to their service portfolios.
In contrast, the US market will be largely driven by the continuing migration of analog cable subscribers to digital
services, with over 10 million households expected to make this transition between 2005 and 2010. IPTV will also
become a significant platform over the forecast period, with almost 6 million households connected by the end of
the forecast period. The following section highlights expected progress across the three established platforms for
digital TV (cable, satellite and DTT).
Digital cable: slow progress continues in core European cable markets
The European digital cable market has continued its slow progress in 2005. Datamonitor retains high hopes for
strong growth in many of the key cable markets over the next few years, although there remains a lack of interest
on the part of both consumers and operators to make the transition in many markets. The UK is expected to
continue to lead the European market in terms of digital penetration of cable services, with Telewest reaching
93% digital penetration by the end of 2005 and expecting to switch off analog services in 2006. Strong growth is
expected in heavily cable markets including the Netherlands and Belgium, although German digital development
Media & Broadcasting Technology – The evolving broadcast sector (Review Report)
Media & Broadcasting Technology – The evolving broadcast sector (Review Report) DMTC1195 / Published 06/2006
© Datamonitor. This brief is a licensed product and is not to be photocopied Page 12
remains relatively sluggish. However, Datamonitor expects recent consolidation of the German cable market to
help to drive migration to digital services, with greater economies of scale within operators helping to boost
investment levels.
Digital penetration reaches almost 50% in US cable sector
In the US, digital penetration among cable subscribers is approaching the 50% mark: Comcast, the largest cable
operator in the US, had migrated around 46% of its subscribers to digital services by the end of 2005, while the
innovative Cablevision is approaching the two-thirds mark. Despite this healthy position, Datamonitor expects
relatively slow progress over the next five years, with approximately 60% of cable subscribers using digital
services by the end of 2010. However, the need to free up capacity for the further development of HD services is
likely to prompt operators to boost their efforts in this regard. The emergence of IPTV services – not just in the US
but also across Europe – is also likely to prompt greater focus on driving digital adoption, with the need to offer
VOD services to compete on an even footing with new competitors becoming increasingly important.
Digital satellite: steady, if unspectacular progress
The digital satellite market remains dominated by pay-TV operators, with the only significant exception being
Germany where FTA satellite services are commonplace. Around 24 million European households and 27 million
US households now receive digital satellite services, with continued growth anticipated by the end of 2010.
Datamonitor expects the strongest satellite growth to occur in Germany, where the number of digital households
will increase to almost 11 million by the end of 2010, driven primarily by the FTA market which will double in size
over the forecast period. In the other major European markets, Datamonitor expects relatively slow growth – the
pay-TV markets in France, Spain the UK are nearing saturation point, with further digital growth expected to come
primarily from FTA services. Free-to-air satellite services are already commonplace in Germany, while plans are
afoot to launch a FreeSat service in the UK – although the huge success of FTA DTT services has resulted in
plans being delayed for the foreseeable future.
Solid growth anticipated for US satellite
The US satellite market continues to grow, with over 2 million subscribers added in 2005. Datamonitor expects
around 5.7 million more subscribers to be added by DIRECTV and EchoStar over the forecast period, with around
33 million households accessing pay-TV services via digital satellite by the end of 2010, representing nearly 28%
of all US TV households. With subscriber growth beginning to slow, Datamonitor expects the operators to focus
increasing efforts on increasing ARPU levels via investment in HD programming and PVR technology, while a
merger of the rival providers remains a possibility.
Digital terrestrial television (DTT): Europe’s largest platform by 2008
DTT continues to be a major success story in the markets where it has launched on a FTA basis – the strong
uptake of services seen in the UK has been followed by substantial growth in other key terrestrial-dominated
markets including France, Italy and Spain. However, DTT services have yet to be fully launched in a number of
Media & Broadcasting Technology – The evolving broadcast sector (Review Report)
Media & Broadcasting Technology – The evolving broadcast sector (Review Report) DMTC1195 / Published 06/2006
© Datamonitor. This brief is a licensed product and is not to be photocopied Page 13
European markets including Austria, Belgium and Denmark – in these markets, there is little compelling reason to
invest heavily in DTT services due to the high penetration of cable and satellite services. In Belgium, for example,
the dominance of cable (over 90% of households receive TV content via this platform) and the emergence of IPTV
services means that there is no real incentive to deploy widespread DTT services. Datamonitor believes that the
most significant opportunities for DTT provision across Europe have already been exploited, with remaining
markets having limited reliance on analog terrestrial reception and hence less significant need for DTT rollout.
Overall, however, DTT will be the largest digital platform by the end of 2008, with over 30 million households using
the platform as their primary means of receiving digital TV services by this time.
DTT will remain a niche proposition in the US
In contrast to the European market, DTT is expected to have a minimal impact in the US – only around 10% of
households use analog terrestrial as their primary reception method for TV services. However, with around 11
million households reliant on terrestrial services, transitioning households to digital services will be increasingly
important – many channels are already being broadcast in digital, with a market for DTT programming developing
as a result of the increasing propensity for new TVs to come ready equipped with a digital tuner (the FCC has
mandated that digital tuners must be integrated into all new TVs by the summers of 2007). The USDTV pay-TV
service is also likely to attract some subscribers – the $20 per month service, which offers around 30 channels,
was launched in Dallas in November 2005 following trials in three other markets.
A switch-off date of April 7th 2009 has been approved by the US Senate Commerce Committee – following the
cessation of analog broadcasts, the frequencies are set to be returned to the government for resale, and are
expected to reach up to $10 billion at auction. The Senate bill includes a $3 billion fund for set-top box subsidies,
considerably more than the $1 billion previously proposed by the House of Energy and Commerce Committee.
Datamonitor believes that high subsidy levels will help to ensure a smooth transition to DTT services in the US.
Football rights remain an essential component of European pay-TV strategies
The provision of high value content is a key driver across the pay-TV sector – consumers will understandably opt
for services that provide them will a broad range of popular and sought-after content. Across the European pay-
TV sector, top-flight football rights remains the most prized of assets – the success of many satellite providers,
including BSkyB and Premiere, has been attributed by many to the availability of exclusive football coverage.
However, recent developments in both Germany and UK have acted to disrupt the current monopolies that the
operators previously held over football rights, potentially having a significant impact on the dynamics of these pay-
TV markets.
Premiere seeking to repair the damage caused by Bundesliga rights loss
Germany’s leading pay-TV operator, Premiere, lost the rights to top-flight German football to Unity Media (a
holding company of the cable operators iesy, ish and Tele Columbus) in December 2005. Unity Media paid
€1.26bn ($1.52bn) for the rights from 2006-9; Premiere’s bid was actually higher, but the operator demanded that
a popular highlights show on public broadcast channel, ARD, was moved to a later time slot. Clubs, realizing the
Media & Broadcasting Technology – The evolving broadcast sector (Review Report)
Media & Broadcasting Technology – The evolving broadcast sector (Review Report) DMTC1195 / Published 06/2006
© Datamonitor. This brief is a licensed product and is not to be photocopied Page 14
importance of sizable FTA audiences to their sponsors, opted to support the lower, but less restrictive, Unity
Media bid. Premiere’s share price fell by around 45% when the news was announced, highlighting the huge
importance of the rights to its business. The loss of the highly prized football rights could also have a major impact
on its subscriber base – while Premiere itself expects to lose about 10% of its 3.4 million subscribers if it is unable
to sub-license the rights from Unity, Datamonitor believes that the actual figure could be closer to 20%, such is the
importance of the rights.
In an attempt to repair the damage caused by the rights loss, Premiere has reached a deal with Deutsche
Telekom that will allow the operator’s customers to watch coverage over the Internet – Deutsche Telekom holds
the Internet rights for Bundesliga coverage. Under the terms of the deal, Bundesliga games will be available to
Premiere subscribers that have a DT broadband connection – currently estimated to be around half of the pay-TV
operator’s customer base. Although the deal will help Premiere to repair some of the damage wrought by the loss
of pay-TV football rights, Datamonitor believes that the operator will need to negotiate a deal with Unity Media in
order to regain access to matches across its cable and satellite platforms. Although not yet confirmed, Unity
Media is expected to sub-license its rights to other operators in order to recoup some of its initial investment –
whether Premiere is one of these remains to be seen.
EC decision weakens BSkyB’s hold on UK football rights
Premiere is not the only European operator to have lost control of football rights in the past year. It was confirmed
in March 2006 that English Premiership TV rights for the 2007-2010 seasons would be sold in 6 packages, with no
single broadcaster able to buy more than 5 of these. Despite the enforced loss of Sky’s exclusivity, the English
Premier League rights auction in the UK generated £1.7bn ($3.1bn), up around 65% on the previous deal. As
expected, BSkyB has retained a strong position with regard to the 2007-2010 rights, winning 4 of the 6 rights
packages on offer, while Setanta has gained control of the remaining 2 packages. Overall, Sky has won the rights
to 92 matches (including the elite Sunday afternoon games) at a cost of around £4.8 million ($8.6m) per match,
while Setanta took the remaining 46 at an average cost of £2.8 million ($5m).
For the first time, the rights are platform neutral, meaning that the rights winners will be able to simulcast
programming via non-TV channels, including broadband – Datamonitor expects Sky in particular to exploit this
opportunity over the course of the next few years in order to extend consumer reach. Setanta has already
confirmed that it is planning to screen live matches over broadband and across all digital TV platforms (including
DTT); should Premier League coverage be made available through Freeview via the Top Up TV pay-TV services,
it would provide a major boost to the DTT platform, which is already in around c7 million UK homes. Rumors also
persist that BSkyB will offer some coverage on Top Up TV, possibly via a monthly subscription – this would be a
significant departure from the operator’s existing strategy, whereby it sells access to Premier League matches as
part of a package of channels through cable and satellite.
IPTV operators start to compete for football rights
Although satellite (and to an extent, cable) operators have historically been the primary acquirers of football rights,
a number of IPTV providers have taken an aggressive approach to their content strategies to win exclusive rights.
Media & Broadcasting Technology – The evolving broadcast sector (Review Report)
Media & Broadcasting Technology – The evolving broadcast sector (Review Report) DMTC1195 / Published 06/2006
© Datamonitor. This brief is a licensed product and is not to be photocopied Page 15
Belgacom has acquired the rights to the Belgian football league and Dutch telco, Versatel, has acquired the rights
to the Dutch football league. Both operators currently lack the necessary scale to make the deals profitable
without sub-licensing the rights to other operators (Belgacom provides some matches to satellite provider Canal
Digitaal, Versatel to a number of cable operators) – however, Datamonitor expects the situation to change as the
operators’ IPTV subscriber bases increase to the point where they can retain exclusivity in a cost-effective
manner. BT’s acquisition of ‘near live’ Premier League rights in the UK for its forthcoming VOD service further
underlines the high value of football rights across the pay-TV sector.
IPTV set to shake up the digital TV competitive environment
Increasing competition drives need for service expansion
IPTV remains one of the biggest subjects of discussion and speculation across the digital television industry
today. The emergence of a fourth platform is making executives across the cable, satellite and terrestrial sectors
uneasy as they prepare to meet the challenge of increased competition from telecoms providers. Telecoms
operators across the US and Europe are coming under increasing pressure from cable operators with regard to
the provision of triple play services, and in many cases are reacting by launching triple play services by adding
IPTV to the plethora of services already being delivered over their broadband networks.
European operators begin to embrace IPTV
Initial IPTV development has been faster in Europe than the US, with the majority of early deployments over
existing DSL broadband connections and product offerings relatively simple. Of the incumbent telecoms operators
in Europe, Belgacom, France Telecom, KPN, Austria Telecom, Telecom Italia, Telia, Telefonica and TDC have all
launched IPTV services to date, with BT planning to roll out its combined DTT/VOD service in the Autumn of
2006. Deutsche Telekom has recently announced that it will launch an IPTV service over VDSL in 2007, while
Swisscom’s IPTV plans have been delayed as a result of technical issues. Both France Telecom and Telefónica
have already established a strong foothold in their domestic markets, while other major services providers are
stepping up their efforts in an attempt to compete with their cable and satellite rivals, as outlined below.
• France Telecom’s IPTV service attracted 200,000 subscribers by the end of 2005, representing strong
progress over the course of the year. The service has now been extended – from February, customers
have been able to opt for the ‘Le Bouquet’ package, which provides access to over 200 channels and
the potential to access premium content from TPS and Canal+. Competition in the French IPTV market
is strong, with Neuf Cegetel, Free and Telecom Italia France all offering services, in some cases for
free when consumers subscribe to broadband services – the combination of low price points and pay-
TV operators’ willingness to provide content for the services have acted to drive uptake.
• Telefónica had attracted around 200,000 subscribers to its Imagenio service by the end of 2005. In
December 2005, the first true rival to Imagenio in Spain was launched by Superbanda, while Jazztel is
also set to enter into direct competition with the incumbent telco when it launches its IPTV service
nationally.
Media & Broadcasting Technology – The evolving broadcast sector (Review Report)
Media & Broadcasting Technology – The evolving broadcast sector (Review Report) DMTC1195 / Published 06/2006
© Datamonitor. This brief is a licensed product and is not to be photocopied Page 16
• Telecom Italia launched its Alice Home TV service in December 2005. Initially available in 4 cities to
around 2 million households, coverage was extended to 4 million homes by the end of January and will
be further increased to 8 million by the end of 2006. The operator plans to invest around €2.1 billion
($2.6bn) on broadband-related deployment and services over the next two years, with €350 million
($440m) of this spent on developing IPTV services. However, with FastWeb already well established in
what is arguably Europe’s most developed IPTV market, combined with satellite’s current pay-TV
dominance and the strong growth of DTT services, Datamonitor believes that Telecom Italia may
struggle to drive significant growth in the short-term. In order to succeed, the operator will need to
stress the convenience and cost advantages of opting for a triple play offering, an area in which
FastWeb is currently the only major competitor.
• Belgium – Belgacom launched its IPTV services in June 2005, beating cable rival Telenet to the punch
with regard to launching a digital TV service. Currently, around 62% of Belgian households are able to
receive TV services, with the combination of ADSL2+ and VDSL deployments likely to result in an
increase to nearer 80% by the end of 2006. By securing exclusive football rights in Belgium for both
domestic games and Italian Serie A matches, Belgacom has gained a strong position – the fact that the
operator does not force consumers to subscribe to a raft of other channels before being able to access
the football coverage is also seen as a positive move which is a marked departure from the strategy of
cable operators. Belgacom extended its VOD offering in December through a partnership with
DreamWorks which provides a catalog of around 300 movies.
• KPN – Dutch service provider KPN launched its IPTV service in May 2006 under the brand name
‘Mine’. At launch, subscribers will have access to 48 TV and 60 radio channels, with an expansion to 60
TV channels planned over the following months. The service also includes a VOD movie service
offering 300 titles, with KPN partnering with major content providers such as Warner Bros and
Blockbuster to provide the service. KPN expects to sign up around 10,000 subscribers by October, but
will have to compete with rival IPTV provider Versatel, which has acquired rights to the Dutch football
league.
• Deutsche Telekom has partnered with Microsoft in preparation for a planned launch of IPTV services
from mid-summer onwards; Initially, the service will only be provided in 10 German cities. For Microsoft,
it is the biggest IPTV deal in Europe and its second biggest global deal (the largest being with AT&T in
the US). The transition to digital services in Germany has been hindered by the availability of a large
number of popular channels which are provided for free, limited the appeal of paid services. German
IPTV providers have the opportunity to provide a new range of services (interactivity and VOD, for
example) that will convince consumers to make the switch from basic cable services.
• Telekom Austria, which had approximately 575k broadband subs at the end of 2005, launched Aon
Digital TV in January 2006 in Vienna – previously, it had offered PC-based video services via its Aon
TV service, but the latest offering extends connectivity to TVs. Aon Digital TV offers 50 channels and
VOD content.

Media & Broadcasting Technology – The evolving broadcast sector (Review Report)
Media & Broadcasting Technology – The evolving broadcast sector (Review Report) DMTC1195 / Published 06/2006
© Datamonitor. This brief is a licensed product and is not to be photocopied Page 17
• BT will launch its BT Vision service in the autumn, the first offering to combine IP-based VOD content
and free-to-air DTT through a single STB. Datamonitor believes that this will prove to be an attractive
combination, providing consumers with the ability to buy premium content without paying a subscription
fee for access to more mainstream broadcast programming. In preparation for the launch, BT has
boosted its broadband network capacity, and has agreed content deals with a number of major
providers including DreamWorks, Paramount, Warner Music and the FA Premier League (it has won
the ‘near live’ rights to top-flight football coverage from the 2007 season).
Despite strong support from European service providers, Datamonitor believes that IPTV will remain a relatively
niche proposition across much of Europe, with the platform facing stiff competition from existing cable and satellite
services and, increasingly, DTT – around 9.5 million IPTV subscribers are expected across the region by the end
of 2010, with fewer than 9% of digital households connecting via this means.
DTT – IPTV’s friend or foe?
Although DTT is expected to be the largest digital platform in the Europe by the end of 2010 with over 37 million
households connected, the core focus of the platform is likely to remain on free-to-air services – although pay-TV
services are available (TopUp TV in the UK, for example), the vast majority of households will not pay a monthly
subscription fee for DTT. As a result, Datamonitor suggests that the success of DTT can be leveraged by IPTV
operator in some markets.
In countries where DTT is growing rapidly, telcos have sought to partner in order to gain access to a broad range
of popular content. In France, for example, the TNT DTT channels are available via France Telecom’s IPTV
service, while Telefonica provides DTT channels via its hybrid IPTV set-top boxes. BT in the UK is the latest major
service provider to announce a tie-in with DTT – its IPTV strategy will be based around VOD content, with live
broadcast content delivered via Freeview. In other markets such as Sweden and Italy, Datamonitor believes that
DTT services are likely to provide higher levels of competition to IPTV services – in the case of Sweden, the pay-
TV DTT service is in direct competition with both cable and IPTV services, while Italian DTT benefits from access
to top-flight football coverage and a €70 ($88) subsidy per household for STB acquisition.
US market starting to gain traction
In the US, the IPTV market is starting to gather momentum and is now starting to develop beyond the rural
telephone companies who have been delivering TV content over DSL infrastructure for several years – today,
more than 200 US and Canadian telephone companies offer TV-based services over broadband IP networks. All
of the major US carriers have announced their IPTV development roadmaps and are currently undertaking either
limited market tests or technical trials, as outlined below.
• Verizon launched its FiOS TV service in September 2005 – the service is now available in 5 states
including Texas and Florida. The service currently offers 350 broadcast channels (including 20-22 HD
channels) and VOD. The service provider operators an unusual hybrid network that employs IP delivery
for VOD but QAM modulated signals (similar to cable networks) for broadcast TV – the choice of these
Media & Broadcasting Technology – The evolving broadcast sector (Review Report)
Media & Broadcasting Technology – The evolving broadcast sector (Review Report) DMTC1195 / Published 06/2006
© Datamonitor. This brief is a licensed product and is not to be photocopied Page 18
technologies was based on the telco’s desire to use proven technologies, rather than wait for IPTV-
specific technologies to reach maturity. Verizon’s fiber-to-the-home network is capable of delivering up
to 100Mbps to each home, meaning there is no need for advanced coding, even with HD.
• AT&T’s ‘Project Lightspeed’ aims to provide consumers with around 25Mbps capacity through which
television, telephony, and Internet access services will be offered. The project’s goal is to reach 18
million homes in 13 states by the first half of 2008. Unlike Verizon, AT&T uses fiber-to-the-node to feed
ADSL2+ copper networks in last mile. AT&T is in the process of introducing its U-Verse TV service
across this network.
• BellSouth’s IPTV plans are similar in nature to those of AT&T – the carrier intends to provide
consumers with at least 12Mbps of capacity via fiber to the node, fiber to the curb and DSL. BellSouth
doesn’t intend to deploy fiber all the way to the consumers’ premises, making the deployments less
capital intensive than Verizon’s offering. With AT&T set to acquire BellSouth, the latter’s IPTV plans
may fall by the wayside, although Datamonitor expects the deal to help drive developments of TV-
based services in the longer term.
Verizon had connected around 3 million homes with fiber at the end of 2005 and expects to add around 3 million
per year. Datamonitor believes that its strategy is a safe, but ultimately expensive and time consuming one.
Furthermore, the IP-centric plans of AT&T and BellSouth – which employ switched video technology – are likely to
prove more flexible in the long term, allowing an almost unlimited number of channels to be offered and potentially
enabling connectivity with other devices. Problems could arise with this infrastructure, however, when considering
the future need to deliver multiple HD feeds to a household – subscribers wanting to connect either a second TV
set or an HD PVR (which would require two concurrent HD feeds) could easily use up available bandwidth, forcing
the operators to deploy advanced compression technologies to reclaim capacity.
Datamonitor expects the US to be a more difficult market than Europe for IPTV, with high levels of pay-TV
penetration and expected strong price competition from established cable and satellite providers. IPTV operators
will need to pay particular attention to ensuring that their services are not only price competitive, but also deliver
services that are at least as good as existing offerings in terms of reliability, customer services and functionality.
Early suggestions indicate that the major US telcos are seeking to provide similar products to those already
available via cable and satellite – in such an intensely competitive industry, Datamonitor does not expect such
offerings to be hugely successful.
Europe set to maintain its early lead over the US
As illustrated in the following figure, the number of IPTV households is expected to grow rapidly in both Europe
and the US, with a combined 15 million subscribers expected across the two regions by the end of 2010. By the
end of the forecast period, IPTV will account for approximately 8.6% of digital households in Europe and 7.5% in
the US. Datamonitor expects IPTV to make further inroads into the digital TV sector beyond 2010, although
success will depend heavily on content availability and pricing strategies relative to established platforms.
Media & Broadcasting Technology – The evolving broadcast sector (Review Report)
Media & Broadcasting Technology – The evolving broadcast sector (Review Report) DMTC1195 / Published 06/2006
© Datamonitor. This brief is a licensed product and is not to be photocopied Page 19
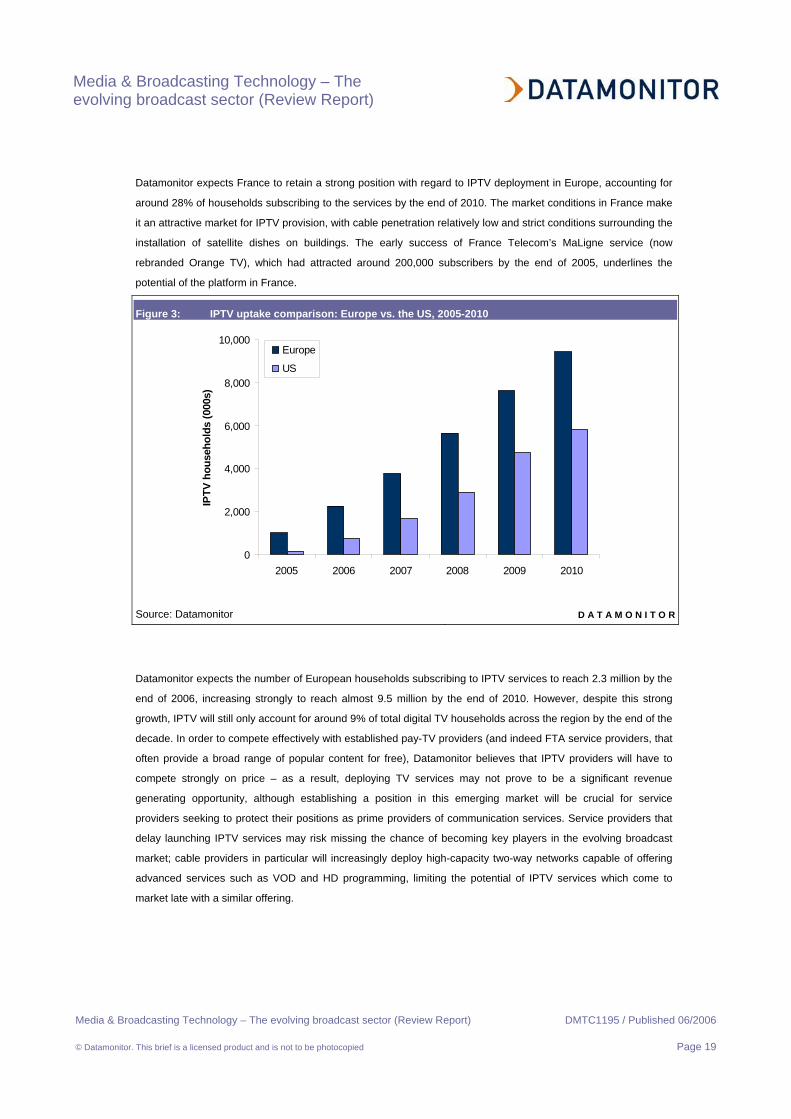
Datamonitor expects France to retain a strong position with regard to IPTV deployment in Europe, accounting for
around 28% of households subscribing to the services by the end of 2010. The market conditions in France make
it an attractive market for IPTV provision, with cable penetration relatively low and strict conditions surrounding the
installation of satellite dishes on buildings. The early success of France Telecom’s MaLigne service (now
rebranded Orange TV), which had attracted around 200,000 subscribers by the end of 2005, underlines the
potential of the platform in France.
Figure 3: IPTV uptake comparison: Europe vs. the US, 2005-2010
0
2,000
4,000
6,000
8,000
10,000
2005 2006 2007 2008 2009 2010
IPTV
hou
seho
lds
(000
s)
Europe
US
Source: Datamonitor D A T A M O N I T O R
Datamonitor expects the number of European households subscribing to IPTV services to reach 2.3 million by the
end of 2006, increasing strongly to reach almost 9.5 million by the end of 2010. However, despite this strong
growth, IPTV will still only account for around 9% of total digital TV households across the region by the end of the
decade. In order to compete effectively with established pay-TV providers (and indeed FTA service providers, that
often provide a broad range of popular content for free), Datamonitor believes that IPTV providers will have to
compete strongly on price – as a result, deploying TV services may not prove to be a significant revenue
generating opportunity, although establishing a position in this emerging market will be crucial for service
providers seeking to protect their positions as prime providers of communication services. Service providers that
delay launching IPTV services may risk missing the chance of becoming key players in the evolving broadcast
market; cable providers in particular will increasingly deploy high-capacity two-way networks capable of offering
advanced services such as VOD and HD programming, limiting the potential of IPTV services which come to
market late with a similar offering.

Media & Broadcasting Technology – The evolving broadcast sector (Review Report)
Media & Broadcasting Technology – The evolving broadcast sector (Review Report) DMTC1195 / Published 06/2006
© Datamonitor. This brief is a licensed product and is not to be photocopied Page 20
Can telcos succeed in the pay-TV environment?
The key challenge for telecoms operators seeking to deploy IPTV services is to take market share from
established cable and satellite providers who have already gained a strong foothold in the pay-TV sector. In this
regard, Datamonitor has identified two main barriers for IPTV providers, as outlined below.
• Industry knowledge – the TV market is a new business area for most telecoms operators, requiring
strong partnerships with content providers to be developed. In order to combat this, a variety of
strategies have been employed by operators; while Belgacom has hired media specialists (its CEO is
the former head of RTL Group), Swisscom has acquired Cinetrade (a pay-TV and cinema group to
develop its media know-how. Datamonitor expects industry knowledge issues to become less apparent
over the coming years as operators ramp up their internal resources in this regard, while content will be
made widely available by content providers as the IPTV market develops.
• Technical issues – in order to compete effectively with digital cable and satellite services, IPTV
offerings need to provide the high picture quality that consumers demand. Minor issues currently being
experienced with some operators are likely to be quickly resolved, while Datamonitor also expects
installation times to fall as operators become more used to physical deployment and overcome initial
obstacles. Another current issue is the fact that it is currently difficult to service multiple-TV households
– indeed, network capacity constraints often prevent operators from providing IPTV services to more
than one TV set. However, Datamonitor expects such issues to be resolved as higher capacity
networks are deployed and new compression technologies are implemented.
Datamonitor sees IPTV primarily as a defensive move by the major service providers rolling out services. While
such services have the potential to generate additional revenues for operators, the key driver of deployment – in
the short term at least – will be improving customer loyalty and adding greater depth to the services provided to
consumers over ADSL networks. In some cases, IPTV may prove to be a financial loss leader, albeit an essential
one if telcos are to retain a significant position with regard to provision of consumer communication and
entertainment services. In the longer term, service providers will need to invest heavily on their network
infrastructure – Datamonitor believes that upgrading to either ADSL2+ or VDSL will become essential if a broad
range of services are to be deployed. When the cost of content acquisition, CPE subsidization and marketing are
factored in, it is difficult to see how the majority of operators will generate significant profit margins from IPTV in
the short term – especially considering the need to be competitive on a pricing basis to generate interest among
consumers.
Consolidation continues to have an impact on market dynamics
Cable consolidation boosts market potential
Consolidation of the European cable industry has continued over the past year, with resultant economies of scale
likely to enable operators to provide increased competition to both satellite operators (in terms of TV-based

Media & Broadcasting Technology – The evolving broadcast sector (Review Report)
Media & Broadcasting Technology – The evolving broadcast sector (Review Report) DMTC1195 / Published 06/2006
© Datamonitor. This brief is a licensed product and is not to be photocopied Page 21
services) and telecoms operators (in terms of both telephony and data services). Some of the more recent
developments in this regard are outlined below.
• French cable consolidation – the French cable market has undergone considerable consolidation
over the last two years. Now, pending terms and regulatory approval, the French network will come
under the ownership of a single company. In March, Liberty Global signed a letter of intent to sell its
cable business to Altice and Cinven. UPC France, which acquired its competitor Noos in 2004, was
valued at €1.25 billion ($1.55bn) – considerably higher than its cash flow. Shortly after the acquisition of
Noos by UPC France, Altice and Cinven acquired the cable businesses of France Telecom (FT Cable)
and Canal+ (Numéricable). Upon completion of the acquisition, Altice and Cinven hold a dominant
position in the French cable network.
• Unity in the German cable market – there was much needed consolidation of the German cable
market in 2005, with first iesy and ish merging under the Unity Media brand, and the combined operator
then acquiring level 4 operator Tele Columbus. The deals mark the first major step in the consolidation
of level 3 and 4 networks in Germany, creating a combined company that will directly provide around
4.5 million households with TV services. Datamonitor believes that such activity is crucial if the German
cable market is to generate the economies of scale needed to provide impetus for digital development.
• ONO acquires Auna – ONO, in partnership with a consortium of private equity partners, acquired the
cable assets of Auna in August 2005 for €2.5 billion ($3.1bn). The two companies had been closing in
on a merger for over a year, with ONO rebuffing a €2.4 billion ($3bn) offer from Auna in November
2004 before tables were ultimately turned with this deal. The merger of the companies’ cable
operations extends combined reach to 6 million Spanish homes, or around 40% of total households.
However, with strong competition from both Digital+ and Telefónica, Datamonitor believes that the
operators will need to compete strongly on price in order to gain market share.
• NTL and Telewest merge at last – the UK pay-TV market has also seen consolidation activity in the
last year with the two leading cable operators, NTL and Telewest, finally agreeing to merge in August
2005. NTL purchased Telewest in a deal worth around £3.4 billion ($6.1bn), creating a company that
has around 5 million subscribers. The merger was essential for the prospects of the UK cable sector;
without the economies of scale created by this move, the companies would doubtless have continued
to struggle to compete with Sky (on a pay-TV basis) and BT (on a telephony and Internet basis).
• Liberty Global now has operations in Switzerland (following it acquisition of Cablecom), the
Netherlands and Belgium. Although the group has recently sold its interests in UPC France and UPC
Sweden, it remains an important player across the European cable sector. Datamonitor expects Liberty
Global to focus its efforts on its Eastern European investments, while its French exit is in line with its
gradual withdrawal from ‘sub-scale’ markets where there are limited opportunities for significant growth.
UPC Sweden was sold to Providence Equity Partners and Carlyle Group, which has also acquired
ComHem to create a strong position in the Swedish market.
Media & Broadcasting Technology – The evolving broadcast sector (Review Report)
Media & Broadcasting Technology – The evolving broadcast sector (Review Report) DMTC1195 / Published 06/2006
© Datamonitor. This brief is a licensed product and is not to be photocopied Page 22
• Adelphia still awaiting sale to be finalized – midway through 2002, Adelphia, a cable operator with
approximately 5 million US subscribers filed for Chapter 11 bankruptcy protection. A significant level of
debt forced the company to undertake a significant restructuring process, including delisting from the
NASDAQ. As a result, Time Warner cable and Comcast agreed to purchase the majority of Adelphia’s
assets in 2005 to the value of $17.6bn in cash and stock. While the deal has not yet been finalized,
Adelphia has asked the bankruptcy court to expedite matters, with completion by the end of July 2006
now widely anticipated.
Satellite consolidation expected in France
There has been significant consolidation activity in the French cable market, the French satellite market is also
seeing some of the action, with Canal+ and TPS expected to merge their operations in 2006. The merger of
Group Canal+ and TPS in France would be controlled by Vivendi Universal (85% share), TF1 (9.9%) and M6
(5.1%). At this stage, only a draft commercial agreement has been signed by the relevant parties – any
subsequent approval of that draft would still leave the merger subject to approval from the French competition
authorities, the French broadcasting authority and relevant unions. However, with similar moves in the Italian,
Spanish and UK satellite markets proving successful in terms of driving digital adoption, Datamonitor expects the
potential merger to occur with few problems. Pooling resources would allow the satellite operators to combat the
growing threat from telco- and Internet-based TV services, with the a merger helping to prevent the costly content
wars that have impacted upon profitability over recent years, while providing greater negotiating power with
content owners and offering improved economies of scale.
In the US, DirecTV is still believed to be interested in buying rival US satellite operator EchoStar, although
regulators seem unlikely to allow such a deal to take place in the short term at least. The two companies tried to
merge in 2002, but the deal was blocked by the FCC, who felt that it would be anti-competitive – with little having
changed in the past 4 years with regard to market structure, Datamonitor believes that similar restrictions will
remain in place. A merger would enable the satellite operators to compete more effectively with cable operators,
and could have a major impact on the dynamics of the US digital TV market – successful satellite mergers across
a number of European markets (including Italy, Spain and the UK) have highlighted the benefits of consolidation
with regard to improving economies of scale and increasing rates of uptake.
Pay-TV operators are seeking to extend the scope of their offerings via acquisitions
While a number of deals have acted to increased levels of consolidation across the pay-TV sector, several
acquisitions aimed at allowing operators to develop their strategies in what are currently non-core areas have
taken place over the course of the past 12 months. Developments in the UK in particular highlight the fact that
pay-TV operators are seeking to extend the scope of their offerings to offer the potential to launch new services
and gain a greater share of consumer spending with regard to communication and entertainment services.
• NTL acquires Virgin Mobile – in early 2006, NTL agreed to acquire MVNO Virgin Mobile for £962
million ($1.7bn), creating the first quad-play offering in the UK. Virgin TV – as the combined company is
expected to be rebranded later in the year – will offer consumers cable TV, broadband and both fixed-

Media & Broadcasting Technology – The evolving broadcast sector (Review Report)
Media & Broadcasting Technology – The evolving broadcast sector (Review Report) DMTC1195 / Published 06/2006
© Datamonitor. This brief is a licensed product and is not to be photocopied Page 23
line and mobile telephony services. The strategy of offering a bundled solution of this type is not a new
one, nor is it limited to the UK – mobile operator Sprint, for example, provides mobile phone services to
customers of the main cable operators in the US via a series of partnerships. However, this acquisition
is a notable development due to the level of investment undertaken by NTL – other deals have been on
a partnership basis rather than involving an actual purchase.
• BSkyB branches into broadband with Easynet purchase – in late 2005, BSkyB acquired UK
broadband operator Easynet for £211 million ($380m) in a move that is the first step towards the
company’s goal of deploying a full triple play of entertainment and communications services. Easynet
has made more progress than most of its rivals in terms of exploiting local loop unbundling
opportunities, with its equipment now residing within around 250 BT exchanges. Sky will be able to
leverage its considerable content assets to offer IPTV and VOD services to extend coverage to those
households that cannot access satellite service, notably those in multi-tenant units and those without
necessary line-of-site – having access to Easynet’s expanding network will allow Sky to offer these
services without having to rely on third party network providers. BSkyB is already offering its
subscribers access to a PC-based VOD offering, although this is only likely to be a short-term measure
in preparation for a true VOD service.
Datamonitor believes that more deals of this type will emerge over the coming 2-3 years as pay-TV operators
seek to extend their coverage and develop their distribution strategies. Offering triple- or quad-play services will
become increasingly crucial as competition for subscribers continues to grow – the ability to offer bundled
services, whereby consumers are offered discounted rates for taking multiple services, is likely to be particularly
crucial. Datamonitor believes that US satellite operators will increasingly seek to offer triple-play services,
although the local loop unbundling regulations seen across Europe are not evident in the US, making it
problematic for DirecTV and EchoStar to exploit DSL-related opportunities without partnering with existing
providers. Industry speculation suggests that DirecTV is looking at WiMAX broadband wireless technology as a
potential way to circumvent this obstacle, while EchoStar is considering a range of options including two-way high-
speed satellite and developing marketing relationships with telcos. Satellite operators in particular are also
expected to follow BSkyB’s lead and evolve their strategies in order to offer a more comprehensive range of
services to meet the changing demands of consumers.
Media & Broadcasting Technology – The evolving broadcast sector (Review Report)
Media & Broadcasting Technology – The evolving broadcast sector (Review Report) DMTC1195 / Published 06/2006
© Datamonitor. This brief is a licensed product and is not to be photocopied Page 24
TECHNOLOGY DEVELOPMENTS IN THE DIGITAL TV SECTOR (TECHNOLOGY FOCUS)
Summary
Competition across the broadcast sector is now greater than ever before, prompting operators to develop their
offerings to both attract and retain subscribers. Operators are increasingly embracing new technologies to achieve
this goal – Datamonitor expects 2006 to be a watershed year in Europe for new services such as high-definition
TV, IPTV and mobile TV, while uptake of PVR technology is set to increase rapidly over the next five years. Key
findings of this brief include:
• high definition expected to become a major service differentiator;
• increasing penetration of PVRs could disrupt existing broadcast business models;
• mobile TV offers new opportunities for broadcasters.
High definition expected to become a major service differentiator
High-definition TV (HDTV) offers a significant improvement in quality of broadcast TV content – in many respects
it is the first step-change in picture quality since the advent of color TV. While HDTV broadcasting has been
available in the US since 1998, European operators are only just starting to roll out commercial services.
Datamonitor believes that HD will become an increasingly crucial component of pay-TV operators’ digital
strategies, with the availability and range of HD programming providing an important differentiator over the next
few years as competition for new subscribers increases.
The US leads the way with regard to high definition
In the US, sales of HD TV sets are around three years ahead of the European market, with approaching 20% of
US households believed to own an HD-capable TV by the end of 2005 – 87% of US households are already
passed by at least one cable operator offering HD services. In contrast, there were only around 2 million ‘HD
ready’ (i.e. with an HD-capable TV) households in Europe at the end of 2005, although the vast majority of these
sets not connected to HD programming due to very limited rollout of service. This, coupled with the fact that the
difference in quality between standard definition and HD programming is not as noticeable in Europe as it is in the
US due to differences between the broadcast technologies used, is likely to result in a continued gap between
development in the two regions. In addition, the fact that average screen sizes are larger in the US means that
demand for HD services are likely to be greater, with picture quality improvements more noticeable on bigger
screens.
Media & Broadcasting Technology – The evolving broadcast sector (Review Report)
Media & Broadcasting Technology – The evolving broadcast sector (Review Report) DMTC1195 / Published 06/2006
© Datamonitor. This brief is a licensed product and is not to be photocopied Page 25
Satellite operators playing catch-up in the US
Over the course of the past two years, both DirecTV and EchoStar have been investing heavily in preparation for
expansion of their HD services. Overall, satellite continues to be at a disadvantage over cable for HD as both
operators build out infrastructure and await a greater supply of MPEG-4 STBs. To date, the satellite operators
have matched cable with regard to national HD services, but have lagged behind in terms of local programming
due to capacity constraints. Datamonitor expects the local HD advantage that cable currently holds to be erased
as both satellite operators deploy true local HD channels using MPEG-4 compression and increasing capacity
coming online from recent satellite deployments. Approximately 50% of satellite households are expected to be
covered with local HD services by the end of 2006; at CES 2006, EchoStar announced that it would offer local HD
programming to 50 markets in 2006, while DirecTV has similar expectations.
Pricing and programming selection will become increasingly important
Pricing will remain an important factor in the US HD market. At present, DirecTV charges $399.99 for an HD-DVR
devices, plus $9.99 per month for HD channel access, while many cable operators currently offer devices for no
upfront fee and provide a basic level of channels for no fee, highlighting the current advantage that cable currently
holds in this regard. However, in the long term, it will be the quality and quantity of HD programming available that
will differentiate services – Datamonitor believes that satellite operators hold the long-term advantage here, with
DirecTV expecting to be providing 150 national HD channels by 2007 – in order for cable operators to match this,
they are likely to have to reclaim analog spectrum in order to provide sufficient capacity, which would involve
increased capital spending and a major push towards digital migration across their subscriber bases. It seems
likely that both DirecTV and EchoStar will have a significant lead over cable operators once upgrades have been
undertaken, with increased capacity enabling the rollout of a far broader portfolio of HD programming than is
currently available.
World Cup boost for European HD market
European operators are well behind their US counterparts with regard to HD development – Euro 1080 was the
first operator to broadcast in high definition in Europe, but its rather limited content portfolio has restricted
consumer demand. However, more mainstream pay-TV operators are now starting to roll out services – both
Telewest and Premiere launched initial services in late 2005, while BSkyB and Sky Italia are now providing
services. A number of European operators and broadcasters have launched HD services in time for the football
World Cup – Premiere, TPS, Sky Italia, Canal Digital and the BBC all broadcast games in HD. With the European
pay-TV market beginning to reach maturity, operators have high hopes for HD as a way to increase ARPU,
reduce churn and increase subscriber numbers – indeed, BSkyB sees HD as a key element of its mission to reach
10 million subscribers by 2010.
The 2006 football World Cup has acted as a catalyst for the first meaningful stage of HD development in Europe –
Datamonitor expects steady adoption over the next two years, with only early adopters willing to invest in the
devices and subscriptions needed to receive HD content. The price of flat-screen HDTV sets is set to fall
significantly over the next few years, providing incentive for households to make the transition – current average
Media & Broadcasting Technology – The evolving broadcast sector (Review Report)
Media & Broadcasting Technology – The evolving broadcast sector (Review Report) DMTC1195 / Published 06/2006
© Datamonitor. This brief is a licensed product and is not to be photocopied Page 26
HDTV prices of around $1,800 in Europe are too high to prompt mass-market development, with this price
probably needing to drop by almost 50% before strong market growth can be expected.
European satellite operators pushing ahead with HD
As expected, early developments in the European HD market have been primarily on satellite platforms – satellite
operators have historically been the first to offer new technologies to their subscribers. Although the cable sector
has often lagged behind satellite with regard to technology development, some cable operators have kept pace in
terms of deployment of HD services, notably Telewest in the UK and UPC in the Netherlands. Some of the main
HD service launches to date are highlighted below.
• Premiere was the first major European pay-TV operator to launch a commercial HD service – the
German satellite operator launched its HD service in November 2005, featuring three specialist
channels for sport, film and documentary programming. However, a shortage of necessary STBs and
limited sales of HD-capable screens has resulted in relatively limited uptake of the service to date.
• Telewest was the first UK operator to launch a nationwide HD service in the UK. The service, which is
available to over 4.5 million homes and costs an extra £10 ($18) per month, requires subscribers to
upgrade to the new TVDrive PVR device, which incorporates a 160GB hard drive. While rival pay-TV
operator Sky offers HD services via a number of dedicated channels, Telewest’s HD content is
currently only available via its on-demand service, Teleport. BSkyB launched its HD service in May –
subscribers to the service will need to pay £299 ($540) for the Sky HD set-top box and an additional
£10 ($18) per month on top of their existing subscription fee.
• TPS’s HD service, jointly promoted by the operator and Sony, was originally planned for 2005, but was
delayed due to an MPEG-4 chip shortage – 10,000 pre-registered subscribers finally received their
HDTV decoders in March. The HD STB costs subscribers an additional €5 ($6) per month compared to
the standard TPS decoder – Datamonitor believes that this is a relatively small premium to pay for HD
services, and should, therefore, help to drive strong interest across TPS’s subscriber base. Rival
French satellite provider, CanalSat, rolled out HD service in time for the World Cup, with a full bouquet
of HD channels expected over the coming months.
• UPC Netherlands have rolled out an HD service in time for the World Cup in partnerships with STB
manufacturer Philips. For a one-off activation fee of €49.99 ($63), UPC’s digital TV subscribers receive
a Philips HD STB and access to two HD channels (one movie channel, one sport). The two companies
are jointly marketing the service alongside Philips’ range of HD-ready flat screen TVs.
• Sky Italia launched its HD service on May 17th with coverage of the European Champions League
football final. Following its coverage of the World Cup, Sky Italia will launch its HD channel bouquet,
which will cost subscribers an extra €7 ($9) per month.
European operators have struggled to date to obtain sufficient numbers of HD-capable STBs – delays relating to a
shortage of the necessary MPEG-4 chipsets have restricted availability, with Sky in the UK believed to be
particularly affected by the problem. Sky was forced to delay the installation of HD in around 17,000 homes
Media & Broadcasting Technology – The evolving broadcast sector (Review Report)
Media & Broadcasting Technology – The evolving broadcast sector (Review Report) DMTC1195 / Published 06/2006
© Datamonitor. This brief is a licensed product and is not to be photocopied Page 27
following early delivery issues with STBs from partner Thomson. The operator has announced that around 40,000
consumers signed up for the service in the first three weeks after launch, although admitted that some of these
would not have the necessary equipment installed prior to the start of the World Cup – a major reason why many
subscribers would have made the investment in the first place. Hence, although the World Cup could have
provided a perfect catalyst for HD development in Europe, the opportunity is likely to be somewhat missed –
although the long term future of HD in Europe is unlikely to be unduly affected, current supply issues could
certainly act to restrict uptake in 2006.
HD services unlikely via DTT in the short term
Although HD services are unlikely to emerge on DTT platforms in the short term due to a lack of available
spectrum prior to analog switch-off, a number of trials are ongoing across Europe to assess the viability of such
services. In the UK, major broadcasters (including the BBC, ITV, Channel 4 and Channel 5) are undertaking a six-
month DTT HD trial, using local frequencies to showcase a selection of HD programming including World Cup
coverage. Trials are also anticipated in France following regulatory approval for a 9-month test phase in a number
of key cities. Once spectrum is available, Datamonitor expects DTT to rapidly become a key platform for HD
services, with the FTA focus of digital terrestrial services in most markets helping to establish HD as a
mainstream, rather than pay-TV, service.
The US will retain its early HD lead over Europe
As shown in the figure below, Datamonitor expects the US to retain its significant lead over Europe with regard to
the penetration of HD services by the end of the decade. By the end of 2010, over 50 million US households will
be viewing HD programming (i.e. they will have invested in an HD-capable television and the necessary STB and
subscription needed to receive HD), representing almost 45% of all TV households across the country. In contrast
only 12 million (or c8% of TV households) will have made the transition by this time.
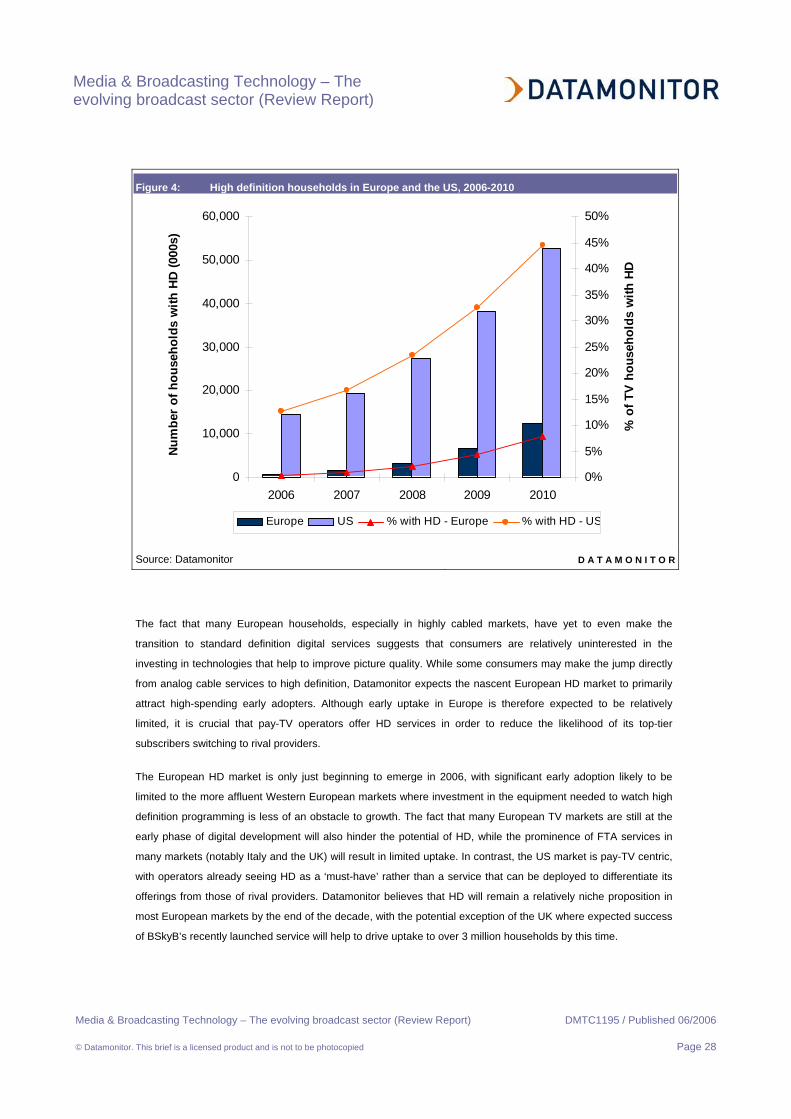
Media & Broadcasting Technology – The evolving broadcast sector (Review Report)
Media & Broadcasting Technology – The evolving broadcast sector (Review Report) DMTC1195 / Published 06/2006
© Datamonitor. This brief is a licensed product and is not to be photocopied Page 28
Figure 4: High definition households in Europe and the US, 2006-2010
0
10,000
20,000
30,000
40,000
50,000
60,000
2006 2007 2008 2009 2010
Num
ber
of h
ouse
hold
s w
ith H
D (0
00s)
0%
5%
10%
15%
20%
25%
30%
35%
40%
45%
50%
% o
f TV
hou
seho
lds
with
HD
Europe US % with HD - Europe % with HD - US
Source: Datamonitor D A T A M O N I T O R
The fact that many European households, especially in highly cabled markets, have yet to even make the
transition to standard definition digital services suggests that consumers are relatively uninterested in the
investing in technologies that help to improve picture quality. While some consumers may make the jump directly
from analog cable services to high definition, Datamonitor expects the nascent European HD market to primarily
attract high-spending early adopters. Although early uptake in Europe is therefore expected to be relatively
limited, it is crucial that pay-TV operators offer HD services in order to reduce the likelihood of its top-tier
subscribers switching to rival providers.
The European HD market is only just beginning to emerge in 2006, with significant early adoption likely to be
limited to the more affluent Western European markets where investment in the equipment needed to watch high
definition programming is less of an obstacle to growth. The fact that many European TV markets are still at the
early phase of digital development will also hinder the potential of HD, while the prominence of FTA services in
many markets (notably Italy and the UK) will result in limited uptake. In contrast, the US market is pay-TV centric,
with operators already seeing HD as a ‘must-have’ rather than a service that can be deployed to differentiate its
offerings from those of rival providers. Datamonitor believes that HD will remain a relatively niche proposition in
most European markets by the end of the decade, with the potential exception of the UK where expected success
of BSkyB’s recently launched service will help to drive uptake to over 3 million households by this time.
Media & Broadcasting Technology – The evolving broadcast sector (Review Report)
Media & Broadcasting Technology – The evolving broadcast sector (Review Report) DMTC1195 / Published 06/2006
© Datamonitor. This brief is a licensed product and is not to be photocopied Page 29
Revenue opportunities may fall as HD becomes more widespread
In the short term, Datamonitor believes that operators will be able to extract significant additional revenue from HD
subscribers, with early adopters of the technology willing to invest in both the necessary hardware and content
subscriptions in order to receive such services. Pay-TV operators realize that those consumers willing to invest in
relatively high-priced HD-capable displays are also likely to be willing to pay a premium for access to HD
programming – European operators have already watched on as their US counterparts have charged consumers
for HD devices and subscription fee to watch a relatively limited range of channels. In the longer term, however,
HD is likely to become the de facto standard for broadcast transmission, reducing its impact as a revenue driver –
operators must therefore look to generate significant interest over the next few years in order to truly benefit from
the rollout of HD services.
With uptake likely to remain relatively low in Europe over the next few years, Datamonitor does not expect HD
services to benefit operators significantly with regard to net additions. However, rolling out HD is a good defensive
strategy, with operators that deploy services likely to experience reduced churn rates and those that delay launch
potentially experiencing a degree of subscriber defection. While the impact with regard to subscriber numbers will
not be significant in the short term, attracting high-spending subscribers will help to boost ARPU, while HD market
leadership will become increasingly important as services begin to target the mass market of consumers. In
addition, with high definition services initially limited to the pay-TV sector, a possibility is presented to operators
with regard to attracting consumers who have not previously had pay-TV services but want to receive HD services
– with FTA DTT services still some way off this offers an opportunity to extend the reach of digital services in
general.
European broadcasters remain undecided with regard to HD formats
With the European high definition market still in the early stages of its development, broadcasters across the
region are still developing their strategies with regard to the provision of HD programming. A key area of debate at
present involves deciding upon which high definition transmission format should be use; HD content is essentially
broken down into two competing formats, 720p and 1080i, with these transmission formats currently being used in
every HD broadcast worldwide.
• 720p – the progressive scan format produces better quality, in particular for fast-moving content such
as sports. There is less blurring, as the entire video is broadcast every split second, rather than the
flickering that may sometimes appear with interlace formats. Progressive formats also offer advantages
with regard to the broadcast of movies, as studios typically shoot films in this format – a broadcaster
using 720p will therefore be able to offer superior image quality. However, because the complete video
frame is being transmitted each time, rather than just half of the video as in interlaced, it requires twice
as much bandwidth – a significant factor in today’s bandwidth constrained broadcast networks.
• 1080i – in an interlaced system, half the lines of the video signal are displayed on a TV screen
alternately, one after the other. The lines are displayed 1/50th of a second apart in Europe, and 1/60th of
a second apart in the US – the difference being due to the competing broadcast formats (PAL and
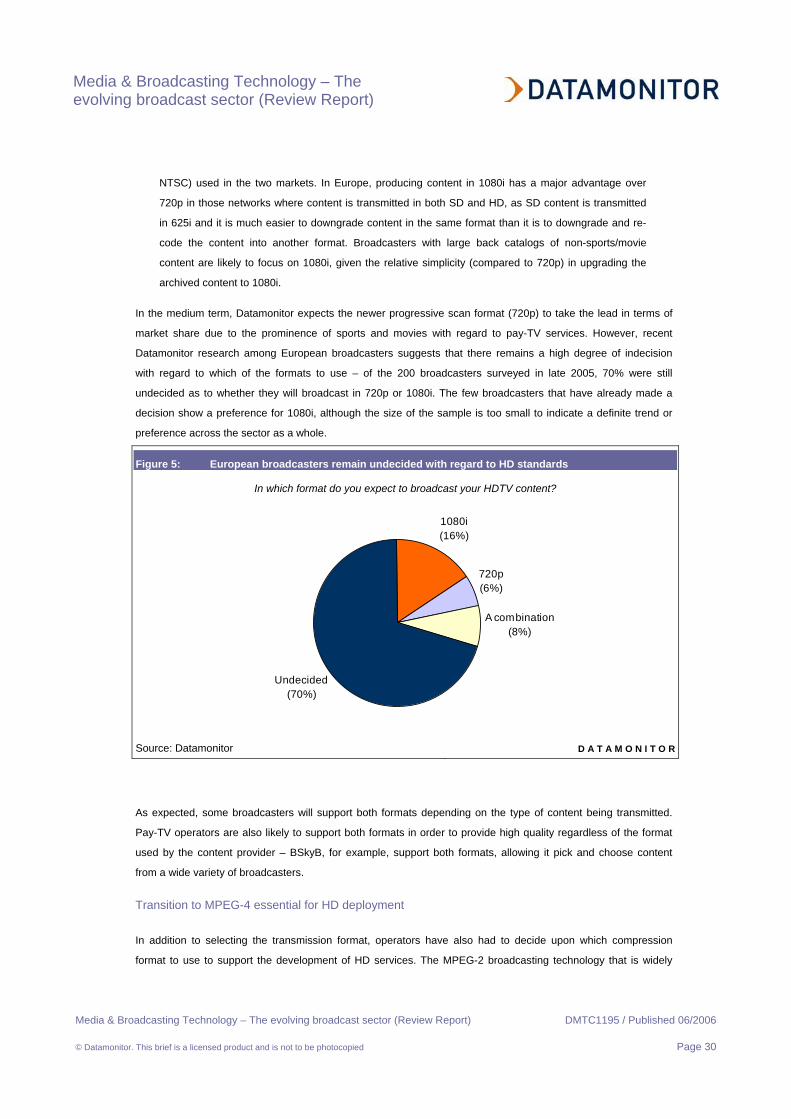
Media & Broadcasting Technology – The evolving broadcast sector (Review Report)
Media & Broadcasting Technology – The evolving broadcast sector (Review Report) DMTC1195 / Published 06/2006
© Datamonitor. This brief is a licensed product and is not to be photocopied Page 30
NTSC) used in the two markets. In Europe, producing content in 1080i has a major advantage over
720p in those networks where content is transmitted in both SD and HD, as SD content is transmitted
in 625i and it is much easier to downgrade content in the same format than it is to downgrade and re-
code the content into another format. Broadcasters with large back catalogs of non-sports/movie
content are likely to focus on 1080i, given the relative simplicity (compared to 720p) in upgrading the
archived content to 1080i.
In the medium term, Datamonitor expects the newer progressive scan format (720p) to take the lead in terms of
market share due to the prominence of sports and movies with regard to pay-TV services. However, recent
Datamonitor research among European broadcasters suggests that there remains a high degree of indecision
with regard to which of the formats to use – of the 200 broadcasters surveyed in late 2005, 70% were still
undecided as to whether they will broadcast in 720p or 1080i. The few broadcasters that have already made a
decision show a preference for 1080i, although the size of the sample is too small to indicate a definite trend or
preference across the sector as a whole.
Figure 5: European broadcasters remain undecided with regard to HD standards
In which format do you expect to broadcast your HDTV content?
Undecided(70%)
A combination(8%)
1080i(16%)
720p(6%)
Source: Datamonitor D A T A M O N I T O R
As expected, some broadcasters will support both formats depending on the type of content being transmitted.
Pay-TV operators are also likely to support both formats in order to provide high quality regardless of the format
used by the content provider – BSkyB, for example, support both formats, allowing it pick and choose content
from a wide variety of broadcasters.
Transition to MPEG-4 essential for HD deployment
In addition to selecting the transmission format, operators have also had to decide upon which compression
format to use to support the development of HD services. The MPEG-2 broadcasting technology that is widely

Media & Broadcasting Technology – The evolving broadcast sector (Review Report)
Media & Broadcasting Technology – The evolving broadcast sector (Review Report) DMTC1195 / Published 06/2006
© Datamonitor. This brief is a licensed product and is not to be photocopied Page 31
used across the digital TV sector for standard definition broadcast does not provide sufficient compression to
allow most operators to deploy a widespread HD service due to the high bandwidth needed to provide HD
channels. Datamonitor expects MPEG-4 to be the most widely deployed next-generation compression format
among established operators (DirecTV and BSkyB have committed to the format), with Microsoft’s WM9 likely to
gain greater traction with emerging IPTV providers – the fact that WM9 currently offers superior compression rates
to MPEG-4, which will be crucial in delivering HD content via European DSL networks.
To make the transition to either of the new compression technologies requires operators to deploy new STBs,
although in the short term only HD subscribers are likely to be required to make this transition due to the high
costs involved with migrating an entire customer base to MPEG-4 or WM9 devices. Datamonitor believes that
operators will increasingly move straight to MPEG-4 or WM9 rather than test the water with lower priced MPEG-2
HD formats in an attempt to remove the need to force consumers to regularly update their STBs.
Key success factors for European HD market development
Datamonitor has identified three key factors that will influence the pace of development with regard to the
European HD market.
• Improved consumer awareness is needed – with high definition services only just starting to make
their mark across Europe, consumer understanding is still limited. While ‘HD ready’ logos are now
commonplace and have helped to reduce confusion with regard to TV purchases, many consumers are
still unaware of the investments that they need to make with regard to STB equipment and pay-TV
subscriptions to actually receive HD programming.
• HDTV prices must continue to fall – unless prices of HD-capable sets continue to fall, the European
market will simply not take off to any meaningful extent. Although prices have fallen considerably in
recent years, price points of LCD/plasma screens (which account for the vast majority of HD TV set
sales) are still far higher than more traditional CRT sets. Unless this situation changes (Datamonitor
hopes and believes it will), HD development is likely to focus in the wealthier Western European
markets. In addition, mass market uptake of HD services will not occur until the STB prices and
subscriptions fall, or are removed completely.
• More native HD content needed – with the exception of live sports broadcasts, much of the HD
content provided in the US is converted from standard definition recordings, reducing visual impact
levels. Datamonitor expects the falling prices of HD equipments to drive the provision of more native
content (i.e. that filmed using HD cameras), which would in turn increase the appeal of HD services.
With many broadcasters across Europe including the BBC now shooting in HD, this situation is likely to
be resolved relatively rapidly.
Although a number of obstacles are likely to restrict widespread uptake of HD services across Europe in the short
term, Datamonitor expects significant progress to be made over the next five years. By rolling out high definition
services, digital TV operators have the opportunity to extend the value proposition to subscribers, helping to boost
satisfaction and potentially reduce churn levels. Whether the European market can gain parity with the US with

Media & Broadcasting Technology – The evolving broadcast sector (Review Report)
Media & Broadcasting Technology – The evolving broadcast sector (Review Report) DMTC1195 / Published 06/2006
© Datamonitor. This brief is a licensed product and is not to be photocopied Page 32
regard to HD over the next 10 years remains to be seen; continuing development of the digital TV market in
general suggests that high definition services will soon become widely deployed, although slow progress in across
the cable sector could impact upon overall development levels. Only when DTT platforms (in particular FTA DTT)
begin to roll out HD services will HD penetration rates begin to come close to those in the pay-TV dominated US
market.
Increasing penetration of PVRs could disrupt existing broadcast business models
Hard disk-based recording devices (PVRs or DVRs, depending on preference for European or US terminology)
have been around for several years, with standalone devices from TiVo starting the ball rolling in 1999. The rollout
of PVR services is central to pay-TV operators’ strategy of increasing ARPU and driving subscriber loyalty.
Offering subscribers the ability to upgrade to PVRs provides operators with the potential to derive increased
revenues from the higher subscription and device fees, while consumers taking a PVR are deemed less likely to
move away from a platform or indeed higher subscription tiers. However, outside of the US (and to an extent, the
UK), uptake has been disappointing to date.
PVRs present a significant threat to traditional business models
PVRs could prove to be a very disruptive technology across the broadcast sector – the fact that consumers are
able to skip advertisements could have a major impact on the business models of broadcasters and platform
operators alike. However, to date, penetration of such devices has only reached significant levels in the US,
where around 18% of households are expected to have a PVR by the end of 2006. In contrast, the European
market has yet to gain any real momentum – fewer than 2% of households are expected to have a PVR by the
end of the year, with BSkyB accounting for a significant proportion of these. As such, the true impact of PVRs may
not be felt for some time, although broadcasters and advertisers must begin to consider how to evolve their
strategies to meet the challenges created by a mass-market move to time-shifted viewing.
PVR owners likely to watch more programming, but fewer adverts
Studies suggest that PVR owners watch up to 20% more television than those without such a device – the fact
that content stored on a PVR is selected specifically by the viewer makes it more likely that they will watch more
of it. In the pay-TV environment, where hundreds of channels are on offer, the ability to tailor viewing habits and
allow consumers to watch programming whenever they want to – and without the interruption of adverts – is a
highly attractive proposition. However, while benefits for consumers and operators are clear, the potential impact
on the advertising market is expected by many to be significant; a number of end-user studies suggest that more
than 40% of PVR owners no longer watch any adverts while watching content in a time-shifted manner,
significantly depleting the impact of TV advertising and therefore affecting the prices that advertisers will be willing
to pay for airtime.

Media & Broadcasting Technology – The evolving broadcast sector (Review Report)
Media & Broadcasting Technology – The evolving broadcast sector (Review Report) DMTC1195 / Published 06/2006
© Datamonitor. This brief is a licensed product and is not to be photocopied Page 33
US networks look to the positives of PVRs
While many industry observers continue to stress the potential impact of PVRs on advertising revenues, the major
US networks – which have much to lose if the prophecy proves to be accurate – have been keen to stress the
potential benefits of the devices. Recent research commissioned by six major networks seeks to ally the fears of
their advertising partners, with survey results suggesting the PVRs will actually boost TV audiences by attracting
viewers who may otherwise have missed the shows when first broadcast. While the research suggested that 90%
of viewers skip commercials when watching programming in a time-shifted manner, 58% of respondents claim
that they still pay attention to the adverts in fast-forward mode.
Product placement likely to feature more prominently
Datamonitor does not believe for one second that the TV advertising market is set for a slow death. However,
channel operators and advertisers will need to overhaul their strategies in response to the increasing penetration
of PVRs, especially in the US where uptake is expected to have reached significant levels by the end of the
decade. Datamonitor believes that there will be a renewed focus on program sponsorship, on-screen mini-
adverts/logos and targeted advertising via the two-way networks deployed by IPTV and some digital cable
operators. Product placement within TV shows is also expected to become particularly popular. Product
placement (across TV, films, magazines and video games) was a multi-billion dollar market in the US in 2005 –
the market is expected to show continued growth, with the chairman of CBS recently predicting that three-quarters
of all scripted prime-time TV programs would soon include paid product placement. In the US, product placement
has had the greatest impact when used alongside traditional 30-second ads – Coca Cola found that audience
recall for their ads was up 49% during American Idol, which was full of product placement.
At present, restrictions over product placement in Europe are very strict; different rules apply across the EU, with
only Austria allowing this practice to be used. European broadcasters in general are allowed to feature
‘surreptitious advertising’, although this has been interpreted differently across the region, prompting a more
unified approach to be developed; European TV companies are set to be allowed to charge for featuring products
in programs following new EU recommendations. European broadcasters and content providers have long argued
that they should be able to exploit this revenue stream, which has been highly successful in the US. Datamonitor
believes that they new guidelines could provide the opportunity for commercial broadcasters to develop new
advertising revenue streams to combat the impact of PVRs.
The US PVR market is well established, while Europe lags behind
As shown in the figure below, PVR penetration is expected to grow strongly over the next few years – by the end
of 2010, 50% of US households and 13% of European homes will have a PVR. PVR availability is high in the US,
with all major operators offering the devices; US cable operators charge an average of an additional $9.95 per
month for PVRs, with widespread availability boosting uptake to over 20% of digital subscribers of Comcast and
Time Warner Cable. DirecTV launched its own standard DVR device in October 2005, severing its previous ties
with standalone device provider TiVo. Th operator introduced a $30 million advertising campaign to promote its

Media & Broadcasting Technology – The evolving broadcast sector (Review Report)
Media & Broadcasting Technology – The evolving broadcast sector (Review Report) DMTC1195 / Published 06/2006
© Datamonitor. This brief is a licensed product and is not to be photocopied Page 34
new offering, the first major marketing effort to distance itself from TiVo and attempt to attract some of the 2.3
million DirecTV subscribers with a TiVo to its own service.
Figure 6: PVR households in Europe and the US, 2006-2010
0
10,000
20,000
30,000
40,000
50,000
60,000
2006 2007 2008 2009 2010
PVR
hou
seho
lds
(000
s)
0%
10%
20%
30%
40%
50%
60%
% o
f TV
hou
seho
lds
with
PV
R
Europe US % with PVR - Europe % with PVR - US
Source: Datamonitor D A T A M O N I T O R
BSkyB has forged a strong position with regard to PVRs, with almost 1.3 million of its subscribers opting for its
Sky+ service by the end of 2005. Although the operator no longer charges a monthly subscription fee to high-end
subscribers (and hence direct revenue returns are limited), churn rates among Sky+ subscribers are far lower
than across the wider subscriber base, highlighting the appeal of such devices. Satellite dominates European
progress with regard to PVRs, with Premiere, Viasat and Canal Satellite and BSkyB all offering the devices.
However, in stark contrast to the US market, cable operators have not yet made a significant impression on the
European PVR market, with Telewest, NTL, Telenet and Casema only recently deploying the devices.
Satellite operators are also likely to utilize push-VOD services to provide subscribers with instant access to
popular titles – Premiere launched a PVR-based service last summer, providing a selection of around 30 movies
that are updated weekly. BSkyB is also considering the launch of push-VOD on its Sky+ service – all PVRs
currently being shipped include reserve storage capacity that could be used for such as service, while its HD
PVRs also feature an Ethernet port to allow DSL connectivity in the longer term. Although push-VOD is an
effective way to deliver a limited selection of content, it cannot compete with the vast libraries of true VOD content
that are becoming commonplace on systems that employ two-way networks.

Media & Broadcasting Technology – The evolving broadcast sector (Review Report)
Media & Broadcasting Technology – The evolving broadcast sector (Review Report) DMTC1195 / Published 06/2006
© Datamonitor. This brief is a licensed product and is not to be photocopied Page 35
Will European pay-TV providers offer PVRs in place of standard STBs?
Although providing subscribers with PVR devices as standard would offer considerable benefits with regard to
reducing customer churn, Datamonitor expects European pay-TV operators to continue to position PVRs as a
premium offering for the foreseeable future – not only would providing new subscribers with PVRs for no
additional fee be costly, but it would also aggravate existing subscribers who would likely still need to pay for an
upgrade (a wholesale box switch-out seems highly unlikely). Datamonitor believes that it is unlikely that European
operators will provide PVRs as the standard device for new subscribers in the short term for the following reasons:
• High deployment costs – the costs involved in providing PVRs for free would be much higher than is
currently the case with standard STBs. In addition, operators who decide to offer them to new
subscribers would be forced to consider a swap-out of all devices in order to keep existing subscribers
happy – this would be hugely expensive, potentially in excess of $2 billion for an operator of BSkyB’s
scale.
• Lack of cable competition – the fact that cable companies do not provide significant pay-TV
competition in most European markets means that satellite operators do not need to differentiate their
offerings substantially. If, however, with some cable operators (and increasingly, IPTV providers)
providing VOD services, PVR rollout would become a more attractive proposition to pay-TV operators.
The possibility of providing PVRs as standard in the US market is more likely, where very high levels of pay-TV
competition mean that operators need to differentiate their services in order to win new business. Whether this
strategy will be followed remains to be seen, although Datamonitor certainly expects downward pressure with
regard to monthly subscription over the next 2-3 years.
Potential for expansion into the FTA sector
At present, PVR uptake has been largely limited to the pay-TV sector, with operators rolling out devices in an
attempt to boost subscriber revenues and reduce churn levels. However, Datamonitor believes that DTT will be an
increasingly important platform for PVRs over the next few years. To date, PVR uptake across the DTT market
has been very limited, with the majority of households opting for low-cost STBs. However, the falling costs of DTT
PVRs is expected to prompt increased interest among consumers – in the UK, such devices can now be acquired
for around £120 ($215), which will boost appeal. Given the expected rapid growth of the DTT market across
Europe, Datamonitor believes that PVR manufacturers and their distribution partners should ramp up their focus
on the platform in order to exploit what will be a major area of opportunity.
In the UK, Freeview plans to launch a digital video recorder brand in order to increase consumer awareness of the
technology and boost uptake of devices. Recent research has highlighted the fact that awareness remains low,
while only a small proportion of the c7 million UK DTT households have invested in a PVR. The ‘Freeview
Playback’ brand hopes to achieve this goal, while manufacturers and retailers will be urged to use more consistent
terminology to reduce consumer confusion. Datamonitor believes that more widespread marketing campaigns of
this nature will be needed across Europe if PVRs are to show significant uptake across the FTA sector, with both
DTT and the German FTA satellite sector offering strong potential for equipment manufacturers.
Media & Broadcasting Technology – The evolving broadcast sector (Review Report)
Media & Broadcasting Technology – The evolving broadcast sector (Review Report) DMTC1195 / Published 06/2006
© Datamonitor. This brief is a licensed product and is not to be photocopied Page 36
Network PVR services have potential, but deployment won’t be easy
In March, US cable operator Cablevision announced the launch of a network PVR offering, whereby content is
stored on centralized servers. The system provides similar functionality to the hard disk based devices that have
been commonly deployed across the US by rival pay-TV operators, but allows consumers with standard STBs to
receive the same benefits without needing to upgrade their device to a more expensive DVR box. As well as
providing cost benefits for its customers, Cablevision also expects to save money by removing the need for
sending an installer out to subscribers’ homes to upgrade STBs.
However, seven leading movie and TV producers have filed a lawsuit against the cable operator, claiming that the
proposed services break copyright laws – Cablevision has argued that it does not to obtain additional content
rights for the service, as it is essentially no different to distributing PVR devices to its subscribers. Time Warner
Cable assessed the potential of deploying network PVR services several years ago, but shelved plans having
concluded that their were too many copyright hurdles to overcome. Datamonitor believes that many rival cable
operators will be watching the outcome of the lawsuit carefully, with the clear economic benefits of centralizing
storage making such services highly attractive. IPTV service providers will also seek to offer network-based PVR
storage in order to leverage the two-way, high capacity nature of their networks.
Mobile TV offers new opportunities for broadcasters
The emergence of mobile broadcast TV services provides broadcasters with yet another new distribution channel
through which they can deliver content to consumers. Although Datamonitor does not expect mobile TV uptake to
reach mass market proportions over the next few years, the market is expected to develop considerably over the
remainder of the decade, providing significant new opportunities for companies across the value chain –
broadcasters, device manufacturers and network providers all stand to benefit considerably from these new
opportunities.
Mobile networks are not best suited to the demands of mass market video services
Mobile operators are already offering video download services to their customers on 2.5 and 3G networks, but
these are not true broadcast TV services. The content is streamed to subscribers’ phones when it is requested
using the operator’s 2.5/3G network infrastructure. Initially these offerings began as video download services, but
now it is possible to access content such as news channels, cartoon channels, music channels and (the extremely
popular) reality TV channels. Early evidence suggests that these services are attracting more consumers than
originally expected, prompting operators and broadcasters alike to focus increased efforts on mobile TV
opportunities. However, 3G networks do not have the capacity needed to support mass market services,
prompting operators to examine the possibilities of offering services over broadcast networks.

Media & Broadcasting Technology – The evolving broadcast sector (Review Report)
Media & Broadcasting Technology – The evolving broadcast sector (Review Report) DMTC1195 / Published 06/2006
© Datamonitor. This brief is a licensed product and is not to be photocopied Page 37
Broadcast technologies battling it out for supremacy
There are essentially three different technologies fighting it out to be the standard for mobile TV broadcast
technology – DVB-H, DMB and MediaFLO –a fourth, ISDB-T, unlikely to gain any traction outside of Japan. DMB
was the first technology to be used in commercial services (in South Korea), while commercial services built on
DVB-H are in the process of being deployed in Italy. The following figure provides a brief overview of each of
these technologies in addition to Datamonitor’s opinion with regard to its market potential.
Figure 7: Mobile TV broadcast technology overview
• Developed in Japan. The open standard was created for digital radio, video and multimedia services, and the Japanese DTT network began broadcasting in 2003 using the standard.
• Currently operates via continuous transmissions, which reduces the time for channel changes, but also results in high battery usage.
• Developed by Qualcomm, the company behind mobile communication standard CDMA. Qualcomm is investing $100s millions building a nationwide mobile video network in the US.
• Offers twice the channel count, or half the infrastructure cost,of DVB-H – more efficient time-slicing than DVB-H. Faster channel changing than DVB-H at around 2 seconds.
• The only broadcast TV technology to have been commercially deployed by the end of 2005 (in South Korea).
• Leveraged from the digital radio technology, Digital Audio Broadcast (DAB). Can be divided into two headline technologies: satellite (S-DMB) and terrestrial (T-DMB).
• High power consumption due to lack of time-slicing capability.
• DVB-H, where “H” stands for handheld, is the newest technology from the Digital Video Broadcasting forum. Aimed at the mobile phone and portable device market, it is an extension of DVB-T, the digital terrestrial television standard.
• Time-slicing capability is a key feature; data is delivered to the phone in time-delayed bursts, enabling the tuner to switch off between bursts and hence reduce power consumption.
• However, time-splicing also has an adverse effect on channel switching response times, expected to be at least 3-5 seconds.
Overview
• Limited to Japan, where it is expected to dominate completely.
ISDB-T
• Likely to vie with DVB-H for US supremacy, while European success will be more difficult due to Nokia’s support for DVB-H.
• Requires less spectrum than DVB-H, which could prove essential.
MediaFLO
• Potential to be a leading global player, but trails DVB-H and MediaFLO in Europe and the US. Ability to offer mobile TV over DAB networks may provide a short-term advantage
• Limited channel support will restrict depth of services.
DMB
• Open standards approach and support from Nokia will ensure success in Europe.
• Chances of success in the US boosted by creation of Mobile TV Alliance.
• Ability to support a large number of channels.
DVB-H
Outlook
Source: Datamonitor D A T A M O N I T O R
A crucial determinant with regard to which technology will win out will be spectrum availability – both DVB-H and
MediaFLO need additional spectrum capacity in order to deploy broadcast TV networks. Although the necessary
spectrum has been allocated in the US, the European market is more problematic, with many governments
suggesting that widespread availability for mobile TV services will not be possible prior to the switch-off of analog
terrestrial TV services. With DMB already able to operate in most markets over the DAB digital radio networks, the
technology could have a significant head start in many markets, although the current limitations of the technology
with regard to limited channel capacity and high power consumption are likely to degrade its long-term potential.
That said, should DVB-H and MediaFLO continue to be plagued by spectrum issues, DMB could conceivably
forge a strong first-mover advantage across Europe.

Media & Broadcasting Technology – The evolving broadcast sector (Review Report)
Media & Broadcasting Technology – The evolving broadcast sector (Review Report) DMTC1195 / Published 06/2006
© Datamonitor. This brief is a licensed product and is not to be photocopied Page 38
DVB-H expected to be the long term victor
As illustrated in the following figure, Datamonitor expects DVB-H to become the most widely deployed mobile TV
broadcast technology in the medium term, with over 90 million handsets shipping with the technology installed in
2009. At this point, DVB-H will account for around 54% of mobile TV device shipments, with MediaFLO gaining
most traction in the US but failing to gain widespread support in Europe. DMB will continue to dominate across
much of Asia, and will have a role to play in the development of the European market, while ISDB-T will remain
confined to Japan.
Figure 8: Global mobile TV handsets by broadcast technology standard, 2006-2009
0
10
20
30
40
50
60
70
80
90
100
2006 2007 2008 2009
Mob
ile T
V ha
ndse
t shi
pmen
ts (m
)
DMB / DAB-IPDVB-H ISDB-T MediaFLO
Source: Datamonitor D A T A M O N I T O R
Mobile TV trials ongoing across Europe
Mobile TV trials are now widespread across the Europe, with a series of commercial launches planned over the
remainder of 2006 and into 2007.
Italy set to be the DVB-H trailblazer
3 Italia launched a 20-channel DVB-H service in June to coincide with the start of the 2006 World Cup; the
operator has acquired rights to all 64 World Cup games from FIFA as part of the €50m ($60m) annual budget it
has set aside for content. 3 possesses the broadcast frequencies needed to launch the service following its recent
acquisition of commercial broadcaster Canale 7; the service was available to 70% of the Italian population upon
launch, who will be able to choose from two different handsets manufactured by LG and Samsung. 3 Italia hopes

Media & Broadcasting Technology – The evolving broadcast sector (Review Report)
Media & Broadcasting Technology – The evolving broadcast sector (Review Report) DMTC1195 / Published 06/2006
© Datamonitor. This brief is a licensed product and is not to be photocopied Page 39
to attract 500,000 subscribers by the end of the year which seems to be a high target considering the nascent
nature of the market.
3 Italia’s service will directly compete with Telecom Italia’s DVB-H offering. Telecom Italia launched its DVB-H
service in June using Samsung handsets which support both the mobile broadcast technology and 3G services for
multimedia functionality. Non-exclusive agreements with both Telecom Italia Media and Mediaset will offer access
to programming content from broadcasters such as Canale 5 and MTV Italia, including live Champions League
football coverage. Telecom Italia believes that up to half of its 30 million mobile subscribers could be equipped
with TV-capable handsets by 2008. Mediaset is also partnering with Vodafone Italia for the launch of DVB-H
services. Vodafone will use Mediaset’s multiplex capacity, and will also make its technology and broadcast
infrastructure available to increase coverage and enable rollout later in 2006. Datamonitor expects Italy to be one
of the most successful markets for mobile TV services over the next 2-3 years, driven by high levels of mobile
penetration and the availability of necessary spectrum following Mediaset’s agreement with Europa TV.
Further European mobile TV launches expected soon
While the Italian market is currently leading the way with regard to mobile TV developments across Europe, trials
are ongoing across almost all European markets in preparation for commercial deployment. Some of these trials
are outlined below.
• Virgin, NTL and Microsoft are teaming up to offer the UK’s first mobile broadcast service, which is
expected to launch in summer 2006 following extensive 5-month trials. The service will run over the
UK’s established DAB network using BT’s wholesale Movio service, and will provide at least five
channels.
• Plans for DVB-H and T-DMB in Germany – regulators have agreed to allocate nationwide licences for
both technology formats, with services expected to be launched this summer. While DVB-H services
will provide around 20 channels, T-DMB will offer far fewer – potentially only 4. This highlights the
capacity constraints of DMB technology, which Datamonitor believes may hinder its long-term potential.
• MediaFLO set for European debut – BSkyB is set to trial Qualcomm’s broadcast mobile TV
technology in Cambridge this summer, marking the European debut of MediaFLO. Qualcomm argues
that its technology provides considerable benefits over competing technologies such as DVB-H and
DAB in terms of deployment cost and channel capacity. The closed technical trial will initially involve
around 100 users, which may eventually be extended to involve members of the public. Separate trials
with UK broadcasters and mobile operators are also believed to be in the pipeline, although such
companies will not be involved in the initial test phase.
• Digita, which obtained a DVB-H license from the Finnish government earlier in 2006, has signed the
world’s first commercial DVB-H mobile TV platform supply contract with Nokia. As part of the deal,
Nokia will provide its Broadcast Solution 3.0, which supports the broadcasting of different digital content
types over DVB-H networks. The first stages of Finnish DVB-H network development are already
underway, with 29% nationwide coverage expected by the end of the year.
Media & Broadcasting Technology – The evolving broadcast sector (Review Report)
Media & Broadcasting Technology – The evolving broadcast sector (Review Report) DMTC1195 / Published 06/2006
© Datamonitor. This brief is a licensed product and is not to be photocopied Page 40
• Dutch trials – European satellite operator, SES Astra, has teamed up with KPN and network provider
Nozema to trial DVB-H services to a select number of KPN’s mobile subscribers. As part of the trial,
which was announced back in September 2005, Astra will provide a feed of content showing recent
movie trailers, with an interactive quiz integrated to evaluate the opportunities for mobile interactive
services.
• French DVB-H trial confirm consumer interest – a DVB-H trial in France involving Canal+, Nokia
and mobile operator SFR has revealed that almost two-thirds of trialists would consider subscribing to
the service, boosting expectations that the country will prove a fertile ground for mobile TV services.
Meanwhile, Samsung has announced that it will work with Bouygues Telecom, TF1 and digital network
provider VDL to trial T-DMB services.
• DVB-H trial in Spain – network operator Abertis Telecom, mobile firm Amena and Nokia have recently
joined forces to launch Spain’s third DVB-H trial – the announcement follows previous pilots led by
Telefónica and Vodafone. The trial is set to run until summer 2007, with the service likely to be
marketed from the end of 2006 – previous – early indications suggest that around 55% of trialists would
be willing to subscribe to the service. Datamonitor expects Spain to be a strong market for mobile TV
services, emphasized by the strong support that is being given by leading market participants.
The sheer numbers of trials being undertaken across Europe suggest that mobile TV services will begin to deploy
in earnest during 2007, although widespread deployment of DVB-H based services will be heavily dependent on
the availability of necessary spectrum.
Leading industry players get behind DVB-H in the US
In the US, spectrum for mobile TV services has been allocated and sold to Qualcomm (MediaFLO-based services
at 700 MHz) and Modeo (DVB-H services at 1670-1675 MHz); both firms are currently deploying national
broadcast networks across around 30 markets. Both network operators will provide their services on a wholesale
basis, with Qualcomm planning to launch its network in October 2006 – Verizon Wireless, the largest US CDMA
carrier, will be the first mobile operator to use the MediaFLO network for delivery of mobile TV services. Modeo,
which has conducted trials of its network in Pittsburgh, is expected to launch services in the summer of 2006 in
selected markets. Cingular Wireless, the largest GSM carrier, is widely expected to be one of the main operators
to deploy services over the DVB-H network. Datamonitor expects the two rival technologies to coexist in the US
market while the mobile TV sector remains in an embryonic state, although increasing industry support behind
DVB-H may boost its potential.
Support for DVB-H grows
Although MediaFLO appears to have forged an early leadership position in the US, supporters of DVB-H have
grouped together to extol the virtues of the standard. Created in early 2006, the Mobile TV Alliance (founded by
Intel, Nokia, Modeo and Texas Instruments) will promote DVB-H in North America. Sony Ericsson has recently
joined the alliance, adding further to the momentum behind DVB-H in the US. Datamonitor believes that
increasingly broad support for DVB-H will help to build economies of scale with regard to handsets, boosting the
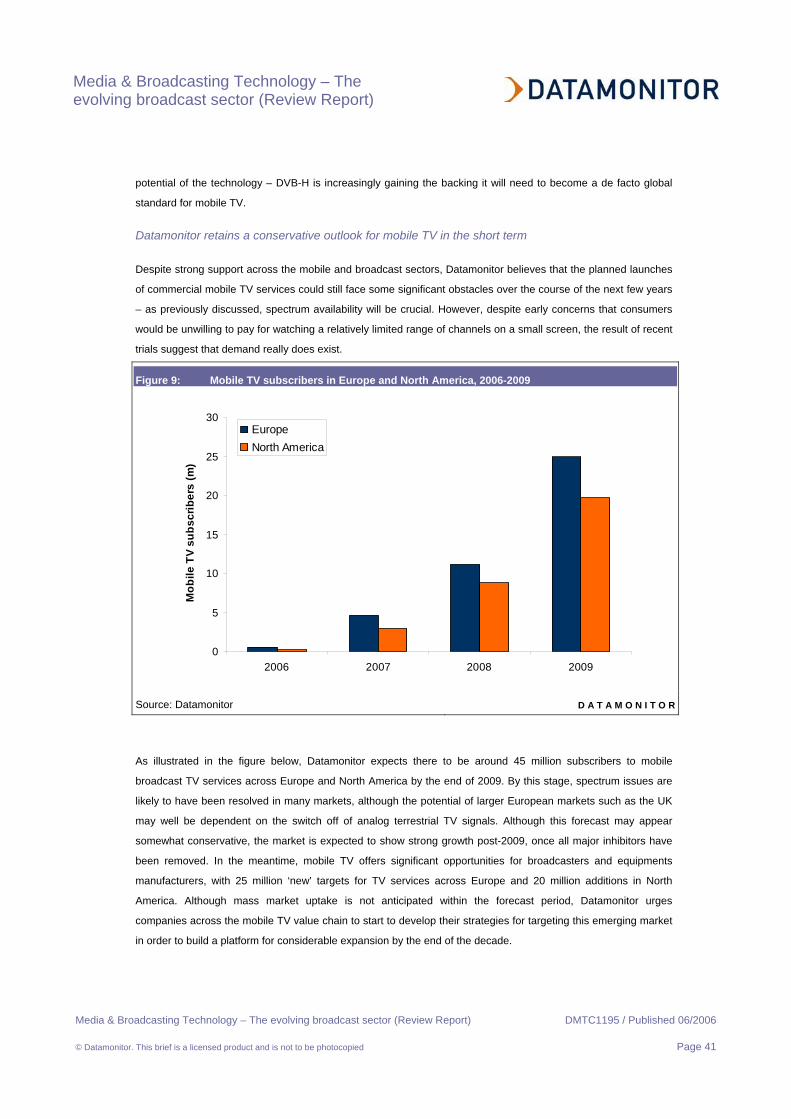
Media & Broadcasting Technology – The evolving broadcast sector (Review Report)
Media & Broadcasting Technology – The evolving broadcast sector (Review Report) DMTC1195 / Published 06/2006
© Datamonitor. This brief is a licensed product and is not to be photocopied Page 41
potential of the technology – DVB-H is increasingly gaining the backing it will need to become a de facto global
standard for mobile TV.
Datamonitor retains a conservative outlook for mobile TV in the short term
Despite strong support across the mobile and broadcast sectors, Datamonitor believes that the planned launches
of commercial mobile TV services could still face some significant obstacles over the course of the next few years
– as previously discussed, spectrum availability will be crucial. However, despite early concerns that consumers
would be unwilling to pay for watching a relatively limited range of channels on a small screen, the result of recent
trials suggest that demand really does exist.
Figure 9: Mobile TV subscribers in Europe and North America, 2006-2009
0
5
10
15
20
25
30
2006 2007 2008 2009
Mob
ile T
V su
bscr
iber
s (m
)
EuropeNorth America
Source: Datamonitor D A T A M O N I T O R
As illustrated in the figure below, Datamonitor expects there to be around 45 million subscribers to mobile
broadcast TV services across Europe and North America by the end of 2009. By this stage, spectrum issues are
likely to have been resolved in many markets, although the potential of larger European markets such as the UK
may well be dependent on the switch off of analog terrestrial TV signals. Although this forecast may appear
somewhat conservative, the market is expected to show strong growth post-2009, once all major inhibitors have
been removed. In the meantime, mobile TV offers significant opportunities for broadcasters and equipments
manufacturers, with 25 million ‘new’ targets for TV services across Europe and 20 million additions in North
America. Although mass market uptake is not anticipated within the forecast period, Datamonitor urges
companies across the mobile TV value chain to start to develop their strategies for targeting this emerging market
in order to build a platform for considerable expansion by the end of the decade.

Media & Broadcasting Technology – The evolving broadcast sector (Review Report)
Media & Broadcasting Technology – The evolving broadcast sector (Review Report) DMTC1195 / Published 06/2006
© Datamonitor. This brief is a licensed product and is not to be photocopied Page 42
DIGITAL TV DEVELOPMENT: MAJOR EUROPEAN MARKETS & THE US (DATABOOK)
Introduction
This databook provides datasets relating to uptake of digital TV services across the following markets:
• France;
• Italy;
• Germany;
• Spain;
• the UK;
• the US.
It provides a breakdown of digital households by both platform (satellite, cable, DTT and IPTV) and operator.
The following table contains detailed definitions relating to the digital TV sector.
Table 1: Digital TV definitions
DTT Digital Terrestrial Television (DTT) is an implementation of digital technology to provide broadcast content through a conventional antenna (or aerial) instead of via satellite dish or cable connection. The technology used is ATSC in North America and DVB-T in Europe.
IPTV IPTV (Internet Protocol Television) is an emerging threat to existing cable and satellite pay-TV operators – service providers are increasing providing digital television services using Internet Protocol over broadband networks to offer their customers triple play services.
Datamonitor D A T A M O N I T O R

Media & Broadcasting Technology – The evolving broadcast sector (Review Report)
Media & Broadcasting Technology – The evolving broadcast sector (Review Report) DMTC1195 / Published 06/2006
© Datamonitor. This brief is a licensed product and is not to be photocopied Page 43
Market development comparison: Europe & US
Digital TV uptake comparison: Europe vs. the US
Figure 10: Digital TV uptake comparison: Europe vs. the US, 2005-2010
0
20,000
40,000
60,000
80,000
100,000
120,000
2005 2006 2007 2008 2009 2010
Dig
ital T
V ho
useh
olds
(000
s)
0%
10%
20%
30%
40%
50%
60%
70%
80%
% o
f hou
seho
lds
with
dig
ital T
V
Europe US % digital - Europe % digital - US
Source: Datamonitor D A T A M O N I T O R
Table 2: Digital TV uptake comparison: Europe vs. the US, 2005-2010
(000 households) 2005 2006 2007 2008 2009 2010
Europe 52,201 64,909 77,707 89,390 100,015 109,425
US 53,941 59,480 64,529 69,183 73,995 77,739
% digital - Europe 34% 41.7% 49.7% 57.0% 63.5% 69.2%
% digital - US 48% 52.0% 55.9% 59.4% 62.9% 65.7%
Source: Datamonitor D A T A M O N I T O R
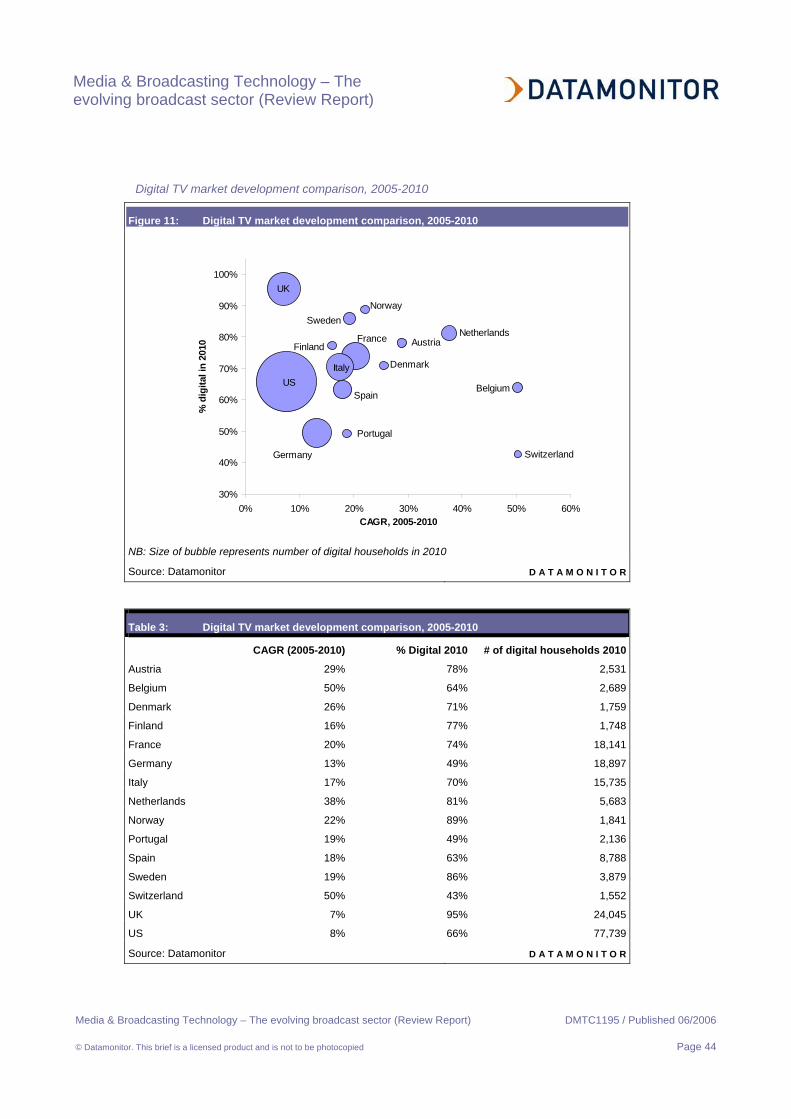
Media & Broadcasting Technology – The evolving broadcast sector (Review Report)
Media & Broadcasting Technology – The evolving broadcast sector (Review Report) DMTC1195 / Published 06/2006
© Datamonitor. This brief is a licensed product and is not to be photocopied Page 44
Digital TV market development comparison, 2005-2010
Figure 11: Digital TV market development comparison, 2005-2010
Italy
Germany
Portugal
Denmark
Finland France
Spain
Netherlands Austria
Switzerland
Sweden Norway
Belgium US
UK
30%
40%
50%
60%
70%
80%
90%
100%
0% 10% 20% 30% 40% 50% 60%CAGR, 2005-2010
% d
igita
l in
2010
NB: Size of bubble represents number of digital households in 2010
Source: Datamonitor D A T A M O N I T O R
Table 3: Digital TV market development comparison, 2005-2010
CAGR (2005-2010) % Digital 2010 # of digital households 2010
Austria 29% 78% 2,531
Belgium 50% 64% 2,689
Denmark 26% 71% 1,759
Finland 16% 77% 1,748
France 20% 74% 18,141
Germany 13% 49% 18,897
Italy 17% 70% 15,735
Netherlands 38% 81% 5,683
Norway 22% 89% 1,841
Portugal 19% 49% 2,136
Spain 18% 63% 8,788
Sweden 19% 86% 3,879
Switzerland 50% 43% 1,552
UK 7% 95% 24,045
US 8% 66% 77,739
Source: Datamonitor D A T A M O N I T O R

Media & Broadcasting Technology – The evolving broadcast sector (Review Report)
Media & Broadcasting Technology – The evolving broadcast sector (Review Report) DMTC1195 / Published 06/2006
© Datamonitor. This brief is a licensed product and is not to be photocopied Page 45
Digital TV households in Europe by platform, 2005-2010
Figure 12: Digital TV households in Europe by platform, 2005-2010
0
5,000
10,000
15,000
20,000
25,000
30,000
35,000
40,000
2005 2006 2007 2008 2009 2010
Digi
tal T
V h
ouse
hold
s (0
00s)
0%
10%
20%
30%
40%
50%
60%
70%
80%
90%
100%
% o
f hou
seho
lds
with
dig
ital T
V
Digital cable Digital satellite Digital terrestrial IPTV % digital
Source: Datamonitor D A T A M O N I T O R
Table 4: Digital TV households in Europe by platform, 2005-2010
(000 households) 2005 2006 2007 2008 2009 2010
TV households 155,015 155,643 156,274 156,907 157,542 158,166
Digital cable 12,544 16,012 20,146 23,882 27,507 30,655
Digital satellite 23,788 25,670 27,330 28,849 30,240 31,487
Digital terrestrial 14,863 20,947 26,436 30,998 34,642 37,830
IPTV 1,007 2,281 3,795 5,661 7,625 9,454
Total digital 52,201 64,909 77,707 89,390 100,015 109,425
% digital 34% 42% 50% 57% 63% 69%
Source: Datamonitor D A T A M O N I T O R
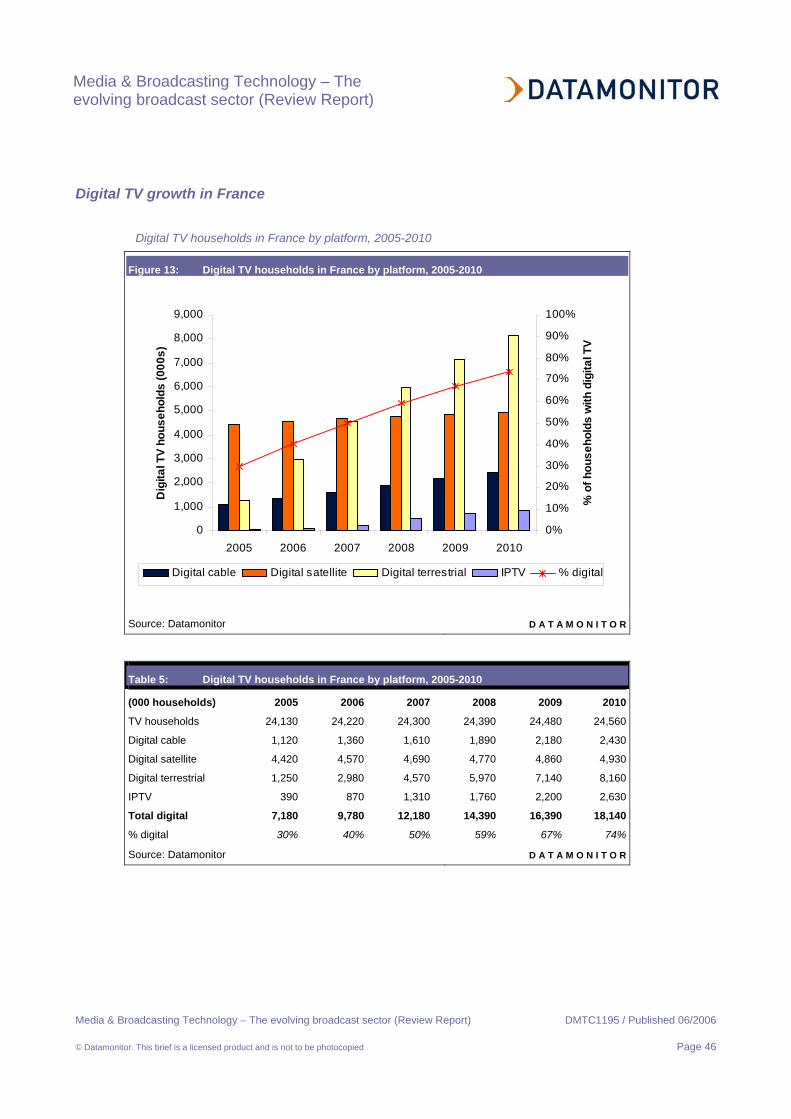
Media & Broadcasting Technology – The evolving broadcast sector (Review Report)
Media & Broadcasting Technology – The evolving broadcast sector (Review Report) DMTC1195 / Published 06/2006
© Datamonitor. This brief is a licensed product and is not to be photocopied Page 46
Digital TV growth in France
Digital TV households in France by platform, 2005-2010
Figure 13: Digital TV households in France by platform, 2005-2010
0
1,000
2,000
3,000
4,000
5,000
6,000
7,000
8,000
9,000
2005 2006 2007 2008 2009 2010
Dig
ital T
V ho
useh
olds
(000
s)
0%
10%
20%
30%
40%
50%
60%
70%
80%
90%
100%
% o
f hou
seho
lds
with
dig
ital T
VDigital cable Digital satellite Digital terrestrial IPTV % digital
Source: Datamonitor D A T A M O N I T O R
Table 5: Digital TV households in France by platform, 2005-2010
(000 households) 2005 2006 2007 2008 2009 2010
TV households 24,130 24,220 24,300 24,390 24,480 24,560
Digital cable 1,120 1,360 1,610 1,890 2,180 2,430
Digital satellite 4,420 4,570 4,690 4,770 4,860 4,930
Digital terrestrial 1,250 2,980 4,570 5,970 7,140 8,160
IPTV 390 870 1,310 1,760 2,200 2,630
Total digital 7,180 9,780 12,180 14,390 16,390 18,140
% digital 30% 40% 50% 59% 67% 74%
Source: Datamonitor D A T A M O N I T O R
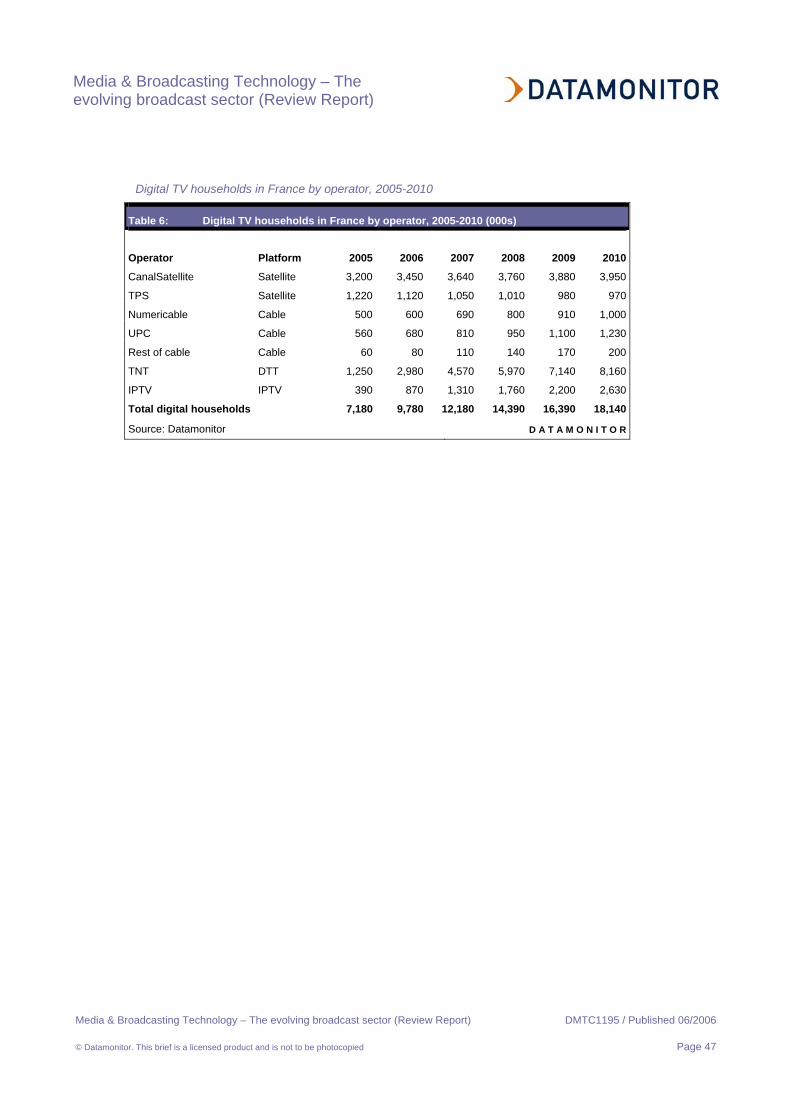
Media & Broadcasting Technology – The evolving broadcast sector (Review Report)
Media & Broadcasting Technology – The evolving broadcast sector (Review Report) DMTC1195 / Published 06/2006
© Datamonitor. This brief is a licensed product and is not to be photocopied Page 47
Digital TV households in France by operator, 2005-2010
Table 6: Digital TV households in France by operator, 2005-2010 (000s)
Operator Platform 2005 2006 2007 2008 2009 2010
CanalSatellite Satellite 3,200 3,450 3,640 3,760 3,880 3,950
TPS Satellite 1,220 1,120 1,050 1,010 980 970
Numericable Cable 500 600 690 800 910 1,000
UPC Cable 560 680 810 950 1,100 1,230
Rest of cable Cable 60 80 110 140 170 200
TNT DTT 1,250 2,980 4,570 5,970 7,140 8,160
IPTV IPTV 390 870 1,310 1,760 2,200 2,630
Total digital households 7,180 9,780 12,180 14,390 16,390 18,140
Source: Datamonitor D A T A M O N I T O R

Media & Broadcasting Technology – The evolving broadcast sector (Review Report)
Media & Broadcasting Technology – The evolving broadcast sector (Review Report) DMTC1195 / Published 06/2006
© Datamonitor. This brief is a licensed product and is not to be photocopied Page 48
Digital TV growth in Germany
Digital TV households in Germany by platform, 2005-2010
Figure 14: Digital TV households in Germany by platform, 2005-2010
0
2,000
4,000
6,000
8,000
10,000
12,000
2005 2006 2007 2008 2009 2010
Dig
ital T
V ho
useh
olds
(000
s)
0%
10%
20%
30%
40%
50%
60%
70%
80%
90%
100%
% o
f hou
seho
lds
with
dig
ital T
VDigital cable Digital satellite Digital terrestrial IPTV % digital
Source: Datamonitor D A T A M O N I T O R
Table 7: Digital TV households in Germany by platform, 2005-2010
(000 households) 2005 2006 2007 2008 2009 2010
TV households 37,786 37,895 38,003 38,111 38,220 38,328
Digital cable 2,431 2,816 3,272 3,767 4,277 4,834
Digital satellite 5,858 7,290 8,795 9,683 10,411 10,891
Digital terrestrial 1,850 2,160 2,300 2,359 2,396 2,415
IPTV 0 60 145 300 514 757
Total digital 10,139 12,327 14,511 16,108 17,598 18,897
% digital 27% 33% 38% 42% 46% 49%
Source: Datamonitor D A T A M O N I T O R

Media & Broadcasting Technology – The evolving broadcast sector (Review Report)
Media & Broadcasting Technology – The evolving broadcast sector (Review Report) DMTC1195 / Published 06/2006
© Datamonitor. This brief is a licensed product and is not to be photocopied Page 49
Digital TV households in Germany by operator, 2005-2010
Table 8: Digital TV households in Germany by operator, 2005-10 (000s)
Operator Platform 2005 2006 2007 2008 2009 2010
Premiere Satellite 1,558 1,706 1,816 1,906 1,992 2,077
Free-to-air satellite Satellite 4,300 5,584 6,979 7,777 8,420 8,814
KBW Cable 78 133 197 266 338 416
KDG Cable 401 509 637 781 917 1,073
Unity Media Cable 119 235 385 548 699 851
Premiere Cable 1,758 1,807 1,845 1,875 1,904 1,931
Rest of cable Cable 75 132 209 298 421 563
Terrestrial DTT 1,850 2,160 2,300 2,359 2,396 2,415
Total IPTV IPTV - 60 145 300 514 757
Total digital households 10,139 12,327 14,511 16,108 17,598 18,897
Source: Datamonitor D A T A M O N I T O R
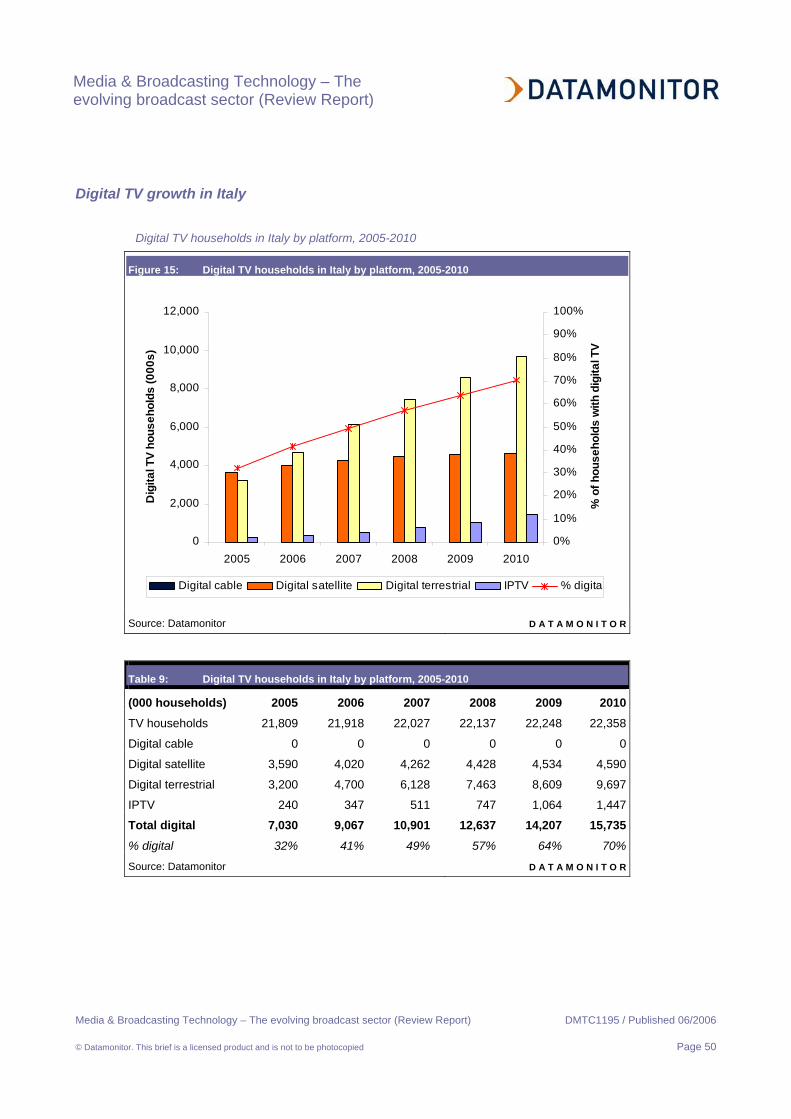
Media & Broadcasting Technology – The evolving broadcast sector (Review Report)
Media & Broadcasting Technology – The evolving broadcast sector (Review Report) DMTC1195 / Published 06/2006
© Datamonitor. This brief is a licensed product and is not to be photocopied Page 50
Digital TV growth in Italy
Digital TV households in Italy by platform, 2005-2010
Figure 15: Digital TV households in Italy by platform, 2005-2010
0
2,000
4,000
6,000
8,000
10,000
12,000
2005 2006 2007 2008 2009 2010
Dig
ital T
V ho
useh
olds
(000
s)
0%
10%
20%
30%
40%
50%
60%
70%
80%
90%
100%
% o
f hou
seho
lds
with
dig
ital T
VDigital cable Digital satellite Digital terrestrial IPTV % digital
Source: Datamonitor D A T A M O N I T O R
Table 9: Digital TV households in Italy by platform, 2005-2010
(000 households) 2005 2006 2007 2008 2009 2010 TV households 21,809 21,918 22,027 22,137 22,248 22,358
Digital cable 0 0 0 0 0 0
Digital satellite 3,590 4,020 4,262 4,428 4,534 4,590
Digital terrestrial 3,200 4,700 6,128 7,463 8,609 9,697
IPTV 240 347 511 747 1,064 1,447
Total digital 7,030 9,067 10,901 12,637 14,207 15,735 % digital 32% 41% 49% 57% 64% 70%
Source: Datamonitor D A T A M O N I T O R

Media & Broadcasting Technology – The evolving broadcast sector (Review Report)
Media & Broadcasting Technology – The evolving broadcast sector (Review Report) DMTC1195 / Published 06/2006
© Datamonitor. This brief is a licensed product and is not to be photocopied Page 51
Digital TV households in Italy by operator, 2005-2010
Table 10: Digital TV households in Italy by operator, 2005-2010 (000s)
Operator Platform 2005 2006 2007 2008 2009 2010
Sky Italia Satellite 3,590 4,020 4,262 4,428 4,534 4,590
Terrestrial DTT 3,200 4,700 6,128 7,463 8,609 9,697
Total IPTV IPTV 240 347 511 747 1,064 1,447
Total digital households 7,030 9,067 10,901 12,637 14,207 15,735
Source: Datamonitor D A T A M O N I T O R
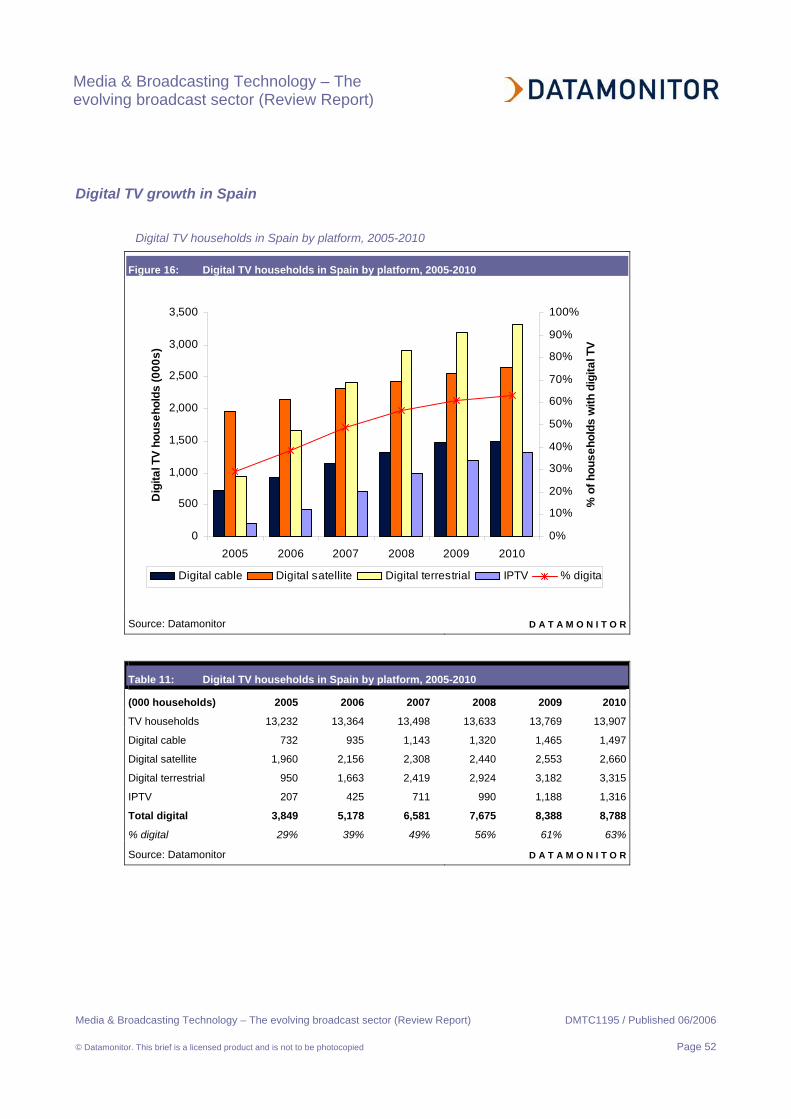
Media & Broadcasting Technology – The evolving broadcast sector (Review Report)
Media & Broadcasting Technology – The evolving broadcast sector (Review Report) DMTC1195 / Published 06/2006
© Datamonitor. This brief is a licensed product and is not to be photocopied Page 52
Digital TV growth in Spain
Digital TV households in Spain by platform, 2005-2010
Figure 16: Digital TV households in Spain by platform, 2005-2010
0
500
1,000
1,500
2,000
2,500
3,000
3,500
2005 2006 2007 2008 2009 2010
Dig
ital T
V ho
useh
olds
(000
s)
0%
10%
20%
30%
40%
50%
60%
70%
80%
90%
100%
% o
f hou
seho
lds
with
dig
ital T
VDigital cable Digital satellite Digital terrestrial IPTV % digita
Source: Datamonitor D A T A M O N I T O R
Table 11: Digital TV households in Spain by platform, 2005-2010
(000 households) 2005 2006 2007 2008 2009 2010
TV households 13,232 13,364 13,498 13,633 13,769 13,907
Digital cable 732 935 1,143 1,320 1,465 1,497
Digital satellite 1,960 2,156 2,308 2,440 2,553 2,660
Digital terrestrial 950 1,663 2,419 2,924 3,182 3,315
IPTV 207 425 711 990 1,188 1,316
Total digital 3,849 5,178 6,581 7,675 8,388 8,788
% digital 29% 39% 49% 56% 61% 63%
Source: Datamonitor D A T A M O N I T O R
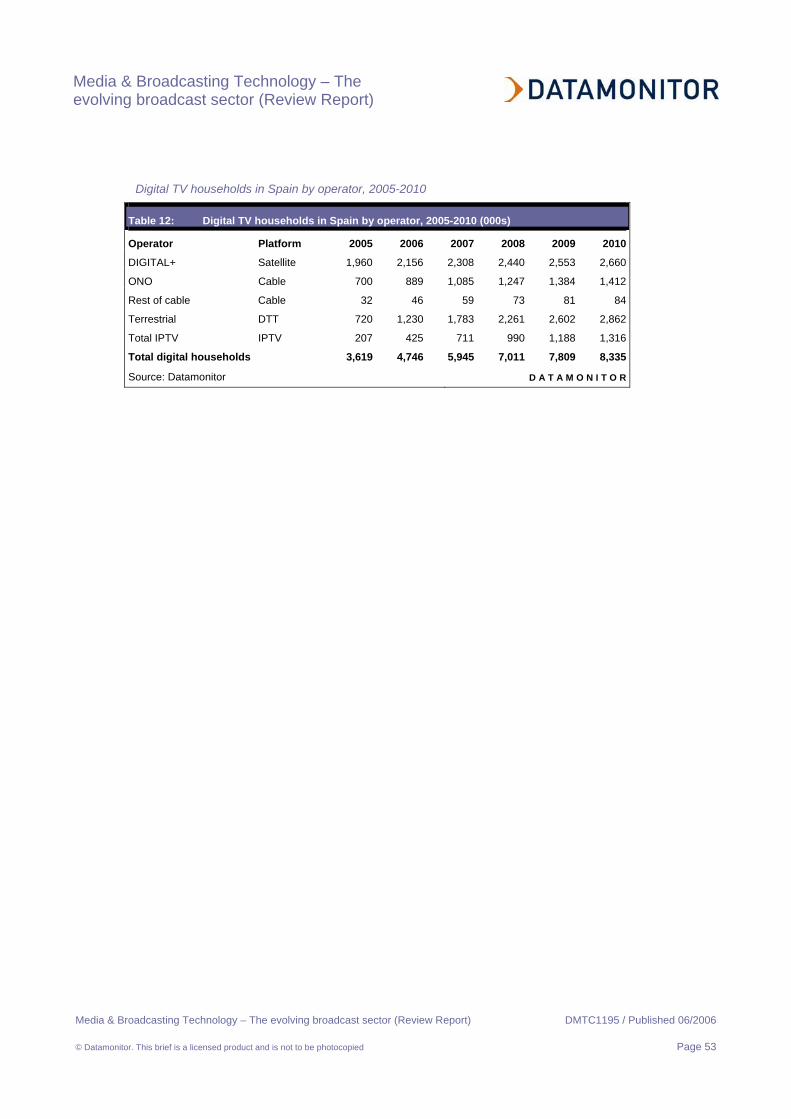
Media & Broadcasting Technology – The evolving broadcast sector (Review Report)
Media & Broadcasting Technology – The evolving broadcast sector (Review Report) DMTC1195 / Published 06/2006
© Datamonitor. This brief is a licensed product and is not to be photocopied Page 53
Digital TV households in Spain by operator, 2005-2010
Table 12: Digital TV households in Spain by operator, 2005-2010 (000s)
Operator Platform 2005 2006 2007 2008 2009 2010
DIGITAL+ Satellite 1,960 2,156 2,308 2,440 2,553 2,660
ONO Cable 700 889 1,085 1,247 1,384 1,412
Rest of cable Cable 32 46 59 73 81 84
Terrestrial DTT 720 1,230 1,783 2,261 2,602 2,862
Total IPTV IPTV 207 425 711 990 1,188 1,316
Total digital households 3,619 4,746 5,945 7,011 7,809 8,335
Source: Datamonitor D A T A M O N I T O R
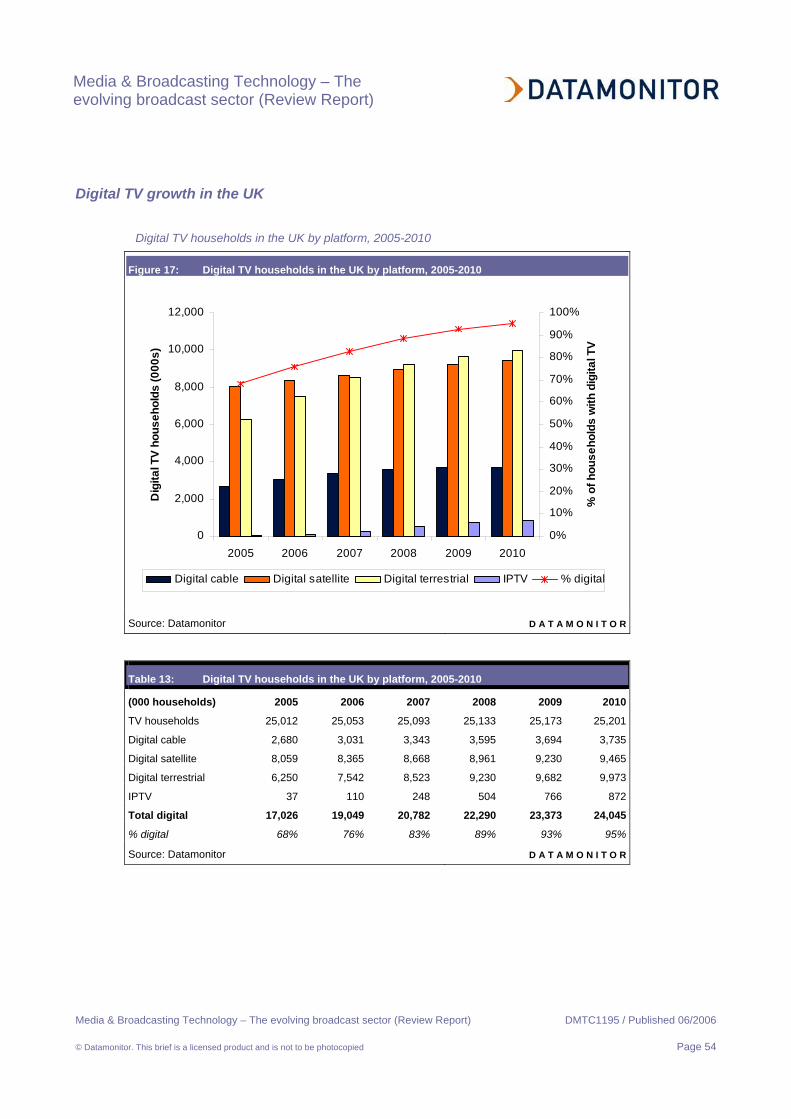
Media & Broadcasting Technology – The evolving broadcast sector (Review Report)
Media & Broadcasting Technology – The evolving broadcast sector (Review Report) DMTC1195 / Published 06/2006
© Datamonitor. This brief is a licensed product and is not to be photocopied Page 54
Digital TV growth in the UK
Digital TV households in the UK by platform, 2005-2010
Figure 17: Digital TV households in the UK by platform, 2005-2010
0
2,000
4,000
6,000
8,000
10,000
12,000
2005 2006 2007 2008 2009 2010
Dig
ital T
V ho
useh
olds
(000
s)
0%
10%
20%
30%
40%
50%
60%
70%
80%
90%
100%
% o
f hou
seho
lds
with
dig
ital T
VDigital cable Digital satellite Digital terrestrial IPTV % digital
Source: Datamonitor D A T A M O N I T O R
Table 13: Digital TV households in the UK by platform, 2005-2010
(000 households) 2005 2006 2007 2008 2009 2010
TV households 25,012 25,053 25,093 25,133 25,173 25,201
Digital cable 2,680 3,031 3,343 3,595 3,694 3,735
Digital satellite 8,059 8,365 8,668 8,961 9,230 9,465
Digital terrestrial 6,250 7,542 8,523 9,230 9,682 9,973
IPTV 37 110 248 504 766 872
Total digital 17,026 19,049 20,782 22,290 23,373 24,045
% digital 68% 76% 83% 89% 93% 95%
Source: Datamonitor D A T A M O N I T O R

Media & Broadcasting Technology – The evolving broadcast sector (Review Report)
Media & Broadcasting Technology – The evolving broadcast sector (Review Report) DMTC1195 / Published 06/2006
© Datamonitor. This brief is a licensed product and is not to be photocopied Page 55
Digital TV households in the UK by operator, 2005-2010
Table 14: Digital TV households in the UK by operator, 2005-2010 (000s)
Operator Platform 2005 2006 2007 2008 2009 2010
BSkyB Satellite 8,059 8,365 8,668 8,961 9,230 9,465
NTL Telewest Cable 2,680 3,031 3,343 3,595 3,694 3,735
Freeview DTT 6,250 7,542 8,523 9,230 9,682 9,973
Total IPTV IPTV 37 110 248 504 766 872
Total digital households 17,026 19,049 20,782 22,290 23,373 24,045
Source: Datamonitor D A T A M O N I T O R
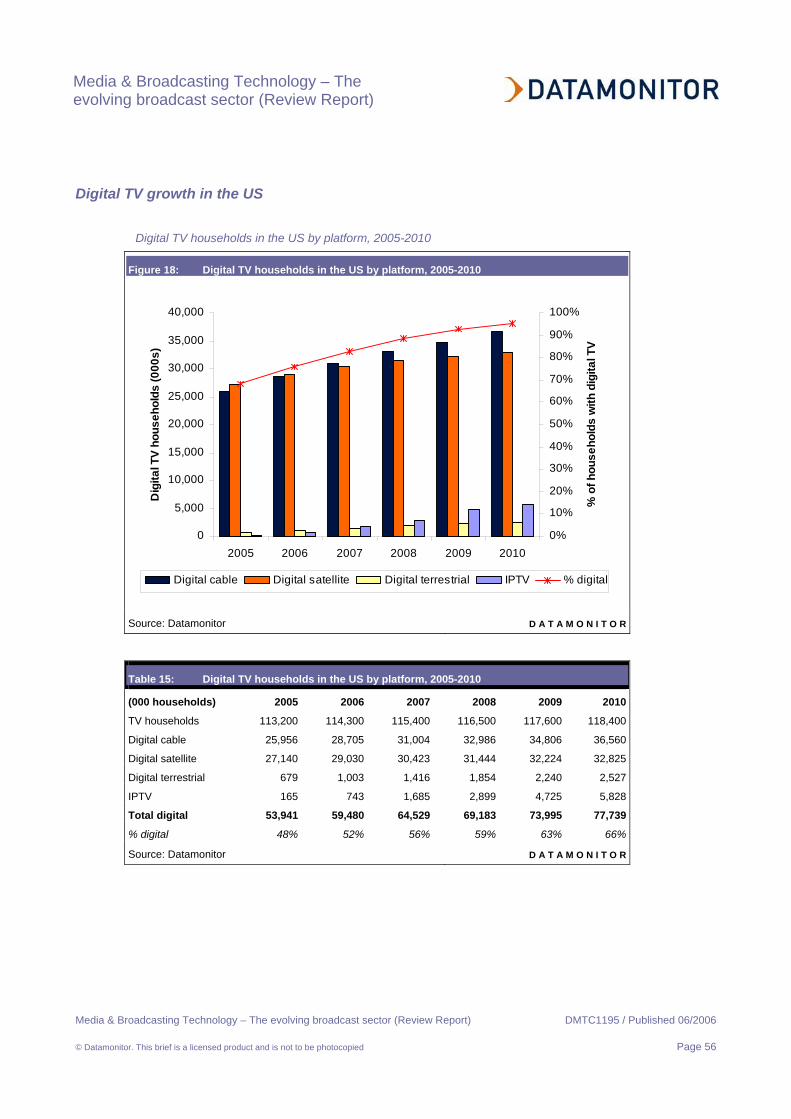
Media & Broadcasting Technology – The evolving broadcast sector (Review Report)
Media & Broadcasting Technology – The evolving broadcast sector (Review Report) DMTC1195 / Published 06/2006
© Datamonitor. This brief is a licensed product and is not to be photocopied Page 56
Digital TV growth in the US
Digital TV households in the US by platform, 2005-2010
Figure 18: Digital TV households in the US by platform, 2005-2010
0
5,000
10,000
15,000
20,000
25,000
30,000
35,000
40,000
2005 2006 2007 2008 2009 2010
Dig
ital T
V ho
useh
olds
(000
s)
0%
10%
20%
30%
40%
50%
60%
70%
80%
90%
100%
% o
f hou
seho
lds
with
dig
ital T
VDigital cable Digital satellite Digital terrestrial IPTV % digital
Source: Datamonitor D A T A M O N I T O R
Table 15: Digital TV households in the US by platform, 2005-2010
(000 households) 2005 2006 2007 2008 2009 2010
TV households 113,200 114,300 115,400 116,500 117,600 118,400
Digital cable 25,956 28,705 31,004 32,986 34,806 36,560
Digital satellite 27,140 29,030 30,423 31,444 32,224 32,825
Digital terrestrial 679 1,003 1,416 1,854 2,240 2,527
IPTV 165 743 1,685 2,899 4,725 5,828
Total digital 53,941 59,480 64,529 69,183 73,995 77,739
% digital 48% 52% 56% 59% 63% 66%
Source: Datamonitor D A T A M O N I T O R

Media & Broadcasting Technology – The evolving broadcast sector (Review Report)
Media & Broadcasting Technology – The evolving broadcast sector (Review Report) DMTC1195 / Published 06/2006
© Datamonitor. This brief is a licensed product and is not to be photocopied Page 57
Digital TV households in the US by operator, 2005-2010
Table 16: Digital TV households in the US by operator, 2005-2010 (000s)
Operator Platform 2005 2006 2007 2008 2009 2010
DirecTV Satellite 15,100 16,168 16,911 17,432 17,803 18,072
EchoStar Satellite 12,040 12,862 13,512 14,012 14,421 14,753
Cablevision Cable 1,950 2,346 2,641 2,813 2,914 2,976
Charter Cable 2,797 2,900 3,002 3,101 3,198 3,296
Comcast Cable 9,720 10,716 11,544 12,292 12,998 13,680
Cox Cable 2,663 2,911 3,117 3,301 3,473 3,638
Time Warner Cable 5,400 6,145 6,792 7,383 7,960 8,558
Other Cable 3,426 3,686 3,908 4,096 4,262 4,413
Terrestrial DTT 679 1,003 1,416 1,854 2,240 2,527
Total IPTV IPTV 165 743 1,685 2,899 4,725 5,828
Total digital households 53,941 59,480 64,529 69,183 73,995 77,739
Source: Datamonitor D A T A M O N I T O R
Media & Broadcasting Technology – The evolving broadcast sector (Review Report)
Media & Broadcasting Technology – The evolving broadcast sector (Review Report) DMTC1195 / Published 06/2006
© Datamonitor. This brief is a licensed product and is not to be photocopied Page 58
DIGITAL TV DEVELOPMENT: SMALL EUROPEAN TV MARKETS (DATABOOK)
Introduction
This databook provides datasets relating to uptake of digital TV services across the following markets:
• Austria;
• Belgium;
• Denmark;
• Finland;
• the Netherlands;
• Norway;
• Portugal;
• Sweden;
• Switzerland.
It provides a breakdown of digital households by both platform (satellite, cable, DTT and IPTV) and operator.
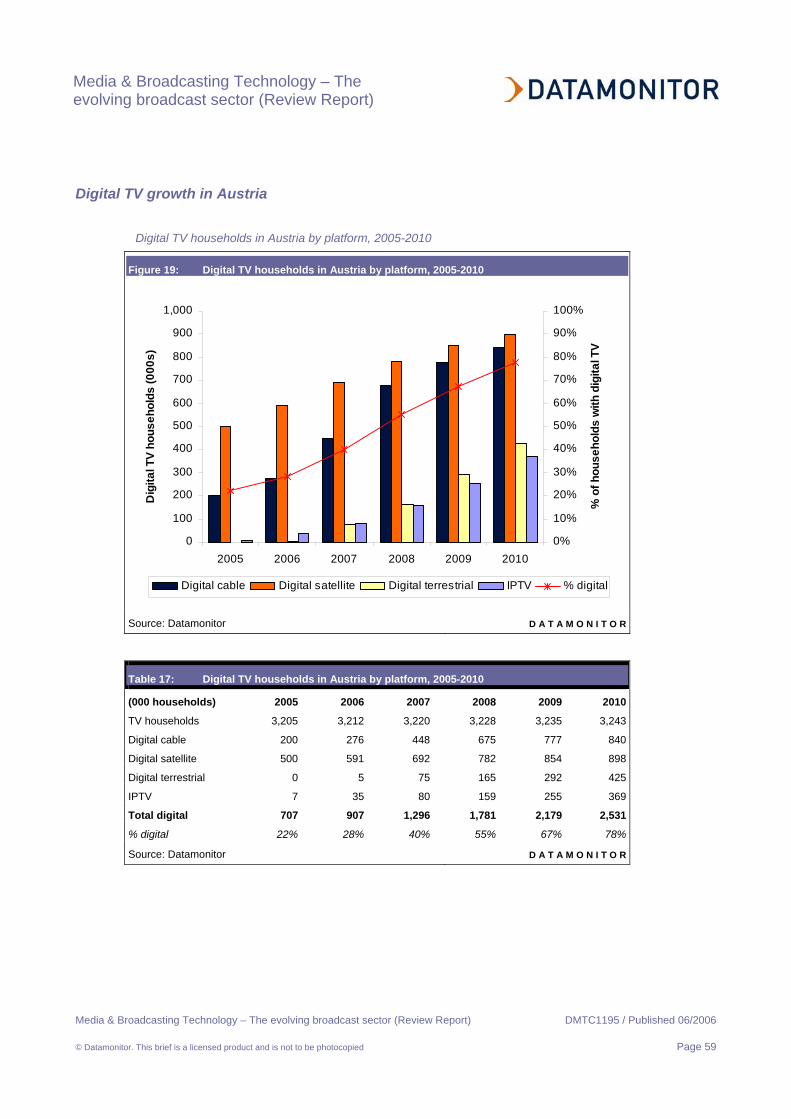
Media & Broadcasting Technology – The evolving broadcast sector (Review Report)
Media & Broadcasting Technology – The evolving broadcast sector (Review Report) DMTC1195 / Published 06/2006
© Datamonitor. This brief is a licensed product and is not to be photocopied Page 59
Digital TV growth in Austria
Digital TV households in Austria by platform, 2005-2010
Figure 19: Digital TV households in Austria by platform, 2005-2010
0
100
200
300
400
500
600
700
800
900
1,000
2005 2006 2007 2008 2009 2010
Dig
ital T
V ho
useh
olds
(000
s)
0%
10%
20%
30%
40%
50%
60%
70%
80%
90%
100%
% o
f hou
seho
lds
with
dig
ital T
VDigital cable Digital satellite Digital terrestrial IPTV % digital
Source: Datamonitor D A T A M O N I T O R
Table 17: Digital TV households in Austria by platform, 2005-2010
(000 households) 2005 2006 2007 2008 2009 2010
TV households 3,205 3,212 3,220 3,228 3,235 3,243
Digital cable 200 276 448 675 777 840
Digital satellite 500 591 692 782 854 898
Digital terrestrial 0 5 75 165 292 425
IPTV 7 35 80 159 255 369
Total digital 707 907 1,296 1,781 2,179 2,531
% digital 22% 28% 40% 55% 67% 78%
Source: Datamonitor D A T A M O N I T O R
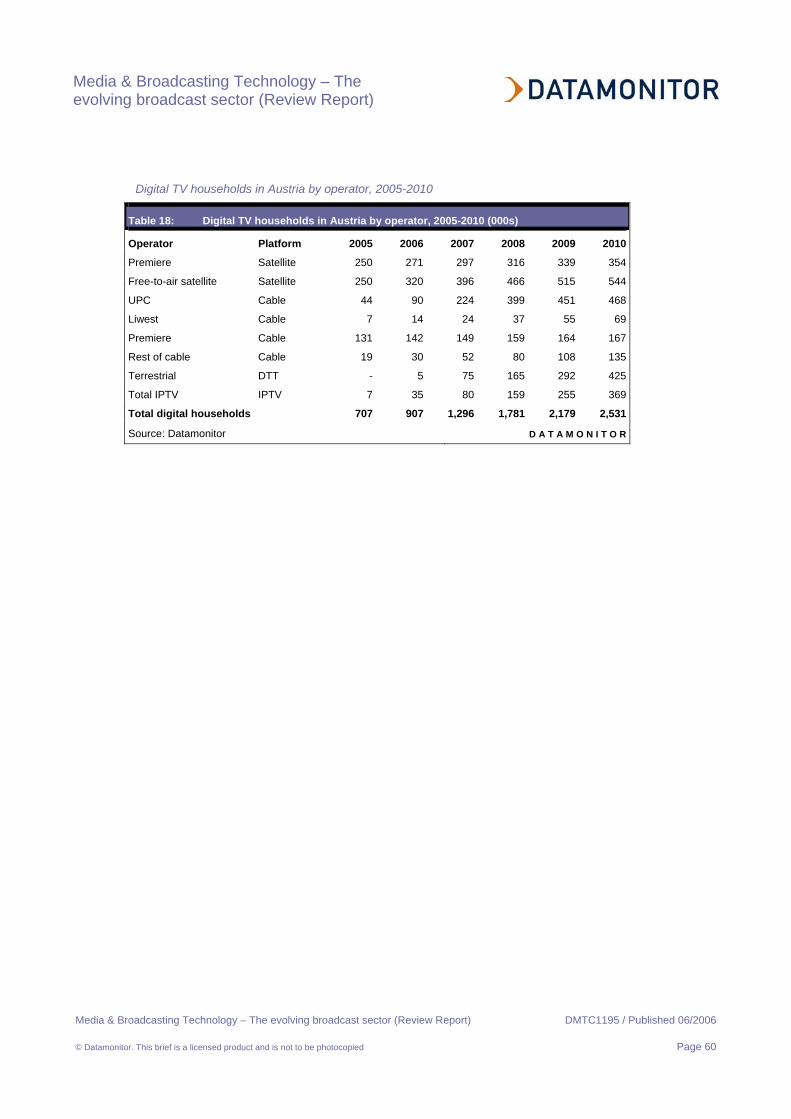
Media & Broadcasting Technology – The evolving broadcast sector (Review Report)
Media & Broadcasting Technology – The evolving broadcast sector (Review Report) DMTC1195 / Published 06/2006
© Datamonitor. This brief is a licensed product and is not to be photocopied Page 60
Digital TV households in Austria by operator, 2005-2010
Table 18: Digital TV households in Austria by operator, 2005-2010 (000s)
Operator Platform 2005 2006 2007 2008 2009 2010
Premiere Satellite 250 271 297 316 339 354
Free-to-air satellite Satellite 250 320 396 466 515 544
UPC Cable 44 90 224 399 451 468
Liwest Cable 7 14 24 37 55 69
Premiere Cable 131 142 149 159 164 167
Rest of cable Cable 19 30 52 80 108 135
Terrestrial DTT - 5 75 165 292 425
Total IPTV IPTV 7 35 80 159 255 369
Total digital households 707 907 1,296 1,781 2,179 2,531
Source: Datamonitor D A T A M O N I T O R
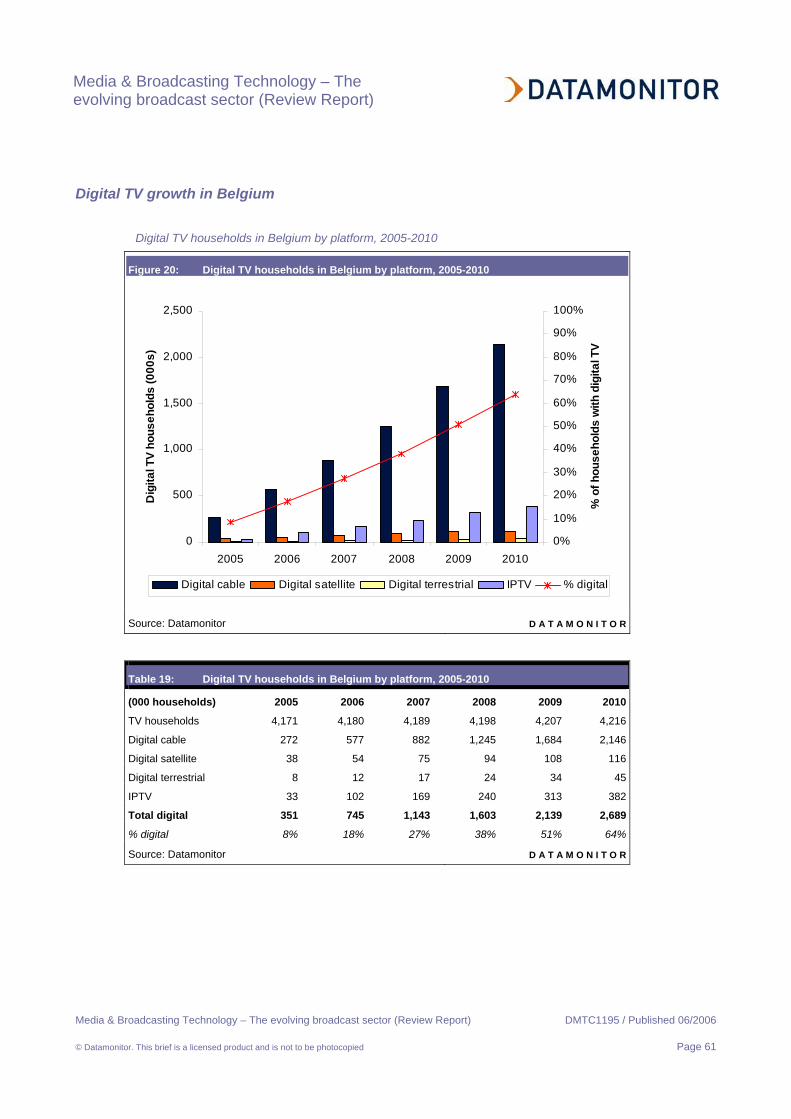
Media & Broadcasting Technology – The evolving broadcast sector (Review Report)
Media & Broadcasting Technology – The evolving broadcast sector (Review Report) DMTC1195 / Published 06/2006
© Datamonitor. This brief is a licensed product and is not to be photocopied Page 61
Digital TV growth in Belgium
Digital TV households in Belgium by platform, 2005-2010
Figure 20: Digital TV households in Belgium by platform, 2005-2010
0
500
1,000
1,500
2,000
2,500
2005 2006 2007 2008 2009 2010
Dig
ital T
V ho
useh
olds
(000
s)
0%
10%
20%
30%
40%
50%
60%
70%
80%
90%
100%
% o
f hou
seho
lds
with
dig
ital T
VDigital cable Digital satellite Digital terrestrial IPTV % digital
Source: Datamonitor D A T A M O N I T O R
Table 19: Digital TV households in Belgium by platform, 2005-2010
(000 households) 2005 2006 2007 2008 2009 2010
TV households 4,171 4,180 4,189 4,198 4,207 4,216
Digital cable 272 577 882 1,245 1,684 2,146
Digital satellite 38 54 75 94 108 116
Digital terrestrial 8 12 17 24 34 45
IPTV 33 102 169 240 313 382
Total digital 351 745 1,143 1,603 2,139 2,689
% digital 8% 18% 27% 38% 51% 64%
Source: Datamonitor D A T A M O N I T O R

Media & Broadcasting Technology – The evolving broadcast sector (Review Report)
Media & Broadcasting Technology – The evolving broadcast sector (Review Report) DMTC1195 / Published 06/2006
© Datamonitor. This brief is a licensed product and is not to be photocopied Page 62
Digital TV households in Belgium by operator, 2005-2010
Table 20: Digital TV households in Belgium by operator, 2005-10 (000s)
Operator Platform 2005 2006 2007 2008 2009 2010
Satellite Satellite 38 54 75 94 108 116
Telenet Cable 75 298 467 678 956 1,281
Brutele Cable 15 37 75 124 158 178
UPC Cable 6 10 22 45 89 124
Rest of cable Cable 176 232 318 398 481 563
Terrestrial DTT 8 12 17 24 34 45
IPTV IPTV 33 102 169 240 313 382
Total digital households 351 745 1,143 1,603 2,139 2,689
Source: Datamonitor D A T A M O N I T O R
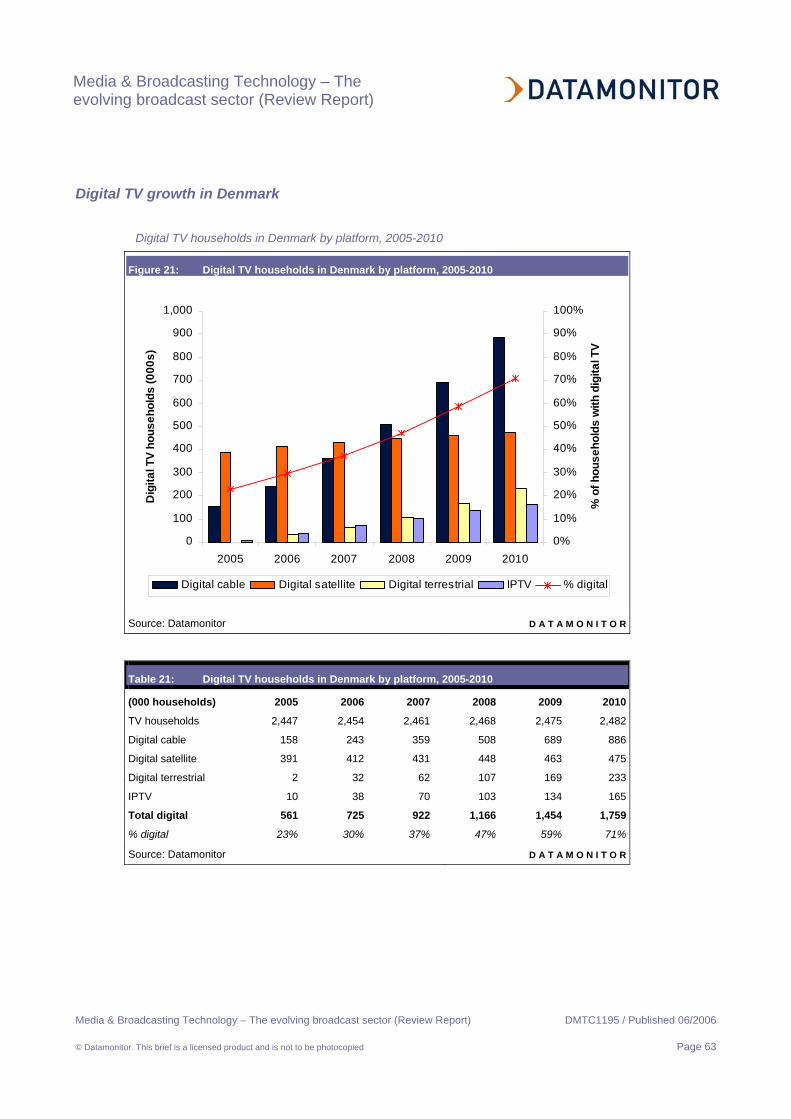
Media & Broadcasting Technology – The evolving broadcast sector (Review Report)
Media & Broadcasting Technology – The evolving broadcast sector (Review Report) DMTC1195 / Published 06/2006
© Datamonitor. This brief is a licensed product and is not to be photocopied Page 63
Digital TV growth in Denmark
Digital TV households in Denmark by platform, 2005-2010
Figure 21: Digital TV households in Denmark by platform, 2005-2010
0
100
200
300
400
500
600
700
800
900
1,000
2005 2006 2007 2008 2009 2010
Dig
ital T
V ho
useh
olds
(000
s)
0%
10%
20%
30%
40%
50%
60%
70%
80%
90%
100%
% o
f hou
seho
lds
with
dig
ital T
VDigital cable Digital satellite Digital terrestrial IPTV % digital
Source: Datamonitor D A T A M O N I T O R
Table 21: Digital TV households in Denmark by platform, 2005-2010
(000 households) 2005 2006 2007 2008 2009 2010
TV households 2,447 2,454 2,461 2,468 2,475 2,482
Digital cable 158 243 359 508 689 886
Digital satellite 391 412 431 448 463 475
Digital terrestrial 2 32 62 107 169 233
IPTV 10 38 70 103 134 165
Total digital 561 725 922 1,166 1,454 1,759
% digital 23% 30% 37% 47% 59% 71%
Source: Datamonitor D A T A M O N I T O R

Media & Broadcasting Technology – The evolving broadcast sector (Review Report)
Media & Broadcasting Technology – The evolving broadcast sector (Review Report) DMTC1195 / Published 06/2006
© Datamonitor. This brief is a licensed product and is not to be photocopied Page 64
Digital TV households in Denmark by operator, 2005-2010
Table 22: Digital TV households in Denmark by operator, 2005-10 (000s)
Operator Platform 2005 2006 2007 2008 2009 2010
Canal Digital Satellite 151 164 175 186 195 203
Viasat Satellite 240 249 256 262 267 272
TDC Kabel Cable 45 72 108 151 196 235
Telia Stofa Cable 93 135 182 229 276 324
Rest of cable Cable 20 36 69 128 217 327
Terrestrial DTT 2 32 62 107 169 233
IPTV IPTV 10 38 70 103 134 165
Total digital households 561 725 922 1,166 1,454 1,759
Source: Datamonitor D A T A M O N I T O R
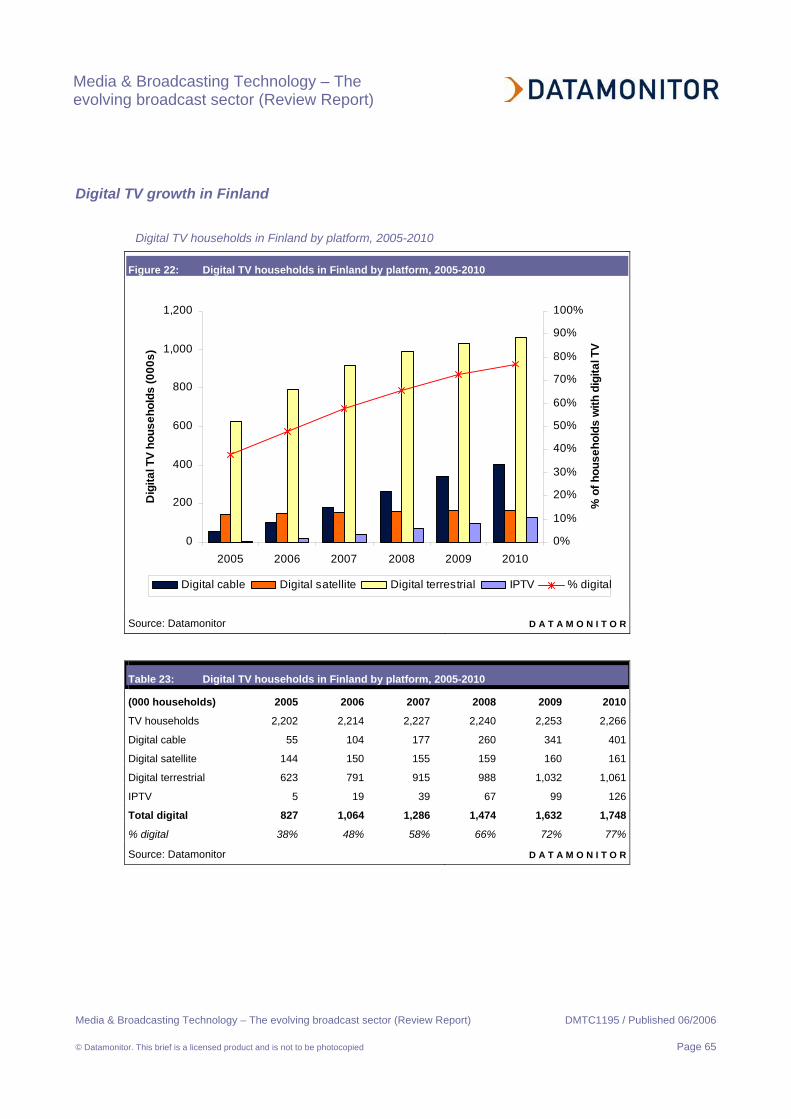
Media & Broadcasting Technology – The evolving broadcast sector (Review Report)
Media & Broadcasting Technology – The evolving broadcast sector (Review Report) DMTC1195 / Published 06/2006
© Datamonitor. This brief is a licensed product and is not to be photocopied Page 65
Digital TV growth in Finland
Digital TV households in Finland by platform, 2005-2010
Figure 22: Digital TV households in Finland by platform, 2005-2010
0
200
400
600
800
1,000
1,200
2005 2006 2007 2008 2009 2010
Dig
ital T
V ho
useh
olds
(000
s)
0%
10%
20%
30%
40%
50%
60%
70%
80%
90%
100%
% o
f hou
seho
lds
with
dig
ital T
VDigital cable Digital satellite Digital terrestrial IPTV % digital
Source: Datamonitor D A T A M O N I T O R
Table 23: Digital TV households in Finland by platform, 2005-2010
(000 households) 2005 2006 2007 2008 2009 2010
TV households 2,202 2,214 2,227 2,240 2,253 2,266
Digital cable 55 104 177 260 341 401
Digital satellite 144 150 155 159 160 161
Digital terrestrial 623 791 915 988 1,032 1,061
IPTV 5 19 39 67 99 126
Total digital 827 1,064 1,286 1,474 1,632 1,748
% digital 38% 48% 58% 66% 72% 77%
Source: Datamonitor D A T A M O N I T O R
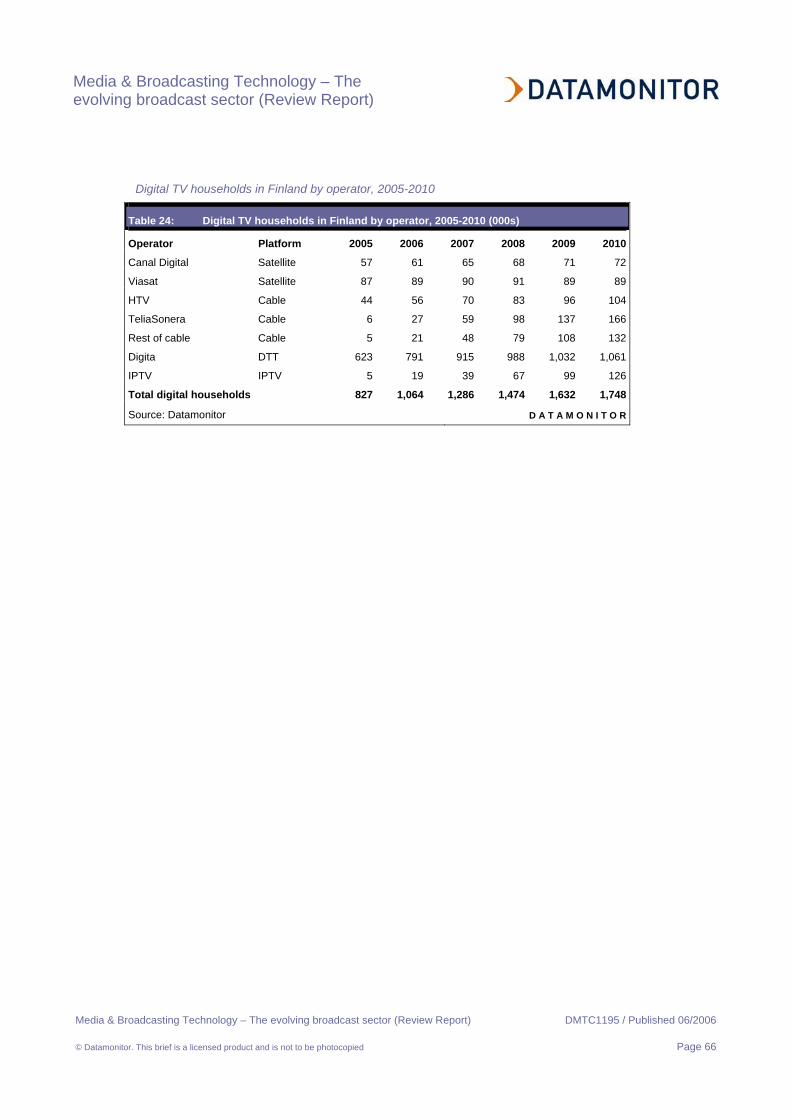
Media & Broadcasting Technology – The evolving broadcast sector (Review Report)
Media & Broadcasting Technology – The evolving broadcast sector (Review Report) DMTC1195 / Published 06/2006
© Datamonitor. This brief is a licensed product and is not to be photocopied Page 66
Digital TV households in Finland by operator, 2005-2010
Table 24: Digital TV households in Finland by operator, 2005-2010 (000s)
Operator Platform 2005 2006 2007 2008 2009 2010
Canal Digital Satellite 57 61 65 68 71 72
Viasat Satellite 87 89 90 91 89 89
HTV Cable 44 56 70 83 96 104
TeliaSonera Cable 6 27 59 98 137 166
Rest of cable Cable 5 21 48 79 108 132
Digita DTT 623 791 915 988 1,032 1,061
IPTV IPTV 5 19 39 67 99 126
Total digital households 827 1,064 1,286 1,474 1,632 1,748
Source: Datamonitor D A T A M O N I T O R
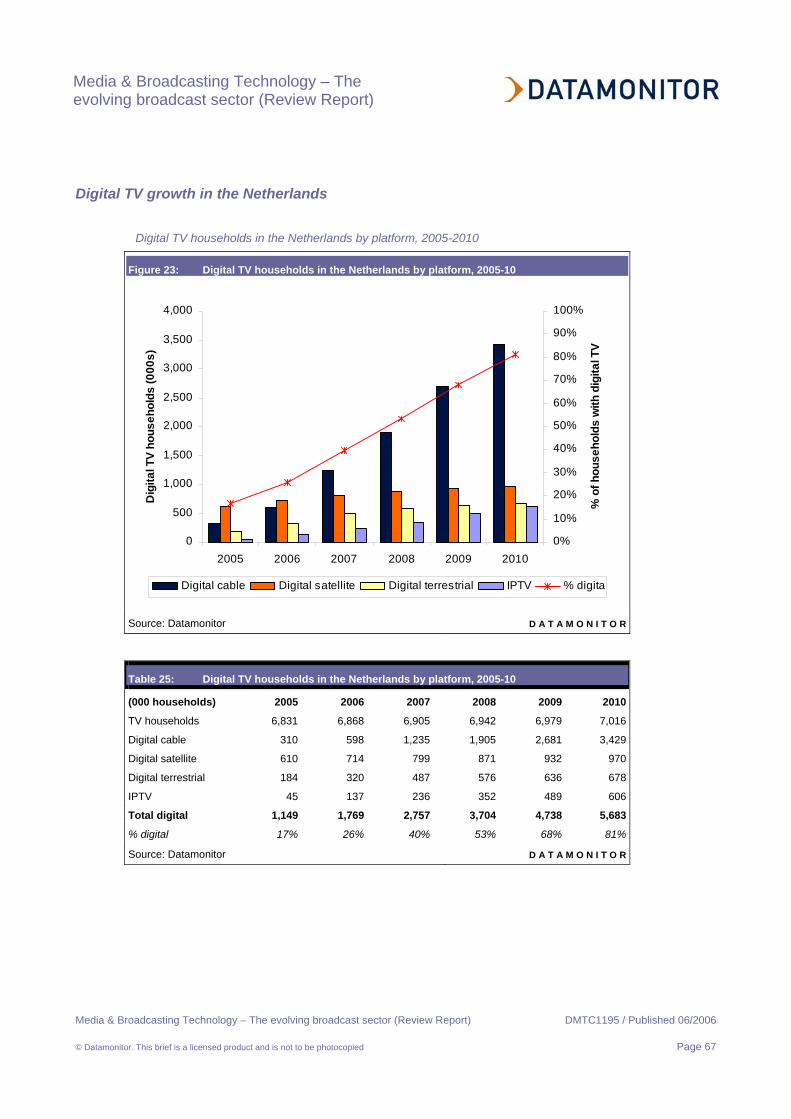
Media & Broadcasting Technology – The evolving broadcast sector (Review Report)
Media & Broadcasting Technology – The evolving broadcast sector (Review Report) DMTC1195 / Published 06/2006
© Datamonitor. This brief is a licensed product and is not to be photocopied Page 67
Digital TV growth in the Netherlands
Digital TV households in the Netherlands by platform, 2005-2010
Figure 23: Digital TV households in the Netherlands by platform, 2005-10
0
500
1,000
1,500
2,000
2,500
3,000
3,500
4,000
2005 2006 2007 2008 2009 2010
Dig
ital T
V ho
useh
olds
(000
s)
0%
10%
20%
30%
40%
50%
60%
70%
80%
90%
100%
% o
f hou
seho
lds
with
dig
ital T
VDigital cable Digital satellite Digital terrestrial IPTV % digital
Source: Datamonitor D A T A M O N I T O R
Table 25: Digital TV households in the Netherlands by platform, 2005-10
(000 households) 2005 2006 2007 2008 2009 2010
TV households 6,831 6,868 6,905 6,942 6,979 7,016
Digital cable 310 598 1,235 1,905 2,681 3,429
Digital satellite 610 714 799 871 932 970
Digital terrestrial 184 320 487 576 636 678
IPTV 45 137 236 352 489 606
Total digital 1,149 1,769 2,757 3,704 4,738 5,683
% digital 17% 26% 40% 53% 68% 81%
Source: Datamonitor D A T A M O N I T O R
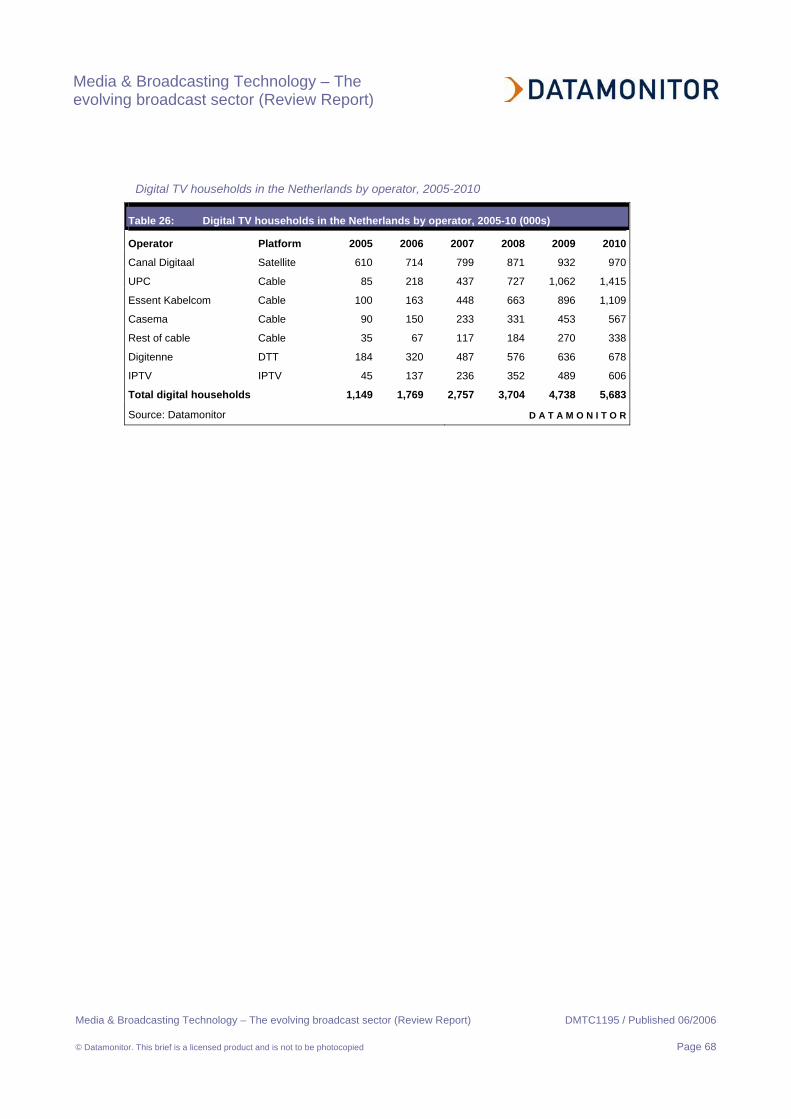
Media & Broadcasting Technology – The evolving broadcast sector (Review Report)
Media & Broadcasting Technology – The evolving broadcast sector (Review Report) DMTC1195 / Published 06/2006
© Datamonitor. This brief is a licensed product and is not to be photocopied Page 68
Digital TV households in the Netherlands by operator, 2005-2010
Table 26: Digital TV households in the Netherlands by operator, 2005-10 (000s)
Operator Platform 2005 2006 2007 2008 2009 2010
Canal Digitaal Satellite 610 714 799 871 932 970
UPC Cable 85 218 437 727 1,062 1,415
Essent Kabelcom Cable 100 163 448 663 896 1,109
Casema Cable 90 150 233 331 453 567
Rest of cable Cable 35 67 117 184 270 338
Digitenne DTT 184 320 487 576 636 678
IPTV IPTV 45 137 236 352 489 606
Total digital households 1,149 1,769 2,757 3,704 4,738 5,683
Source: Datamonitor D A T A M O N I T O R
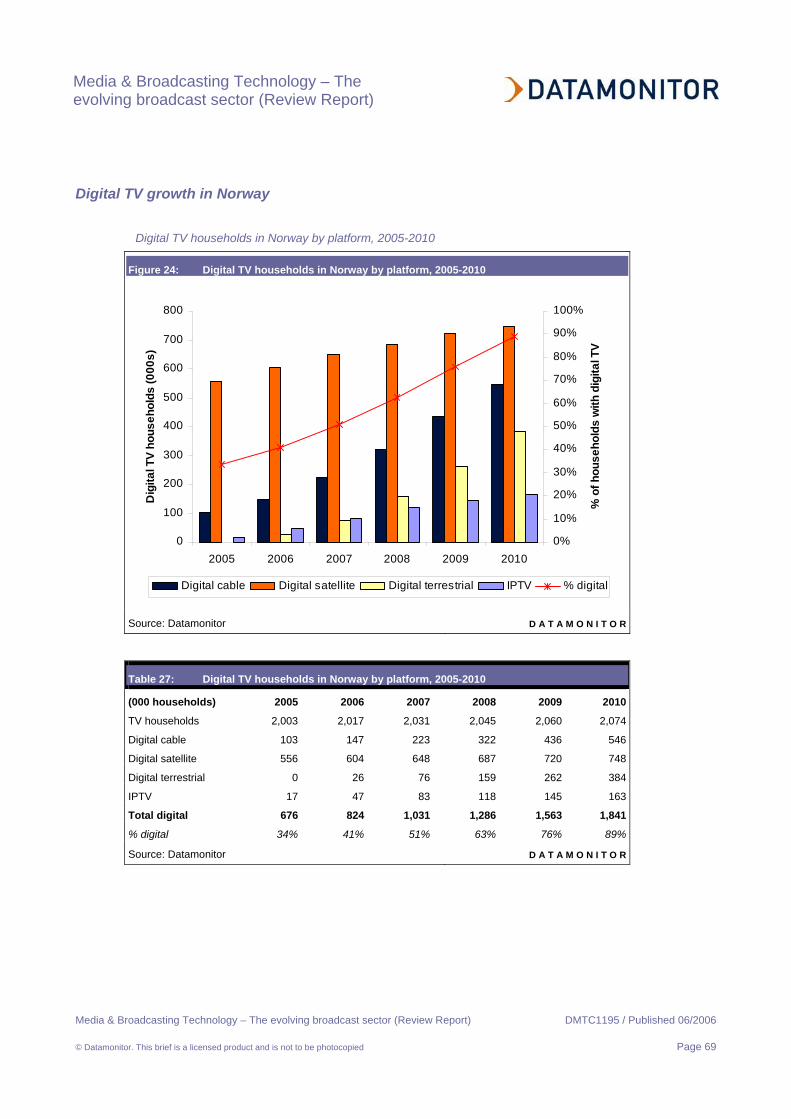
Media & Broadcasting Technology – The evolving broadcast sector (Review Report)
Media & Broadcasting Technology – The evolving broadcast sector (Review Report) DMTC1195 / Published 06/2006
© Datamonitor. This brief is a licensed product and is not to be photocopied Page 69
Digital TV growth in Norway
Digital TV households in Norway by platform, 2005-2010
Figure 24: Digital TV households in Norway by platform, 2005-2010
0
100
200
300
400
500
600
700
800
2005 2006 2007 2008 2009 2010
Dig
ital T
V ho
useh
olds
(000
s)
0%
10%
20%
30%
40%
50%
60%
70%
80%
90%
100%
% o
f hou
seho
lds
with
dig
ital T
VDigital cable Digital satellite Digital terrestrial IPTV % digital
Source: Datamonitor D A T A M O N I T O R
Table 27: Digital TV households in Norway by platform, 2005-2010
(000 households) 2005 2006 2007 2008 2009 2010
TV households 2,003 2,017 2,031 2,045 2,060 2,074
Digital cable 103 147 223 322 436 546
Digital satellite 556 604 648 687 720 748
Digital terrestrial 0 26 76 159 262 384
IPTV 17 47 83 118 145 163
Total digital 676 824 1,031 1,286 1,563 1,841
% digital 34% 41% 51% 63% 76% 89%
Source: Datamonitor D A T A M O N I T O R
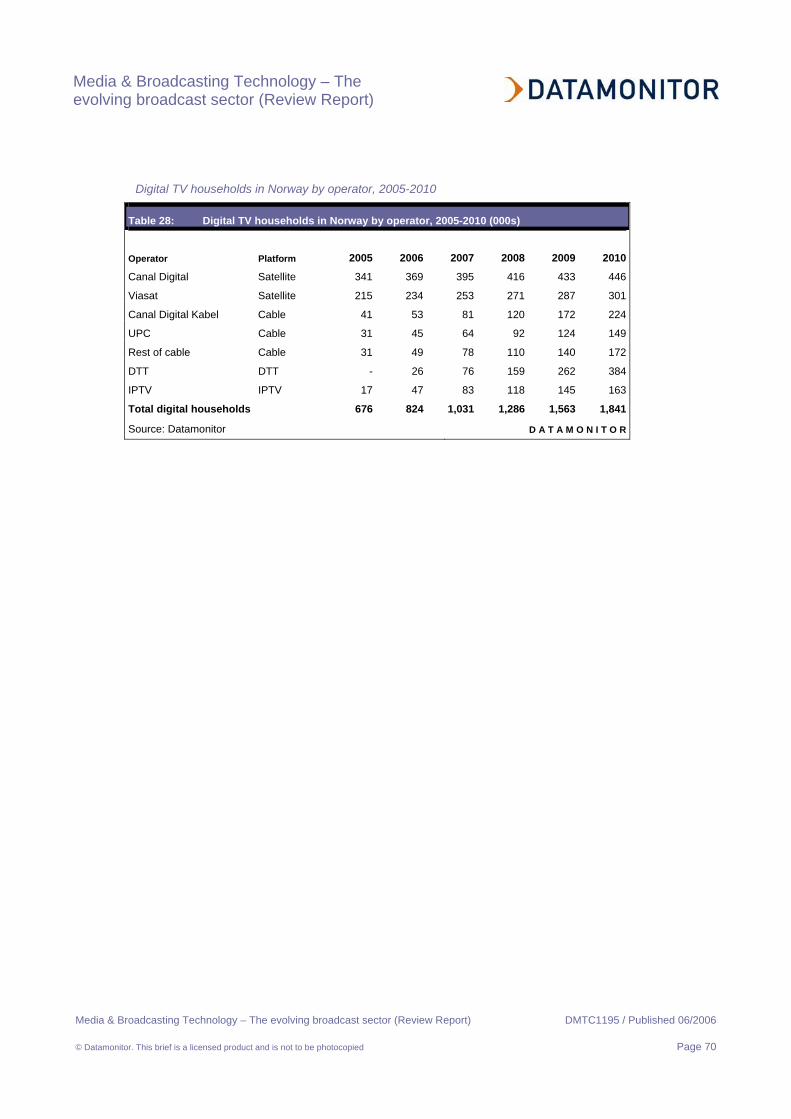
Media & Broadcasting Technology – The evolving broadcast sector (Review Report)
Media & Broadcasting Technology – The evolving broadcast sector (Review Report) DMTC1195 / Published 06/2006
© Datamonitor. This brief is a licensed product and is not to be photocopied Page 70
Digital TV households in Norway by operator, 2005-2010
Table 28: Digital TV households in Norway by operator, 2005-2010 (000s)
Operator Platform 2005 2006 2007 2008 2009 2010
Canal Digital Satellite 341 369 395 416 433 446
Viasat Satellite 215 234 253 271 287 301
Canal Digital Kabel Cable 41 53 81 120 172 224
UPC Cable 31 45 64 92 124 149
Rest of cable Cable 31 49 78 110 140 172
DTT DTT - 26 76 159 262 384
IPTV IPTV 17 47 83 118 145 163
Total digital households 676 824 1,031 1,286 1,563 1,841
Source: Datamonitor D A T A M O N I T O R

Media & Broadcasting Technology – The evolving broadcast sector (Review Report)
Media & Broadcasting Technology – The evolving broadcast sector (Review Report) DMTC1195 / Published 06/2006
© Datamonitor. This brief is a licensed product and is not to be photocopied Page 71
Digital TV growth in Portugal
Digital TV households in Portugal by platform, 2005-2010
Figure 25: Digital TV households in Portugal by platform, 2005-2010
0
200
400
600
800
1,000
1,200
2005 2006 2007 2008 2009 2010
Dig
ital T
V ho
useh
olds
(000
s)
0%
10%
20%
30%
40%
50%
60%
% o
f hou
seho
lds
with
dig
ital T
VDigital cable Digital satellite Digital terrestrial IPTV % digital
Source: Datamonitor D A T A M O N I T O R
Table 29: Digital TV households in Portugal by platform, 2005-2010
(000 households) 2005 2006 2007 2008 2009 2010
TV households 4,308 4,316 4,325 4,333 4,342 4,351
Digital cable 510 694 830 934 1,031 1,127
Digital satellite 389 420 444 463 476 488
Digital terrestrial 0 15 49 114 189 314
IPTV 0 10 32 68 122 206
Total digital 899 1,139 1,355 1,579 1,818 2,136
% digital 21% 26% 31% 36% 42% 49%
Source: Datamonitor D A T A M O N I T O R
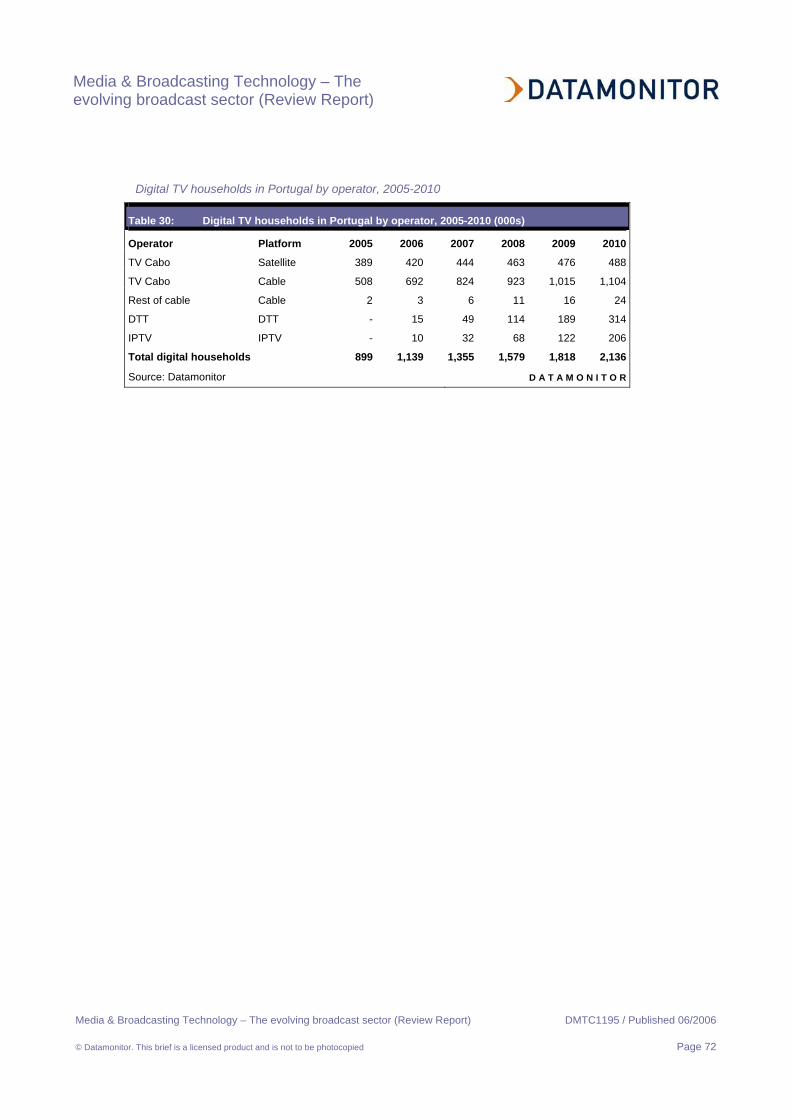
Media & Broadcasting Technology – The evolving broadcast sector (Review Report)
Media & Broadcasting Technology – The evolving broadcast sector (Review Report) DMTC1195 / Published 06/2006
© Datamonitor. This brief is a licensed product and is not to be photocopied Page 72
Digital TV households in Portugal by operator, 2005-2010
Table 30: Digital TV households in Portugal by operator, 2005-2010 (000s)
Operator Platform 2005 2006 2007 2008 2009 2010
TV Cabo Satellite 389 420 444 463 476 488
TV Cabo Cable 508 692 824 923 1,015 1,104
Rest of cable Cable 2 3 6 11 16 24
DTT DTT - 15 49 114 189 314
IPTV IPTV - 10 32 68 122 206
Total digital households 899 1,139 1,355 1,579 1,818 2,136
Source: Datamonitor D A T A M O N I T O R
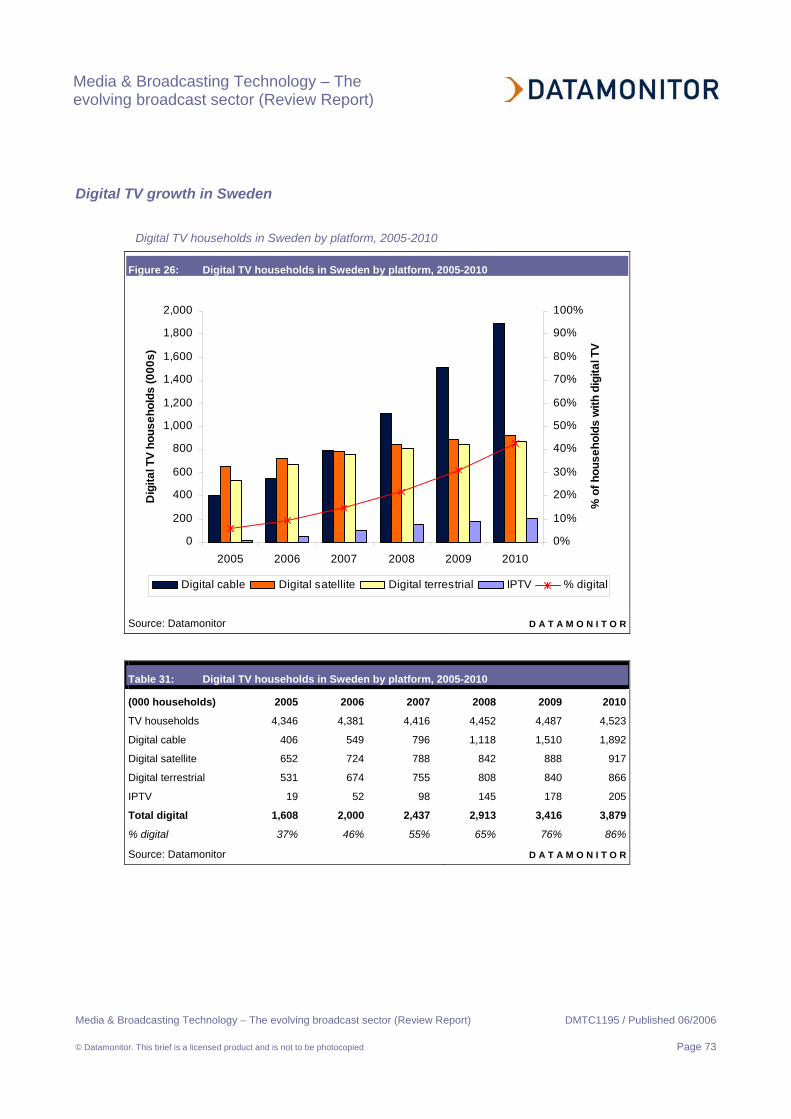
Media & Broadcasting Technology – The evolving broadcast sector (Review Report)
Media & Broadcasting Technology – The evolving broadcast sector (Review Report) DMTC1195 / Published 06/2006
© Datamonitor. This brief is a licensed product and is not to be photocopied Page 73
Digital TV growth in Sweden
Digital TV households in Sweden by platform, 2005-2010
Figure 26: Digital TV households in Sweden by platform, 2005-2010
0
200
400
600
800
1,000
1,200
1,400
1,600
1,800
2,000
2005 2006 2007 2008 2009 2010
Dig
ital T
V ho
useh
olds
(000
s)
0%
10%
20%
30%
40%
50%
60%
70%
80%
90%
100%
% o
f hou
seho
lds
with
dig
ital T
VDigital cable Digital satellite Digital terrestrial IPTV % digital
Source: Datamonitor D A T A M O N I T O R
Table 31: Digital TV households in Sweden by platform, 2005-2010
(000 households) 2005 2006 2007 2008 2009 2010
TV households 4,346 4,381 4,416 4,452 4,487 4,523
Digital cable 406 549 796 1,118 1,510 1,892
Digital satellite 652 724 788 842 888 917
Digital terrestrial 531 674 755 808 840 866
IPTV 19 52 98 145 178 205
Total digital 1,608 2,000 2,437 2,913 3,416 3,879
% digital 37% 46% 55% 65% 76% 86%
Source: Datamonitor D A T A M O N I T O R

Media & Broadcasting Technology – The evolving broadcast sector (Review Report)
Media & Broadcasting Technology – The evolving broadcast sector (Review Report) DMTC1195 / Published 06/2006
© Datamonitor. This brief is a licensed product and is not to be photocopied Page 74
Digital TV households in Sweden by operator, 2005-2010
Table 32: Digital TV households in Norway by operator, 2005-2010 (000s)
Operator Platform 2005 2006 2007 2008 2009 2010
Canal Digital Satellite 362 391 414 435 453 464
Viasat Satellite 290 334 374 407 436 453
Com Hem Cable 218 249 316 416 532 643
UPC Cable 59 84 138 190 229 257
Canal Digital Cable 19 28 39 54 74 99
Rest of cable Cable 110 188 303 458 675 893
Boxer DTT 531 674 755 808 840 866
IPTV IPTV 19 52 98 145 178 205
Total digital households 1,608 2,000 2,437 2,913 3,416 3,879
Source: Datamonitor D A T A M O N I T O R
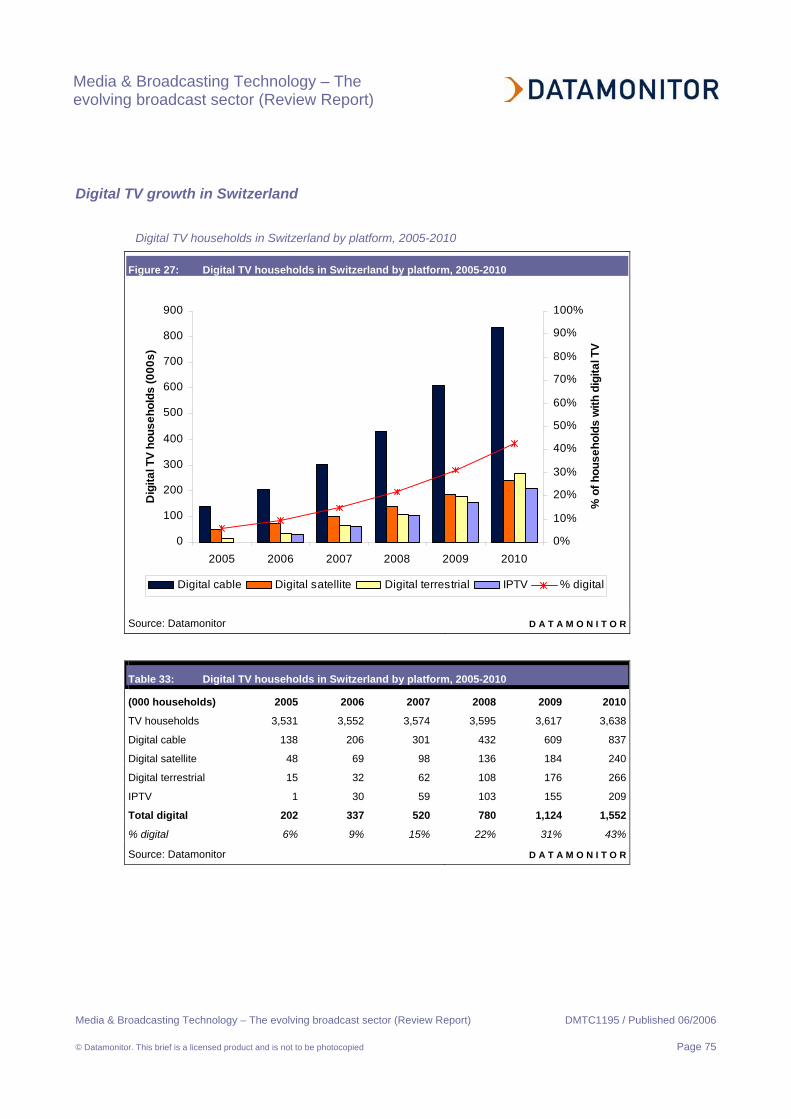
Media & Broadcasting Technology – The evolving broadcast sector (Review Report)
Media & Broadcasting Technology – The evolving broadcast sector (Review Report) DMTC1195 / Published 06/2006
© Datamonitor. This brief is a licensed product and is not to be photocopied Page 75
Digital TV growth in Switzerland
Digital TV households in Switzerland by platform, 2005-2010
Figure 27: Digital TV households in Switzerland by platform, 2005-2010
0
100
200
300
400
500
600
700
800
900
2005 2006 2007 2008 2009 2010
Dig
ital T
V ho
useh
olds
(000
s)
0%
10%
20%
30%
40%
50%
60%
70%
80%
90%
100%
% o
f hou
seho
lds
with
dig
ital T
VDigital cable Digital satellite Digital terrestrial IPTV % digital
Source: Datamonitor D A T A M O N I T O R
Table 33: Digital TV households in Switzerland by platform, 2005-2010
(000 households) 2005 2006 2007 2008 2009 2010
TV households 3,531 3,552 3,574 3,595 3,617 3,638
Digital cable 138 206 301 432 609 837
Digital satellite 48 69 98 136 184 240
Digital terrestrial 15 32 62 108 176 266
IPTV 1 30 59 103 155 209
Total digital 202 337 520 780 1,124 1,552
% digital 6% 9% 15% 22% 31% 43%
Source: Datamonitor D A T A M O N I T O R
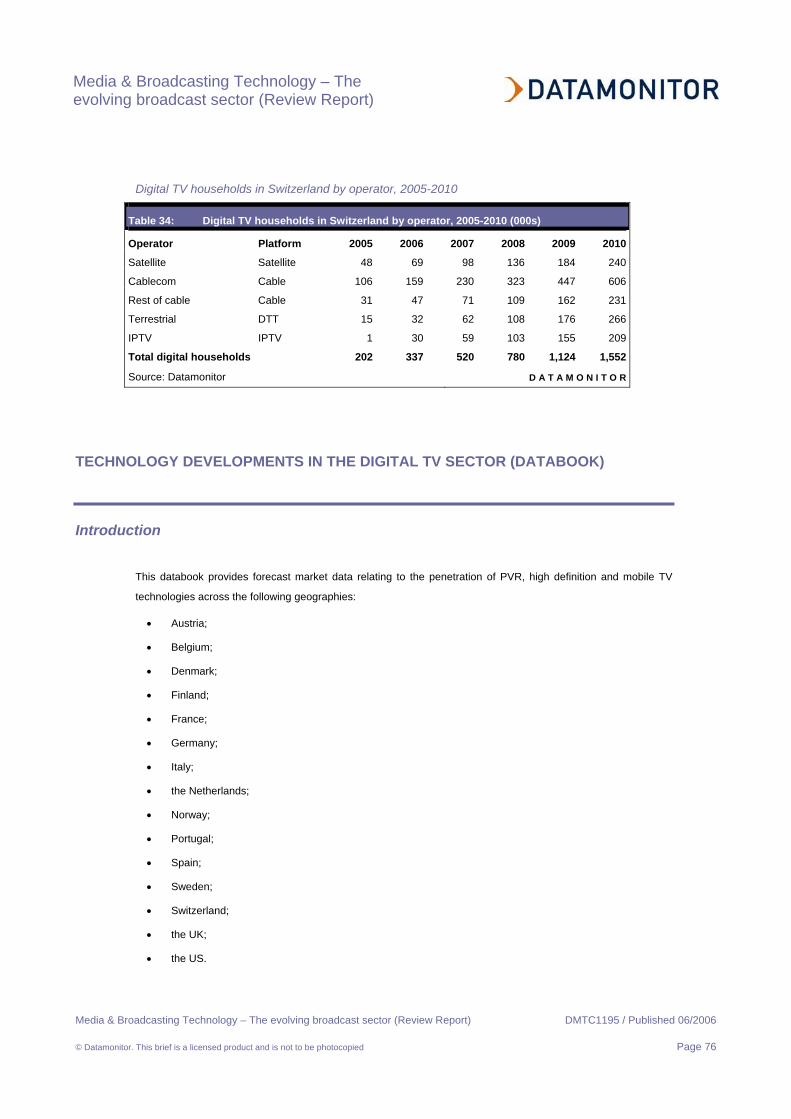
Media & Broadcasting Technology – The evolving broadcast sector (Review Report)
Media & Broadcasting Technology – The evolving broadcast sector (Review Report) DMTC1195 / Published 06/2006
© Datamonitor. This brief is a licensed product and is not to be photocopied Page 76
Digital TV households in Switzerland by operator, 2005-2010
Table 34: Digital TV households in Switzerland by operator, 2005-2010 (000s)
Operator Platform 2005 2006 2007 2008 2009 2010
Satellite Satellite 48 69 98 136 184 240
Cablecom Cable 106 159 230 323 447 606
Rest of cable Cable 31 47 71 109 162 231
Terrestrial DTT 15 32 62 108 176 266
IPTV IPTV 1 30 59 103 155 209
Total digital households 202 337 520 780 1,124 1,552
Source: Datamonitor D A T A M O N I T O R
TECHNOLOGY DEVELOPMENTS IN THE DIGITAL TV SECTOR (DATABOOK)
Introduction
This databook provides forecast market data relating to the penetration of PVR, high definition and mobile TV
technologies across the following geographies:
• Austria;
• Belgium;
• Denmark;
• Finland;
• France;
• Germany;
• Italy;
• the Netherlands;
• Norway;
• Portugal;
• Spain;
• Sweden;
• Switzerland;
• the UK;
• the US.

Media & Broadcasting Technology – The evolving broadcast sector (Review Report)
Media & Broadcasting Technology – The evolving broadcast sector (Review Report) DMTC1195 / Published 06/2006
© Datamonitor. This brief is a licensed product and is not to be photocopied Page 77
Table 35: Digital TV definitions
DMB Digital Multimedia Broadcasting (DMB), the first broadcast TV technology to be commercially deployed on mobile networks (in South Korea), can be divided into two headline technologies: satellite (S-DMB) and terrestrial (T-DMB). The DMB technology was essentially leveraged from the digital radio technology, Digital Audio Broadcast (DAB).
DVB-H The Digital Video Broadcasting (DVB) forum is responsible for the creation of multiple open standard broadcasting technologies which have formed the basis for most digital cable, satellite, terrestrial and IPTV deployments around the globe. DVB-H, where “H” stands for handheld, is the newest technology aimed at the mobile phone and portable device market, and is an extension of DVB-T, the digital terrestrial television standard.
HD High Definition (HD) TV means broadcast of television signals with a higher resolution than traditional formats (NTSC, SECAM, PAL) allow. HDTV is defined as 1080 active lines, 16:9 aspect ratio. However, in the ATSC broadcast standard used in the United States and other countries, any ATSC resolution with 720 or more active lines is considered HDTV.
ISDB-T ISDB-T (Integrated Services Digital Broadcasting – Terrestrial) was developed by the Association of Radio Industries and Business (ARIB) in Japan. The open standard was created for digital radio, video and multimedia services, and the Japanese digital terrestrial TV network began broadcasting in 2003 using the ISDB-T standard.
MediaFLO MediaFLO was developed by Qualcomm, the company behind CDMA, the Code Division Multiple Access mobile communication standard. It was researched and designed from scratch to provide a TV delivery system for mobile devices. MediaFLO provides an entire end-to-end solution (including efficient audio/video compression systems, H.264 and AAC+) for mobile operators to offer broadcast TV, with its Media Distribution System (MDS) handling content distribution, licensing and subscriptions (interfacing with the operator’s billing system).
PVR A personal video recorder (PVR) (or digital video recorder (DVR)) is a device that records video content to a hard drive-based digital storage medium.
Datamonitor D A T A M O N I T O R
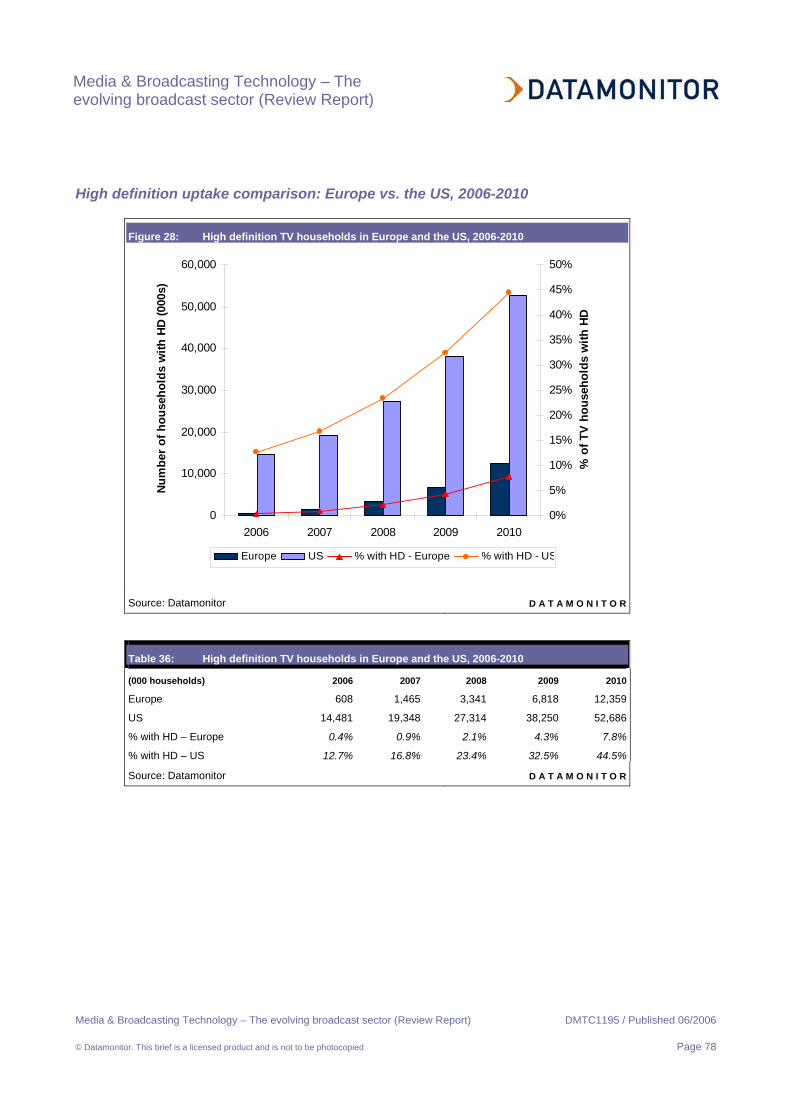
Media & Broadcasting Technology – The evolving broadcast sector (Review Report)
Media & Broadcasting Technology – The evolving broadcast sector (Review Report) DMTC1195 / Published 06/2006
© Datamonitor. This brief is a licensed product and is not to be photocopied Page 78
High definition uptake comparison: Europe vs. the US, 2006-2010
Figure 28: High definition TV households in Europe and the US, 2006-2010
0
10,000
20,000
30,000
40,000
50,000
60,000
2006 2007 2008 2009 2010
Num
ber o
f hou
seho
lds
with
HD
(000
s)
0%
5%
10%
15%
20%
25%
30%
35%
40%
45%
50%
% o
f TV
hous
ehol
ds w
ith H
D
Europe US % with HD - Europe % with HD - US
Source: Datamonitor D A T A M O N I T O R
Table 36: High definition TV households in Europe and the US, 2006-2010
(000 households) 2006 2007 2008 2009 2010
Europe 608 1,465 3,341 6,818 12,359
US 14,481 19,348 27,314 38,250 52,686
% with HD – Europe 0.4% 0.9% 2.1% 4.3% 7.8%
% with HD – US 12.7% 16.8% 23.4% 32.5% 44.5%
Source: Datamonitor D A T A M O N I T O R

Media & Broadcasting Technology – The evolving broadcast sector (Review Report)
Media & Broadcasting Technology – The evolving broadcast sector (Review Report) DMTC1195 / Published 06/2006
© Datamonitor. This brief is a licensed product and is not to be photocopied Page 79
High definition TV households in Austria, 2006-2010
Figure 29: High definition TV households in Austria, 2006-2010
-
50
100
150
200
250
300
2006 2007 2008 2009 2010
HD
hous
ehol
ds (0
00s)
0%
1%
2%
3%
4%
5%
6%
7%
8%
9%
% o
f TV
hous
ehol
ds w
ith H
D
HD households % of TV households with HD
Source: Datamonitor D A T A M O N I T O R
Table 37: High definition TV households in Austria, 2006-2010
(000s) 2006 2007 2008 2009 2010
HD households 14 33 77 152 275
% of TV households with HD 0.4% 1.0% 2.4% 4.7% 8.5%
Source: Datamonitor D A T A M O N I T O R

Media & Broadcasting Technology – The evolving broadcast sector (Review Report)
Media & Broadcasting Technology – The evolving broadcast sector (Review Report) DMTC1195 / Published 06/2006
© Datamonitor. This brief is a licensed product and is not to be photocopied Page 80
High definition TV households in Belgium, 2006-2010
Figure 30: High definition TV households in Belgium, 2006-2010
-
50
100
150
200
250
2006 2007 2008 2009 2010
HD
hous
ehol
ds (0
00s)
0%
1%
2%
3%
4%
5%
6%
% o
f TV
hous
ehol
ds w
ith H
D
HD households % of TV households with HD
Source: Datamonitor D A T A M O N I T O R
Table 38: High definition TV households in Belgium, 2006-2010
(000s) 2006 2007 2008 2009 2010
HD households 7 16 39 92 203
% of TV households with HD 0.2% 0.4% 0.9% 2.2% 4.8%
Source: Datamonitor D A T A M O N I T O R

Media & Broadcasting Technology – The evolving broadcast sector (Review Report)
Media & Broadcasting Technology – The evolving broadcast sector (Review Report) DMTC1195 / Published 06/2006
© Datamonitor. This brief is a licensed product and is not to be photocopied Page 81
High definition TV households in Denmark, 2006-2010
Figure 31: High definition TV households in Denmark, 2006-2010
-
50
100
150
200
250
2006 2007 2008 2009 2010
HD
hous
ehol
ds (0
00s)
0%
1%
2%
3%
4%
5%
6%
7%
8%
9%
10%
% o
f TV
hous
ehol
ds w
ith H
D
HD households % of TV households with HD
Source: Datamonitor D A T A M O N I T O R
Table 39: High definition TV households in Denmark, 2006-2010
(000s) 2006 2007 2008 2009 2010
HD households 12 21 47 100 214
% of TV households with HD 0.5% 0.9% 1.9% 4.0% 8.6%
Source: Datamonitor D A T A M O N I T O R

Media & Broadcasting Technology – The evolving broadcast sector (Review Report)
Media & Broadcasting Technology – The evolving broadcast sector (Review Report) DMTC1195 / Published 06/2006
© Datamonitor. This brief is a licensed product and is not to be photocopied Page 82
High definition TV households in Finland, 2006-2010
Figure 32: High definition TV households in Finland, 2006-2010
-
50
100
150
200
250
2006 2007 2008 2009 2010
HD
hous
ehol
ds (0
00s)
0%
1%
2%
3%
4%
5%
6%
7%
8%
9%
10%
% o
f TV
hous
ehol
ds w
ith H
D
HD households % of TV households with HD
Source: Datamonitor D A T A M O N I T O R
Table 40: High definition TV households in Finland, 2006-2010
(000s) 2006 2007 2008 2009 2010
HD households 3 13 42 97 195
% of TV households with HD 0.1% 0.6% 1.9% 4.3% 8.6%
Source: Datamonitor D A T A M O N I T O R

Media & Broadcasting Technology – The evolving broadcast sector (Review Report)
Media & Broadcasting Technology – The evolving broadcast sector (Review Report) DMTC1195 / Published 06/2006
© Datamonitor. This brief is a licensed product and is not to be photocopied Page 83
High definition TV households in France, 2006-2010
Figure 33: High definition TV households in France, 2006-2010
-
500
1,000
1,500
2,000
2,500
2006 2007 2008 2009 2010
HD h
ouse
hold
s (0
00s)
0%1%2%3%4%5%6%7%8%9%10%
% o
f TV
hou
seho
lds
with
HD
HD households % of TV households with HD
Source: Datamonitor D A T A M O N I T O R
Table 41: High definition TV households in France, 2006-2010
(000s) 2006 2007 2008 2009 2010
HD households 126 293 627 1,236 2,276
% of TV households with HD 0.5% 1.2% 2.6% 5.1% 9.3%
Source: Datamonitor D A T A M O N I T O R
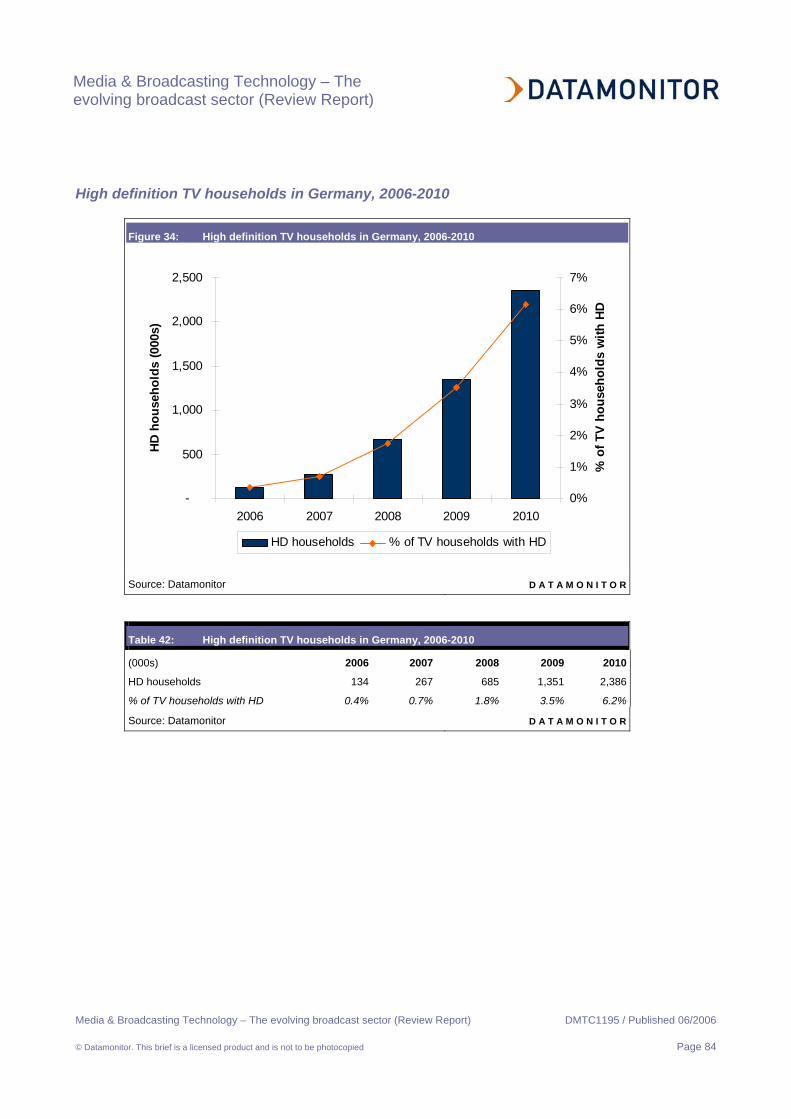
Media & Broadcasting Technology – The evolving broadcast sector (Review Report)
Media & Broadcasting Technology – The evolving broadcast sector (Review Report) DMTC1195 / Published 06/2006
© Datamonitor. This brief is a licensed product and is not to be photocopied Page 84
High definition TV households in Germany, 2006-2010
Figure 34: High definition TV households in Germany, 2006-2010
-
500
1,000
1,500
2,000
2,500
2006 2007 2008 2009 2010
HD
hous
ehol
ds (0
00s)
0%
1%
2%
3%
4%
5%
6%
7%
% o
f TV
hous
ehol
ds w
ith H
D
HD households % of TV households with HD
Source: Datamonitor D A T A M O N I T O R
Table 42: High definition TV households in Germany, 2006-2010
(000s) 2006 2007 2008 2009 2010
HD households 134 267 685 1,351 2,386
% of TV households with HD 0.4% 0.7% 1.8% 3.5% 6.2%
Source: Datamonitor D A T A M O N I T O R

Media & Broadcasting Technology – The evolving broadcast sector (Review Report)
Media & Broadcasting Technology – The evolving broadcast sector (Review Report) DMTC1195 / Published 06/2006
© Datamonitor. This brief is a licensed product and is not to be photocopied Page 85
High definition TV households in Italy, 2006-2010
Figure 35: High definition TV households in Italy, 2006-2010
-
200
400
600
800
1,000
1,200
1,400
1,600
2006 2007 2008 2009 2010
HD h
ouse
hold
s (0
00s)
0%
1%
2%
3%
4%
5%
6%
7%
% o
f TV
hous
ehol
ds w
ith H
D
HD households % of TV households with HD
Source: Datamonitor D A T A M O N I T O R
Table 43: High definition TV households in Italy, 2006-2010
(000s) 2006 2007 2008 2009 2010
HD households 49 134 346 689 1,341
% of TV households with HD 0.2% 0.6% 1.6% 3.1% 6.0%
Source: Datamonitor D A T A M O N I T O R

Media & Broadcasting Technology – The evolving broadcast sector (Review Report)
Media & Broadcasting Technology – The evolving broadcast sector (Review Report) DMTC1195 / Published 06/2006
© Datamonitor. This brief is a licensed product and is not to be photocopied Page 86
High definition TV households in the Netherlands, 2006-2010
Figure 36: High definition TV households in the Netherlands, 2006-2010
-
100
200
300
400
500
600
700
800
2006 2007 2008 2009 2010
HD
hous
ehol
ds (0
00s)
0%
2%
4%
6%
8%
10%
12%
% o
f TV
hous
ehol
ds w
ith H
D
HD households % of TV households with HD
Source: Datamonitor D A T A M O N I T O R
Table 44: High definition TV households in the Netherlands, 2006-2010
(000s) 2006 2007 2008 2009 2010
HD households 14 52 135 321 674
% of TV households with HD 0.2% 0.8% 1.9% 4.6% 9.6%
Source: Datamonitor D A T A M O N I T O R

Media & Broadcasting Technology – The evolving broadcast sector (Review Report)
Media & Broadcasting Technology – The evolving broadcast sector (Review Report) DMTC1195 / Published 06/2006
© Datamonitor. This brief is a licensed product and is not to be photocopied Page 87
High definition TV households in Norway, 2006-2010
Figure 37: High definition TV households in Norway, 2006-2010
-
20
40
60
80
100
120
140
160
180
200
2006 2007 2008 2009 2010
HD
hous
ehol
ds (0
00s)
0%
1%
2%
3%
4%
5%
6%
7%
8%
9%
10%
% o
f TV
hous
ehol
ds w
ith H
D
HD households % of TV households with HD
Source: Datamonitor D A T A M O N I T O R
Table 45: High definition TV households in Norway, 2006-2010
(000s) 2006 2007 2008 2009 2010
HD households 12 23 51 104 187
% of TV households with HD 0.6% 1.1% 2.5% 5.0% 9.0%
Source: Datamonitor D A T A M O N I T O R
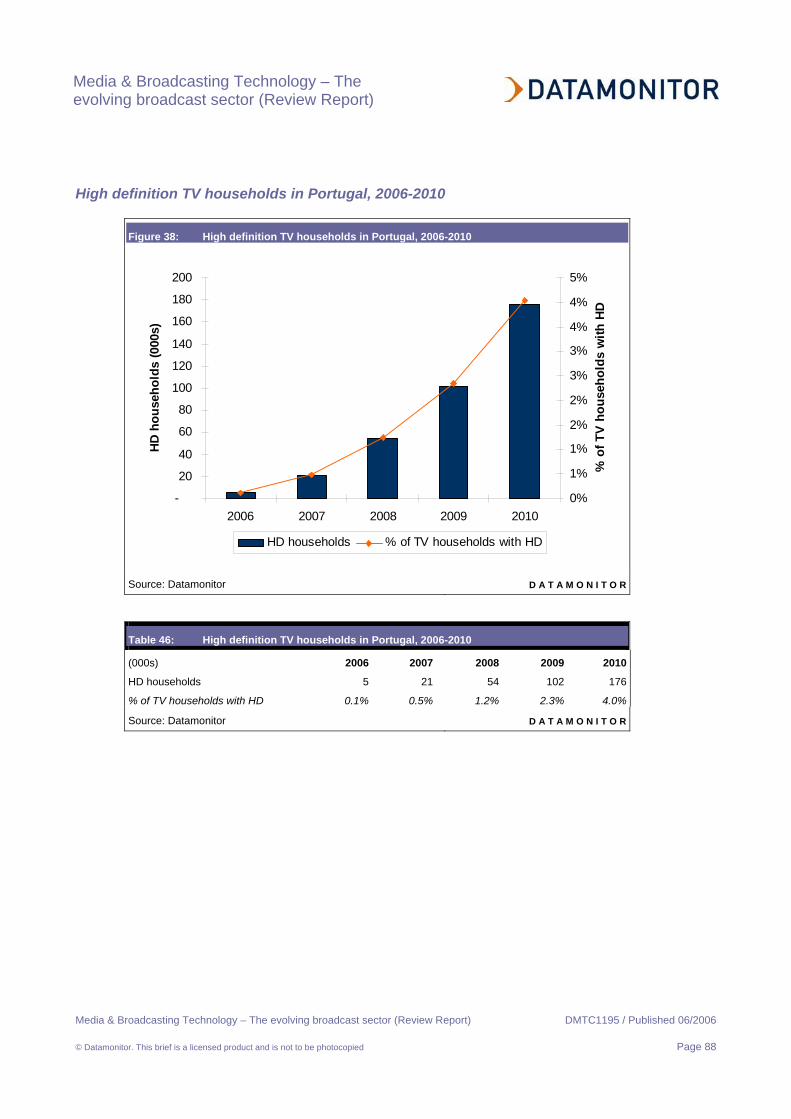
Media & Broadcasting Technology – The evolving broadcast sector (Review Report)
Media & Broadcasting Technology – The evolving broadcast sector (Review Report) DMTC1195 / Published 06/2006
© Datamonitor. This brief is a licensed product and is not to be photocopied Page 88
High definition TV households in Portugal, 2006-2010
Figure 38: High definition TV households in Portugal, 2006-2010
-
20
40
60
80
100
120
140
160
180
200
2006 2007 2008 2009 2010
HD
hous
ehol
ds (0
00s)
0%
1%
1%
2%
2%
3%
3%
4%
4%
5%
% o
f TV
hous
ehol
ds w
ith H
D
HD households % of TV households with HD
Source: Datamonitor D A T A M O N I T O R
Table 46: High definition TV households in Portugal, 2006-2010
(000s) 2006 2007 2008 2009 2010
HD households 5 21 54 102 176
% of TV households with HD 0.1% 0.5% 1.2% 2.3% 4.0%
Source: Datamonitor D A T A M O N I T O R

Media & Broadcasting Technology – The evolving broadcast sector (Review Report)
Media & Broadcasting Technology – The evolving broadcast sector (Review Report) DMTC1195 / Published 06/2006
© Datamonitor. This brief is a licensed product and is not to be photocopied Page 89
High definition TV households in Spain, 2006-2010
Figure 39: High definition TV households in Spain, 2006-2010
-
100
200
300
400
500
600
700
800
2006 2007 2008 2009 2010
HD h
ouse
hold
s (0
00s)
0%
1%
2%
3%
4%
5%
6%
% o
f TV
hous
ehol
ds w
ith H
D
HD households % of TV households with HD
Source: Datamonitor D A T A M O N I T O R
Table 47: High definition TV households in Spain, 2006-2010
(000s) 2006 2007 2008 2009 2010
HD households 9 59 185 407 701
% of TV households with HD 0.1% 0.4% 1.4% 3.0% 5.0%
Source: Datamonitor D A T A M O N I T O R

Media & Broadcasting Technology – The evolving broadcast sector (Review Report)
Media & Broadcasting Technology – The evolving broadcast sector (Review Report) DMTC1195 / Published 06/2006
© Datamonitor. This brief is a licensed product and is not to be photocopied Page 90
High definition TV households in Sweden, 2006-2010
Figure 40: High definition TV households in Sweden, 2006-2010
-
50
100
150
200
250
300
350
400
450
2006 2007 2008 2009 2010
HD
hous
ehol
ds (0
00s)
0%
1%
2%
3%
4%
5%
6%
7%
8%
9%
10%
% o
f TV
hous
ehol
ds w
ith H
D
HD households % of TV households with HD
Source: Datamonitor D A T A M O N I T O R
Table 48: High definition TV households in Sweden, 2006-2010
(000s) 2006 2007 2008 2009 2010
HD households 14 42 115 243 421
% of TV households with HD 0.3% 1.0% 2.6% 5.4% 9.3%
Source: Datamonitor D A T A M O N I T O R
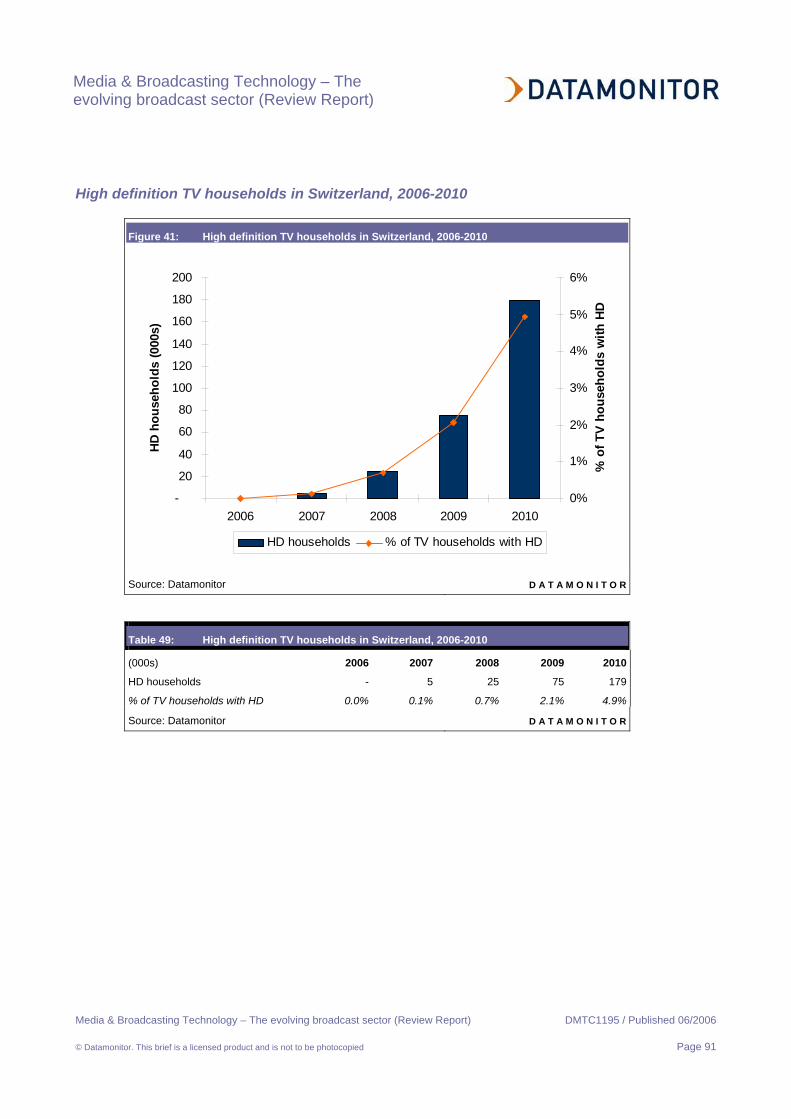
Media & Broadcasting Technology – The evolving broadcast sector (Review Report)
Media & Broadcasting Technology – The evolving broadcast sector (Review Report) DMTC1195 / Published 06/2006
© Datamonitor. This brief is a licensed product and is not to be photocopied Page 91
High definition TV households in Switzerland, 2006-2010
Figure 41: High definition TV households in Switzerland, 2006-2010
-
20
40
60
80
100
120
140
160
180
200
2006 2007 2008 2009 2010
HD
hous
ehol
ds (0
00s)
0%
1%
2%
3%
4%
5%
6%
% o
f TV
hous
ehol
ds w
ith H
D
HD households % of TV households with HD
Source: Datamonitor D A T A M O N I T O R
Table 49: High definition TV households in Switzerland, 2006-2010
(000s) 2006 2007 2008 2009 2010
HD households - 5 25 75 179
% of TV households with HD 0.0% 0.1% 0.7% 2.1% 4.9%
Source: Datamonitor D A T A M O N I T O R
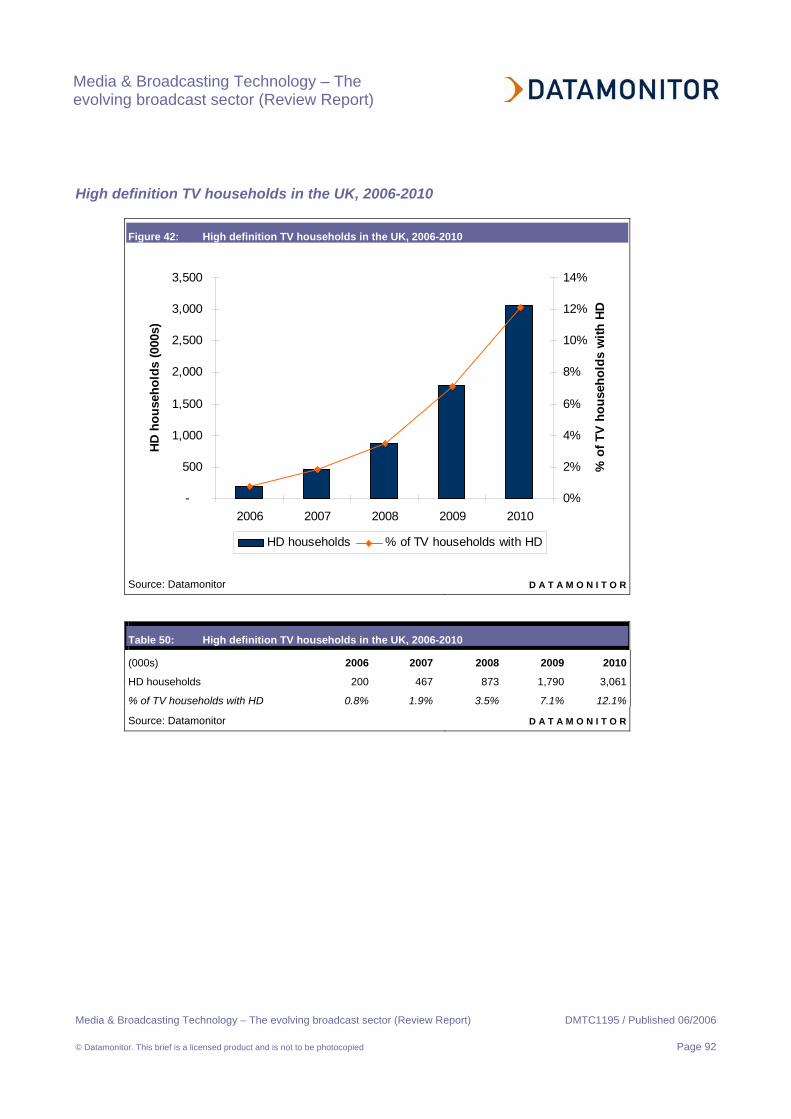
Media & Broadcasting Technology – The evolving broadcast sector (Review Report)
Media & Broadcasting Technology – The evolving broadcast sector (Review Report) DMTC1195 / Published 06/2006
© Datamonitor. This brief is a licensed product and is not to be photocopied Page 92
High definition TV households in the UK, 2006-2010
Figure 42: High definition TV households in the UK, 2006-2010
-
500
1,000
1,500
2,000
2,500
3,000
3,500
2006 2007 2008 2009 2010
HD
hous
ehol
ds (0
00s)
0%
2%
4%
6%
8%
10%
12%
14%
% o
f TV
hous
ehol
ds w
ith H
D
HD households % of TV households with HD
Source: Datamonitor D A T A M O N I T O R
Table 50: High definition TV households in the UK, 2006-2010
(000s) 2006 2007 2008 2009 2010
HD households 200 467 873 1,790 3,061
% of TV households with HD 0.8% 1.9% 3.5% 7.1% 12.1%
Source: Datamonitor D A T A M O N I T O R

Media & Broadcasting Technology – The evolving broadcast sector (Review Report)
Media & Broadcasting Technology – The evolving broadcast sector (Review Report) DMTC1195 / Published 06/2006
© Datamonitor. This brief is a licensed product and is not to be photocopied Page 93
High definition TV households in the US, 2006-2010
Figure 43: High definition TV households in the US, 2006-2010
-
10,000
20,000
30,000
40,000
50,000
60,000
2006 2007 2008 2009 2010
HD h
ouse
hold
s (0
00s)
0%
5%
10%
15%
20%
25%
30%
35%
40%
45%
50%
% o
f TV
hous
ehol
ds w
ith H
D
HD households % of TV households with HD
Source: Datamonitor D A T A M O N I T O R
Table 51: High definition TV households in the US, 2006-2010
(000s) 2006 2007 2008 2009 2010
HD households 14,481 19,348 27,314 38,250 52,686
% of TV households with HD 12.7% 16.8% 23.4% 32.5% 44.5%
Source: Datamonitor D A T A M O N I T O R
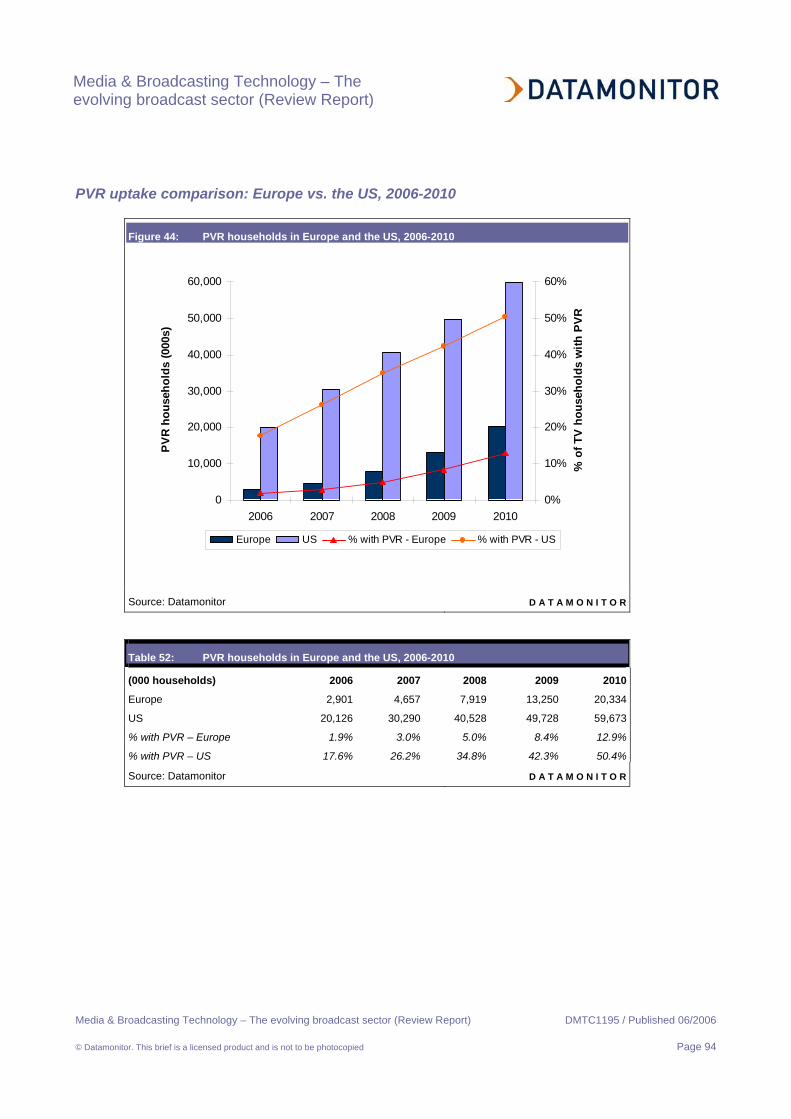
Media & Broadcasting Technology – The evolving broadcast sector (Review Report)
Media & Broadcasting Technology – The evolving broadcast sector (Review Report) DMTC1195 / Published 06/2006
© Datamonitor. This brief is a licensed product and is not to be photocopied Page 94
PVR uptake comparison: Europe vs. the US, 2006-2010
Figure 44: PVR households in Europe and the US, 2006-2010
0
10,000
20,000
30,000
40,000
50,000
60,000
2006 2007 2008 2009 2010
PVR
hou
seho
lds
(000
s)
0%
10%
20%
30%
40%
50%
60%
% o
f TV
hous
ehol
ds w
ith P
VR
Europe US % with PVR - Europe % with PVR - US
Source: Datamonitor D A T A M O N I T O R
Table 52: PVR households in Europe and the US, 2006-2010
(000 households) 2006 2007 2008 2009 2010
Europe 2,901 4,657 7,919 13,250 20,334
US 20,126 30,290 40,528 49,728 59,673
% with PVR – Europe 1.9% 3.0% 5.0% 8.4% 12.9%
% with PVR – US 17.6% 26.2% 34.8% 42.3% 50.4%
Source: Datamonitor D A T A M O N I T O R

Media & Broadcasting Technology – The evolving broadcast sector (Review Report)
Media & Broadcasting Technology – The evolving broadcast sector (Review Report) DMTC1195 / Published 06/2006
© Datamonitor. This brief is a licensed product and is not to be photocopied Page 95
PVR households in Austria, 2006-2010
Figure 45: PVR households in Austria, 2006-2010
0
50
100
150
200
250
300
350
400
2006 2007 2008 2009 2010
PVR
hous
ehol
ds (0
00s)
0%
2%
4%
6%
8%
10%
12%
% o
f TV
hous
ehol
ds w
ith P
VR
PVR households % of TV households with PVR
Source: Datamonitor D A T A M O N I T O R
Table 53: PVR households in Austria, 2006-2010
(000s) 2006 2007 2008 2009 2010
PVR households 24 53 115 212 344
% of TV households with PVR 0.7% 1.6% 3.6% 6.6% 10.6%
Source: Datamonitor D A T A M O N I T O R
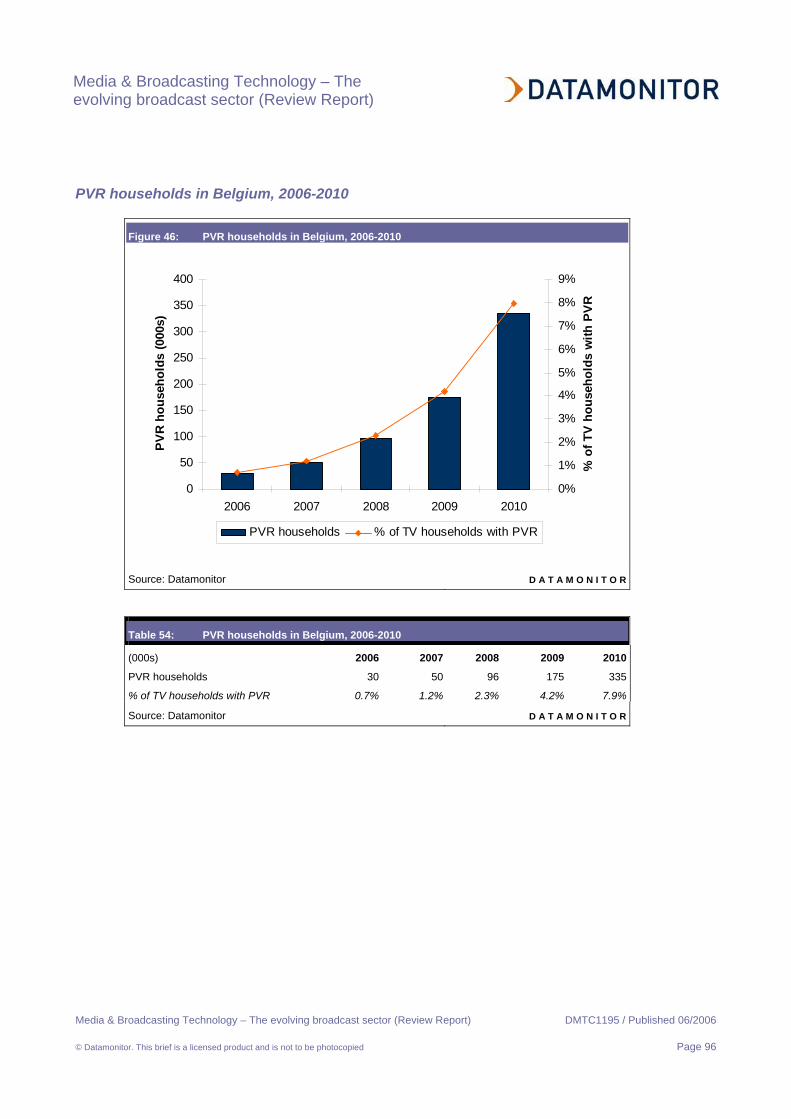
Media & Broadcasting Technology – The evolving broadcast sector (Review Report)
Media & Broadcasting Technology – The evolving broadcast sector (Review Report) DMTC1195 / Published 06/2006
© Datamonitor. This brief is a licensed product and is not to be photocopied Page 96
PVR households in Belgium, 2006-2010
Figure 46: PVR households in Belgium, 2006-2010
0
50
100
150
200
250
300
350
400
2006 2007 2008 2009 2010
PV
R ho
useh
olds
(000
s)
0%
1%
2%
3%
4%
5%
6%
7%
8%
9%
% o
f TV
hous
ehol
ds w
ith P
VR
PVR households % of TV households with PVR
Source: Datamonitor D A T A M O N I T O R
Table 54: PVR households in Belgium, 2006-2010
(000s) 2006 2007 2008 2009 2010
PVR households 30 50 96 175 335
% of TV households with PVR 0.7% 1.2% 2.3% 4.2% 7.9%
Source: Datamonitor D A T A M O N I T O R

Media & Broadcasting Technology – The evolving broadcast sector (Review Report)
Media & Broadcasting Technology – The evolving broadcast sector (Review Report) DMTC1195 / Published 06/2006
© Datamonitor. This brief is a licensed product and is not to be photocopied Page 97
PVR households in Denmark, 2006-2010
Figure 47: PVR households in Denmark, 2006-2010
0
50
100
150
200
250
2006 2007 2008 2009 2010
PVR
hou
seho
lds
(000
s)
0%
1%
2%
3%
4%
5%
6%
7%
8%
9%
10%
% o
f TV
hou
seho
lds
with
PVR
PVR households % of TV households with PVR
Source: Datamonitor D A T A M O N I T O R
Table 55: PVR households in Denmark, 2006-2010
(000s) 2006 2007 2008 2009 2010
PVR households 12 29 66 133 226
% of TV households with PVR 0.5% 1.2% 2.7% 5.4% 9.1%
Source: Datamonitor D A T A M O N I T O R

Media & Broadcasting Technology – The evolving broadcast sector (Review Report)
Media & Broadcasting Technology – The evolving broadcast sector (Review Report) DMTC1195 / Published 06/2006
© Datamonitor. This brief is a licensed product and is not to be photocopied Page 98
PVR households in Finland, 2006-2010
Figure 48: PVR households in Finland, 2006-2010
0
50
100
150
200
250
2006 2007 2008 2009 2010
PVR
hou
seho
lds
(000
s)
0%
2%
4%
6%
8%
10%
12%
% o
f TV
hou
seho
lds
with
PVR
PVR households % of TV households with PVR
Source: Datamonitor D A T A M O N I T O R
Table 56: PVR households in Finland, 2006-2010
(000s) 2006 2007 2008 2009 2010
PVR households 21 42 85 143 234
% of TV households with PVR 0.9% 1.9% 3.8% 6.3% 10.3%
Source: Datamonitor D A T A M O N I T O R
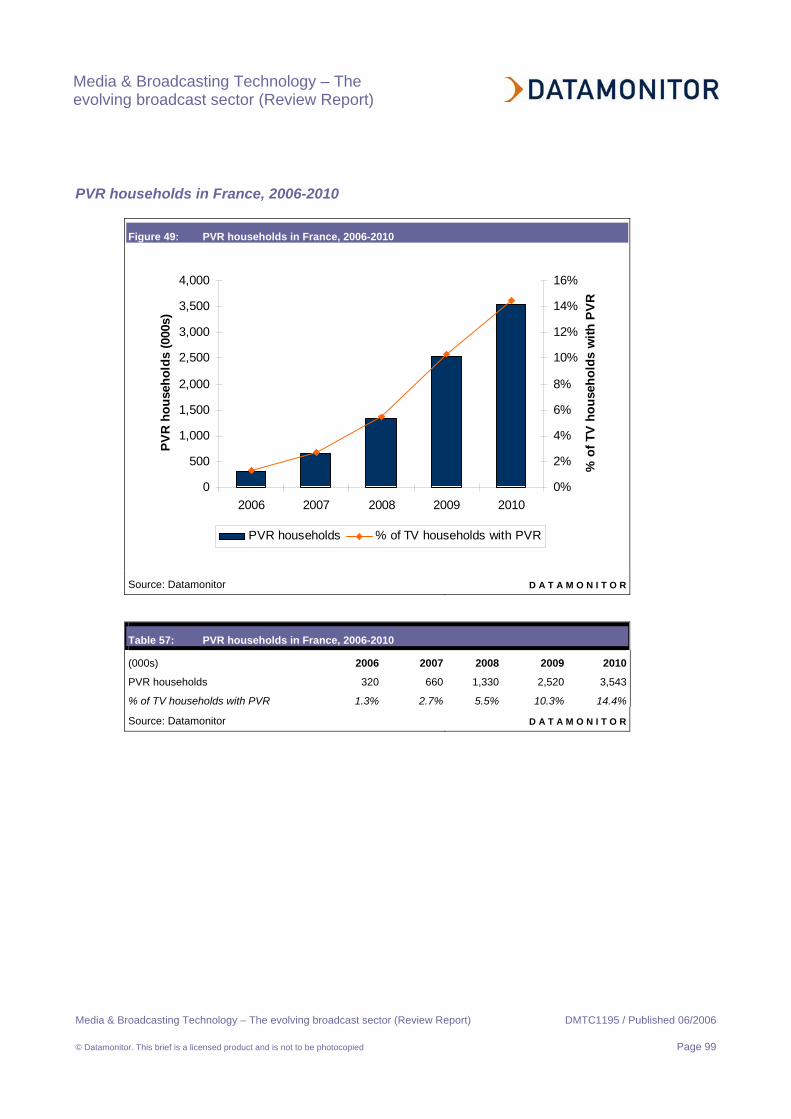
Media & Broadcasting Technology – The evolving broadcast sector (Review Report)
Media & Broadcasting Technology – The evolving broadcast sector (Review Report) DMTC1195 / Published 06/2006
© Datamonitor. This brief is a licensed product and is not to be photocopied Page 99
PVR households in France, 2006-2010
Figure 49: PVR households in France, 2006-2010
0
500
1,000
1,500
2,000
2,500
3,000
3,500
4,000
2006 2007 2008 2009 2010
PVR
hous
ehol
ds (0
00s)
0%
2%
4%
6%
8%
10%
12%
14%
16%
% o
f TV
hous
ehol
ds w
ith P
VR
PVR households % of TV households with PVR
Source: Datamonitor D A T A M O N I T O R
Table 57: PVR households in France, 2006-2010
(000s) 2006 2007 2008 2009 2010
PVR households 320 660 1,330 2,520 3,543
% of TV households with PVR 1.3% 2.7% 5.5% 10.3% 14.4%
Source: Datamonitor D A T A M O N I T O R
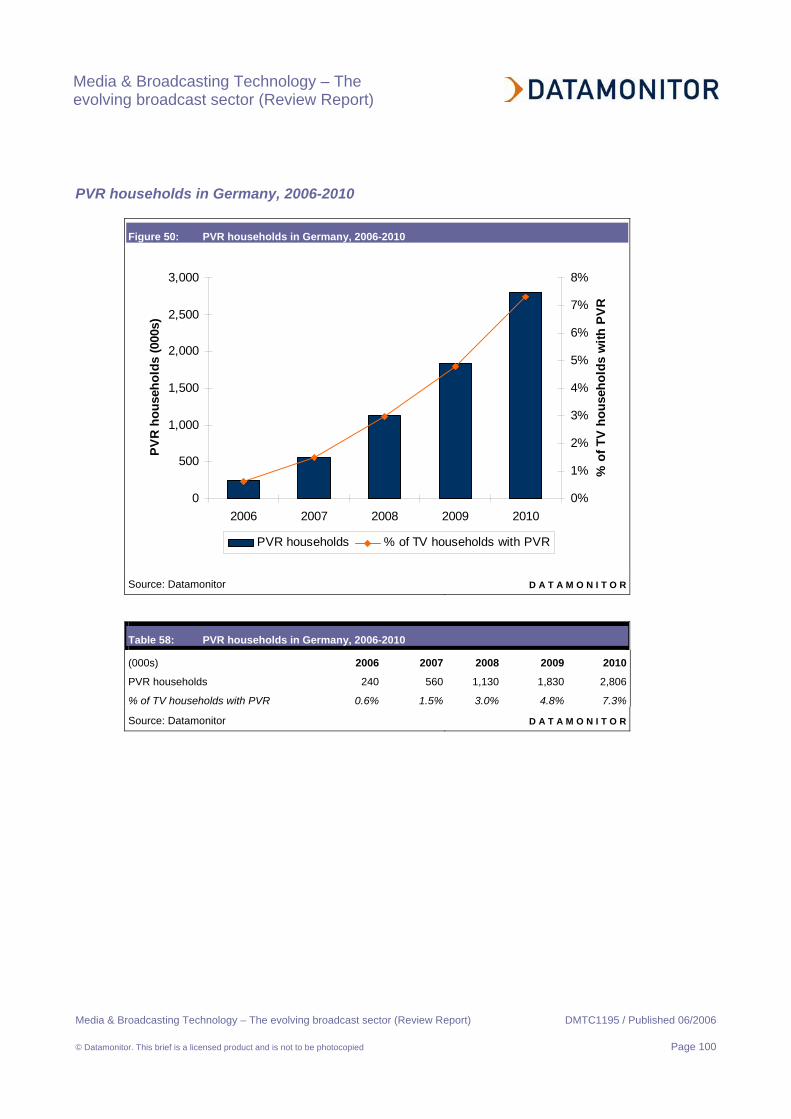
Media & Broadcasting Technology – The evolving broadcast sector (Review Report)
Media & Broadcasting Technology – The evolving broadcast sector (Review Report) DMTC1195 / Published 06/2006
© Datamonitor. This brief is a licensed product and is not to be photocopied Page 100
PVR households in Germany, 2006-2010
Figure 50: PVR households in Germany, 2006-2010
0
500
1,000
1,500
2,000
2,500
3,000
2006 2007 2008 2009 2010
PVR
hous
ehol
ds (0
00s)
0%
1%
2%
3%
4%
5%
6%
7%
8%
% o
f TV
hou
seho
lds
with
PVR
PVR households % of TV households with PVR
Source: Datamonitor D A T A M O N I T O R
Table 58: PVR households in Germany, 2006-2010
(000s) 2006 2007 2008 2009 2010
PVR households 240 560 1,130 1,830 2,806
% of TV households with PVR 0.6% 1.5% 3.0% 4.8% 7.3%
Source: Datamonitor D A T A M O N I T O R
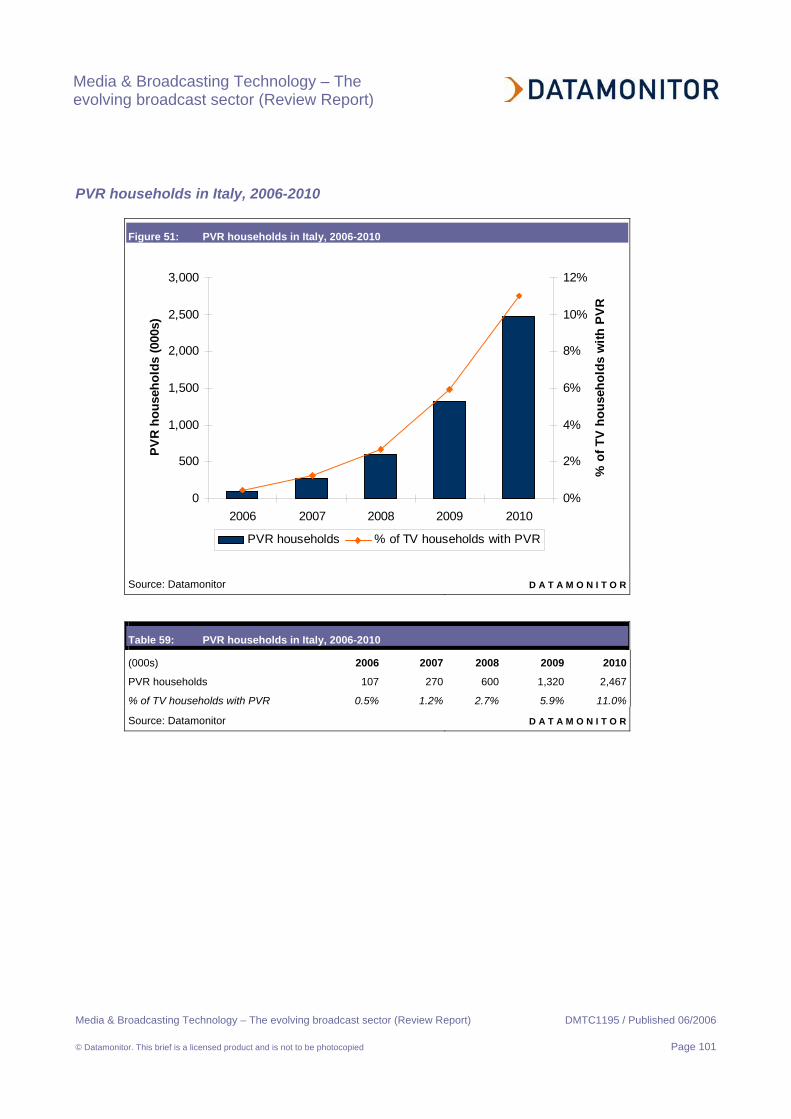
Media & Broadcasting Technology – The evolving broadcast sector (Review Report)
Media & Broadcasting Technology – The evolving broadcast sector (Review Report) DMTC1195 / Published 06/2006
© Datamonitor. This brief is a licensed product and is not to be photocopied Page 101
PVR households in Italy, 2006-2010
Figure 51: PVR households in Italy, 2006-2010
0
500
1,000
1,500
2,000
2,500
3,000
2006 2007 2008 2009 2010
PVR
hous
ehol
ds (0
00s)
0%
2%
4%
6%
8%
10%
12%
% o
f TV
hou
seho
lds
with
PVR
PVR households % of TV households with PVR
Source: Datamonitor D A T A M O N I T O R
Table 59: PVR households in Italy, 2006-2010
(000s) 2006 2007 2008 2009 2010
PVR households 107 270 600 1,320 2,467
% of TV households with PVR 0.5% 1.2% 2.7% 5.9% 11.0%
Source: Datamonitor D A T A M O N I T O R

Media & Broadcasting Technology – The evolving broadcast sector (Review Report)
Media & Broadcasting Technology – The evolving broadcast sector (Review Report) DMTC1195 / Published 06/2006
© Datamonitor. This brief is a licensed product and is not to be photocopied Page 102
PVR households in the Netherlands, 2006-2010
Figure 52: PVR households in the Netherlands, 2006-2010
0
100
200
300
400
500
600
700
800
900
2006 2007 2008 2009 2010
PVR
hous
ehol
ds (0
00s)
0%
2%
4%
6%
8%
10%
12%
14%
% o
f TV
hou
seho
lds
with
PVR
PVR households % of TV households with PVR
Source: Datamonitor D A T A M O N I T O R
Table 60: PVR households in the Netherlands, 2006-2010
(000s) 2006 2007 2008 2009 2010
PVR households 34 80 194 423 829
% of TV households with PVR 0.5% 1.2% 2.8% 6.1% 11.8%
Source: Datamonitor D A T A M O N I T O R

Media & Broadcasting Technology – The evolving broadcast sector (Review Report)
Media & Broadcasting Technology – The evolving broadcast sector (Review Report) DMTC1195 / Published 06/2006
© Datamonitor. This brief is a licensed product and is not to be photocopied Page 103
PVR households in Norway, 2006-2010
Figure 53: PVR households in Norway, 2006-2010
0
50
100
150
200
250
300
2006 2007 2008 2009 2010
PVR
hou
seho
lds
(000
s)
0%
2%
4%
6%
8%
10%
12%
14%
% o
f TV
hou
seho
lds
with
PVR
PVR households % of TV households with PVR
Source: Datamonitor D A T A M O N I T O R
Table 61: PVR households in Norway, 2006-2010
(000s) 2006 2007 2008 2009 2010
PVR households 14 38 80 156 264
% of TV households with PVR 0.7% 1.9% 3.9% 7.6% 12.7%
Source: Datamonitor D A T A M O N I T O R

Media & Broadcasting Technology – The evolving broadcast sector (Review Report)
Media & Broadcasting Technology – The evolving broadcast sector (Review Report) DMTC1195 / Published 06/2006
© Datamonitor. This brief is a licensed product and is not to be photocopied Page 104
PVR households in Portugal, 2006-2010
Figure 54: PVR households in Portugal, 2006-2010
0
50
100
150
200
250
300
2006 2007 2008 2009 2010
PVR
hou
seho
lds
(000
s)
0%
1%
2%
3%
4%
5%
6%
% o
f TV
hou
seho
lds
with
PVR
PVR households % of TV households with PVR
Source: Datamonitor D A T A M O N I T O R
Table 62: PVR households in Portugal, 2006-2010
(000s) 2006 2007 2008 2009 2010
PVR households 5 21 54 125 247
% of TV households with PVR 0.1% 0.5% 1.2% 2.9% 5.7%
Source: Datamonitor D A T A M O N I T O R
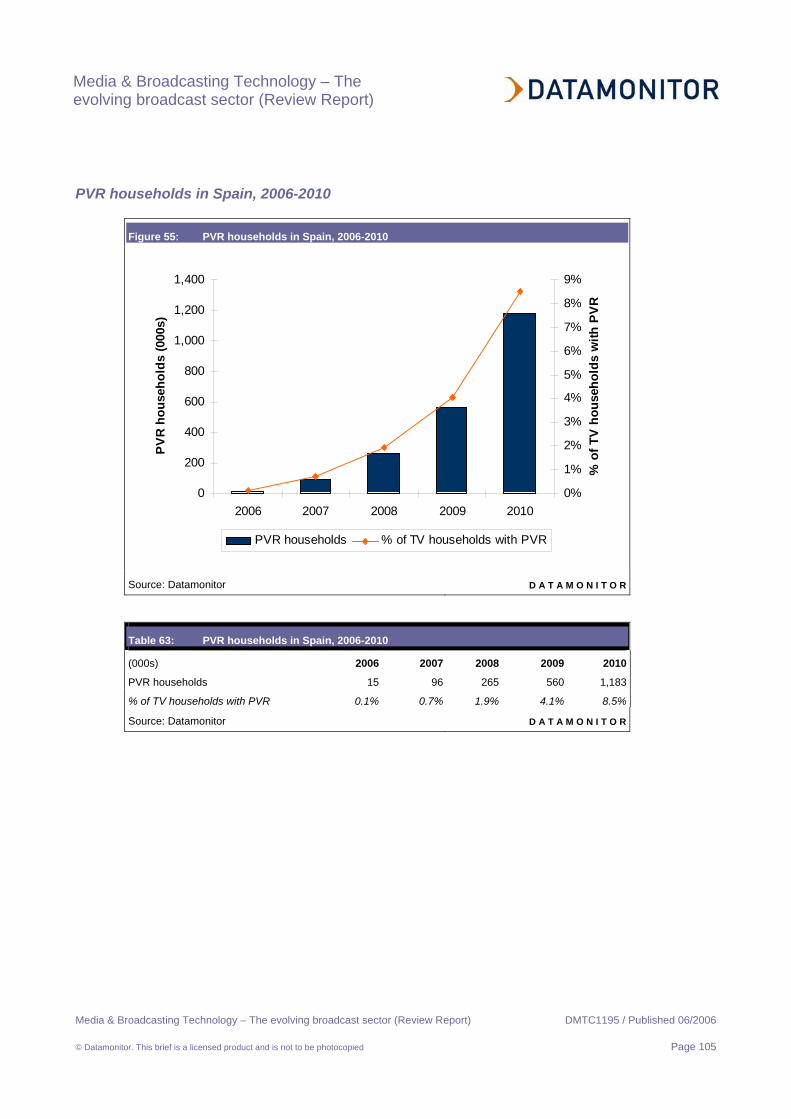
Media & Broadcasting Technology – The evolving broadcast sector (Review Report)
Media & Broadcasting Technology – The evolving broadcast sector (Review Report) DMTC1195 / Published 06/2006
© Datamonitor. This brief is a licensed product and is not to be photocopied Page 105
PVR households in Spain, 2006-2010
Figure 55: PVR households in Spain, 2006-2010
0
200
400
600
800
1,000
1,200
1,400
2006 2007 2008 2009 2010
PV
R ho
useh
olds
(000
s)
0%
1%
2%
3%
4%
5%
6%
7%
8%
9%
% o
f TV
hous
ehol
ds w
ith P
VR
PVR households % of TV households with PVR
Source: Datamonitor D A T A M O N I T O R
Table 63: PVR households in Spain, 2006-2010
(000s) 2006 2007 2008 2009 2010
PVR households 15 96 265 560 1,183
% of TV households with PVR 0.1% 0.7% 1.9% 4.1% 8.5%
Source: Datamonitor D A T A M O N I T O R

Media & Broadcasting Technology – The evolving broadcast sector (Review Report)
Media & Broadcasting Technology – The evolving broadcast sector (Review Report) DMTC1195 / Published 06/2006
© Datamonitor. This brief is a licensed product and is not to be photocopied Page 106
PVR households in Sweden, 2006-2010
Figure 56: PVR households in Sweden, 2006-2010
0
100
200
300
400
500
600
2006 2007 2008 2009 2010
PVR
hou
seho
lds
(000
s)
0%
2%
4%
6%
8%
10%
12%
% o
f TV
hou
seho
lds
with
PVR
PVR households % of TV households with PVR
Source: Datamonitor D A T A M O N I T O R
Table 64: PVR households in Sweden, 2006-2010
(000s) 2006 2007 2008 2009 2010
PVR households 22 56 134 273 482
% of TV households with PVR 0.5% 1.3% 3.0% 6.1% 10.7%
Source: Datamonitor D A T A M O N I T O R

Media & Broadcasting Technology – The evolving broadcast sector (Review Report)
Media & Broadcasting Technology – The evolving broadcast sector (Review Report) DMTC1195 / Published 06/2006
© Datamonitor. This brief is a licensed product and is not to be photocopied Page 107
PVR households in Switzerland, 2006-2010
Figure 57: PVR households in Switzerland, 2006-2010
0
50
100
150
200
250
2006 2007 2008 2009 2010
PVR
hous
ehol
ds (0
00s)
0%
1%
2%
3%
4%
5%
6%
7%
% o
f TV
hou
seho
lds
with
PVR
PVR households % of TV households with PVR
Source: Datamonitor D A T A M O N I T O R
Table 65: PVR households in Switzerland, 2006-2010
(000s) 2006 2007 2008 2009 2010
PVR households 26 42 68 120 213
% of TV households with PVR 0.7% 1.2% 1.9% 3.3% 5.9%
Source: Datamonitor D A T A M O N I T O R
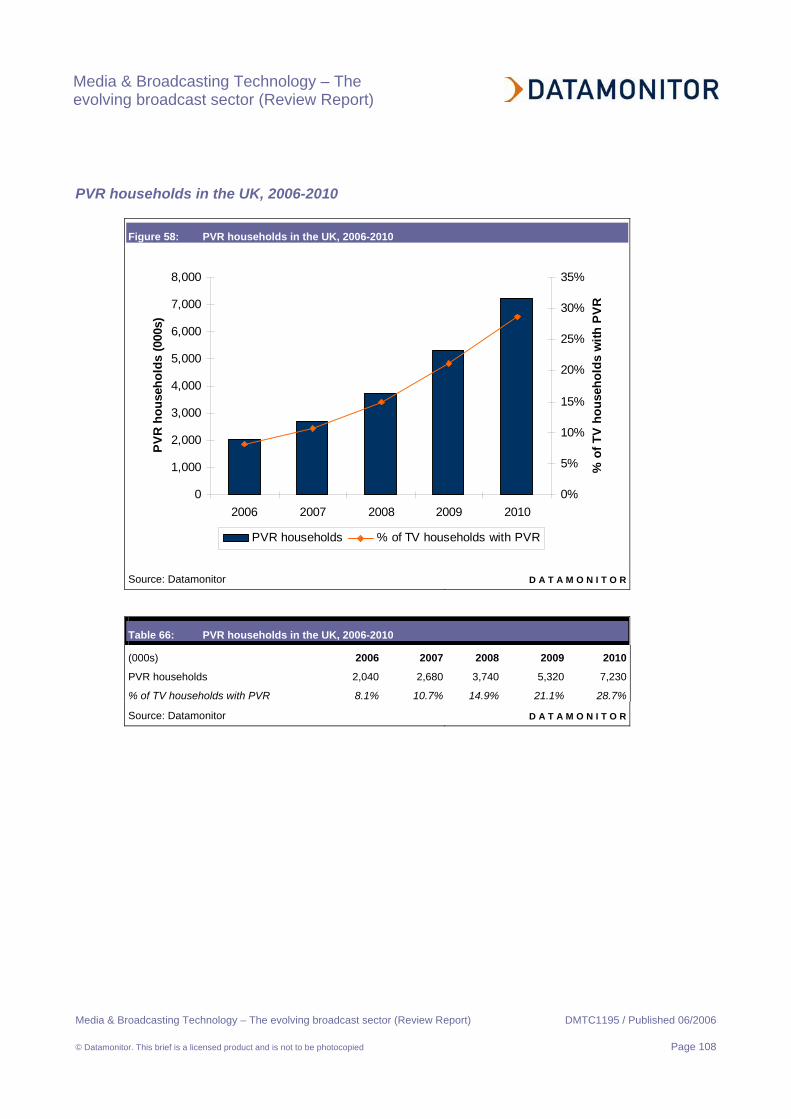
Media & Broadcasting Technology – The evolving broadcast sector (Review Report)
Media & Broadcasting Technology – The evolving broadcast sector (Review Report) DMTC1195 / Published 06/2006
© Datamonitor. This brief is a licensed product and is not to be photocopied Page 108
PVR households in the UK, 2006-2010
Figure 58: PVR households in the UK, 2006-2010
0
1,000
2,000
3,000
4,000
5,000
6,000
7,000
8,000
2006 2007 2008 2009 2010
PVR
hou
seho
lds
(000
s)
0%
5%
10%
15%
20%
25%
30%
35%
% o
f TV
hou
seho
lds
with
PVR
PVR households % of TV households with PVR
Source: Datamonitor D A T A M O N I T O R
Table 66: PVR households in the UK, 2006-2010
(000s) 2006 2007 2008 2009 2010
PVR households 2,040 2,680 3,740 5,320 7,230
% of TV households with PVR 8.1% 10.7% 14.9% 21.1% 28.7%
Source: Datamonitor D A T A M O N I T O R
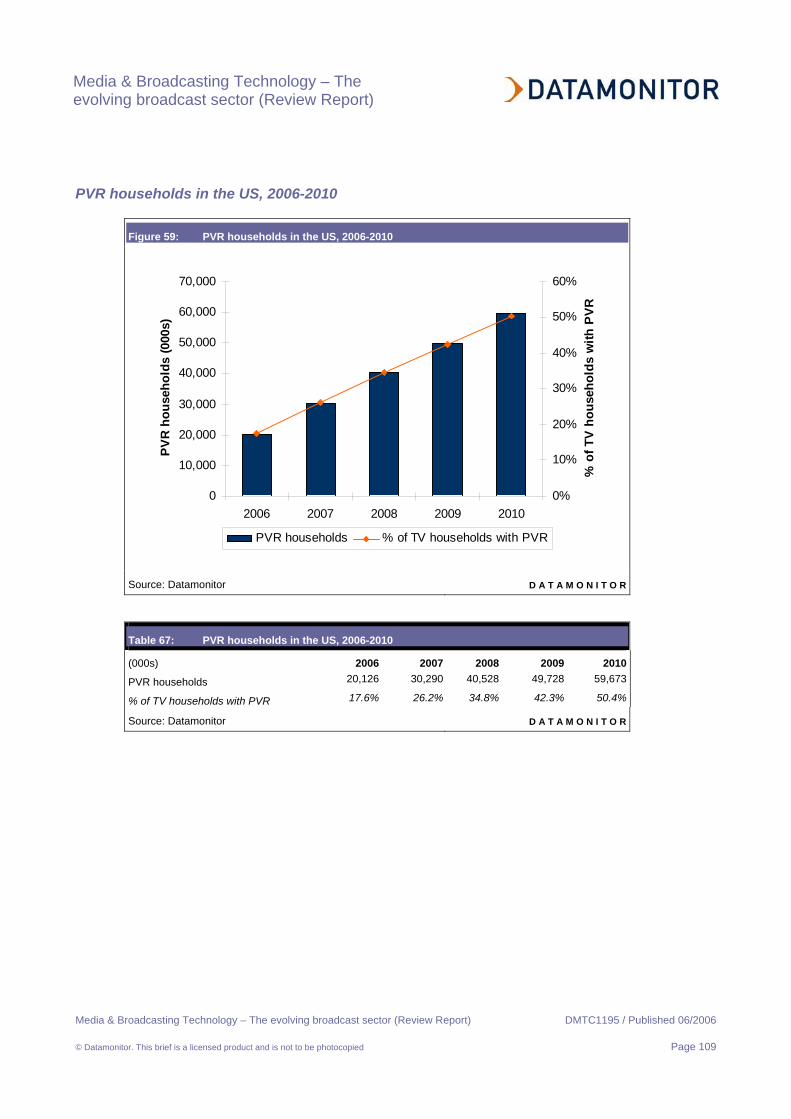
Media & Broadcasting Technology – The evolving broadcast sector (Review Report)
Media & Broadcasting Technology – The evolving broadcast sector (Review Report) DMTC1195 / Published 06/2006
© Datamonitor. This brief is a licensed product and is not to be photocopied Page 109
PVR households in the US, 2006-2010
Figure 59: PVR households in the US, 2006-2010
0
10,000
20,000
30,000
40,000
50,000
60,000
70,000
2006 2007 2008 2009 2010
PVR
hou
seho
lds
(000
s)
0%
10%
20%
30%
40%
50%
60%
% o
f TV
hou
seho
lds
with
PVR
PVR households % of TV households with PVR
Source: Datamonitor D A T A M O N I T O R
Table 67: PVR households in the US, 2006-2010
(000s) 2006 2007 2008 2009 2010
PVR households 20,126 30,290 40,528 49,728 59,673
% of TV households with PVR 17.6% 26.2% 34.8% 42.3% 50.4%
Source: Datamonitor D A T A M O N I T O R
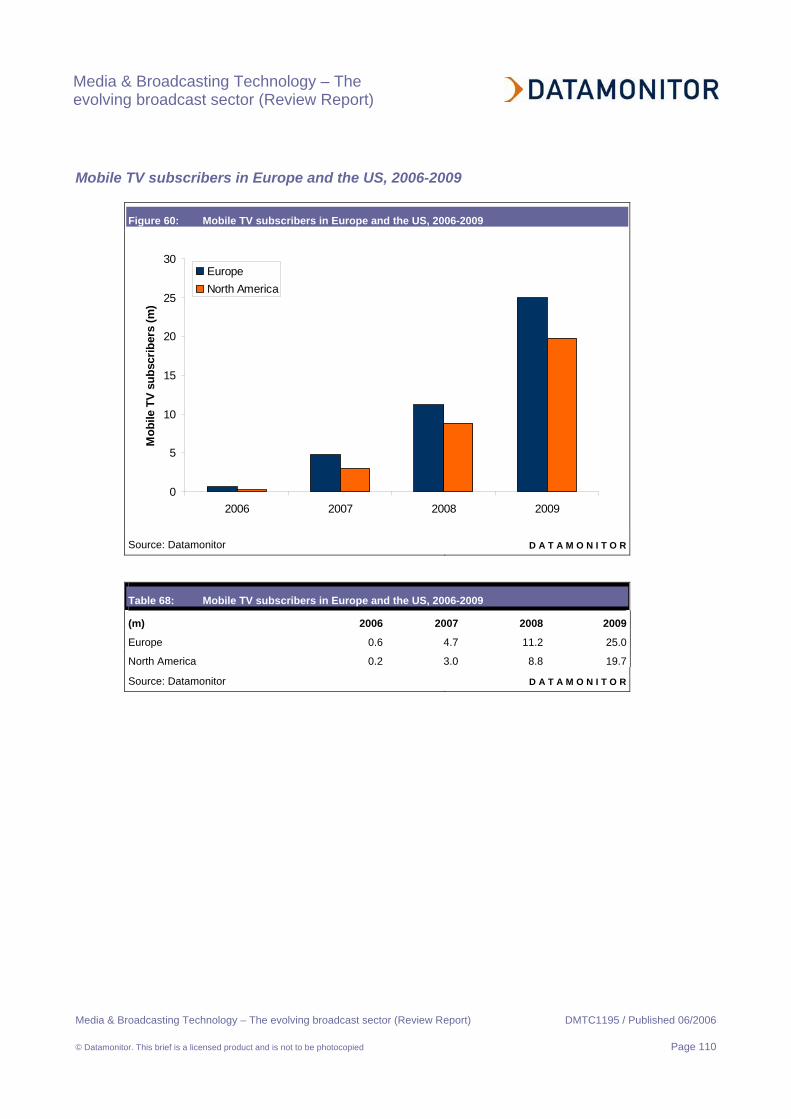
Media & Broadcasting Technology – The evolving broadcast sector (Review Report)
Media & Broadcasting Technology – The evolving broadcast sector (Review Report) DMTC1195 / Published 06/2006
© Datamonitor. This brief is a licensed product and is not to be photocopied Page 110
Mobile TV subscribers in Europe and the US, 2006-2009
Figure 60: Mobile TV subscribers in Europe and the US, 2006-2009
0
5
10
15
20
25
30
2006 2007 2008 2009
Mob
ile T
V su
bscr
iber
s (m
)
EuropeNorth America
Source: Datamonitor D A T A M O N I T O R
Table 68: Mobile TV subscribers in Europe and the US, 2006-2009
(m) 2006 2007 2008 2009
Europe 0.6 4.7 11.2 25.0
North America 0.2 3.0 8.8 19.7
Source: Datamonitor D A T A M O N I T O R
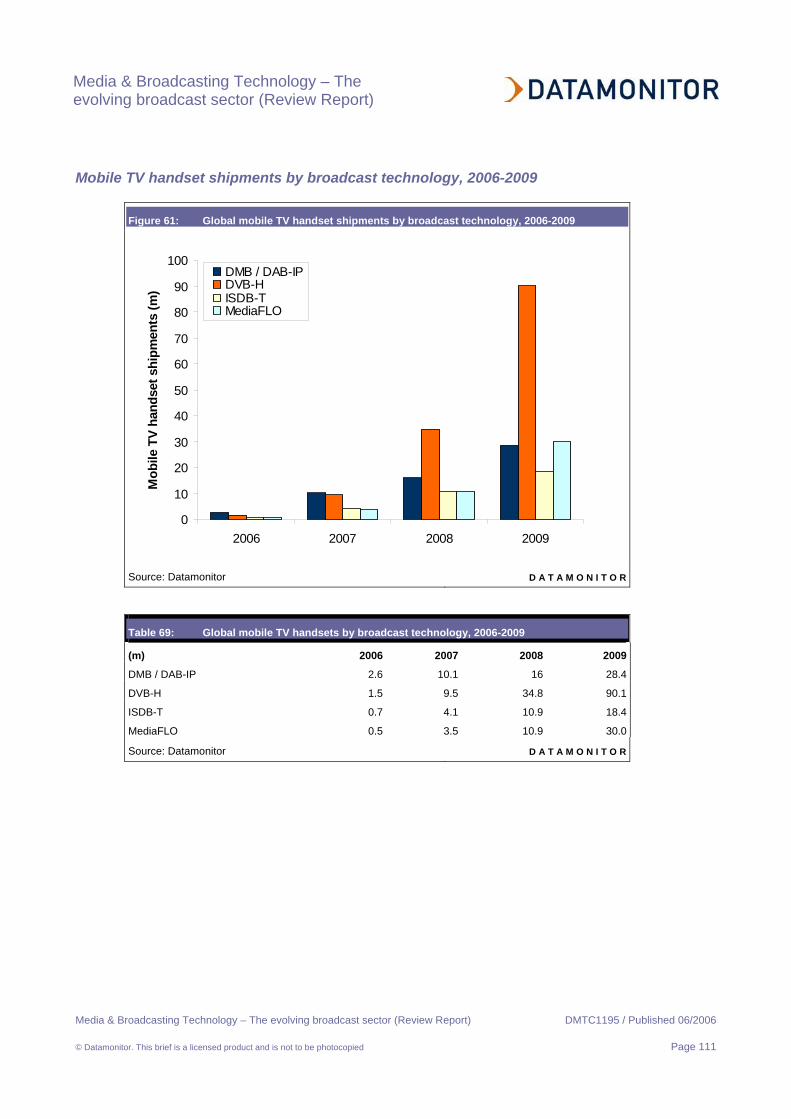
Media & Broadcasting Technology – The evolving broadcast sector (Review Report)
Media & Broadcasting Technology – The evolving broadcast sector (Review Report) DMTC1195 / Published 06/2006
© Datamonitor. This brief is a licensed product and is not to be photocopied Page 111
Mobile TV handset shipments by broadcast technology, 2006-2009
Figure 61: Global mobile TV handset shipments by broadcast technology, 2006-2009
0
10
20
30
40
50
60
70
80
90
100
2006 2007 2008 2009
Mob
ile T
V ha
ndse
t shi
pmen
ts (m
)
DMB / DAB-IPDVB-H ISDB-T MediaFLO
Source: Datamonitor D A T A M O N I T O R
Table 69: Global mobile TV handsets by broadcast technology, 2006-2009
(m) 2006 2007 2008 2009
DMB / DAB-IP 2.6 10.1 16 28.4
DVB-H 1.5 9.5 34.8 90.1
ISDB-T 0.7 4.1 10.9 18.4
MediaFLO 0.5 3.5 10.9 30.0
Source: Datamonitor D A T A M O N I T O R

Appendix
Media & Broadcasting Technology – The evolving broadcast sector (Review Report) DMTC1195 / Published 06/2006
© Datamonitor. This brief is a licensed product and is not to be photocopied Page 112
APPENDIX
Definitions
ADSL – Asymmetric Digital Subscriber Line
ARPU – Average Revenue Per User
CAGR – Compound Annual Growth Rate
CDMA – Code Division Multiple Access
CES – Consumer Electronics Show
CPE – Customer Premises Equipment
DAB – Digital Audio Broadcast
DMB - Digital Multimedia Broadcast
DSL – Digital Subscriber Line
DTT – Digital Terrestrial Television
DVB-H – Digital Video Broadcast – Handheld
DVB-T – Digital Video Broadcast – Terrestrial
DVR – Digital Video Recorder
FCC – Federal Communications Commission
FTA – Free-To-Air
GSM – Global System for Mobile Communication
HD – High Definition
IPTV – Internet Protocol Television
ISDB-T – Integrated Services Digital Broadcasting – Terrestrial
MPEG – Moving Pictures Experts Group
PVR – Personal Video Recorder
QAM – Quadrature Amplitude Modulation
STB – Set-Top Box
VDSL – Very High Bit-Rate Digital Subscriber Line
VOD – Video On Demand
WiMax – Worldwide Interoperability for Microwave Access
WM9 – Windows Media 9

Appendix
Media & Broadcasting Technology – The evolving broadcast sector (Review Report) DMTC1195 / Published 06/2006
© Datamonitor. This brief is a licensed product and is not to be photocopied Page 113
Further reading
The evolving broadcast sector (Review Report) (DMTC1195) – June 2006
Digital rights management (Review Report) (DMTC1191) – April 2006
Broadcast TV to mobile (DMTC1162) – December 2005
The broadcast value chain (DMTC1117) – March 2005
Digital rights management (DMTC1147) – June 2005
Ask the analyst
The Technology Knowledge Center Writing team
Adrian Drozd Senior Analyst, Media & Broadcasting Technology ([email protected])
Kathleen Klasnic Director, Vertical Market Technology ([email protected])