the evolving geography of the north american auto industry · the evolving geography of the north...
TRANSCRIPT

The evolving geography of the North American auto industry
Automotive Policy Research Centre McMaster University
Hamilton, Canada November 18, 2014
Thomas Klier Federal Reserve Bank of Chicago
Disclaimer
The analysis and conclusions set forth are those of the author and do not indicate concurrence by
other members of the research staff or the Federal Reserve Bank of Chicago

Outline
• Three layers of auto industry geography
– North America
– U.S., Canada, and Mexico
– Auto Alley
• The view from Canada (as seen from Chicago)
• Summary

Vehicle production in North America 2013
Thomas Klier, FRB Chicago

Parts and vehicle assembly co-locate
Thomas Klier, FRB Chicago

North America in the world
2000 2009 2013
31% 17% 20%
North America’s vehicle production share
The growth markets are outside
North America.

Most vehicles produced where sold
NAFTA
Asia
Europe
U.S. light vehicle sales by major production region
0%
10%
20%
30%
40%
50%
60%
70%
80%
90%
100%
19
80
19
81
19
82
19
83
19
84
19
85
19
86
19
87
19
88
19
89
19
90
19
91
19
92
19
93
19
94
19
95
19
96
19
97
19
98
19
99
20
00
20
01
20
02
20
03
20
04
20
05
20
06
20
07
20
08
20
09
20
10
20
11
20
12
20
13

Outline
• Three layers of auto industry geography
– North America
– U.S., Canada, and Mexico
– Auto Alley
• The view from Canada (as seen from Chicago)
• Summary

Within N. America, gains for Mexico
Country 1990 2007 2014*
Canada 16 17 13
Mexico 6 13 20
U.S. 78 70 67
N. America 100 100 100
Share of light vehicle production

Exports drive Mexico’s growth Mexico’s light vehicle exports
Pe
rce
nt
Annual exports have increased by 2.3 million units since 1985
0.0
0.5
1.0
1.5
2.0
2.5
3.0
0
10
20
30
40
50
60
70
80
90
19
85
19
86
19
87
19
88
19
89
19
90
19
91
19
92
19
93
19
94
19
95
19
96
19
97
19
98
19
99
20
00
20
01
20
02
20
03
20
04
20
05
20
06
20
07
20
08
20
09
20
10
20
11
20
12
20
13
Mill
ion
s
Other OEM's exports Detroit 3 exports export share of production

Those exports go north and south
Region
2012 export share
NAFTA 71%
Latin America 16%
Europe 9%
Africa 2%
Asia 2%
In 2013, 82% (2.38 million units) of Mexico’s LV production was exported.
Vehicle exports from Mexico by destination

Outline
• Three layers of auto industry geography
– North America
– U.S., Canada, and Mexico
– Auto Alley
• The view from Canada (as seen from Chicago)
• Summary

Emergence of auto alley in U.S.
• Two main factors:
– Detroit carmakers abandon the “branch plant”
assembly system.
– Overseas-headquartered carmakers enter the U.S. and Canada as producers.

From manufacturing belt…
1985
Thomas Klier, FRB Chicago

…to auto alley
2013
Last year, auto
alley captured
nearly 90% of
U.S. light vehicle
production.
Thomas Klier, FRB Chicago

Close-up of auto alley
Thomas Klier, FRB Chicago
Who’s where in auto alley?

A dozen new producers in 30 years
US Canada Mexico
VW ( U.S.: closed in ‘89, new in 2012) 1978 --- 1965/2016*
Honda 1982 1986 1995/2014
Nissan 1983 --- 1966
Toyota 1984 1987 2002
Mazda (U.S.: closed in 2012) 1987 --- 2014
Mitsubishi 1987 --- ---
Subaru 1989 --- ---
BMW 1994 --- 2019*
Mercedes 1997 --- 2017*
Hyundai (CDN: closed in ’93) 2005 1989 ---
Kia 2009 --- 2016*
CAMI (CDN: GM in ‘09) --- 1986 ---
Foreign headquartered carmakers, by first year of production
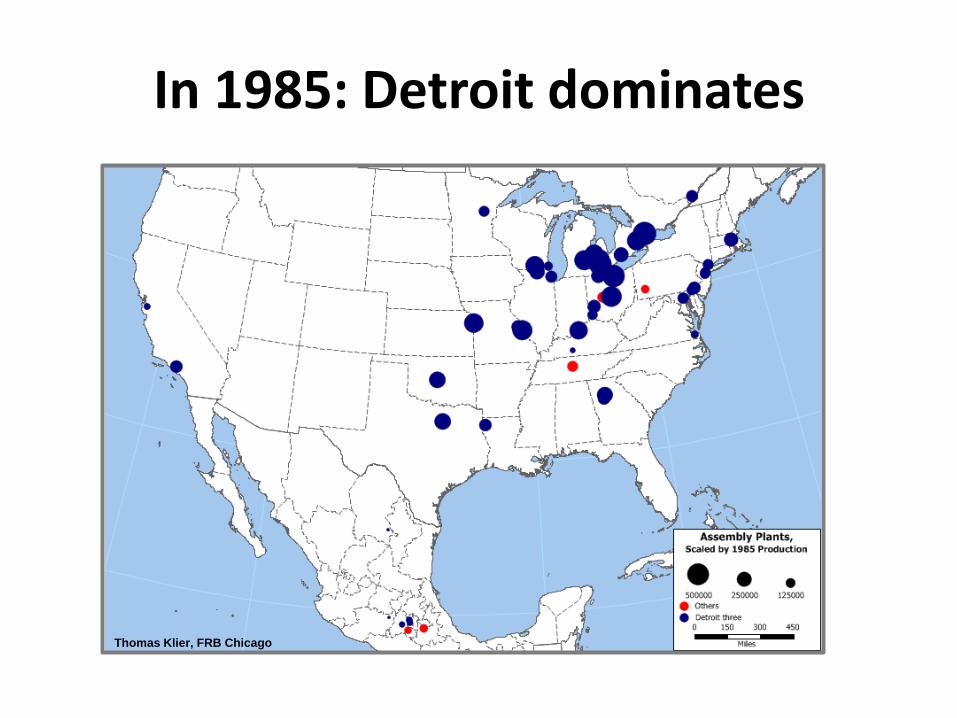
In 1985: Detroit dominates
Thomas Klier, FRB Chicago

Today: two distinct footprints
Thomas Klier, FRB Chicago

0
10
20
30
40
50
60
70
80
90
1001
98
5
19
86
19
87
19
88
19
89
19
90
19
91
19
92
19
93
19
94
19
95
19
96
19
97
19
98
19
99
20
00
20
01
20
02
20
03
20
04
20
05
20
06
20
07
20
08
20
09
20
10
20
11
20
12
20
13
Southern half
Growth concentrated in the South
Auto alley share
U.S. light vehicle production within auto alley
Northern half
Note: North = WI, IL, MI, IN, OH South = KY, TN, AL, MS, GA, SC
D3 share:
72%
19%
Percent

Detroit’s dominance waning
U.S. Canada Mexico
OEM by HQ 2000 2014 2000 2014 2000 2014
Detroit 78 54 82 59 59 51
Asia 21 39 18 41 18 35
Europe 1 27 -- -- 23 14
Production mix by OEM home region

Motor vehicle parts geography Before 1980 Since 1980
Thomas Klier, FRB Chicago Thomas Klier, FRB Chicago

Parts plants also cluster by nationality Since 1980
Thomas Klier, Federal Reserve Bank of Chicago
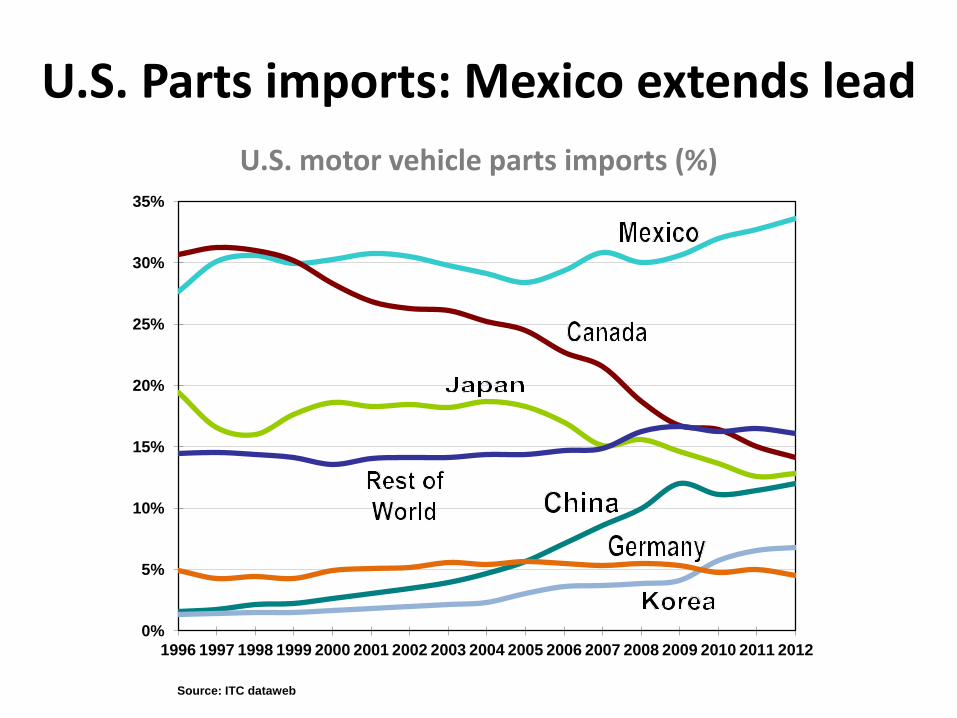
U.S. Parts imports: Mexico extends lead
0%
5%
10%
15%
20%
25%
30%
35%
1996 1997 1998 1999 2000 2001 2002 2003 2004 2005 2006 2007 2008 2009 2010 2011 2012
Source: ITC dataweb
U.S. motor vehicle parts imports (%)

Outline
• Three layers of auto industry geography
– North America
– U.S., Canada, and Mexico
– Auto Alley
• The view from Canada (as seen from Chicago)
• Summary

Linkages between Canada - US
In the mid-1960s, Hamilton was home
to the only Studebaker plant. It
produced for all of North America.
(Anastakis, Autonomous State, 2013)
1965 -- Auto Pact
1987 -- FTA
1995 -- NAFTA

Relative output change: US vs Canada
0
50
100
150
200
250
300
350
2000 2001 2002 2003 2004 2005 2006 2007 2008 2009 2010 2011 2012 2013
US -- Detroit 3
U.S. -- Asia Canada: Asia
Canada: Detroit 3
Light vehicle production index (2009 = 100)

Mexico dominant export hub
0.0
0.5
1.0
1.5
2.0
2.5
3.0
3.5
2000 2001 2002 2003 2004 2005 2006 2007 2008 2009 2010 2011 2012 2013 2014
U.S.
Ratio of light vehicle production and domestic sales
Mexico
Canada

Employment trends
0
20
40
60
80
100
120
2001 2002 2003 2004 2005 2006 2007 2008 2009 2010 2011 2012 2013
Ind
ex (
20
01
= 1
00
)
Year
Motor Vehicle Manufacturing (NAICS 3361)
U.S.
Canada

Employment trends (ctd)
0
20
40
60
80
100
120
2001 2002 2003 2004 2005 2006 2007 2008 2009 2010 2011 2012 2013
Ind
ex (
20
01
= 1
00
)
Year
Motor Vehicle Parts Manufacturing (NAICS 3363)
Canada
U.S.
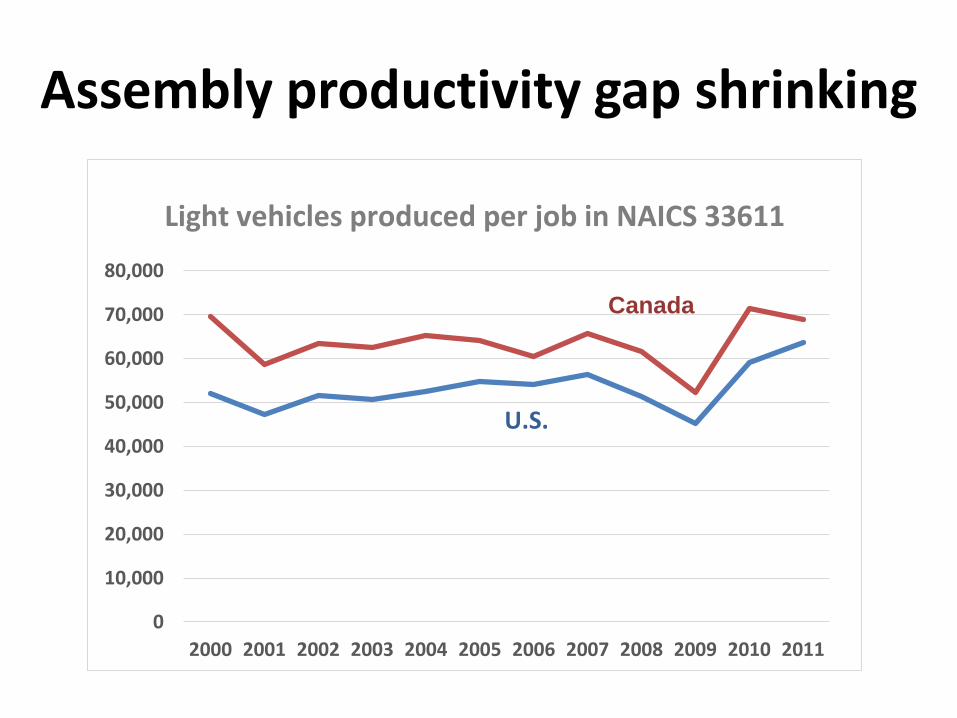
Assembly productivity gap shrinking
0
10,000
20,000
30,000
40,000
50,000
60,000
70,000
80,000
2000 2001 2002 2003 2004 2005 2006 2007 2008 2009 2010 2011
Light vehicles produced per job in NAICS 33611
U.S.
Canada

Summary
• North America remains a viable location of light vehicle production.
• Within North America, Mexico has been gaining vehicle production share. Currently, re-shoring from Asia to North America leads to Mexico, especially for small cars.
• Canada’s auto region, while strongly linked to auto alley, is facing a number of challenges.

Extras

Mexico’s assembly plants