the ex ante evaluation of the partnership agreement for the 2014-2020 period / milagros paniagua,...
TRANSCRIPT

Milagros Paniagua Oct 9th, 2014
The ex ante evaluation of the Partnership Agreement for the 2014-2020 period

LA INTERVENCIÓN PÚBLICA
2
SOCIEDAD GESTOR PÚBLICO
Problemas
Soluciones

LA EVALUACIÓN EX ANTE DEL ACUERDO DE ASOCIACIÓN
3
Mucho que comentar sobre evaluación…
SIN EMBARGO: El objetivo de la presentación es

Index1. Chapter I: Introduction2. Chapter II: The Strategy in the Partnership
Agreement3. Chapter III: Indicators, monitoring and
evaluation4. Chapter IV: Financial aspects5. Chapter V: Governance and structure of the
programming6. Chapter VI: Conclusions and
recommendations of the evaluation team

1.- Introduction1. The Partnership Agreement
2. Lessons learned
3. Regulatory Framework
4. Ex ante evaluation methodology
5. The schedule performance of the evaluation team

1.1- The Partnership AgreementStrategic document to be developed by Spain with the
participation of key actors (multilevel governance)
Should include the Spanish strategy and priorities and measures for the use of EIE Funds efficiently in line with the Union strategy for smart, sustainable and inclusive growth
Subject to approval by the Commission after an
assessment process and dialogue with the Member State

According to Article 15 of CPR the content of the Partnership Agreement should have the following elements:
Measures to ensure alignment with the Union strategy for smart, sustainable and inclusive growth and specific missions of the Funds in accordance with their objectives based on the Treaties, including economic, social and territorial cohesion
Measures to ensure effective implementation of the EIE Funds
Measures for the partnership principle referred to in Article 5 of CPR
1.1- The Partnership Agreement
An indicative list of the partners referred to in Article 5 CPR and a summary of the steps taken to involve the partners in accordance with Article 5 and its role in preparing the partnership and the progress report under Article 52 of the CPR
An integrated approach to territorial development supported by the EIE Funds or a summary of the integrated approaches to territorial development based on program content
1.1- The Partnership Agreement

1.2- Lessons learned
Since joining in 1986 until 2013, Spain
received € 150,000 million
Since 1988, Spain has been the main
recipient of Funds in absolute terms
During the period 2007-2013 Spain has been the
second recipient after Poland (35,217 M €
compared to a total budget of 347,410 M €
2014-2020 period?
Source: D.G. REGIO

The average annual GDP growth in Spain
was 0.5% higher between 1995 and
2006
Between 2000 and 2006, 850 km of
railway lines were created
Between 1995 and 2004, more than 1,200 km of roads and motorways
were co-financed
Between 2000 and 2006 more than 377,000
people received assistance related to self-employment and
social economy
Between 2000 and 2006 more than 21,000 R & D and innovation projects were suppported, among
others, with about 10,000 researchers integrated
Many outputs and little outcomes
1.2- Lessons learned

Delay in approval of 2007-2013 OPs
Existence of budget constraints
Outdated action strategies of different OP
1.2- Lessons learned

1.3- Regulatory Framework It consists of a wide range of texts from different
normative sources:
Common Strategic Framework
Regulations
Communications
Guides from the COM
Codes of Conduct
Own Member State documents

1.4- Methodology
Different methodological approaches
Mainly qualitative approach although there have been numerical approximations
Some known and others more innovative
Main goal: to ensure the intervention logic in all its aspects

1.5- Schedule
March 2013 – October 2013
October 2013 – December 2013
December 2013 – March 2014
STAGE 1 STAGE 2 STAGE 3

1.5- Schedule
Public policy programming
Evaluation and recommendations to the policy maker
Evaluator contributions
Recommendations taken into account within programming tasks

2.- Strategy1. The intervention logic2. Analysis of relevance3. The external consistency4. The internal consistency5. The territorial approach in the Agreement6. Evaluation of EAC7. Horizontal principles compliance 8. Complementarities and synergies between the
Structural Funds between themselves and with EAFRD and EMFF

1. Strengthening research, technological development and innovation
2. Enhancing access to, and use and quality of, ICT3. Enhancing the competitiveness of SMEs, of the agricultural
sector (for the EAFRD) and of the fishery and aquaculture sector (for the EMFF)
4. Supporting the shift towards a low-carbon economy in all sectors5. Promoting climate change adaptation, risk prevention and
management6. Preserving and protecting the environment and promoting
resource efficiency7. Promoting sustainable transport and removing bottlenecks in key
network infrastructures8. Promoting sustainable and quality employment and supporting
labour mobility9. Promoting social inclusion, combating poverty and any
discrimination10.Investing in education, training and vocational training for skills
and lifelong learning 10 TOs + Investment Priorities
2.- Strategy

2.1- The intervention logic
INPUT ACTIVITIES OUPUTOUTCOME
(short-term)OUTCOME (long-term)
Relevance External coherence Internal consistency Territorial approach Ex ante conditionalities Horizontal principles Complementarities and synergies

2.2- Relevance (parcial)
Identify weaknesses (strengths) most pressing within the sector/region
Prioritize the weaknesses (cooperation programmer - evaluator)
Calculate the potential impact of the strategy
Using a statistical measure that relates the ability to "pull" strategy (potential impact) on the importance of the weaknesses (strengths) = degree of partial relevance

2.2- Relevance (parcial)
W1
W3
W2
W4 W5
W6
W7
W8
…
W1 W5
W8W7
W2 W3
W6
W4
HIGH = 9
MEDIUM = 6
LOW = 3
Prioritizing the weaknesses (same for strenghts)

2.2- Relevance (parcial)Identify weaknesses (strengths) most pressing and calculate the potential impact of the strategy
W1 W2 W3
M1 3 10 8
M2 10 5 5
M3 9 6 9
M4 8 8 8
Potential impact
30 29 30

2.2- Relevance (parcial)Using a statistical measure that relates the ability to"pull" strategy (potential impact) on the importance ofthe weaknesses (strengths) = degree of partial relevance
RHO - SPEARMAN

2.2- Relevance (parcial)Identification of weaknesses for TO 1
W1: The low intensity of effort in R & D in relation to GDP and strong regional disparities. W2: Business expenditure on R & D and occupancy rates in R & D in companies lower then the European average. W3: The rigidity of governance models of R & D & i - Universities and PRIs. W4: Tendency to fragmentation of research groups. W5: The lack of flexible funding instruments for technology companies, providing funding for the business life cycle as a whole project. W6: The small number of companies involved in R & D & i and the size of them. W7: Deficit technology transfer by the public sector on R & D compared to its level of scientific production; and low absorption capacity by SMEs.W8: Shortage of skilled human resources for the R & D & I management in the public sector - Universities and PRIs- and in the private sector.

2.2- Relevance (parcial)Identification of weaknesses for TO 1 (cont)
W9: The barriers to mobility of R & D & i between public sector and business. W10: Lack of consideration of research activity by Spanish businessmen as a key issue for competitiveness. W11: Low levels of internationalization on R + D + i and especially by SMEs. W12: Lack of cooperation between SMEs to promote projects and actions in favor of innovation. W13: Greater difficulties in the more rural areas to the development of entrepreneurial initiatives and communication with technology transfer centers. W14: Deficit of qualified and skilled personnel in rural areas slowing down the development of innovation there. W15: Need to improve technology transfer between research organizations and producers.

TO 1: LARGE
2.2- Relevance (parcial)

26
2.2- Relevance (parcial)Identification of weaknesses for TO 2
W1: Regional disparities in broadband coverage. Insufficient development of ultra-fast broadband networks in regions with lower population density.W2: Barriers to deployment of access to superfast networks.W3: Lower levels of infrastructure and equipment in the Spanish microenterprises than the European average.W4: Lack of ICT training among employees/employers that enables entrepreneurs achieve greater performance (more severe in SMEs).W5: Reduced demand and procurement of goods and services digitally in Spain.W6: Lack of a unified market in the content of digital sector.W7: Lack of financial capacity to invest due to the small number of major companies in digital content.W8: Spain inferior position compared to other European countries in the ICT development , which doesn’t contribute to the “digital gap“ reduction.W9: Existence of accessibility barriers for adoption ICT.W10: Lack of confidence in ICT which hinders the development and penetration of new services.W11: Digital gap differs between areas - more population density and less populated (degree of urbanization).
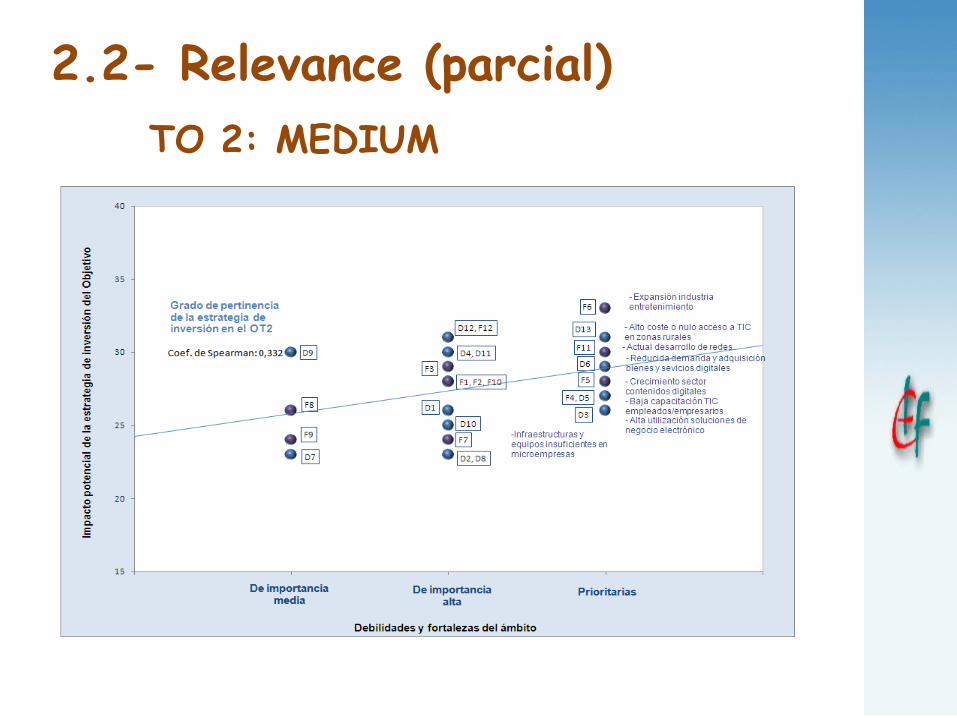
TO 2: MEDIUM
2.2- Relevance (parcial)

2.2- Relevance (parcial)Identification of weaknesses for TO 3
W1: Excessive weight micro-firms (95% of the total and 47% of total employment) and weak employment growth into large companies.W2: Lack of entrepreneurship, although a change has been observed as a result of the crisis.W3: Specialization in activities of medium to low added value. Insufficient level of productivity.W4: Insufficient activity in R & D and technological innovation and no technological SME.W5: Difficulties to take advantage of the existing ways of technology transfer, scientific and technological infrastructure, and financial instruments of innovation.W7: Low export tendency and little direct presence in international markets (but growing after the crisis).W8: Limited diversification of aquaculture products, high production costs and low commercial margins.W9: Dependence on foreign (external) supply .W10: Oversized fleet .

2.2- Relevance (parcial)Identification of weaknesses for TO 3
W11: Reduced access to domestic stocks.W12: Volatility of prices received by farmers or ranchersW13: Family labor or temporary work in agriculture.W14: Need investment for young people who want start farming in crisis and to farms who want to improve their results.W15: Atomization of the feeding industry. Lower presence of these industries in predominantly rural areas than in the intermediate or urban.W16: Existence of holdings with an economic dimension below € 2,000.W17: Low integration of agricultural producers in the production chains and food distribution.W18: Weight of investments in agriculture declining compared to GAV, perhaps as a result of the crisis.W19: Seasonality in tourism, wear of traditional models and dependence on foreign wholesalers.W20: Difficulty of SMEs to channel and process activities related to the tourism, adapt and manage that change. Absence of channels using innovation and entrepreneurship.
2.2- Relevance (parcial)Identification of weaknesses for TO 3
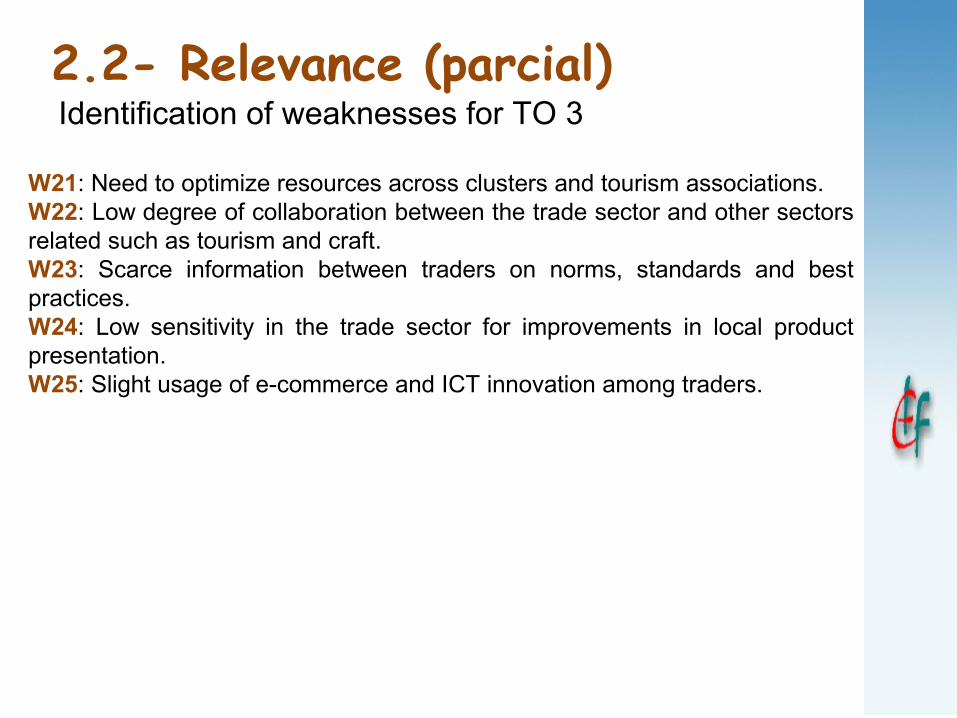
W21: Need to optimize resources across clusters and tourism associations.W22: Low degree of collaboration between the trade sector and other sectors related such as tourism and craft.W23: Scarce information between traders on norms, standards and best practices.W24: Low sensitivity in the trade sector for improvements in local product presentation.W25: Slight usage of e-commerce and ICT innovation among traders.

TO 3: MEDIUM
2.2- Relevance (parcial)

2.2- Relevance (parcial)Identification of weaknesses for TO 4
RELATED TO IMPROVING ENERGY EFFICIENCY TECHNOLOGIES AND EXCHANGE PROCESSES IN DIFFERENT FINAL CONSUMERS ENERGY SECTOR:
W1: Lack of training and information on the business of energy servicesW2: Reduced capacity of the public sector to encourage adoption of efficient technologies by the private sector. W3: Regarding people, mobility based on the private vehicle, and in relation to goods, on road transports, with little involvement of the electric vehicle and biofuels. W4: Lack of trained citizens in terms of energy consumption that could help to demand adequately . W6: Contribution of agriculture to almost 11% of gross GHG emissions, with a high contribution of soil or manure management.
2.2- Relevance (parcial)Identification of weaknesses for TO 4
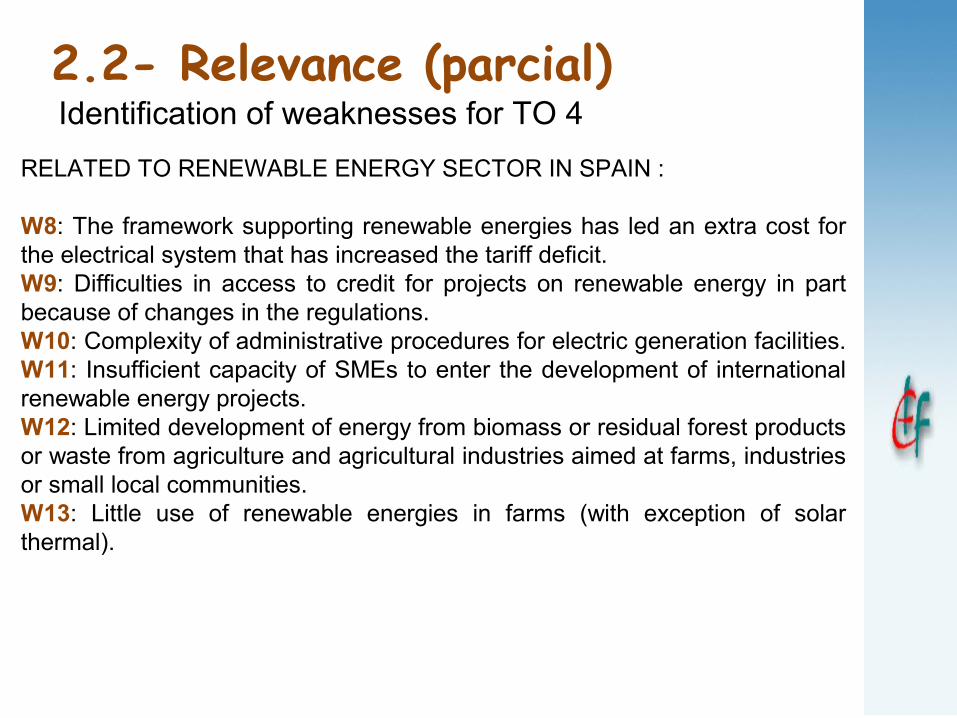
RELATED TO RENEWABLE ENERGY SECTOR IN SPAIN :
W8: The framework supporting renewable energies has led an extra cost for the electrical system that has increased the tariff deficit. W9: Difficulties in access to credit for projects on renewable energy in part because of changes in the regulations. W10: Complexity of administrative procedures for electric generation facilities. W11: Insufficient capacity of SMEs to enter the development of international renewable energy projects. W12: Limited development of energy from biomass or residual forest products or waste from agriculture and agricultural industries aimed at farms, industries or small local communities. W13: Little use of renewable energies in farms (with exception of solar thermal).

TO 4: MEDIUM
2.2- Relevance (parcial)

2.2- Relevance (parcial)Identification of weaknesses for TO 5
W1: Low rainfall in Spain , which limits the available water resources.W2: High rate of urbanization in certain vulnerable areas. In particular, high level of building on the coast which increases their risks by rising sea level.W3: Budget shortfall in the current situation to undertake the necessary measures.W4: Foreseeable problems for aquatic ecosystems either continental or other (those limited by water, high mountain, certain formations in arid, ... ) .W5: Forecast changes in animal migration, reproduction imbalance between predators and their prey, ..) and floristic loss.W6: Ignorance of the state of the number of habitats and species in the Natura 2000 network and the small number in a favorable position.W7: Few Natura 2000 management plans approved.W8: Negative effects on agricultural crops in some areas (associated with strength in others).W9: Increased water demand of crops in South and West .W10: Foreseeable effect of climate change on pests, diseases in plants and animals.

2.2- Relevance (parcial)Identification of weaknesses for TO 5
W11: Palpable effects of climate change in the areas of mountain.W12: Desertification, especially as result of forest fires and loss fertility in soils irrigated by salinization and erosion.W13: Low content of organic agricultural land, especially in the Spanish Southwest.W14: Natural and induced salinity in agricultural soils.W15: High ammonia emissions.

TO 5: MEDIUM
2.2- Relevance (parcial)

38
2.2- Relevance (parcial)Identification of weaknesses for TO 6
Treatment and PurificationW1: Great climate variability in Spain: areas suffer floods and desert areas.W2: High concentrations of organic matter, ammonium and nitrate in water bodies.W3: Diffuse pollution from fertilizers and pesticides.W4: High pressures on water bodies surface and groundwater that may cause breach of the Water Framework Directive.W5: Failure of water quality to ensure fish life, from pre-potable water and water for bath.W6: Overexploitation and pollution of aquifers. Saline intrusion .W7: Biota sensitive to water pollution .W8: Agglomerations not connected to drainage and treatment systems.W9: Overload and outdated purifying plants in tourism areas W10: Unavailability of water in agriculture.W11: Insufficient use of treated muds for agriculture.W12: Industries located in areas of high demand water .W13: Increase of the effect of the floating population (due to tourism) in consumption and wasteW14: Urban drainage and sanitation unit involving large spills and investments in debugging.
39
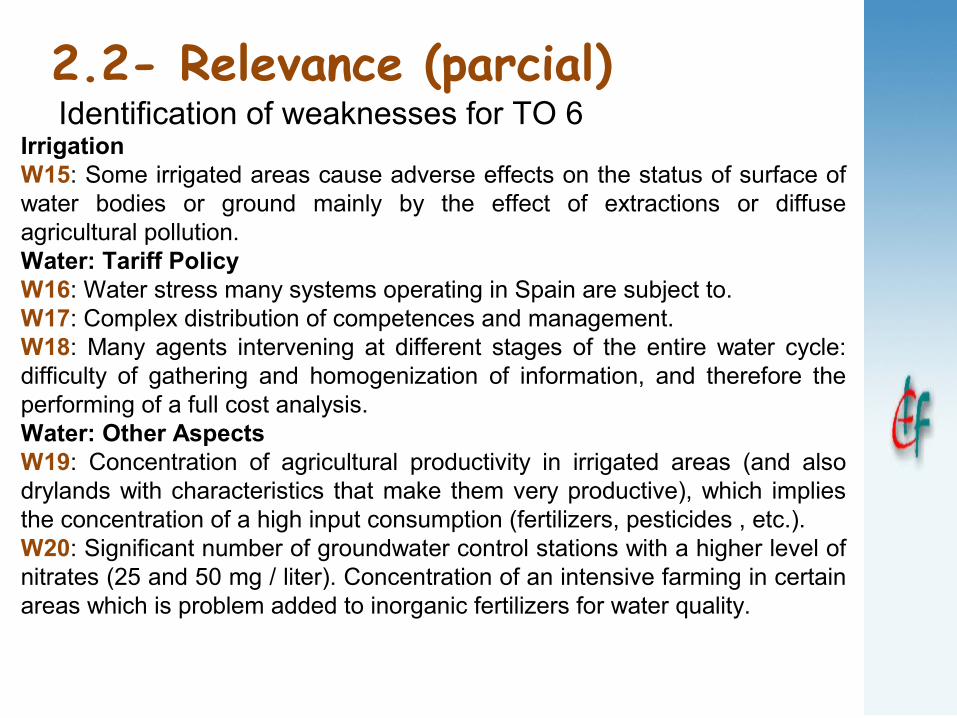
2.2- Relevance (parcial)Identification of weaknesses for TO 6
IrrigationW15: Some irrigated areas cause adverse effects on the status of surface of water bodies or ground mainly by the effect of extractions or diffuse agricultural pollution.Water: Tariff PolicyW16: Water stress many systems operating in Spain are subject to.W17: Complex distribution of competences and management.W18: Many agents intervening at different stages of the entire water cycle: difficulty of gathering and homogenization of information, and therefore the performing of a full cost analysis.Water: Other AspectsW19: Concentration of agricultural productivity in irrigated areas (and also drylands with characteristics that make them very productive), which implies the concentration of a high input consumption (fertilizers, pesticides , etc.).W20: Significant number of groundwater control stations with a higher level of nitrates (25 and 50 mg / liter). Concentration of an intensive farming in certain areas which is problem added to inorganic fertilizers for water quality.

2.2- Relevance (parcial)Identification of weaknesses for TO 6
Waste
W21: Insufficient financial and human resources to develop waste management policies.W22: Costs associated with new implementation / adaptation of new collection systems.
Fisheries sectorW23: Imbalance between available resources and fishing capacity.W24: Lack of consistency of data and difficulty in access and dissemination.W25: Maritime spatial planning, insufficient. W26: Reduction of TAC 's and quotas in overexploited stocks.W27: Strong socio-economic dependence of the fishing activity in certain areas.

2.2- Relevance (parcial)Identification of weaknesses for TO 6
Forestry SectorW28: Need to reactivate the sector socio-economically, especially in areas with potential growth (wood, cork , resin, biomass).W29: The restocking forests require silvicultural treatments (pruning , thinning , etc. ) that allow ecosystems evolve and adapt to climate change.W30: Need to improve forest information: adaptation and mitigation of climate change, health forest - advancing knowledge of new pests and disease - , network alerting on forest fires, and consumption of biomass for energy purposes.
BiodiversityW31: Low management plans for Natura 2000 areas and other tools to protect biodiversity; decline proportion of forest area protected to maintain biodiversity. Pressures on pasture habitat Natura 2000 and lack of knowledge about conservation.W32: Decline of biodiversity (see the indicator of birds).W33: Need for continuous information on biodiversity and make sensible certain sectors.

2.2- Relevance (parcial)Identification of weaknesses for TO 6
Rural Development
W34: Loss of Biodiversity.W35: Foreseeable losses of aquatic ecosystems inland.W36: Formations forecast problems for some ecosystems (limited by water, high mountain, certain formations in arid, ... ) .W37: Forecast changes in animal migration, reproduction imbalance between predators and their dams, ..) and floristic loss.W38: Ignorance of the state of a number of habitats and species in the Natura 2000 network and the small number in a favorable position.W39: Negative effects on agricultural crops in some areas (associated with strength in others).

2.2- Relevance (parcial)Identification of weaknesses for TO 6
Rural Development
W34: Loss of Biodiversity.W35: Foreseeable losses of aquatic ecosystems inland .W36: Formations forecast problems for some ecosystems ( limited by water, high mountain, certain formations in arid, ... ) .W37: Forecast changes in animal migration , reproduction imbalance between predators and their dams, ..) and floristic loss.W38: Ignorance of the state of a number of habitats and species in the Natura 2000 network and the small number in a favorable position .W39: Negative effects on agricultural crops in some areas (associated with strength in others).

2.2- Relevance (parcial)Identification of weaknesses for TO 6
Rural Development
W40: Increased water demand of crops in South and Southwest .W41: Foreseeable effect of climate change on pests, diseases (and pests ) plants and animals.W42: Is already palpable effects of change Climate in mountain areas .W43: Desertification , especially as result of forest fires and loss fertility in soils irrigated by salinization and erosion.W44: Low content of soil organic matter farming , especially in the Spanish Southwest.W45: Existence of natural and induced salinity in Spanish agricultural soils.W46: Increased incidence of nitrate pollution in groundwater than the average of the EU.W47: High emissions of ammonia.

TO 6: MEDIUM
2.2- Relevance (parcial)

2.2- Relevance (parcial)Identification of weaknesses for TO 7
W1: Very unbalanced modal split in favor of the road. W2: Some High Speed Lines (train) not closed. W3: Difficult interconnection with France W4: Low participation of intermodal transport W5: Incomplete links. Low accessibility ports and other transport nodes and economic activity. W6: Insufficient coordination in planning and development of logistics infrastructure. W7: Strong fragmentation of the sector and lack of professional skills in the transport sector. W8: Reduced use of ICT in some sectors.

TO 7: LARGE
2.2- Relevance (parcial)
2.2- Relevance (parcial)Identification of weaknesses for TO 8
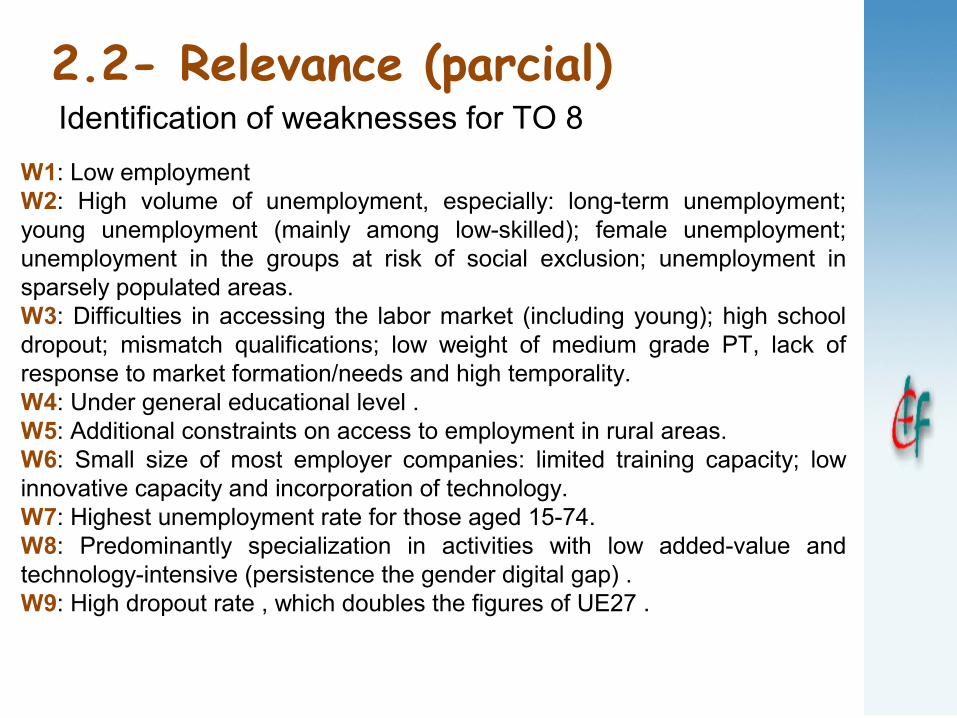
W1: Low employmentW2: High volume of unemployment, especially: long-term unemployment; young unemployment (mainly among low-skilled); female unemployment; unemployment in the groups at risk of social exclusion; unemployment in sparsely populated areas.W3: Difficulties in accessing the labor market (including young); high school dropout; mismatch qualifications; low weight of medium grade PT, lack of response to market formation/needs and high temporality.W4: Under general educational level .W5: Additional constraints on access to employment in rural areas.W6: Small size of most employer companies: limited training capacity; low innovative capacity and incorporation of technology.W7: Highest unemployment rate for those aged 15-74.W8: Predominantly specialization in activities with low added-value and technology-intensive (persistence the gender digital gap) .W9: High dropout rate , which doubles the figures of UE27 .

2.2- Relevance (parcial)Identification of weaknesses for TO 8
W10: Low employability of young people, especially women with less education .W11: Added temporality, with 82.3% of young people temporary work involuntarily.W12: Difficult access to the labor market of groups at risk of social exclusion (immigrant, women victims of violence, disabled, etc.).W13: Need to improve levels of self-employment and entrepreneurship among young people, with special attention young women.W14: Significant loss of employees between 15-20 years 2011/12.W15: Significant gender gaps in all areas: Lower full-time women in certain sectors such as tourism.W16: High seasonality in sectors such as tourism.W17: There has been an increase in unemployment of the population with university education.W18: There is little job for some high degrees.

TO 8: LARGE
2.2- Relevance (parcial)

2.2- Relevance (parcial)Identification of weaknesses for TO 9
W1: Growing needs for social protection for the fighting poverty, promoting inclusion and combating discrimination.W2: Mismatches between educational policies and labor market needs, especially more evident in the training of first and second level degrees.W3: High rates of school failure without alternatives for unskilled persons.W4: Needs to improve the effectiveness and efficiency of the active employment policies and risk that more vulnerable groups can be excluded.W5: Decrease in the levels of social coverage especially for non- taxpayers.W6: Segmentation and compartmentalization of social policy, including duplications, both horizontally (between departments) and vertically between administrative levels.W7: Deficits in the planning and implementation social policies : few PSCs , little modernization , etc .W8: Social protection system unbalanced in terms of intensity and coverage.W9: Larger weight plus the protective dimension of the investment dimension.W10: Needs social facilities.W11: Ignorance of the population of their rights.
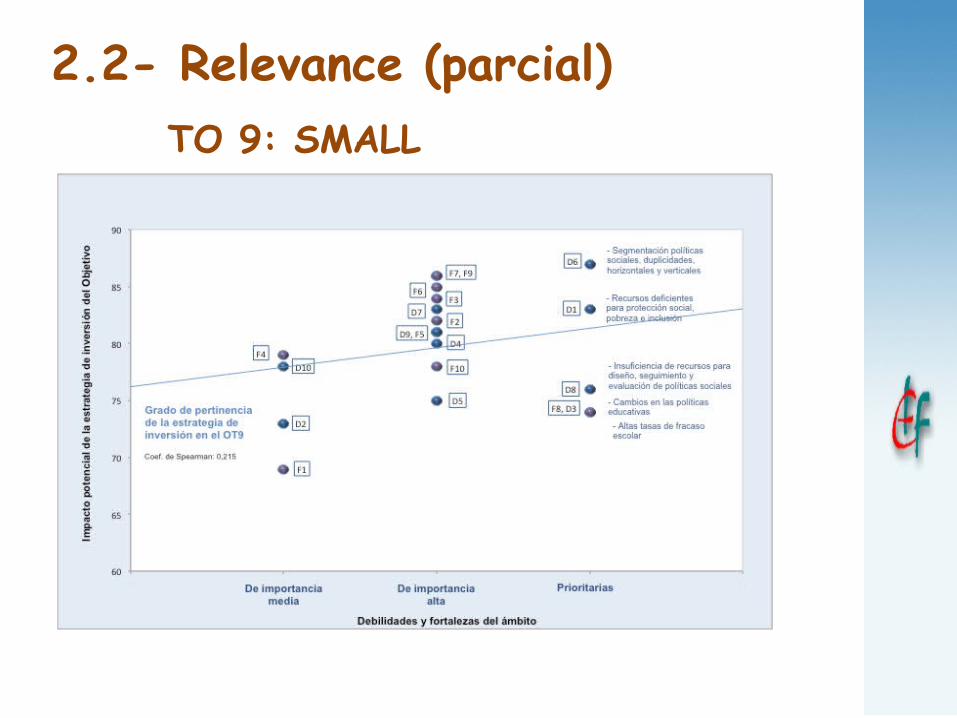
TO 9: SMALL
2.2- Relevance (parcial)
2.2- Relevance (parcial)Identification of weaknesses for TO 10
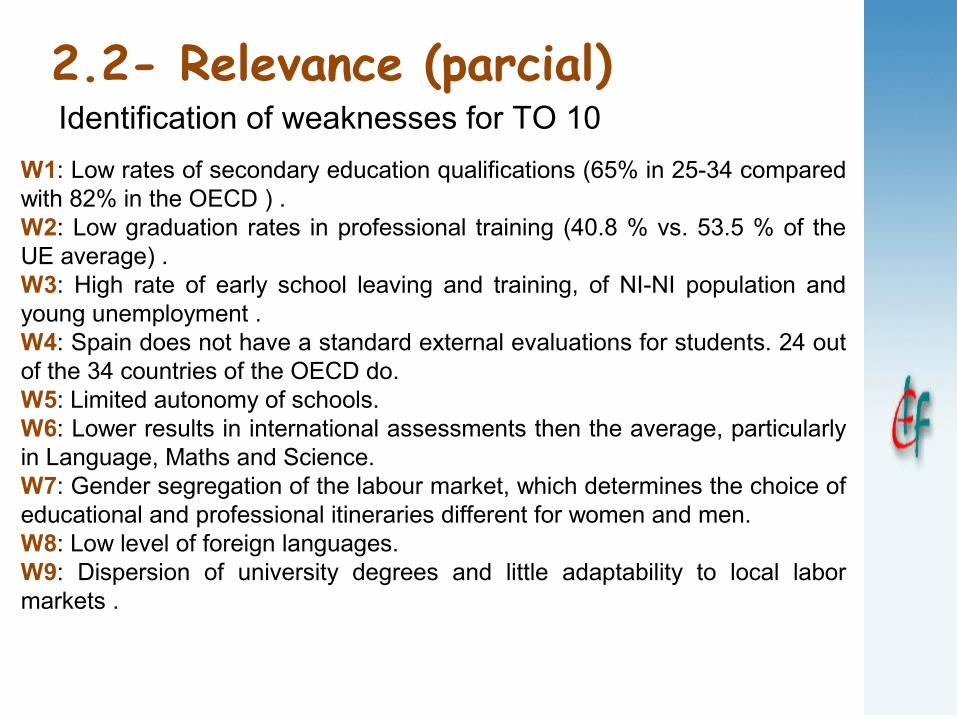
W1: Low rates of secondary education qualifications (65% in 25-34 compared with 82% in the OECD ) .W2: Low graduation rates in professional training (40.8 % vs. 53.5 % of the UE average) .W3: High rate of early school leaving and training, of NI-NI population and young unemployment .W4: Spain does not have a standard external evaluations for students. 24 out of the 34 countries of the OECD do.W5: Limited autonomy of schools.W6: Lower results in international assessments then the average, particularly in Language, Maths and Science.W7: Gender segregation of the labour market, which determines the choice of educational and professional itineraries different for women and men.W8: Low level of foreign languages.W9: Dispersion of university degrees and little adaptability to local labor markets .
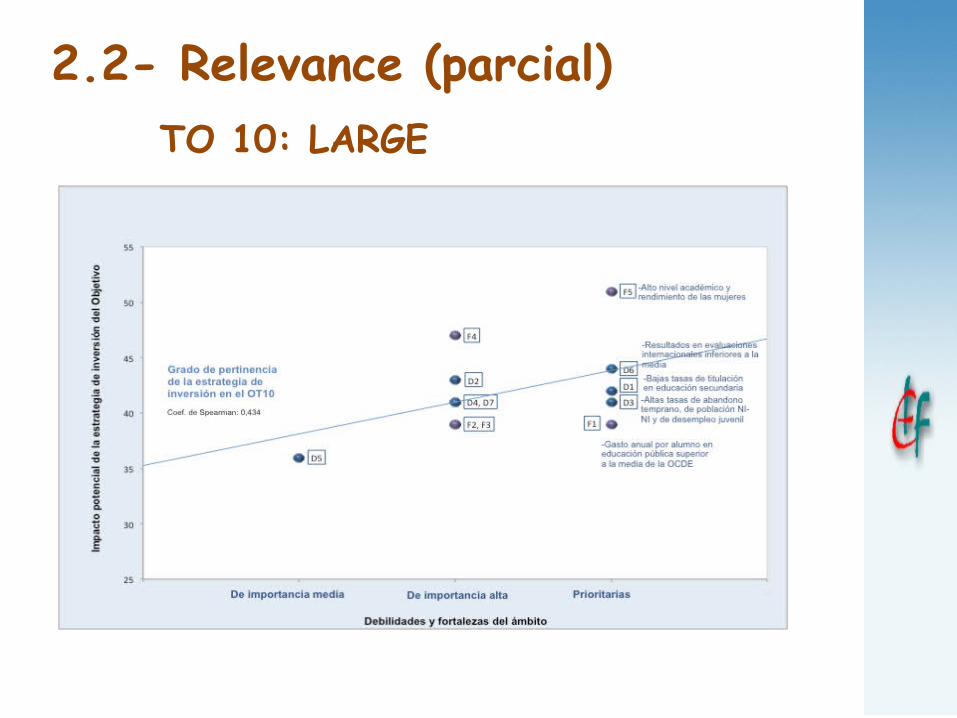
TO 10: LARGE
2.2- Relevance (parcial)

Identify weaknesses (strengths) most pressing sector / region
Develop matrices of cross between the axes (objectives / priorities) strategy, and weaknesses (strengths)
Calculating a degree of global relevance.
2.2- Relevance (global)
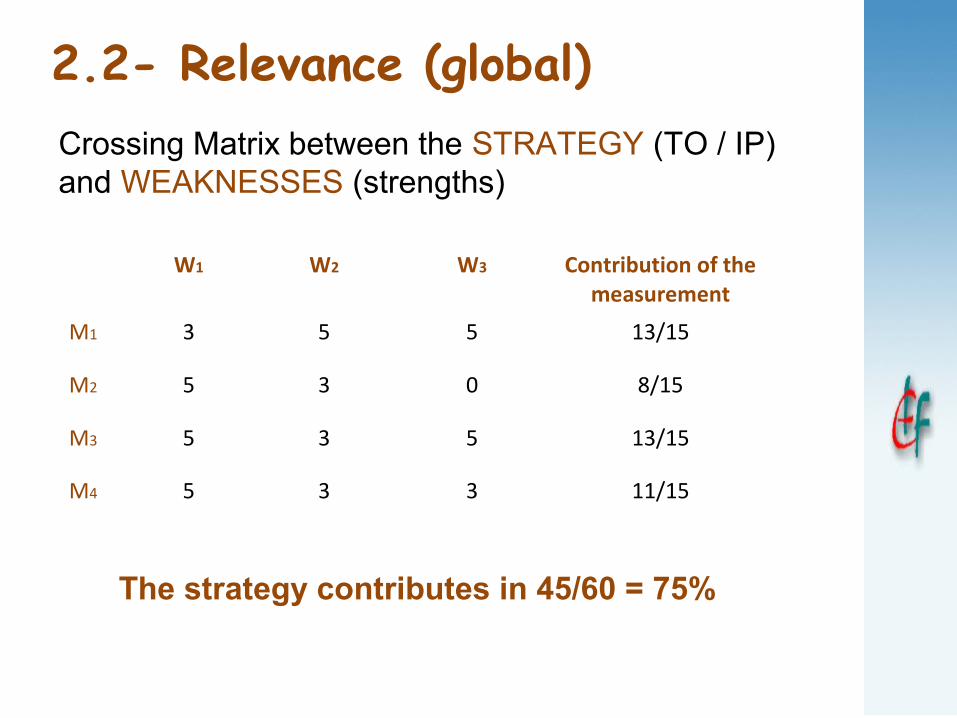
2.2- Relevance (global)Crossing Matrix between the STRATEGY (TO / IP) and WEAKNESSES (strengths)
W1 W2 W3 Contribution of the measurement
M1 3 5 5 13/15
M2 5 3 0 8/15
M3 5 3 5 13/15
M4 5 3 3 11/15
The strategy contributes in 45/60 = 75%

TO 1: MEDIUM
2.2- Relevance (global)

TO 2: SMALL
2.2- Relevance (global)

TO 3: SMALL
2.2- Relevance (global)

TO 4: LARGE
2.2- Relevance (global)

TO 5: MEDIUM
2.2- Relevance (global)

TO 6: SMALL
2.2- Relevance (global)
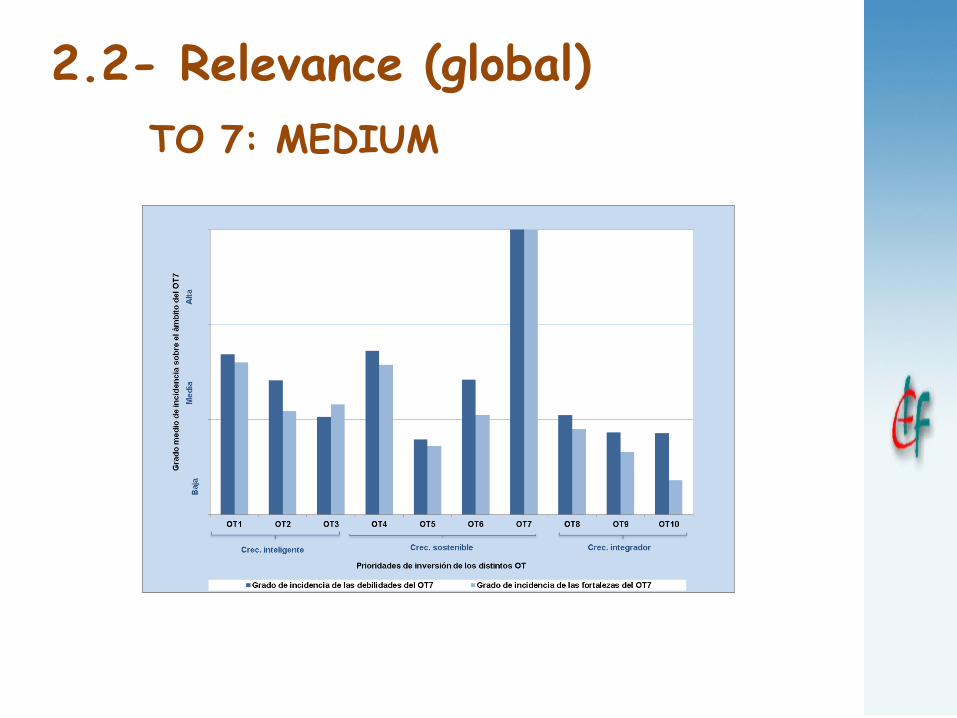
TO 7: MEDIUM
2.2- Relevance (global)

TO 8: SMALL
2.2- Relevance (global)

TO 9: SMALL
2.2- Relevance (global)

TO 10: MEDIUM
2.2- Relevance (global)

2.2- Relevance (parcial & global)

Identify regional, national and supranational policies that may be related to the Partnership Agreement
Set cross matrices: PA strategy with the challenges and objectives of foreign policy
If the strategy is very wide (many areas) - investigate how sectoral policies could be affecting
2.3- External coherence

1. Choice of policies to compare: 1. Guidelines and main objectives of the Europe
2020 strategy and specific recommendations for Spain 2012-2015
2. National Reform Plan 3. European ongoing programs: H2020, COSME,
LIFE, CEF & ERASMUS
2. We have chosen the following scoring system that determines the degree of coherence between objectives : 1. High degree of coherence = 5 puntos2. Medium degree of coherence = 3 puntos3. Low degree of coherence = 0 puntos
2.3- External coherence (strategies)

Crossing Matrix between the STRATEGY (TO / IP) and the main GOALS of the ongoing strategies
G1 G2 G3 Contribution of the measurement
M1 3 5 5 13/15
M2 5 3 0 8/15
M3 5 3 5 13/15
M4 5 3 3 11/15
The strategy is externally coherent in 45/60 = 75%
2.3- External coherence (strategies)
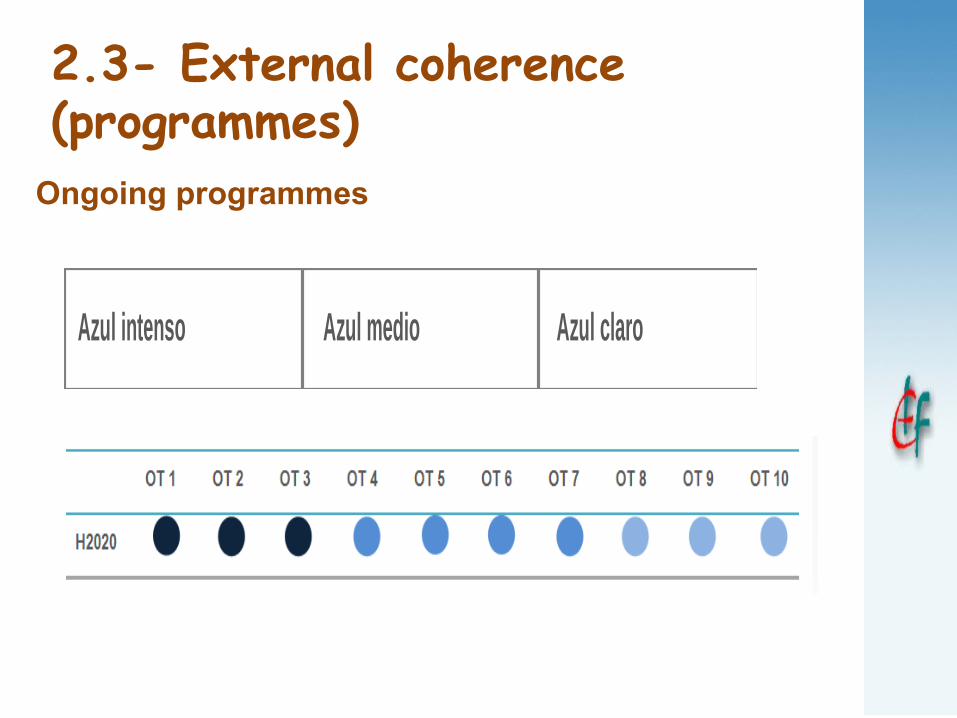
Ongoing programmes
Azul intenso Azul medio Azul claro
2.3- External coherence (programmes)

1. The objectives of the EU 2020 are widely covered by the TO in the PA
2. The challenges of the EU 2020 for Spain are also covered by the TO in the PA
3. NRP measurements that are not related to macro aspects have been considered and give the same results in terms of coverage of the TO
4. All the PA strategy (TO) is reinforced with Programmes such as H2020, etc.. Except for the 8 and 9, however, can be reinforced by additional actions as YEI
2.3- External coherence

Synergies and complementarities between the priorities (objectives/axes) of the Agreement
Sort the objectives of the strategy: o Main objectiveso Influential objectiveso Sensitive targetso Separate targets
For this set a matrix crossing objectives where the (i, j) element represents how the objective i influences j.
For rows we have how an objective affects/influence others and for columns how it is affected.
2.4- Internal consistency

2.4- Internal consistency
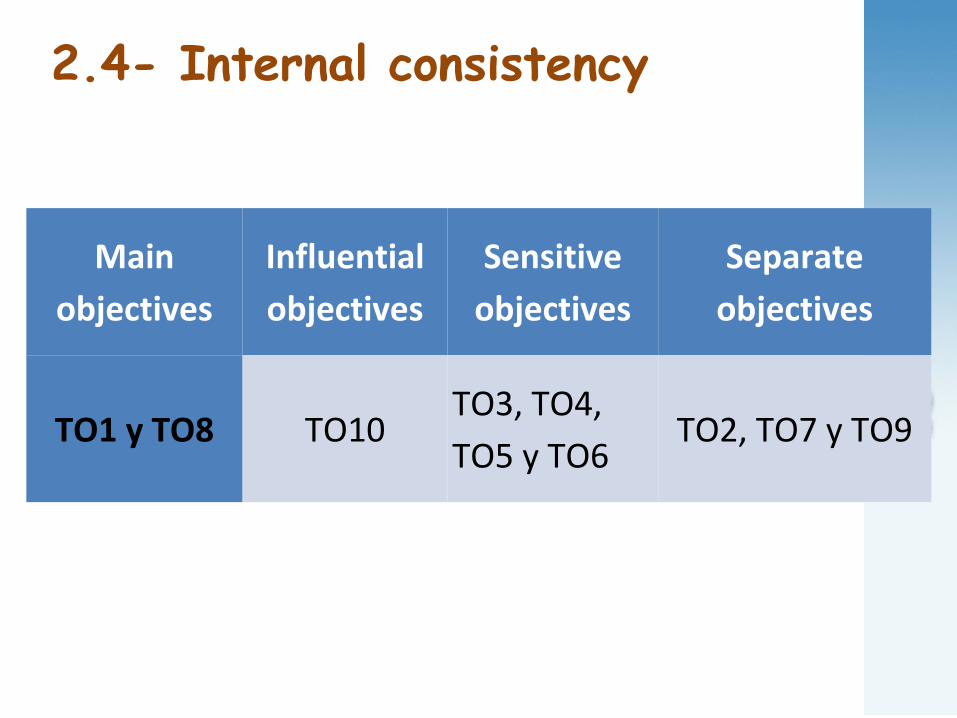
Main objectives
Influential objectives
Sensitive objectives
Separate objectives
TO1 y TO8 TO10TO3, TO4, TO5 y TO6
TO2, TO7 y TO9
2.4- Internal consistency

Analysis of the territory from an administrative point of view -> need for OP complement what the Agreement contemplates
Analysis of territory from a rural / urban view (economic) -> an axis for sustainable urban development, EAFRD (LEADER)
Analysis of the territory from the point of view of geographical particularities (Natural) -> is not assured, the OP should complement
2.5- The territorial approach

2.6- EAC Conditions to be fulfilled by the IP to program at
(principle of proportionality)
Element that has been better assessed during the development of the Agreement, although there are still some conditions to justify such as:
Ex ante conditionalities missing at the ERDF and ESF related to risk prevention and risk management, as well as the waste sector
In the general ex ante conditionalities for ERDF, ESF and EAFRD, those relative to statistical systems and performance indicators, which shall be realized once the programmes have started

Identify the horizontal principles of the strategy.
Evaluate their relevance at:
o Strategyo Governanceo Indicators, monitoring and evaluationo Financial allocations
2.7- Horizontal principles

79
2.7- Horizontal principles(sustainable development)
STRATEGY GOVERNANCE INDICATORSFINANCIAL
ALLOCATIONS
INTENSITY High High High High
APPRAISAL
The thematic objectives 4, 5, 6 and 7 show an almost perfect alignment with sustainable development.
The thematic objectives 1, 2 and 3 have a high integration and Objectives 8, 9 and 10 show numerous measures that make up the principle in its strategy
Many public and private agencies concerned with the environment have been consulted in the process of preparing the Agreement
Have been introduced related to various indicators of sustainable growth
Financial allocations are known by TO

STRATEGY GOVERNANCE INDICATORSFINANCIAL
ALLOCATIONS
INTENSITY Low Medium Medium Low
APPRAISAL
There are very few investment priorities and elements linked to the SWOT analysis from the perspective of equality between
men and women and almost all
concentrated in the TO 9, when it should be a cross-sectional
analysis.
The Agreement has consulted institutions
and organizations related to equality issues but the participation of women from a sectoral
point of view is not contained in the
Agreement.
While indicators related to persons on the
Association Agreement have been calculated by
sex, they were not presented in the
document, although developers have
disaggregated indicators calculated for the initial
diagnosis and can be easily tracked during the evaluation in the period
2014-2020
You can not make any approach to the gender
breakdown.
2.7- Horizontal principles(promotion of equality and non-discrimination)

The areas of coordination may be reflected in Table 13 of the Agreement, where synergies between funding instruments (Financial Framework) and the EIE Funds
The following structures are established to facilitate coordination between the EIE Funds and national and European policies: coordination committee EIE Funds, evaluation committee, committees monitoring programs, communication networks and thematic networks
2.8- Synergies between EIE Funds

3.- Indicators, monitoring & evaluation1. Introduction2. The indicators in the period 2014-20203. Evaluation of the indicators included within the
Partnership Agreement4. The monitoring and evaluation in the period
2014-2020

3.1- IntroductionThe indicators in the development of a publicly funded project
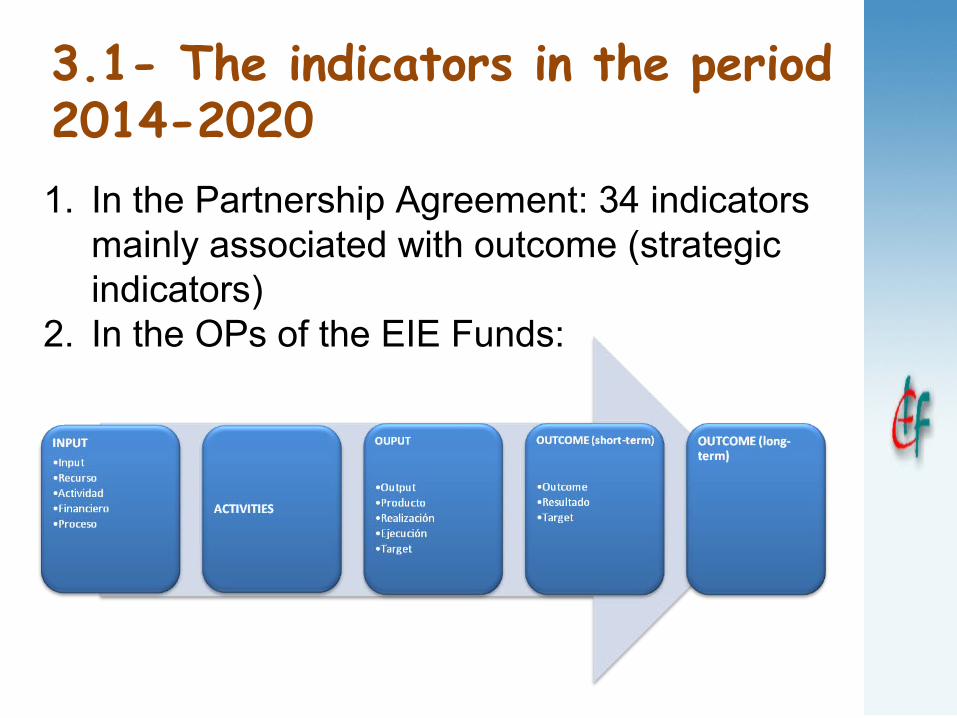
3.1- The indicators in the period 2014-20201. In the Partnership Agreement: 34 indicators
mainly associated with outcome (strategic indicators)
2. In the OPs of the EIE Funds:
85
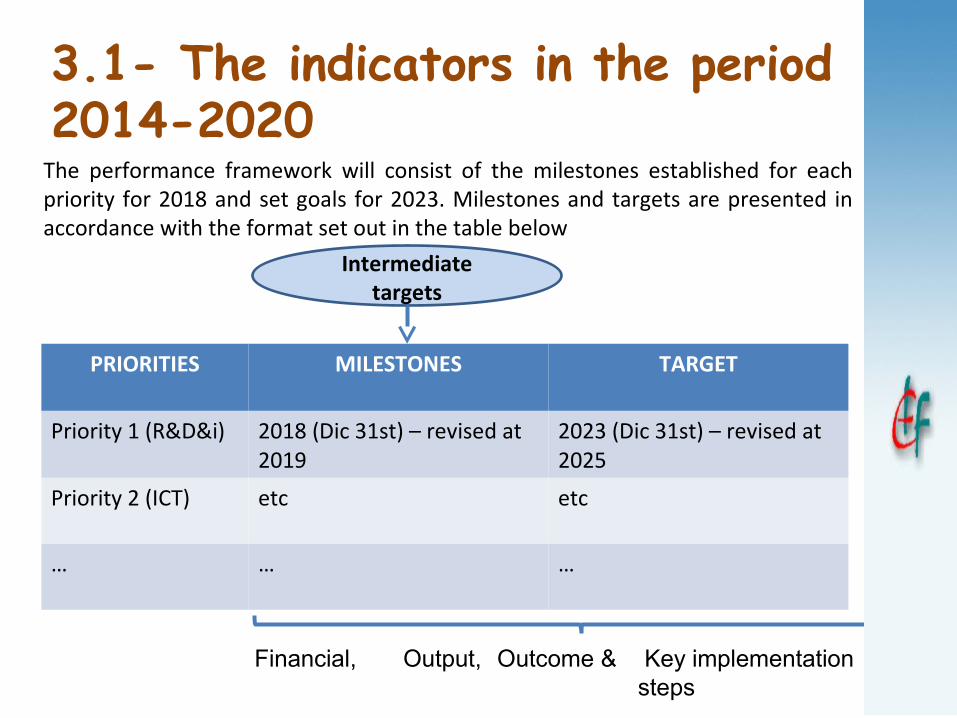
The performance framework will consist of the milestones established for each priority for 2018 and set goals for 2023. Milestones and targets are presented in accordance with the format set out in the table below
PRIORITIES MILESTONES TARGET
Priority 1 (R&D&i) 2018 (Dic 31st) – revised at 2019
2023 (Dic 31st) – revised at 2025
Priority 2 (ICT) etc etc
… … …
Intermediate targets
Financial, Output, Outcome & Key implementation steps
3.1- The indicators in the period 2014-2020
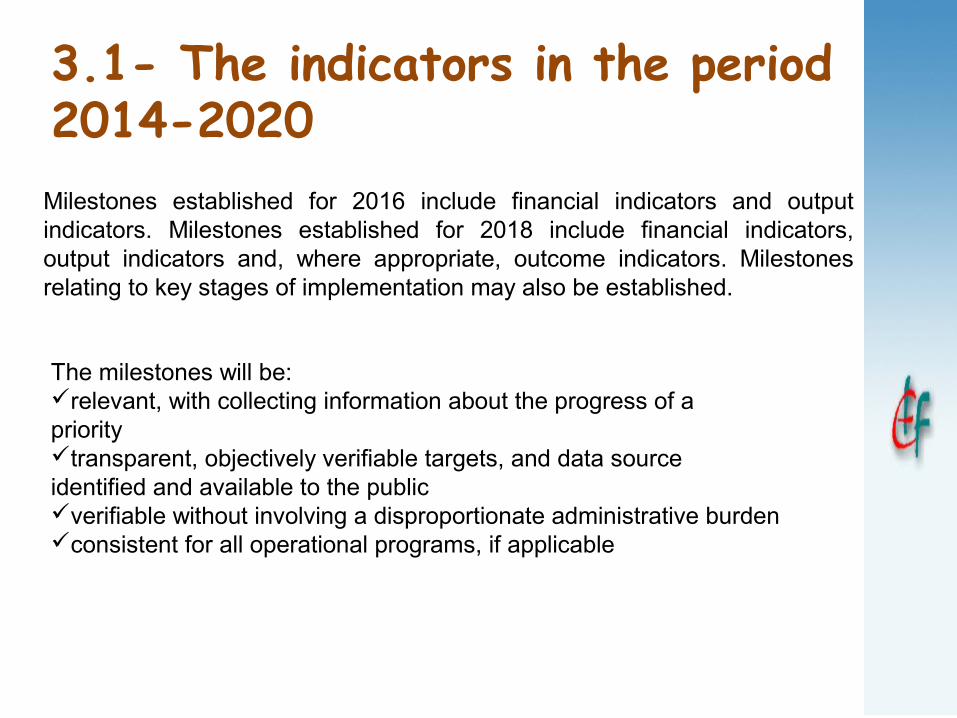
Milestones established for 2016 include financial indicators and output indicators. Milestones established for 2018 include financial indicators, output indicators and, where appropriate, outcome indicators. Milestones relating to key stages of implementation may also be established.
The milestones will be:relevant, with collecting information about the progress of a prioritytransparent, objectively verifiable targets, and data source identified and available to the publicverifiable without involving a disproportionate administrative burdenconsistent for all operational programs, if applicable
3.1- The indicators in the period 2014-2020

It’s a crucial issue to determine the appropriate number of indicators on the one hand, to reflect country strategy and allow for monitoring throughout the period, and on the other hand, avoid excessive or redundant hindering during the reviews of the Partnership Agreement (monitoring – yearly reports)
Specify initial and target values for all indicators, although in some of them, it has not been possible to determine the initial values so far
Verify compliance with a number of desirable properties to ensure the adequacy and consistency of the indicators. In principle Regulations require relevance, clarity and realism, but the evaluation team has decided to incorporate more properties:
3.2- The indicators in the PA

Indicator properties (theoretic)
Related to the policy the indicators try to explain:
1. Relevance2. Appropriate3. Homogeneity4. Focalization5. Coherence6. Reasonable
3.2- The indicators in the PA
Related to the calculations and statistical properties:
1. Normative2. Robust3. Clear4. Feasibility5. Level of disaggregation6. Frecuency7. Unit of measure
3.2- The indicators in the PAIndicator properties (theoretic)

Related to the source:
1. Cost2. Reliability3. Oportunity4. Independence
Related to the evolution of the indicator:
1. Goal2. Realistic/reachable3. Explains compliance4. Validation
Other properties: no redundancy and participation
3.2- The indicators in the PAIndicator properties (practical)

Traffic light methodology
100% of strategic indicators are relevant, regulatory, clear, achievable and have been defined based on a measurement unit easily interpretable
86% are robust and also reported the frequency of measuring them, 68% level disaggregation allows NUT2
Theoretic properties
3.2- The indicators in the PA

100% means that costs are in line with the aid provided by the EIE Funds also are reliable and have a goal (those assessed)
The values used by DG Funds are correct though in some cases were rated as too optimistic
All indicators do not meet the redundancy and the involvement of all relevant actors
Practical properties
3.2- The indicators in the PA

3.2- The indicators in the PA

3.3- The monitoring and evaluation in the 2014-2020
Two reports of strategic development (Art. 52 CPR) and an annual run from 2016 until 2023 (art. 50) and related to the degree of implementation of the program, not affecting the AA.
Recommendation: The evaluation team recommended that reports annually on all strategic developments in the second half of the period (most visible results)
MONITORING

Articles 54 and 56 of the Regulation provide that assessments should be carried out to improve the quality of the design and implementation of programs (not the Agreement in general), and to assess their effectiveness, efficiency and impact
The evaluation team believes that the evaluation of actions supported by cohesion policy rests primarily with the Operational Programmes (PDR and the EAFRD) but not to the Association Agreement. Tracking this will check if the great results are achieved
EVALUATION
3.3- The monitoring and evaluation in the 2014-2020

4.-Financial aspects
1. Consistency of financial allocations with respect to the strategic nature of each thematic objective
2. Rates of financing required by Regulations

4.1-Consistency of allocationsThe importance of TO is determined from the SWOT country proposed by the evaluation team
The larger (greater volume) areas should be placed as high as possible to ensure consistency

4.2-Rates of financing required The ESF Regulation determined in Article 4, paragraph 2, " At
least 20 % of the total ESF resources in each Member State shall be allocated to the thematic objective "promoting social inclusion, combating poverty and any discrimination" set out in point (9) of the first paragraph of Article 9 of Regulation (EU) No 1303/2013.
Article 7.4. ERDF Regulation states that “At least 5 % of the ERDF resources allocated at national level under the Investment for growth and jobs goal shall be allocated to integrated actions for sustainable urban development where cities, sub-regional or local bodies responsible for implementing sustainable urban strategies ("urban authorities") shall be responsible for tasks relating, at least, to the selection of operations in accordance with Article 123(6) of Regulation (EU) No 1303/2013, or, where appropriate, in accordance with Article 123(7) of that Regulation. The indicative amount to be dedicated for the purposes of paragraph 2 of this Article shall be set out in the operational programme or programmes concerned "

5.-Governance & the programming structure1. Introduction2. Evaluation of some measures for good
governance3. Assessment of HR and administrative capacity
used during the preparation of the Agreement4. Communication and coordination. Application
of the partnership principle

5.1-Introduction The new governance in modern societies
Member States should organize a partnership with regional authorities, local, urban and other public authorities, economic and social partners and organizations representing civil society (CPR)
Code of conduct of the partnership

5.2-Measures for good governance
Concentration of resources Simplification Proportionality Decentralization Management efficiency Burden reduction Improving administrative capacity Possible incorporation of private actors in the national
portion Increased use of financial instruments

5.3-HR & administrative capacity
Tasks

Management models
ERDF ESF EAFRD EMFF
Programs 19 Regional OP
3 Pluri-regional OP
19 Regional OP
3 Pluri-regional OP
17 PDR Regionales+
1 OP Nacional
1 OP Pluri-regional
National Funding Regional OP: AGE-CC.AA.
Pluri-regional OP: AGE
Regional OP: CC.AA.
Pluri-regional OP: AGE
OP Regionales: AGE-CC.AA.
OP Nacional: AGE
AGE y CC.AA.
Management
Authority
AGE
IB: AGE & CC.AA.
AGE
IB: AGE & CC.AA.
CC.AA. en los regionales
AGE en el nacional
AGE
OI: AGE y CC.AA.Payments &
Certification
Authority
AGE AGE CCAA en los Regionales
AGE en el NacionalAGE
OI: AGE y CC.AA.
Audit Authority IGAE+Audit CC.AA. IGAE+Audit CC.AA. IGAE+Intervenciones
CC.AA.
IGAE+Intervenciones
CC.AA.
Financial
responsability
AGE AGE for Pluri-regional
CC.AA. for Regional
CCAA (prácticamente el OP
nacional no se ejecuta)
AGE
CC.AA.
5.3-HR & administrative capacity

Management models
The evaluation team detects human resources available for the development of this Agreement and the programming period 2014-2020 are generally correct, although not abundant
This situation is, however, in line with the resourcing of the Spanish administration, which has made significant efforts in recent years austerity
5.3-HR & administrative capacity

5.4-Comunication & coordinationWho is consulted (list of partners), when (main meetings) & how (next graph)

6.-Conclussions & recomendations1. Main results related to:
1. Strategy2. Indicators3. Financial plan4. Governance
2. Final conclussions

6.1-Main results Set a clear strategy from a national perspective

The EAFRD and EMFF funds should each have a separate analysis
Perform SWOT analysis under the principle of parsimony
The items included in the SWOT analysis should be properly explained and supported with a previous descriptive analysis is strategic
Facing the new programming period, it is recommended to separate more programming tasks the managing authorities
6.1-Main results

Importance of order and presentation of concepts. In some cases the content was excessive and in others, insufficient
Statistics used: national official sources data from international suppliers, mainly Eurostat and OECD, for the development of the analysis must be used for analysis at national and regional level, and compared
Detailing the steps taken by the Government during the process of structural reforms, since they can affect performance in certain lines of EIE Funds
6.1-Main results

The results about the relevance of the strategy, internal consistency, external consistency, consideration of the territorial aspects, financial analysis, indicators of the Agreement and the new period, the principle of partnership, etc.. have been explained in each of the sections
6.1-Main results

6.2-Final conclussions
Complicated job but opportunity
The Partnership has a crucial role but the operational programs will be supplemented as aspects not covered in it, partly because of its general nature as to constitute the framework for the programming of cohesion policy for Spain during the new period
Highlight the results of the new approach to period: importance of impact assessments
