the excel analyst's guide to access sample chapter
DESCRIPTION
The ultimate handbook for Excel analysts who need reporting solutions using AccessTRANSCRIPT

Click here to buy the book.
Sample Chapter

The Excel Analyst’sGuide to Access
Chapter 2Access Basics
ISBN: 978-0-470-56701-2
Copyright of Wiley Publishing, Inc.Indianapolis, Indiana
Posted with Permission
Click here to buy the book.
C H A P T E R
2
Access Basics
When working with Access for the first time, it is tempting to start fillingtables right away and querying data to get fast results, but it’s important tounderstand the basics of the relational database concept before pounding awayat data. A good understanding of how a relational database works will help youtake full advantage of Access as a powerful data analysis solution. This chaptercovers the fundamentals of Access and methods to bring data into the program.
Access Tables
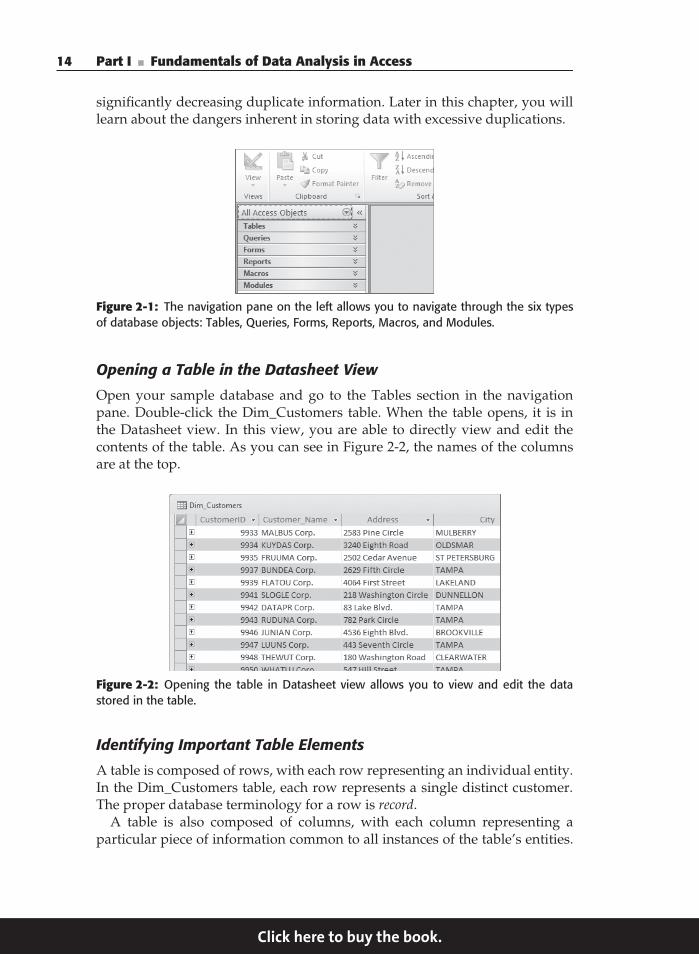
Upon opening any existing Access database, you notice that the Database win-dow, shown in Figure 2-1, contains a task pane on the left. Using the topmostdropdown box, change the navigation category to All Access Objects. You willget six sections. Each section represents one of the six database objects: Tables,Queries, Forms, Reports, Macros, and Modules. The Tables section is appropri-ately at the top of the list because it is the precise location where your data willbe stored. All other database objects will refer to the tables in your databasefor data, whether asking questions of the data or creating reports based on thedata. This section covers the basics to get you working with Access tables.
Table Basics
One way to think of a table is as a collection of data concerning a specifictype of entity (such as customers, branches, transactions, products, and soon). You want each of these entities to have its own unique table. Among themany advantages to storing your data using this approach is eliminating or
13
Click here to buy the book.
14 Part I ■ Fundamentals of Data Analysis in Access
significantly decreasing duplicate information. Later in this chapter, you willlearn about the dangers inherent in storing data with excessive duplications.
Figure 2-1: The navigation pane on the left allows you to navigate through the six typesof database objects: Tables, Queries, Forms, Reports, Macros, and Modules.
Opening a Table in the Datasheet View
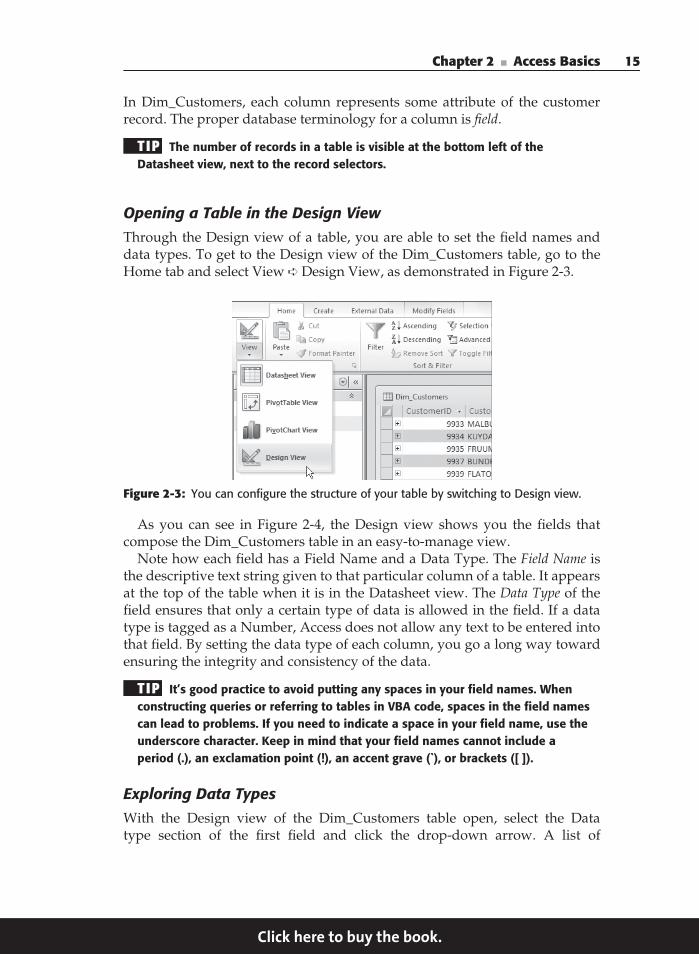
Open your sample database and go to the Tables section in the navigationpane. Double-click the Dim_Customers table. When the table opens, it is inthe Datasheet view. In this view, you are able to directly view and edit thecontents of the table. As you can see in Figure 2-2, the names of the columnsare at the top.
Figure 2-2: Opening the table in Datasheet view allows you to view and edit the datastored in the table.
Identifying Important Table Elements
A table is composed of rows, with each row representing an individual entity.In the Dim_Customers table, each row represents a single distinct customer.The proper database terminology for a row is record.
A table is also composed of columns, with each column representing aparticular piece of information common to all instances of the table’s entities.
Click here to buy the book.
Chapter 2 ■ Access Basics 15
In Dim_Customers, each column represents some attribute of the customerrecord. The proper database terminology for a column is field.
TIP The number of records in a table is visible at the bottom left of theDatasheet view, next to the record selectors.
Opening a Table in the Design View
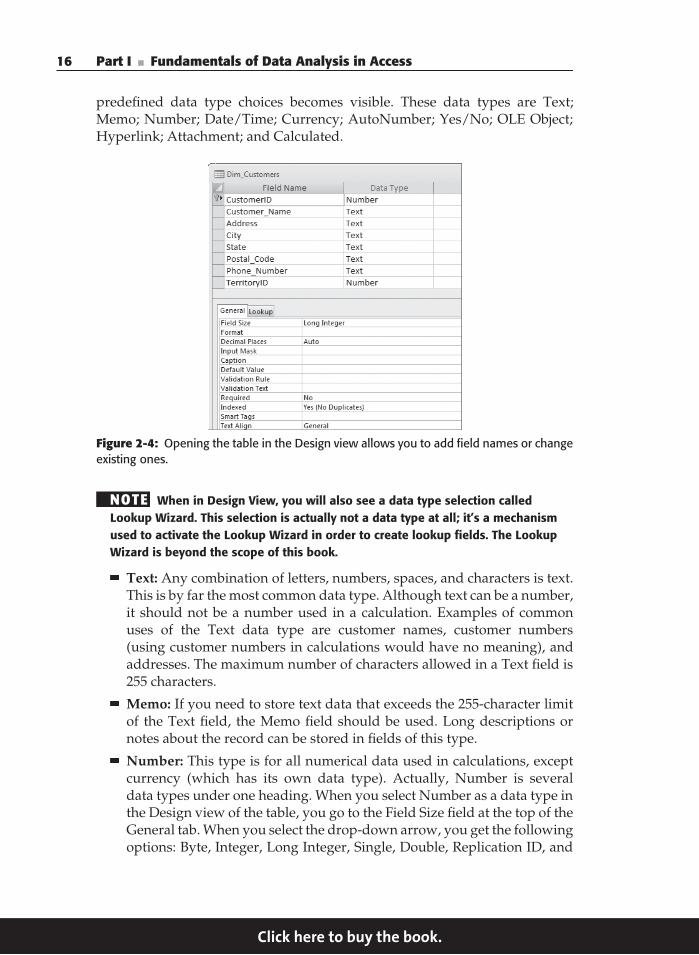
Through the Design view of a table, you are able to set the field names anddata types. To get to the Design view of the Dim_Customers table, go to theHome tab and select View ➪ Design View, as demonstrated in Figure 2-3.
Figure 2-3: You can configure the structure of your table by switching to Design view.
As you can see in Figure 2-4, the Design view shows you the fields thatcompose the Dim_Customers table in an easy-to-manage view.
Note how each field has a Field Name and a Data Type. The Field Name isthe descriptive text string given to that particular column of a table. It appearsat the top of the table when it is in the Datasheet view. The Data Type of thefield ensures that only a certain type of data is allowed in the field. If a datatype is tagged as a Number, Access does not allow any text to be entered intothat field. By setting the data type of each column, you go a long way towardensuring the integrity and consistency of the data.
TIP It’s good practice to avoid putting any spaces in your field names. Whenconstructing queries or referring to tables in VBA code, spaces in the field namescan lead to problems. If you need to indicate a space in your field name, use theunderscore character. Keep in mind that your field names cannot include aperiod (.), an exclamation point (!), an accent grave (`), or brackets ([ ]).
Exploring Data Types
With the Design view of the Dim_Customers table open, select the Datatype section of the first field and click the drop-down arrow. A list of
Click here to buy the book.
16 Part I ■ Fundamentals of Data Analysis in Access
predefined data type choices becomes visible. These data types are Text;Memo; Number; Date/Time; Currency; AutoNumber; Yes/No; OLE Object;Hyperlink; Attachment; and Calculated.
Figure 2-4: Opening the table in the Design view allows you to add field names or changeexisting ones.
NOTE When in Design View, you will also see a data type selection calledLookup Wizard. This selection is actually not a data type at all; it’s a mechanismused to activate the Lookup Wizard in order to create lookup fields. The LookupWizard is beyond the scope of this book.
Text: Any combination of letters, numbers, spaces, and characters is text.This is by far the most common data type. Although text can be a number,it should not be a number used in a calculation. Examples of commonuses of the Text data type are customer names, customer numbers(using customer numbers in calculations would have no meaning), andaddresses. The maximum number of characters allowed in a Text field is255 characters.
Memo: If you need to store text data that exceeds the 255-character limitof the Text field, the Memo field should be used. Long descriptions ornotes about the record can be stored in fields of this type.
Number: This type is for all numerical data used in calculations, exceptcurrency (which has its own data type). Actually, Number is severaldata types under one heading. When you select Number as a data type inthe Design view of the table, you go to the Field Size field at the top of theGeneral tab. When you select the drop-down arrow, you get the followingoptions: Byte, Integer, Long Integer, Single, Double, Replication ID, and
Click here to buy the book.
Chapter 2 ■ Access Basics 17
Decimal. Probably the most commonly used field sizes of the Numberdata type are Long Integer and Double. Long Integer should be selectedif the numbers are whole numbers that do not have any non-zeros to theright of the decimal point. Double should be selected if numbers withdecimals need to be stored.
Date/Time: Another data type often used in calculations is Date/Time.Recording the time that certain events occur is among the more importantuses of this data type. Recording dates and times allows you to comparedata by time durations, be it months, years, or whatever. In the businessworld, the date field can be crucial to analysis, especially in identifyingseasonal trends or year-over-year comparisons.
Currency: A special calculation data type, Currency is ideal for storingall data that represents amounts of money.
AutoNumber: This data type is actually a Long Integer automaticallyand sequentially created for each new record added to a table. TheAutoNumber can be one mechanism by which you can uniquely identifyeach record in a table. You will not enter data into this field.
Yes/No: There are situations where the data that needs to be representedis in a simple Yes/No format. Although you could use the Text data typefor creating a True/False field, it is much more intuitive to use Access’snative data type for this purpose.
OLE Object: This data type is not encountered very often in data analysis.It is used when the field must store a binary file, such as a picture orsound file.
Hyperlink: When you need to store an address to a Web site, this is thepreferred data type.
Attachment: This data type was introduced with Access 2007. When youset a field to the Attachment type, you can attach images, spreadsheet files,documents, charts, and other types of supported files to the records inyour database. You can also configure the field to view and edit attachedfiles.
Calculated: This data type is new to Access 2010. With Calculated typefields, you can build mathematical operations, textual evaluations, or anyother calculation directly into your table.
Creating a Table from Scratch
Access provides several methods for creating a table. The ideal way to createa table in Access is with the Design view. Why? The Design view allowsfor a compact work area so you can add fields, reposition fields, and assignattributes easily.
Click here to buy the book.
18 Part I ■ Fundamentals of Data Analysis in Access
Imagine that the human resources department asks you to create a simplelist of employees in Access.
1. To create this table in the Design view, go to the application ribbon andselect the Create tab and then the Table Design button. This opens anempty table called Table1 in Design view.
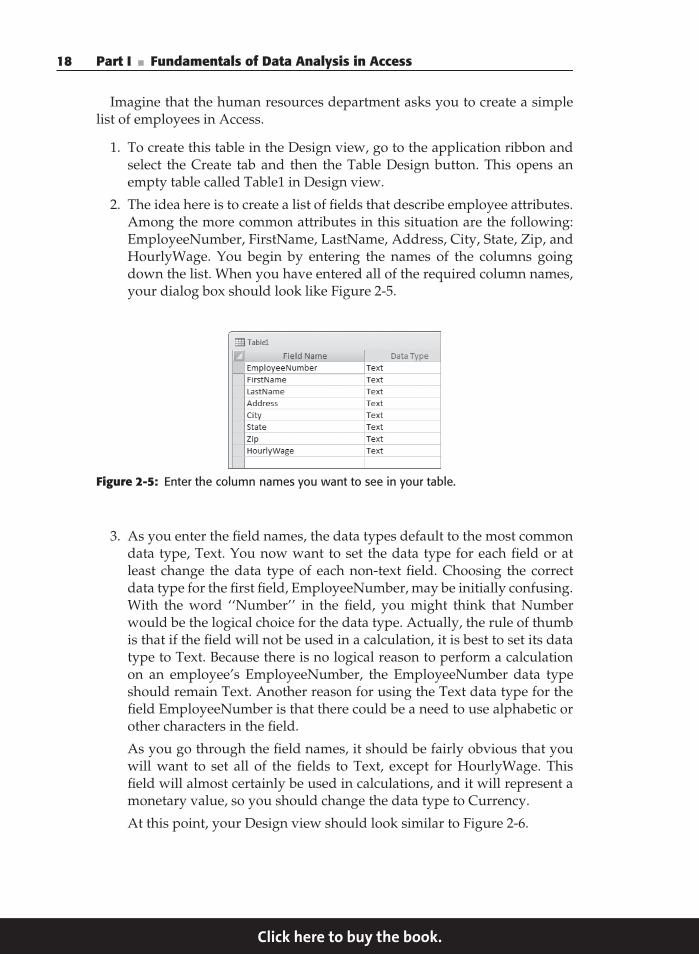
2. The idea here is to create a list of fields that describe employee attributes.Among the more common attributes in this situation are the following:EmployeeNumber, FirstName, LastName, Address, City, State, Zip, andHourlyWage. You begin by entering the names of the columns goingdown the list. When you have entered all of the required column names,your dialog box should look like Figure 2-5.
Figure 2-5: Enter the column names you want to see in your table.
3. As you enter the field names, the data types default to the most commondata type, Text. You now want to set the data type for each field or atleast change the data type of each non-text field. Choosing the correctdata type for the first field, EmployeeNumber, may be initially confusing.With the word ‘‘Number’’ in the field, you might think that Numberwould be the logical choice for the data type. Actually, the rule of thumbis that if the field will not be used in a calculation, it is best to set its datatype to Text. Because there is no logical reason to perform a calculationon an employee’s EmployeeNumber, the EmployeeNumber data typeshould remain Text. Another reason for using the Text data type for thefield EmployeeNumber is that there could be a need to use alphabetic orother characters in the field.
As you go through the field names, it should be fairly obvious that youwill want to set all of the fields to Text, except for HourlyWage. Thisfield will almost certainly be used in calculations, and it will represent amonetary value, so you should change the data type to Currency.
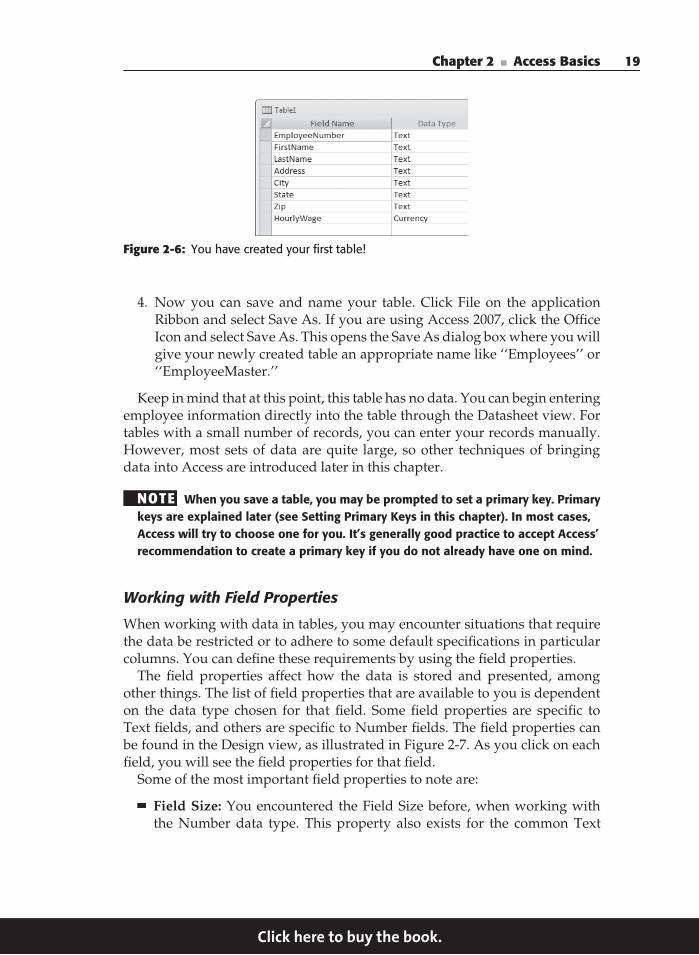
At this point, your Design view should look similar to Figure 2-6.
Click here to buy the book.
Chapter 2 ■ Access Basics 19
Figure 2-6: You have created your first table!
4. Now you can save and name your table. Click File on the applicationRibbon and select Save As. If you are using Access 2007, click the OfficeIcon and select Save As. This opens the Save As dialog box where you willgive your newly created table an appropriate name like ‘‘Employees’’ or‘‘EmployeeMaster.’’
Keep in mind that at this point, this table has no data. You can begin enteringemployee information directly into the table through the Datasheet view. Fortables with a small number of records, you can enter your records manually.However, most sets of data are quite large, so other techniques of bringingdata into Access are introduced later in this chapter.
NOTE When you save a table, you may be prompted to set a primary key. Primarykeys are explained later (see Setting Primary Keys in this chapter). In most cases,Access will try to choose one for you. It’s generally good practice to accept Access’recommendation to create a primary key if you do not already have one on mind.
Working with Field Properties
When working with data in tables, you may encounter situations that requirethe data be restricted or to adhere to some default specifications in particularcolumns. You can define these requirements by using the field properties.
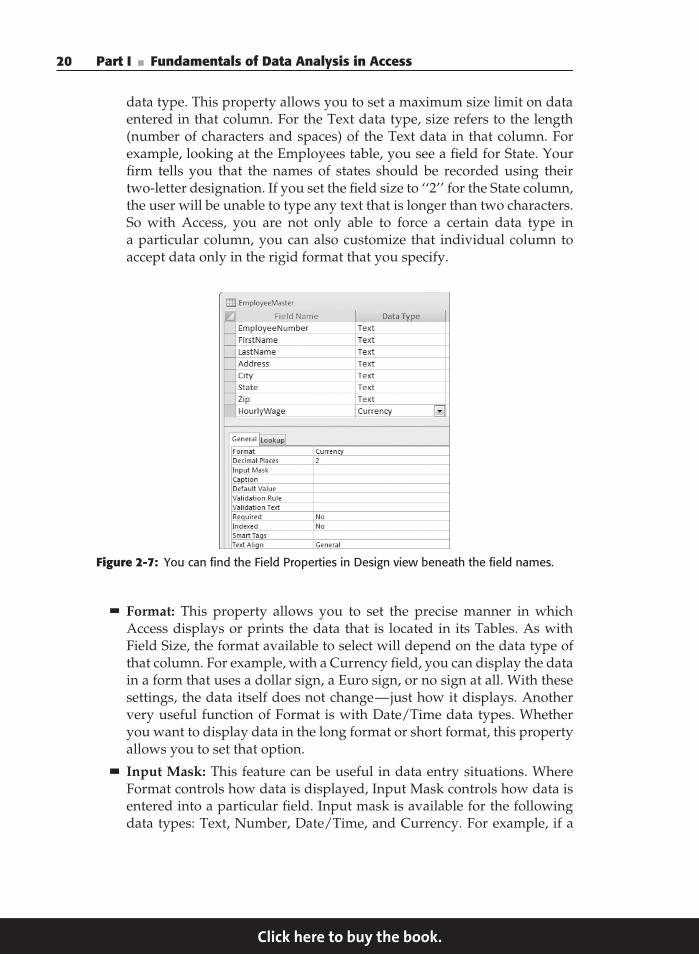
The field properties affect how the data is stored and presented, amongother things. The list of field properties that are available to you is dependenton the data type chosen for that field. Some field properties are specific toText fields, and others are specific to Number fields. The field properties canbe found in the Design view, as illustrated in Figure 2-7. As you click on eachfield, you will see the field properties for that field.
Some of the most important field properties to note are:
Field Size: You encountered the Field Size before, when working withthe Number data type. This property also exists for the common Text
Click here to buy the book.
20 Part I ■ Fundamentals of Data Analysis in Access
data type. This property allows you to set a maximum size limit on dataentered in that column. For the Text data type, size refers to the length(number of characters and spaces) of the Text data in that column. Forexample, looking at the Employees table, you see a field for State. Yourfirm tells you that the names of states should be recorded using theirtwo-letter designation. If you set the field size to ‘‘2’’ for the State column,the user will be unable to type any text that is longer than two characters.So with Access, you are not only able to force a certain data type ina particular column, you can also customize that individual column toaccept data only in the rigid format that you specify.
Figure 2-7: You can find the Field Properties in Design view beneath the field names.
Format: This property allows you to set the precise manner in whichAccess displays or prints the data that is located in its Tables. As withField Size, the format available to select will depend on the data type ofthat column. For example, with a Currency field, you can display the datain a form that uses a dollar sign, a Euro sign, or no sign at all. With thesesettings, the data itself does not change—just how it displays. Anothervery useful function of Format is with Date/Time data types. Whetheryou want to display data in the long format or short format, this propertyallows you to set that option.
Input Mask: This feature can be useful in data entry situations. WhereFormat controls how data is displayed, Input Mask controls how data isentered into a particular field. Input mask is available for the followingdata types: Text, Number, Date/Time, and Currency. For example, if a
Click here to buy the book.
Chapter 2 ■ Access Basics 21
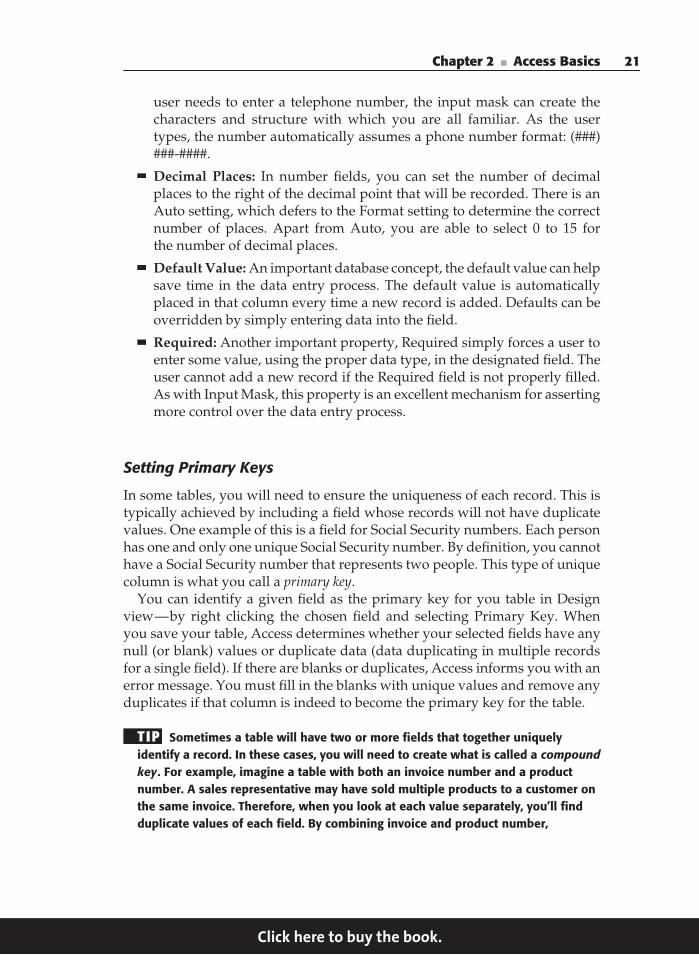
user needs to enter a telephone number, the input mask can create thecharacters and structure with which you are all familiar. As the usertypes, the number automatically assumes a phone number format: (###)###-####.
Decimal Places: In number fields, you can set the number of decimalplaces to the right of the decimal point that will be recorded. There is anAuto setting, which defers to the Format setting to determine the correctnumber of places. Apart from Auto, you are able to select 0 to 15 forthe number of decimal places.
Default Value: An important database concept, the default value can helpsave time in the data entry process. The default value is automaticallyplaced in that column every time a new record is added. Defaults can beoverridden by simply entering data into the field.
Required: Another important property, Required simply forces a user toenter some value, using the proper data type, in the designated field. Theuser cannot add a new record if the Required field is not properly filled.As with Input Mask, this property is an excellent mechanism for assertingmore control over the data entry process.
Setting Primary Keys
In some tables, you will need to ensure the uniqueness of each record. This istypically achieved by including a field whose records will not have duplicatevalues. One example of this is a field for Social Security numbers. Each personhas one and only one unique Social Security number. By definition, you cannothave a Social Security number that represents two people. This type of uniquecolumn is what you call a primary key.
You can identify a given field as the primary key for you table in Designview—by right clicking the chosen field and selecting Primary Key. Whenyou save your table, Access determines whether your selected fields have anynull (or blank) values or duplicate data (data duplicating in multiple recordsfor a single field). If there are blanks or duplicates, Access informs you with anerror message. You must fill in the blanks with unique values and remove anyduplicates if that column is indeed to become the primary key for the table.
TIP Sometimes a table will have two or more fields that together uniquelyidentify a record. In these cases, you will need to create what is called a compoundkey. For example, imagine a table with both an invoice number and a productnumber. A sales representative may have sold multiple products to a customer onthe same invoice. Therefore, when you look at each value separately, you’ll findduplicate values of each field. By combining invoice and product number,
Click here to buy the book.
22 Part I ■ Fundamentals of Data Analysis in Access
however, you can create a compound primary key that is truly unique for eachrecord. If you need a compound key, do the following:
1. Select the first field that will be included in your compound key by clicking onthe grey square to the right of the Field Name. Then while holding down theControl key on your keyboard, click the grey square next to the second field to beincluded.
2. Right click on the Field Name (right clicking on the grey square will cause Accessto forget your multiple selection).
3. Close the table and save your changes.
Importing Data into AccessApart from creating a table from scratch and manually entering the data, youcan import data, which essentially makes a copy of the data directly in yourAccess database. After importing, the data is disconnected from the sourcefrom which it was imported.
To get an idea of how Importing works, imagine that HR has passed youan Excel file containing their master employee table. You want to import thattable into your database.
TIP The ExcelMaster.xlsx file can be found within the sample files for this book,installed under C:\OffTheGrid.
1. Click the External Data tab and then click the Excel icon.
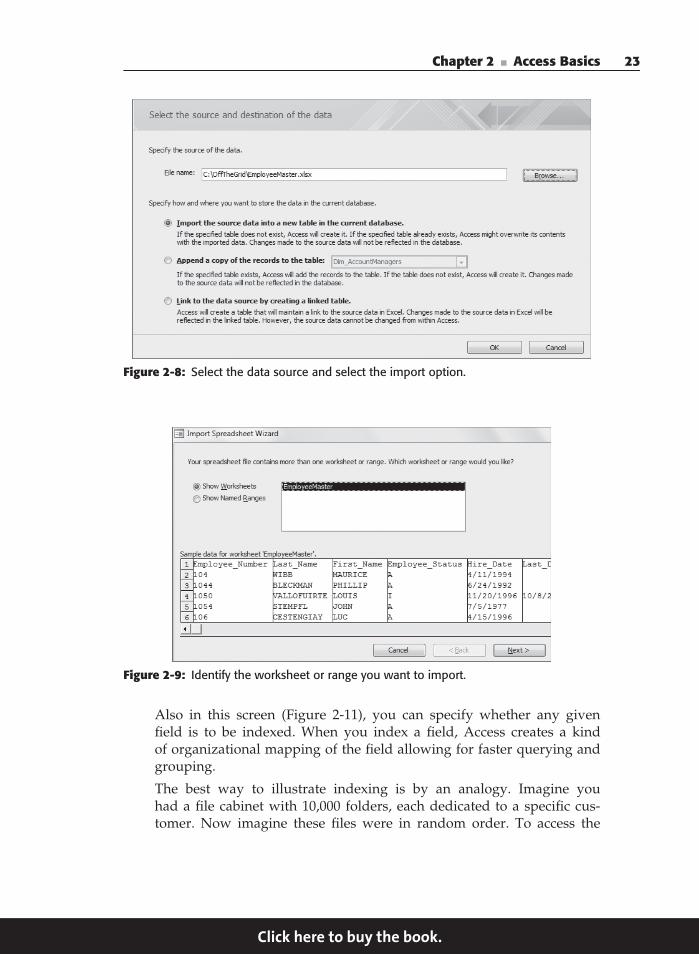
2. Browse for the file you wish to import and then select the ‘‘Import thesource data into a new table . . . ’’ option. Figure 2-8 shows you whatthe wizard should look like.
3. Click the OK button to activate the Import Spreadsheet Wizard shownin Figure 2-9. The first dialog box in the Import Spreadsheet Wizardallows you to specify the worksheet or range you want to import. Ifyour workbook has more than one worksheet, all worksheets are listedon this screen. In this case, there is only one worksheet. Select the targetworksheet and click the Next button.
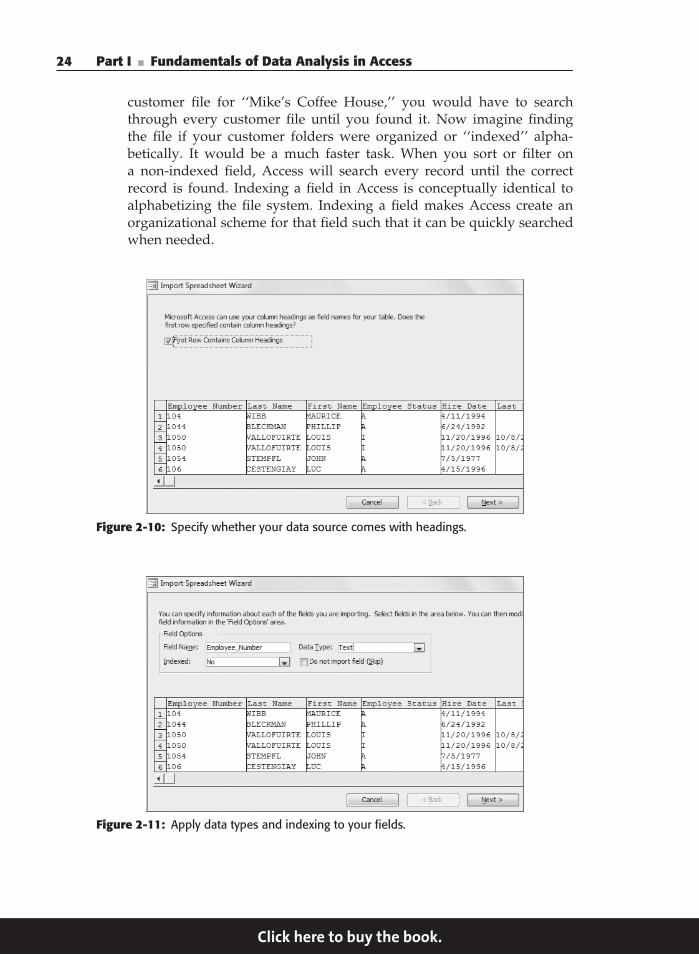
4. The next screen (Figure 2-10) allows you to select whether or not thesource data has headings or column labels. As you can see, you willsimply check the checkbox if your source data has headings. Click theNext button to move on.
5. The next screen (Figure 2-11) allows you to specify the data type for eachfield. This setting allows you to tell Access whether the given field is anumber, text, currency, date, etc. The idea is to select each field and checkto make sure the data type for that field is correct.
Click here to buy the book.
Chapter 2 ■ Access Basics 23
Figure 2-8: Select the data source and select the import option.
Figure 2-9: Identify the worksheet or range you want to import.
Also in this screen (Figure 2-11), you can specify whether any givenfield is to be indexed. When you index a field, Access creates a kindof organizational mapping of the field allowing for faster querying andgrouping.
The best way to illustrate indexing is by an analogy. Imagine youhad a file cabinet with 10,000 folders, each dedicated to a specific cus-tomer. Now imagine these files were in random order. To access the
Click here to buy the book.
24 Part I ■ Fundamentals of Data Analysis in Access
customer file for ‘‘Mike’s Coffee House,’’ you would have to searchthrough every customer file until you found it. Now imagine findingthe file if your customer folders were organized or ‘‘indexed’’ alpha-betically. It would be a much faster task. When you sort or filter ona non-indexed field, Access will search every record until the correctrecord is found. Indexing a field in Access is conceptually identical toalphabetizing the file system. Indexing a field makes Access create anorganizational scheme for that field such that it can be quickly searchedwhen needed.
Figure 2-10: Specify whether your data source comes with headings.
Figure 2-11: Apply data types and indexing to your fields.
Click here to buy the book.
Chapter 2 ■ Access Basics 25
NOTE You may wonder why you would not index all your fields. Wouldn’tthat make your queries run faster? The answer is an emphatic no! Indexing isa good idea on fields you expect to filter or join to another table. Indexing isnot a good idea for fields you expect to perform calculations on. You shouldalso be aware that while indexing can improve the performance for sometypes of analysis, other types could actually be slowed by using indexedfields.
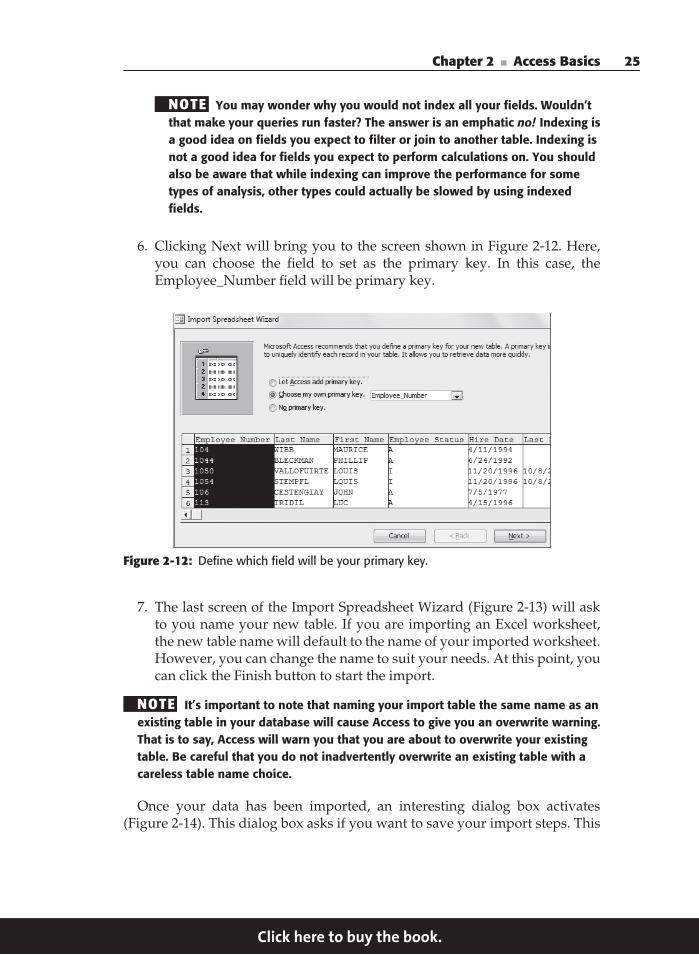
6. Clicking Next will bring you to the screen shown in Figure 2-12. Here,you can choose the field to set as the primary key. In this case, theEmployee_Number field will be primary key.
Figure 2-12: Define which field will be your primary key.
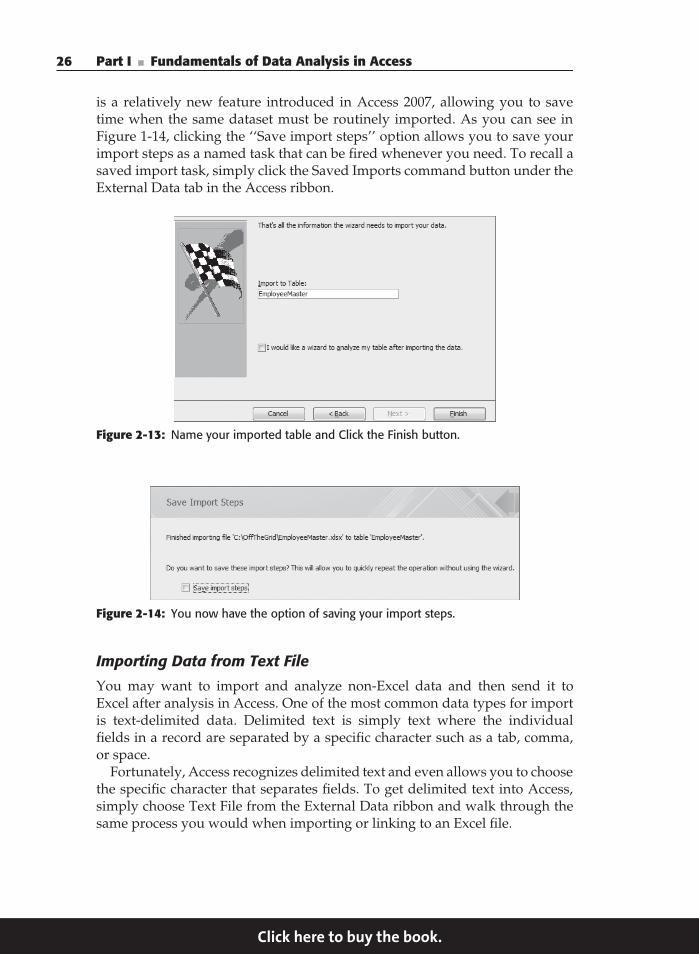
7. The last screen of the Import Spreadsheet Wizard (Figure 2-13) will askto you name your new table. If you are importing an Excel worksheet,the new table name will default to the name of your imported worksheet.However, you can change the name to suit your needs. At this point, youcan click the Finish button to start the import.
NOTE It’s important to note that naming your import table the same name as anexisting table in your database will cause Access to give you an overwrite warning.That is to say, Access will warn you that you are about to overwrite your existingtable. Be careful that you do not inadvertently overwrite an existing table with acareless table name choice.
Once your data has been imported, an interesting dialog box activates(Figure 2-14). This dialog box asks if you want to save your import steps. This
Click here to buy the book.
26 Part I ■ Fundamentals of Data Analysis in Access
is a relatively new feature introduced in Access 2007, allowing you to savetime when the same dataset must be routinely imported. As you can see inFigure 1-14, clicking the ‘‘Save import steps’’ option allows you to save yourimport steps as a named task that can be fired whenever you need. To recall asaved import task, simply click the Saved Imports command button under theExternal Data tab in the Access ribbon.
Figure 2-13: Name your imported table and Click the Finish button.
Figure 2-14: You now have the option of saving your import steps.
Importing Data from Text File
You may want to import and analyze non-Excel data and then send it toExcel after analysis in Access. One of the most common data types for importis text-delimited data. Delimited text is simply text where the individualfields in a record are separated by a specific character such as a tab, comma,or space.
Fortunately, Access recognizes delimited text and even allows you to choosethe specific character that separates fields. To get delimited text into Access,simply choose Text File from the External Data ribbon and walk through thesame process you would when importing or linking to an Excel file.
Click here to buy the book.
Chapter 2 ■ Access Basics 27
TRICKS OF THE TRADE: USING COMPACT AND REPAIR
As you bring data into Access, it’s important to remember that Access doesnot let go of disk space on its own. This means that as time passes, all thefile space taken up by the data you imported will be held by your Access file,regardless of whether the data is actually still there.
In that light, it’s critical to that you perform a compact and repair operationon your Access database regularly to ensure that your database does not growto an unmanageable size or, even worse, become corrupted.
To compact and repair your database in Access 2007, click the Office iconand select Manage ➪ Compact and Repair Database.
To compact and repair your database in Access 2010, go to the applicationribbon and select File ➪ Info ➪ Compact and Repair Database.
How often you perform this operation really depends on how frequentlyyou add and then delete tables from your database. The best practice is tocompact and repair your Access database at least every time you open orclose it. You can automate this action by clicking Access Options ➪ CurrentDatabase. Once in the Current Database Menu section, select the Compact onClose check box. This will ensure your database is compacted and repaired atleast every time you close the application.
Linking an Excel Worksheet to AccessSometimes, the data you want to incorporate into Access is going to changefrequently. Does it make sense to import that data into a new Access tableevery time it changes? What if you do not know when it changes yet it iscritical to have the most up-to-date information for your analysis? In thesesituations, it makes more sense to create a link to your data.
Linking data is different from importing data in that Access references thelinked data in its original location. Importing data brings a local copy ofthe information into the Access database. Any changes made to the local copyin Access do not affect the original spreadsheet. Likewise, any changes madeto the original spreadsheet after importing will not be reflected in the Accesstable.
Conversely, a linked Excel sheet exists in real time. Changes made to thesheet in the original Excel file will be reflected in Access upon refresh. However,you will not be able to make changes to the Excel data through Access. Linkingis a one-way street of data flow.
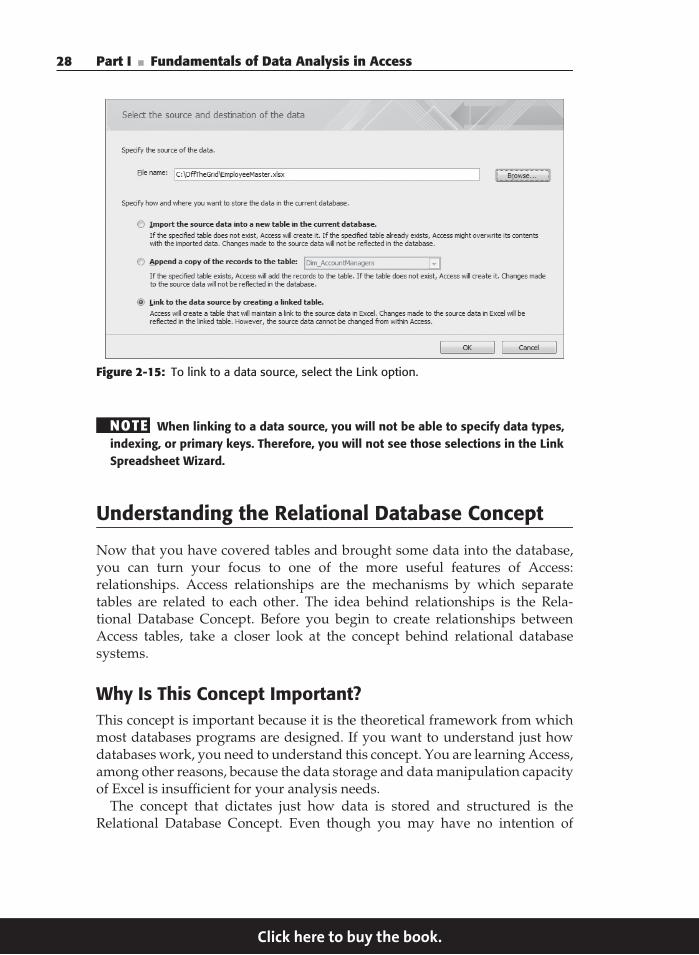
To link to a data source, you would start by selecting the External Data taband then select the Import Excel icon. This time, select the ‘‘Link to the datasource by creating a linked table’’ option (see Figure 2-15).
From here, Access will walk you through steps similar to those taken whenimporting data.
Click here to buy the book.
28 Part I ■ Fundamentals of Data Analysis in Access
Figure 2-15: To link to a data source, select the Link option.
NOTE When linking to a data source, you will not be able to specify data types,indexing, or primary keys. Therefore, you will not see those selections in the LinkSpreadsheet Wizard.
Understanding the Relational Database Concept
Now that you have covered tables and brought some data into the database,you can turn your focus to one of the more useful features of Access:relationships. Access relationships are the mechanisms by which separatetables are related to each other. The idea behind relationships is the Rela-tional Database Concept. Before you begin to create relationships betweenAccess tables, take a closer look at the concept behind relational databasesystems.
Why Is This Concept Important?This concept is important because it is the theoretical framework from whichmost databases programs are designed. If you want to understand just howdatabases work, you need to understand this concept. You are learning Access,among other reasons, because the data storage and data manipulation capacityof Excel is insufficient for your analysis needs.
The concept that dictates just how data is stored and structured is theRelational Database Concept. Even though you may have no intention of
Click here to buy the book.
Chapter 2 ■ Access Basics 29
becoming a database administrator, having some understanding of how thedata that you would like to analyze has been stored and structured will increaseyour performance and productivity. It will also promote better communicationbetween you and the IT department and the database administrator, since nowyou will be able to understand at least some of the vocabulary of the databaselanguage.
Excel and the Flat-File FormatBefore you cover the proper techniques for storing data in Access, examinethe common data storage scenario that led to the problems that the conceptattempts to address. Even if they are not aware of the term flat-file format,most Excel users are very adept at working with data that has been stored init. In fact, most people are familiar with the concept because it is used in somany things that they encounter every day. The flat-file, of course, organizesdata into rows and columns.
There are data analysis scenarios that are not terribly complex, in whicha flat-file representation of the data to be analyzed is adequate. However,most data-analysis scenarios require analyzing data that is much moremulti-dimensional. One of the main reasons that the flat-file can prove inade-quate is that it is two-dimensional. Real-world business data rarely falls intoa convenient, two-dimensional format. Of course, it can be forced into thatformat by the Excel guru who wants all analysis to fit into the spreadsheet.
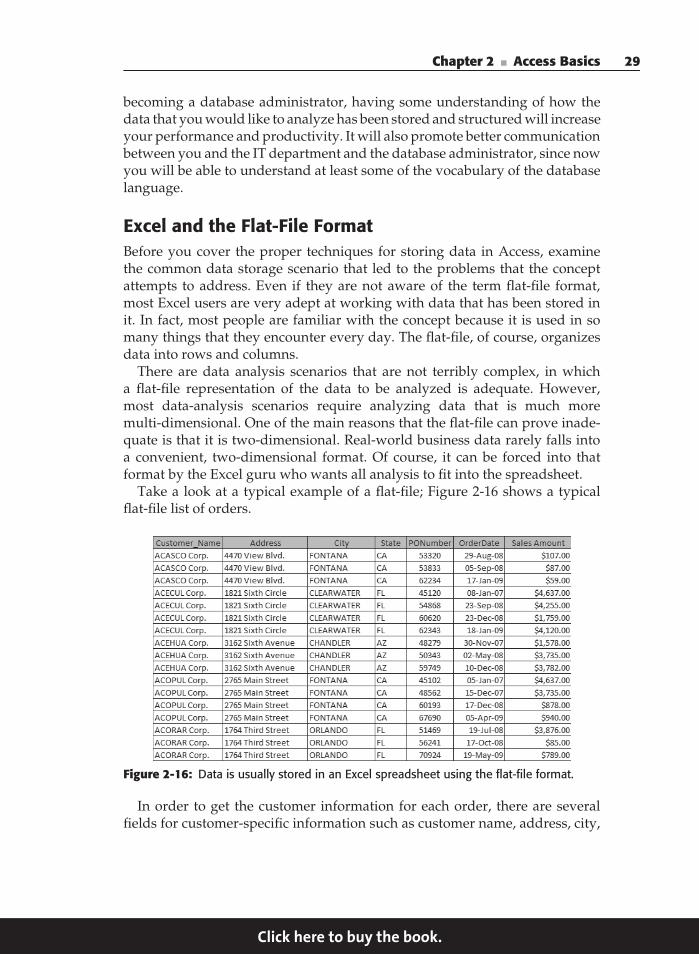
Take a look at a typical example of a flat-file; Figure 2-16 shows a typicalflat-file list of orders.
Figure 2-16: Data is usually stored in an Excel spreadsheet using the flat-file format.
In order to get the customer information for each order, there are severalfields for customer-specific information such as customer name, address, city,
Click here to buy the book.
30 Part I ■ Fundamentals of Data Analysis in Access
and so on. Because most firms sell to customers more than once, for each orderthe same customer information has to be repeated. Duplicate information isone of the main drawbacks of the flat-file format.
What is wrong with duplicate data? Initially, the duplicate data may notappear to be a potential source of future problems, but upon further examina-tion, you discover the shortcomings:
File Size. Duplicate data wastes space, both on the computer hard drive,where the file is stored, and in the computer’s memory, where the dataresides when it is being used. Although the enormous amount of memorythat is standard with today’s machines goes a long way to handling thesedemands, you are wasting valuable computer space and resources. Theduplicate information is not valuable. In fact, it leads to problems.
Updating data: One of the main problems that can arise from too muchduplicate data occurs when that data needs to be updated.
In Figure 2-16, you can see there are several orders for ACASCO Corp. Youcan also see that you have to repeat the information about the customer foreach instance of an order. Imagine a scenario where the customer informationmight change. For example, the customer acquires new office space, and youwant to reflect this change of location in your data. You will have to updatethe change in several different places. You need to ensure that every order willcorrectly map back to its relevant customer information.
While there are excellent functions that find and replace data in Excel, thereis still a danger that you might not make all of the updates correctly. Wheneveryou are changing duplicate information, there is always the risk of introducingunintentional errors.
Splitting Data into Separate TablesData must be consistent if analysis is to have any true value in thedecision-making process. Duplicate data is the bane of consistent data. If anentity is changed in one place, it must be changed in every place. Would it notbe more logical and efficient if you could create the name and informationof a customer only once? Would it not be great simply to have some form ofcustomer reference number instead of creating the same customer informationrepeatedly? Then that customer reference could send you to another listwhere the information is unique and written once.
This is the idea behind the relational database concept. You have separate,carefully designed, unique lists of data, and you relate them to each other byusing their unique identifiers (primary keys).
In a relational database, customer details such as address, city, state, etc,would be listed only once in a master customer table. A transactions table
Click here to buy the book.
Chapter 2 ■ Access Basics 31
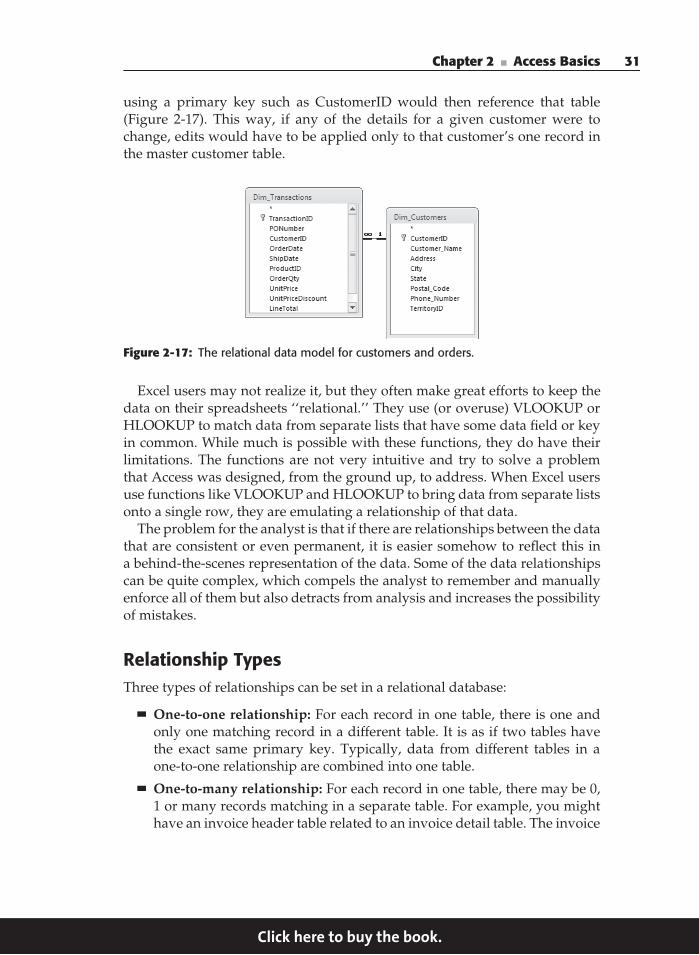
using a primary key such as CustomerID would then reference that table(Figure 2-17). This way, if any of the details for a given customer were tochange, edits would have to be applied only to that customer’s one record inthe master customer table.
Figure 2-17: The relational data model for customers and orders.
Excel users may not realize it, but they often make great efforts to keep thedata on their spreadsheets ‘‘relational.’’ They use (or overuse) VLOOKUP orHLOOKUP to match data from separate lists that have some data field or keyin common. While much is possible with these functions, they do have theirlimitations. The functions are not very intuitive and try to solve a problemthat Access was designed, from the ground up, to address. When Excel usersuse functions like VLOOKUP and HLOOKUP to bring data from separate listsonto a single row, they are emulating a relationship of that data.
The problem for the analyst is that if there are relationships between the datathat are consistent or even permanent, it is easier somehow to reflect this ina behind-the-scenes representation of the data. Some of the data relationshipscan be quite complex, which compels the analyst to remember and manuallyenforce all of them but also detracts from analysis and increases the possibilityof mistakes.
Relationship TypesThree types of relationships can be set in a relational database:
One-to-one relationship: For each record in one table, there is one andonly one matching record in a different table. It is as if two tables havethe exact same primary key. Typically, data from different tables in aone-to-one relationship are combined into one table.
One-to-many relationship: For each record in one table, there may be 0,1 or many records matching in a separate table. For example, you mighthave an invoice header table related to an invoice detail table. The invoice
Click here to buy the book.
32 Part I ■ Fundamentals of Data Analysis in Access
header table has a primary key, Invoice Number. The invoice detail tablewill use the Invoice Number for every record representing a detail of thatparticular invoice. This is certainly the most common type of relationshipyou will encounter.
Many-to-many relationship: Used decidedly less often, this relationshipcannot be defined in Access without the use of a mapping table. Thisrelationship states that records in both tables can have any number ofmatching records in the other table.
In the sample database that came with this book, relationships have alreadybeen established between the tables. Take a look at some of these relationshipsto get a better idea of how you can set and change them.
In Access 2007, go up to the application ribbon and select the DatabaseTools ➪ Relationships.
In Access 2010, go up to the application ribbon and select File ➪ Info ➪
Relationships.
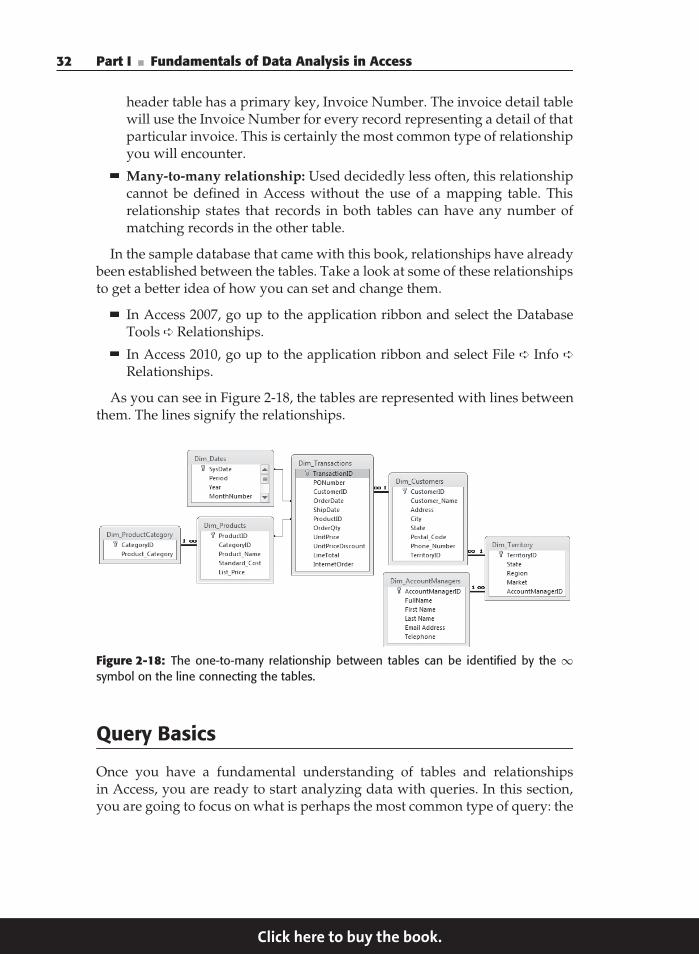
As you can see in Figure 2-18, the tables are represented with lines betweenthem. The lines signify the relationships.
Figure 2-18: The one-to-many relationship between tables can be identified by the ∞symbol on the line connecting the tables.
Query Basics
Once you have a fundamental understanding of tables and relationshipsin Access, you are ready to start analyzing data with queries. In this section,you are going to focus on what is perhaps the most common type of query: the
Click here to buy the book.
Chapter 2 ■ Access Basics 33
select query. You will see the concept behind the query and a few examplesthat illustrate just how easy it is to create queries in Access.
What Is a Query?By definition, a query is a question. For your purposes, it is a question about thedata, which is stored in tables. Queries can be exceedingly simple, like askingwhat all of the data in a table is. Queries can also be quite complex, testingfor different criteria, sorting in certain orders, and performing calculations. InAccess, there are two main types of queries: select and action:
Select queries are perhaps the most common type. This query simplyasks a question of the data and returns the results. No changes are madeto the data whatsoever. You can always run select queries and neverworry that the actual data is being altered.
Action queries actually manipulate and change the data in a table.The action query can add records, delete records, or change (update)information in existing records.
TRICKS OF THE TRADE: SORTING AND FILTERING FOR ON-THE-FLYANALYSIS
There is inherent functionality within Access that allows you to sort and filterthe contents of your tables on the fly: without queries. With this functionality,you can perform quick, impromptu data analysis with just a few clicks of themouse.
This functionality definitely has an Excel feel to it. To get a sense of whatthis means, open a table in the Datasheet view and select the column youwish to sort or filter. Then click the dropdown arrow next to that column’sfield name.
For example, if you wanted to find any customer located in Aberdeen,you could click the dropdown arrow under the City field, select Text Filters,and then select Equals as demonstrated in Figure 2-19. This opens aCustom Filter dialog box where you can simply enter the name that you arefiltering.
The resulting dataset, shown in Figure 2-20, has only the records for the fil-tered name.
To remove the filter, simply click the dropdown arrow next to the filteredcolumn’s field name and select Clear Filter from x, where x equals the fieldname.
(continued)
Click here to buy the book.
34 Part I ■ Fundamentals of Data Analysis in Access
TRICKS OF THE TRADE: SORTING AND FILTERING FOR ON-THE-FLYANALYSIS (continued)
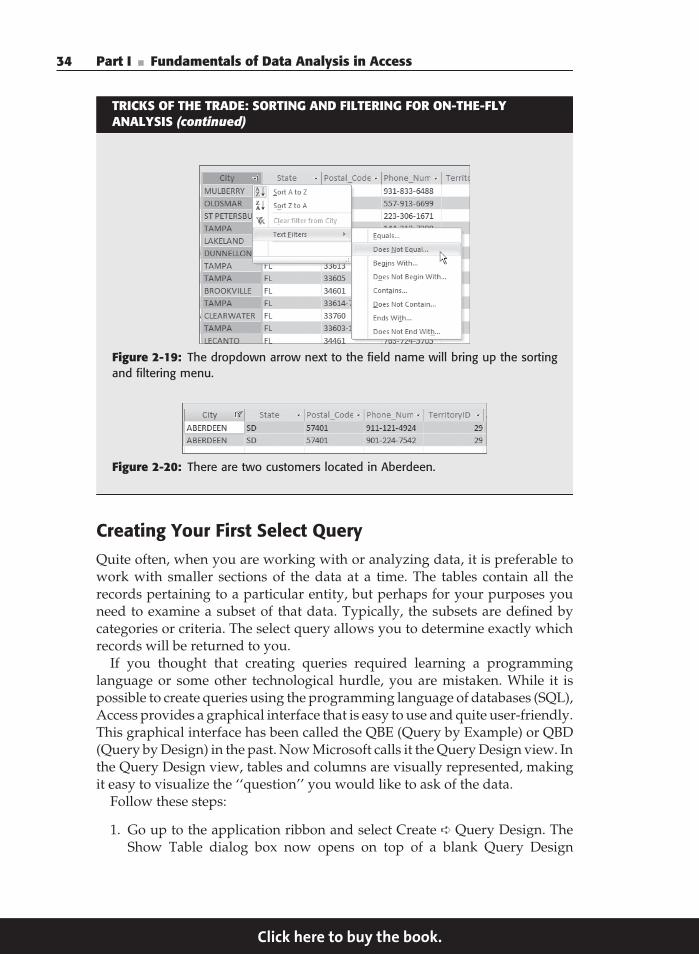
Figure 2-19: The dropdown arrow next to the field name will bring up the sortingand filtering menu.
Figure 2-20: There are two customers located in Aberdeen.
Creating Your First Select QueryQuite often, when you are working with or analyzing data, it is preferable towork with smaller sections of the data at a time. The tables contain all therecords pertaining to a particular entity, but perhaps for your purposes youneed to examine a subset of that data. Typically, the subsets are defined bycategories or criteria. The select query allows you to determine exactly whichrecords will be returned to you.
If you thought that creating queries required learning a programminglanguage or some other technological hurdle, you are mistaken. While it ispossible to create queries using the programming language of databases (SQL),Access provides a graphical interface that is easy to use and quite user-friendly.This graphical interface has been called the QBE (Query by Example) or QBD(Query by Design) in the past. Now Microsoft calls it the Query Design view. Inthe Query Design view, tables and columns are visually represented, makingit easy to visualize the ‘‘question’’ you would like to ask of the data.
Follow these steps:
1. Go up to the application ribbon and select Create ➪ Query Design. TheShow Table dialog box now opens on top of a blank Query Design
Click here to buy the book.
Chapter 2 ■ Access Basics 35
interface, as shown in Figure 2-21. The white grid area you see in theQuery Design view is often called the query grid.
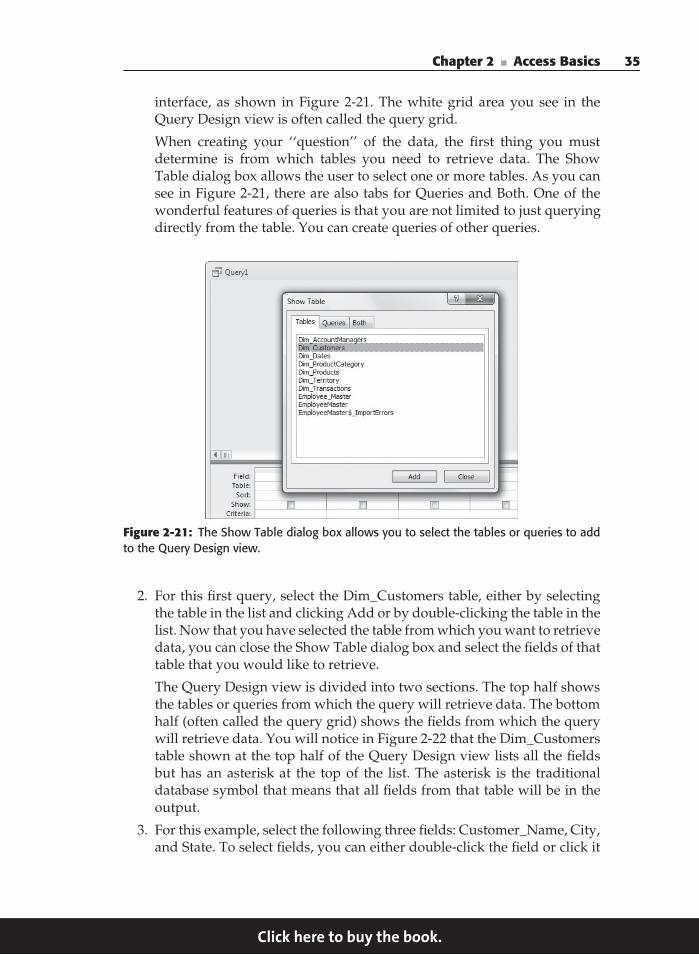
When creating your ‘‘question’’ of the data, the first thing you mustdetermine is from which tables you need to retrieve data. The ShowTable dialog box allows the user to select one or more tables. As you cansee in Figure 2-21, there are also tabs for Queries and Both. One of thewonderful features of queries is that you are not limited to just queryingdirectly from the table. You can create queries of other queries.
Figure 2-21: The Show Table dialog box allows you to select the tables or queries to addto the Query Design view.
2. For this first query, select the Dim_Customers table, either by selectingthe table in the list and clicking Add or by double-clicking the table in thelist. Now that you have selected the table from which you want to retrievedata, you can close the Show Table dialog box and select the fields of thattable that you would like to retrieve.
The Query Design view is divided into two sections. The top half showsthe tables or queries from which the query will retrieve data. The bottomhalf (often called the query grid) shows the fields from which the querywill retrieve data. You will notice in Figure 2-22 that the Dim_Customerstable shown at the top half of the Query Design view lists all the fieldsbut has an asterisk at the top of the list. The asterisk is the traditionaldatabase symbol that means that all fields from that table will be in theoutput.
3. For this example, select the following three fields: Customer_Name, City,and State. To select fields, you can either double-click the field or click it
Click here to buy the book.
36 Part I ■ Fundamentals of Data Analysis in Access
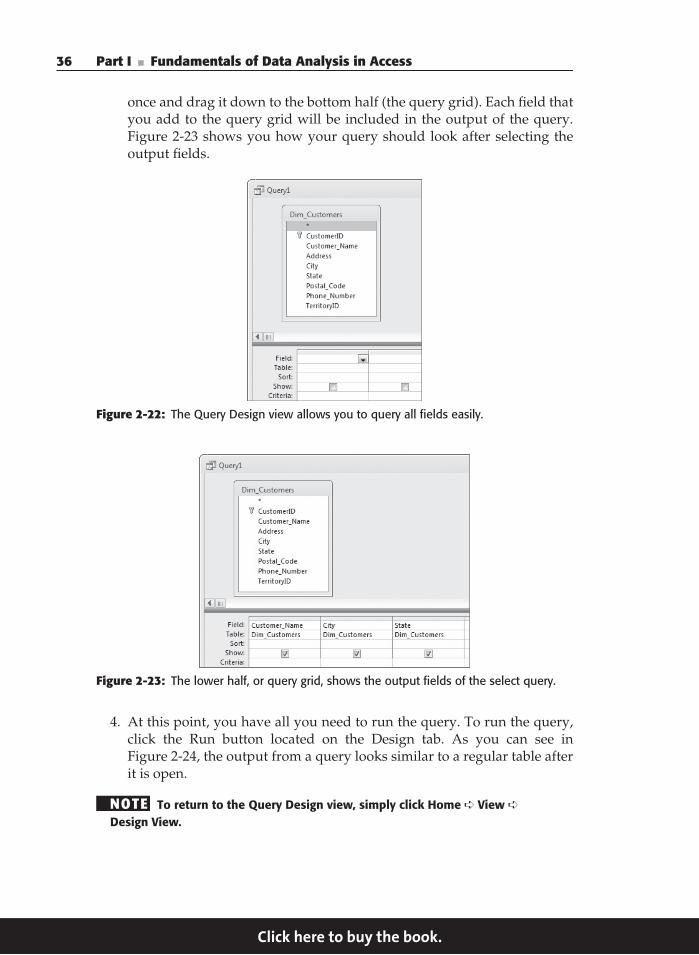
once and drag it down to the bottom half (the query grid). Each field thatyou add to the query grid will be included in the output of the query.Figure 2-23 shows you how your query should look after selecting theoutput fields.
Figure 2-22: The Query Design view allows you to query all fields easily.
Figure 2-23: The lower half, or query grid, shows the output fields of the select query.
4. At this point, you have all you need to run the query. To run the query,click the Run button located on the Design tab. As you can see inFigure 2-24, the output from a query looks similar to a regular table afterit is open.
NOTE To return to the Query Design view, simply click Home ➪ View ➪
Design View.
Click here to buy the book.
Chapter 2 ■ Access Basics 37
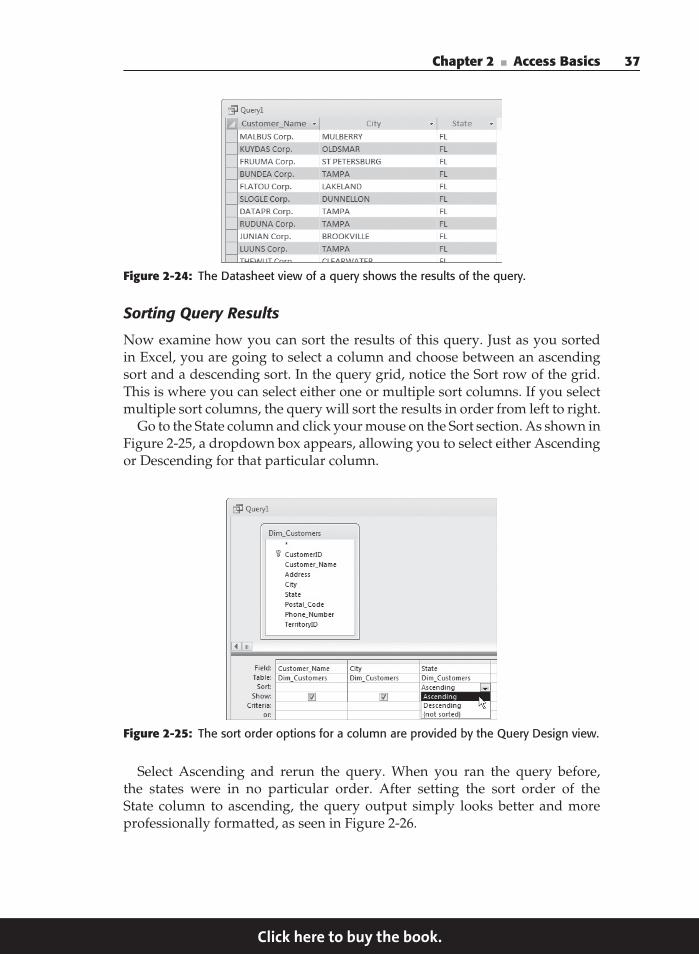
Figure 2-24: The Datasheet view of a query shows the results of the query.
Sorting Query Results
Now examine how you can sort the results of this query. Just as you sortedin Excel, you are going to select a column and choose between an ascendingsort and a descending sort. In the query grid, notice the Sort row of the grid.This is where you can select either one or multiple sort columns. If you selectmultiple sort columns, the query will sort the results in order from left to right.
Go to the State column and click your mouse on the Sort section. As shown inFigure 2-25, a dropdown box appears, allowing you to select either Ascendingor Descending for that particular column.
Figure 2-25: The sort order options for a column are provided by the Query Design view.
Select Ascending and rerun the query. When you ran the query before,the states were in no particular order. After setting the sort order of theState column to ascending, the query output simply looks better and moreprofessionally formatted, as seen in Figure 2-26.
Click here to buy the book.
38 Part I ■ Fundamentals of Data Analysis in Access
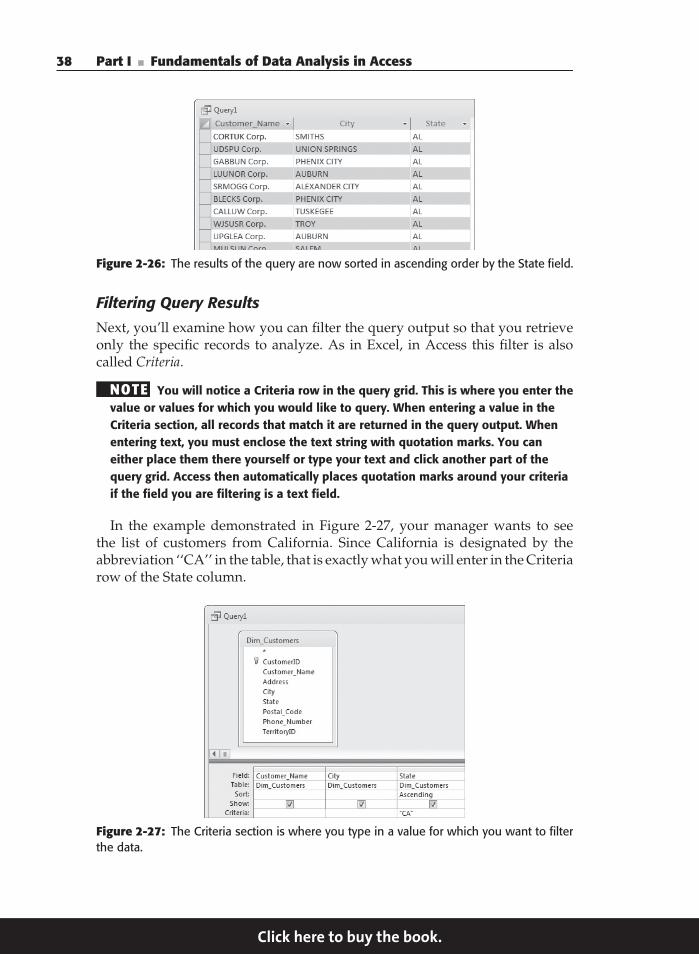
Figure 2-26: The results of the query are now sorted in ascending order by the State field.
Filtering Query Results
Next, you’ll examine how you can filter the query output so that you retrieveonly the specific records to analyze. As in Excel, in Access this filter is alsocalled Criteria.
NOTE You will notice a Criteria row in the query grid. This is where you enter thevalue or values for which you would like to query. When entering a value in theCriteria section, all records that match it are returned in the query output. Whenentering text, you must enclose the text string with quotation marks. You caneither place them there yourself or type your text and click another part of thequery grid. Access then automatically places quotation marks around your criteriaif the field you are filtering is a text field.
In the example demonstrated in Figure 2-27, your manager wants to seethe list of customers from California. Since California is designated by theabbreviation ‘‘CA’’ in the table, that is exactly what you will enter in the Criteriarow of the State column.
Figure 2-27: The Criteria section is where you type in a value for which you want to filterthe data.
Click here to buy the book.
Chapter 2 ■ Access Basics 39
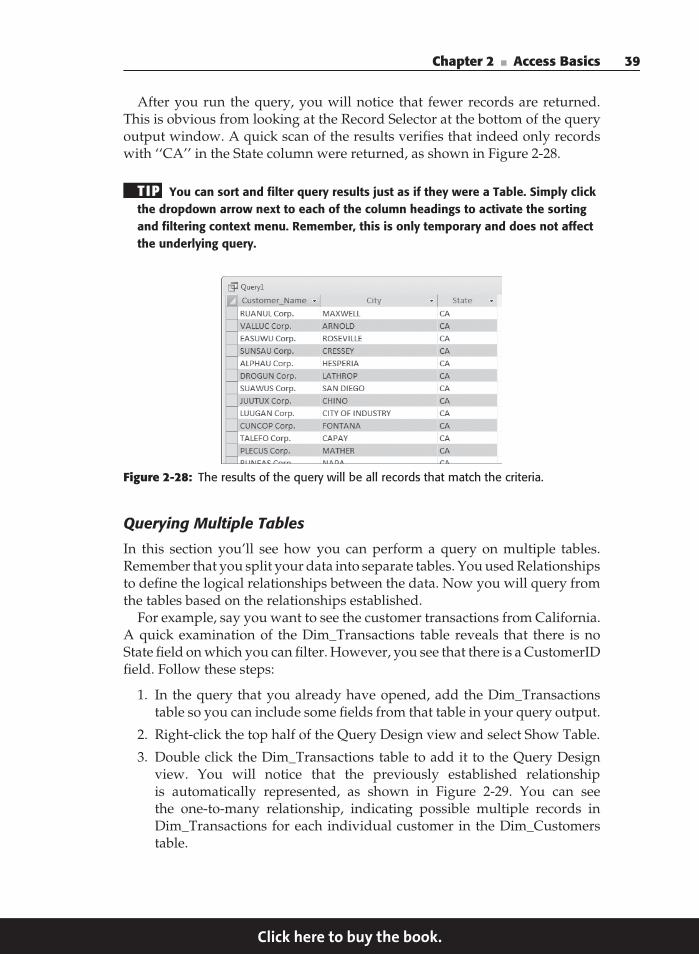
After you run the query, you will notice that fewer records are returned.This is obvious from looking at the Record Selector at the bottom of the queryoutput window. A quick scan of the results verifies that indeed only recordswith ‘‘CA’’ in the State column were returned, as shown in Figure 2-28.
TIP You can sort and filter query results just as if they were a Table. Simply clickthe dropdown arrow next to each of the column headings to activate the sortingand filtering context menu. Remember, this is only temporary and does not affectthe underlying query.
Figure 2-28: The results of the query will be all records that match the criteria.
Querying Multiple Tables
In this section you’ll see how you can perform a query on multiple tables.Remember that you split your data into separate tables. You used Relationshipsto define the logical relationships between the data. Now you will query fromthe tables based on the relationships established.
For example, say you want to see the customer transactions from California.A quick examination of the Dim_Transactions table reveals that there is noState field on which you can filter. However, you see that there is a CustomerIDfield. Follow these steps:
1. In the query that you already have opened, add the Dim_Transactionstable so you can include some fields from that table in your query output.
2. Right-click the top half of the Query Design view and select Show Table.
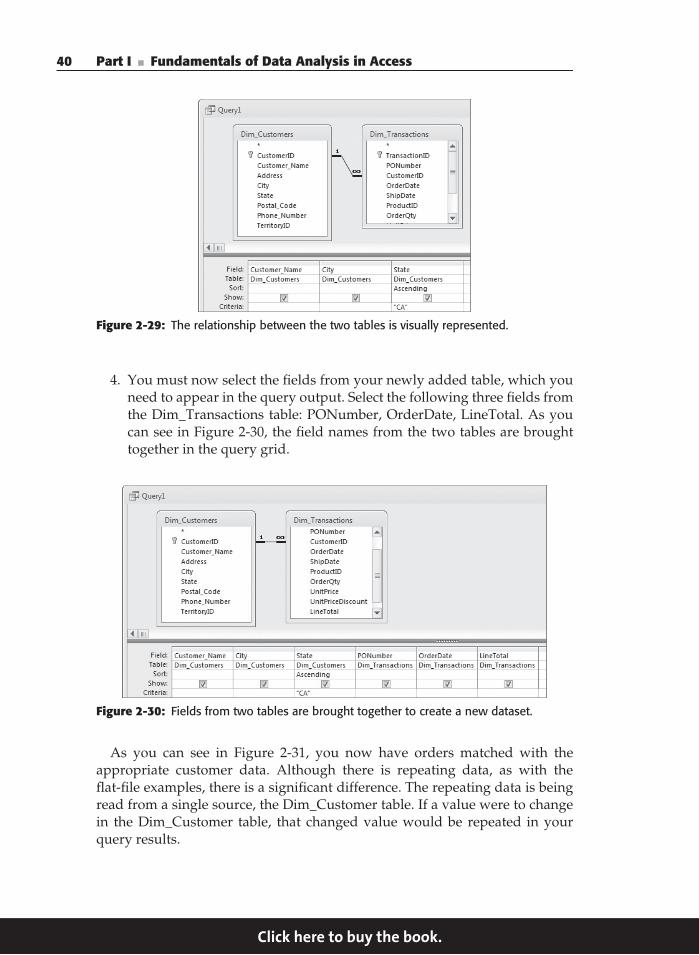
3. Double click the Dim_Transactions table to add it to the Query Designview. You will notice that the previously established relationshipis automatically represented, as shown in Figure 2-29. You can seethe one-to-many relationship, indicating possible multiple records inDim_Transactions for each individual customer in the Dim_Customerstable.
Click here to buy the book.
40 Part I ■ Fundamentals of Data Analysis in Access
Figure 2-29: The relationship between the two tables is visually represented.
4. You must now select the fields from your newly added table, which youneed to appear in the query output. Select the following three fields fromthe Dim_Transactions table: PONumber, OrderDate, LineTotal. As youcan see in Figure 2-30, the field names from the two tables are broughttogether in the query grid.
Figure 2-30: Fields from two tables are brought together to create a new dataset.
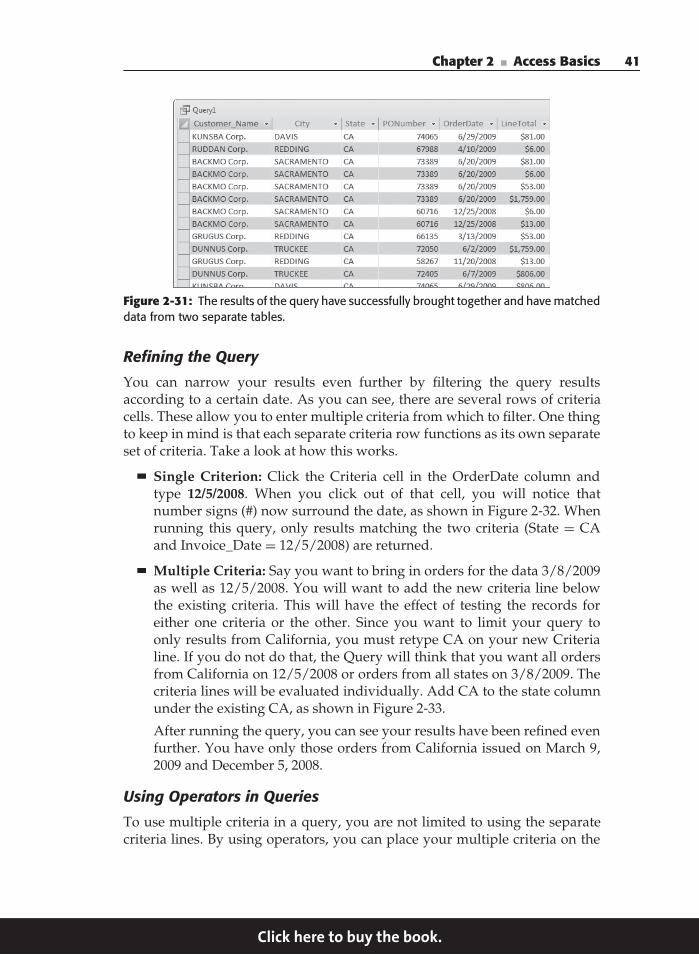
As you can see in Figure 2-31, you now have orders matched with theappropriate customer data. Although there is repeating data, as with theflat-file examples, there is a significant difference. The repeating data is beingread from a single source, the Dim_Customer table. If a value were to changein the Dim_Customer table, that changed value would be repeated in yourquery results.
Click here to buy the book.
Chapter 2 ■ Access Basics 41
Figure 2-31: The results of the query have successfully brought together and have matcheddata from two separate tables.
Refining the Query
You can narrow your results even further by filtering the query resultsaccording to a certain date. As you can see, there are several rows of criteriacells. These allow you to enter multiple criteria from which to filter. One thingto keep in mind is that each separate criteria row functions as its own separateset of criteria. Take a look at how this works.
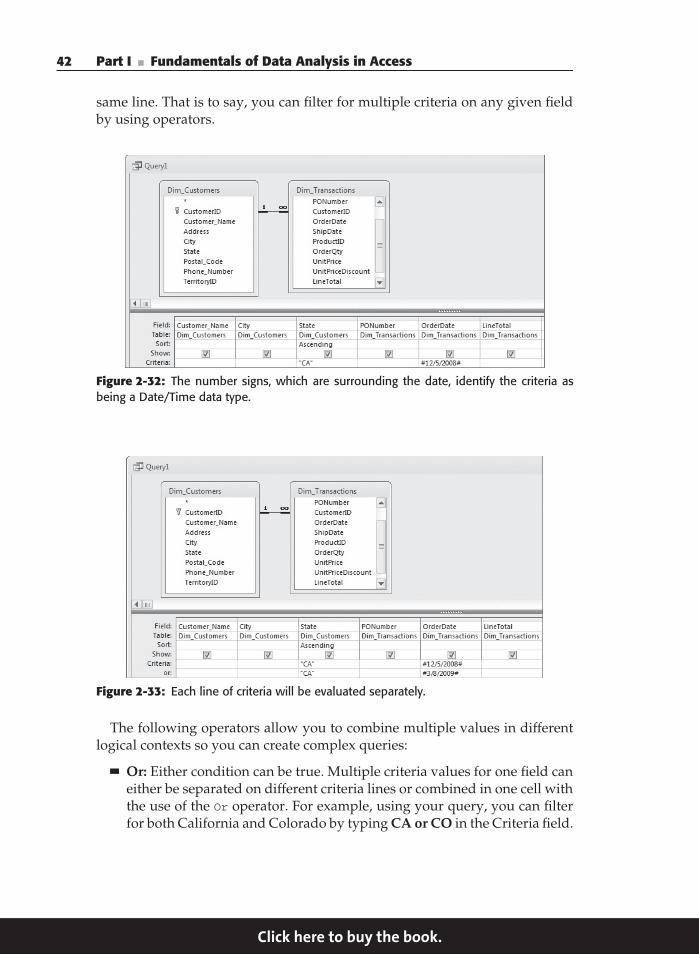
Single Criterion: Click the Criteria cell in the OrderDate column andtype 12/5/2008. When you click out of that cell, you will notice thatnumber signs (#) now surround the date, as shown in Figure 2-32. Whenrunning this query, only results matching the two criteria (State = CAand Invoice_Date = 12/5/2008) are returned.
Multiple Criteria: Say you want to bring in orders for the data 3/8/2009as well as 12/5/2008. You will want to add the new criteria line belowthe existing criteria. This will have the effect of testing the records foreither one criteria or the other. Since you want to limit your query toonly results from California, you must retype CA on your new Criterialine. If you do not do that, the Query will think that you want all ordersfrom California on 12/5/2008 or orders from all states on 3/8/2009. Thecriteria lines will be evaluated individually. Add CA to the state columnunder the existing CA, as shown in Figure 2-33.
After running the query, you can see your results have been refined evenfurther. You have only those orders from California issued on March 9,2009 and December 5, 2008.
Using Operators in Queries
To use multiple criteria in a query, you are not limited to using the separatecriteria lines. By using operators, you can place your multiple criteria on the
Click here to buy the book.
42 Part I ■ Fundamentals of Data Analysis in Access
same line. That is to say, you can filter for multiple criteria on any given fieldby using operators.
Figure 2-32: The number signs, which are surrounding the date, identify the criteria asbeing a Date/Time data type.
Figure 2-33: Each line of criteria will be evaluated separately.
The following operators allow you to combine multiple values in differentlogical contexts so you can create complex queries:
Or: Either condition can be true. Multiple criteria values for one field caneither be separated on different criteria lines or combined in one cell withthe use of the Or operator. For example, using your query, you can filterfor both California and Colorado by typing CA or CO in the Criteria field.
Click here to buy the book.
Chapter 2 ■ Access Basics 43
Between: Tests for a range of values. For example, using your query,you can filter for all orders between 4/20/2009 and 11/19/2009 insteadof testing just for those particular dates by typing Between #4/20/2009#AND #11/19/2009# in the Criteria field.
Like: Tests for string expressions matching a pattern. For example, youcan filter for all records with a customer ID that begins with the number147 by typing Like 147* in the Criteria field. The asterisk is the wild cardcharacter, which can signify any character or combination of characters.
In: Similar to Or. Tests for all records that have values, which arecontained in parentheses. For example, you can filter for both Californiaand Colorado by typing In (‘‘CA’’, ‘‘CO’’) in the Criteria field.
Not: Opposite of writing a value in Criteria. All records not matching thatvalue will be returned. For example, you can filter for all states exceptCalifornia by typing Not ‘‘CA’’ in the Criteria field.
Is Null: Filters all records that have the database value Null in that field.
=, <, >, <=, >=, and <>: The traditional mathematical operators allowyou to construct complex criteria for fields used in calculations.
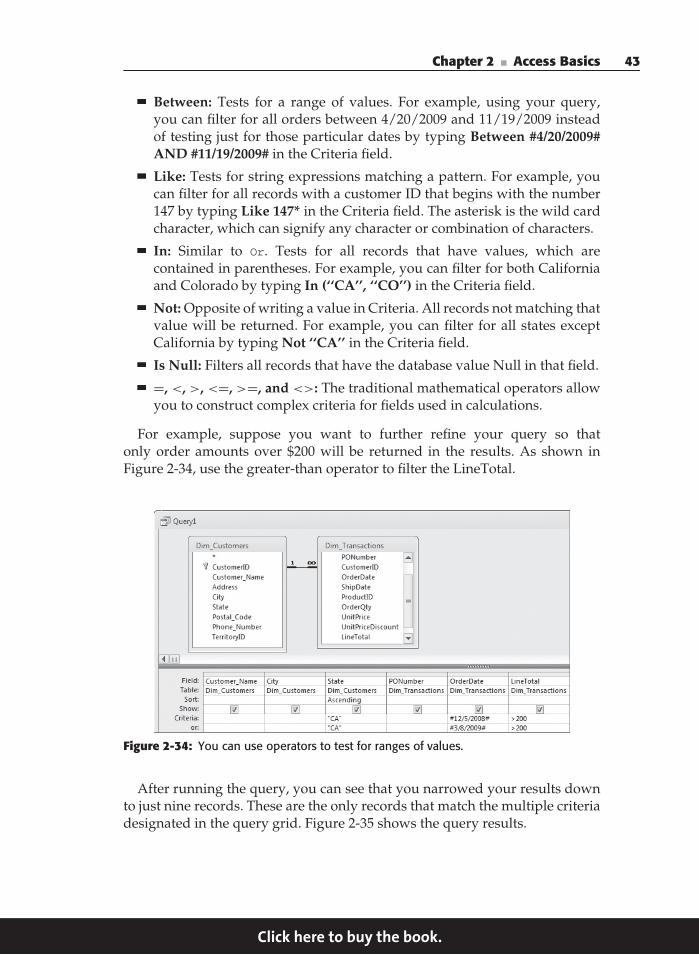
For example, suppose you want to further refine your query so thatonly order amounts over $200 will be returned in the results. As shown inFigure 2-34, use the greater-than operator to filter the LineTotal.
Figure 2-34: You can use operators to test for ranges of values.
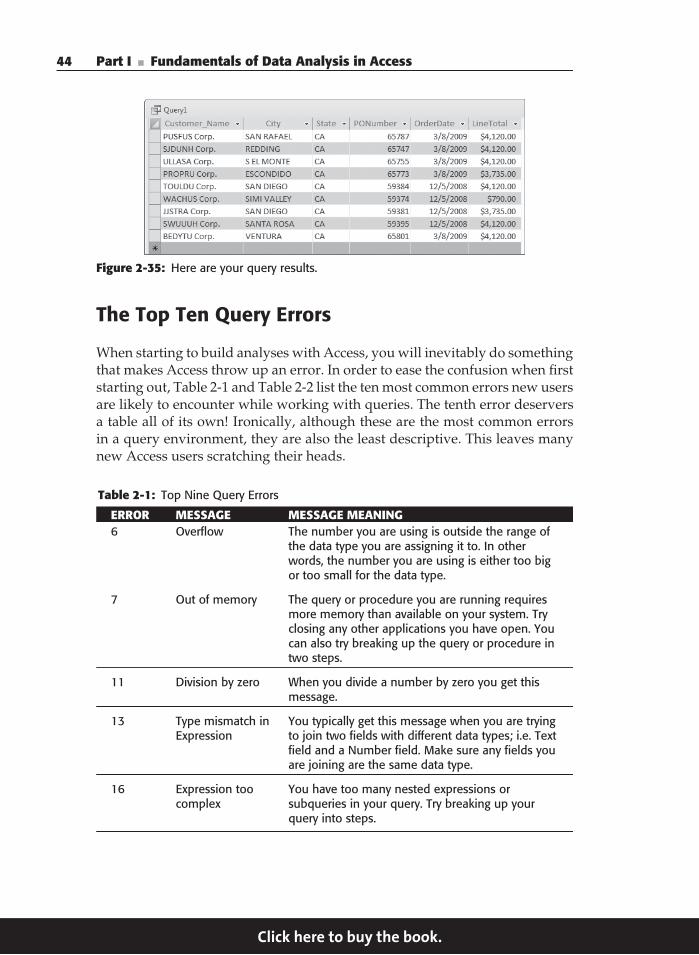
After running the query, you can see that you narrowed your results downto just nine records. These are the only records that match the multiple criteriadesignated in the query grid. Figure 2-35 shows the query results.
Click here to buy the book.
44 Part I ■ Fundamentals of Data Analysis in Access
Figure 2-35: Here are your query results.
The Top Ten Query Errors
When starting to build analyses with Access, you will inevitably do somethingthat makes Access throw up an error. In order to ease the confusion when firststarting out, Table 2-1 and Table 2-2 list the ten most common errors new usersare likely to encounter while working with queries. The tenth error deserversa table all of its own! Ironically, although these are the most common errorsin a query environment, they are also the least descriptive. This leaves manynew Access users scratching their heads.
Table 2-1: Top Nine Query Errors
ERROR MESSAGE MESSAGE MEANING6 Overflow The number you are using is outside the range of
the data type you are assigning it to. In otherwords, the number you are using is either too bigor too small for the data type.
7 Out of memory The query or procedure you are running requiresmore memory than available on your system. Tryclosing any other applications you have open. Youcan also try breaking up the query or procedure intwo steps.
11 Division by zero When you divide a number by zero you get thismessage.
13 Type mismatch inExpression
You typically get this message when you are tryingto join two fields with different data types; i.e. Textfield and a Number field. Make sure any fields youare joining are the same data type.
16 Expression toocomplex
You have too many nested expressions orsubqueries in your query. Try breaking up yourquery into steps.
Click here to buy the book.
Chapter 2 ■ Access Basics 45
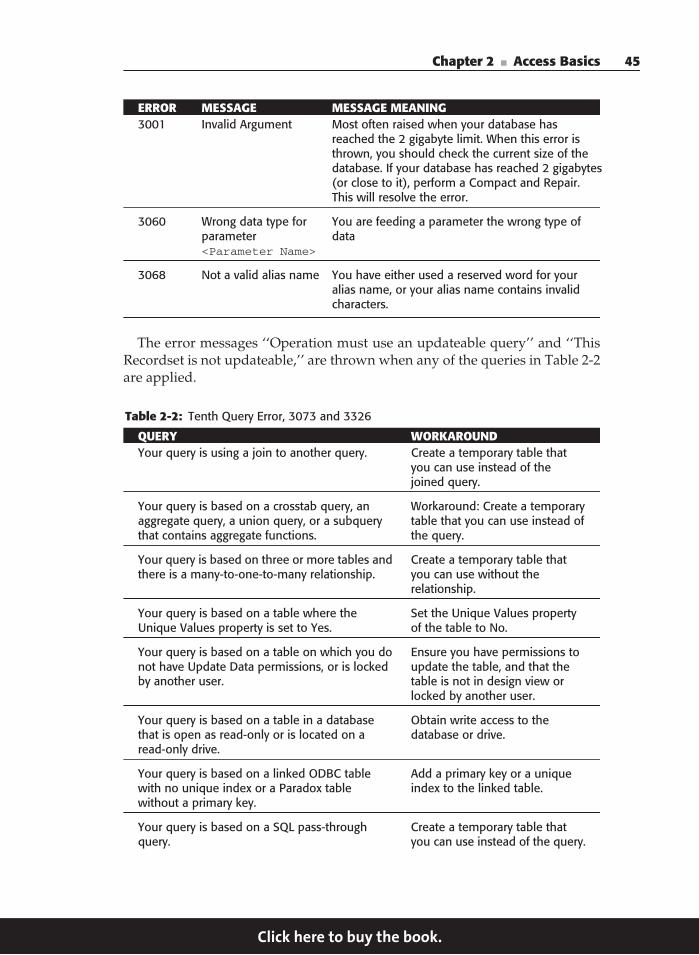
ERROR MESSAGE MESSAGE MEANING3001 Invalid Argument Most often raised when your database has
reached the 2 gigabyte limit. When this error isthrown, you should check the current size of thedatabase. If your database has reached 2 gigabytes(or close to it), perform a Compact and Repair.This will resolve the error.
3060 Wrong data type forparameter<Parameter Name>
You are feeding a parameter the wrong type ofdata
3068 Not a valid alias name You have either used a reserved word for youralias name, or your alias name contains invalidcharacters.
The error messages ‘‘Operation must use an updateable query’’ and ‘‘ThisRecordset is not updateable,’’ are thrown when any of the queries in Table 2-2are applied.
Table 2-2: Tenth Query Error, 3073 and 3326
QUERY WORKAROUNDYour query is using a join to another query. Create a temporary table that
you can use instead of thejoined query.
Your query is based on a crosstab query, anaggregate query, a union query, or a subquerythat contains aggregate functions.
Workaround: Create a temporarytable that you can use instead ofthe query.
Your query is based on three or more tables andthere is a many-to-one-to-many relationship.
Create a temporary table thatyou can use without therelationship.
Your query is based on a table where theUnique Values property is set to Yes.
Set the Unique Values propertyof the table to No.
Your query is based on a table on which you donot have Update Data permissions, or is lockedby another user.
Ensure you have permissions toupdate the table, and that thetable is not in design view orlocked by another user.
Your query is based on a table in a databasethat is open as read-only or is located on aread-only drive.
Obtain write access to thedatabase or drive.
Your query is based on a linked ODBC tablewith no unique index or a Paradox tablewithout a primary key.
Add a primary key or a uniqueindex to the linked table.
Your query is based on a SQL pass-throughquery.
Create a temporary table thatyou can use instead of the query.
Click here to buy the book.
46 Part I ■ Fundamentals of Data Analysis in Access
Summary
The fundamental tools in Access are tables and queries. A table is a collectionof data concerning a specific types of entities such as customers, branches,transactions, and products. Access allows you to build relationships betweenyour tables and enforce certain rules that guide these relationships. Thisreduces the chance for error and allows for easy analysis across multipletables.
A query is a question about the data that is stored in tables. The results ofa query are separate from the data. If the data in the table is changed and thequery run again, you would most often get different results. The most commonquery is the select query. With a select query, you can extract a dataset orindividual data items. You can also utilize the built-in operators to apply filtersand sorting to your queries.
Click here to buy the book.
Contents
Introduction xxix
Part I Fundamentals of Data Analysis in Access 1
Chapter 1 The Case for Data Analysis in Access 3Where Data Analysis with Excel Can Go Wrong 3
Scalability 4Transparency of Analytical Processes 5Separation of Data and Presentation 7
Deciding Whether to Use Access or Excel 8Size of Data 8Data Structure 9Data Evolution 9Functional Complexity 9Shared Processing 9
An Excel User’s Guide to Access: Don’t Panic! 10Tables 10Queries 11Reports 11Macros and VBA 12
Summary 12
Chapter 2 Access Basics 13Access Tables 13
Table Basics 13Opening a Table in the Datasheet View 14Identifying Important Table Elements 14
xv
Click here to buy the book.

xvi Contents
Opening a Table in the Design View 15Exploring Data Types 15Creating a Table from Scratch 17Working with Field Properties 19Setting Primary Keys 21
Importing Data into Access 22Importing Data from Text File 26
Linking an Excel Worksheet to Access 27Understanding the Relational Database Concept 28
Why Is This Concept Important? 28Excel and the Flat-File Format 29Splitting Data into Separate Tables 30Relationship Types 31
Query Basics 32What Is a Query? 33Creating Your First Select Query 34
Sorting Query Results 37Filtering Query Results 38Querying Multiple Tables 39Refining the Query 41Using Operators in Queries 41
The Top Ten Query Errors 44Summary 46
Chapter 3 Beyond Select Queries 47Aggregate Queries 47
Creating an Aggregate Query 47About Aggregate Functions 51
Group By 52Sum, Avg, Count, StDev, Var 53Min, Max, First, Last 54Expression, Where 54
Action Queries 56Why Use Action Queries? 57Make-Table Queries 57
Why Use a Make-Table Query? 57What Are the Hazards of Make-Table Queries? 57Creating a Make-Table Query 58
Delete Queries 60Why Use a Delete Query? 60What Are the Hazards of Delete Queries? 61Creating a Delete Query 61
Append Queries 64Why Use an Append Query? 64What Are the Hazards of Append Queries? 64Creating an Append Query 66
Click here to buy the book.

Contents xvii
Update Queries 70Why Use an Update Query? 70What Are the Hazards of Update Queries? 70Creating an Update Query 70A Word on Updatable Datasets 72
Crosstab Queries 73Using the Crosstab Query Wizard 74Creating a Crosstab Query Manually 79
Customizing Your Crosstab Queries 82Summary 85
Part II Basic Analysis Techniques 87
Chapter 4 Transforming Your Data with Access 89Finding and Removing Duplicate Records 89
Defining Duplicate Records 90Finding Duplicate Records 91Removing Duplicate Records 94
Common Transformation Tasks 96Filling in Blank Fields 96Concatenating 98
Concatenating Fields 98Augmenting Field Values with Your Own Text 99
Changing Case 100Removing Leading and Trailing Spaces from a String 103Finding and Replacing Specific Text 103Adding Your Own Text in Key Positions Within a String 105Parsing Strings Using Character Markers 109
Query 1 110Query 2 111
Summary 112
Chapter 5 Working with Calculations and Dates 113Using Calculations in Your Analysis 113
Common Calculation Scenarios 114Using Constants in Calculations 114Using Fields in Calculations 115Using the Results of Aggregation in Calculations 115Using the Results of One Calculation as an Expression in
Another 115Using a Calculation as an Argument in a Function 116
Using the Expression Builder to Construct Calculations 117Common Calculation Errors 122
Understanding the Order of Operator Precedence 122Watching Out for Null Values 123Watching the Syntax in Your Expressions 125
Click here to buy the book.

xviii Contents
Using Dates in Your Analysis 125Simple Date Calculations 126Advanced Analysis Using Functions 127
The Date Function 127The DateAdd Function 132Grouping Dates into Quarters 134The DateSerial Function 136
The New Calculated Data Type 137Summary 139
Chapter 6 Performing Conditional Analysis 141Using Parameter Queries 141
How Parameter Queries Work 143Ground Rules of Parameter Queries 143Working with Parameter Queries 144
Working with Multiple Parameter Conditions 144Combining Parameters with Operators 145Combining Parameters with Wildcards 145Using Parameters as Calculation Variables 146Using Parameters as Function Arguments 146
Using Conditional Functions 149The IIf Function 150
Using IIf to Avoid Mathematical Errors 150Using IIf to Save Time 152Nesting IIf Functions for Multiple Conditions 154Using IIf Functions to Create Crosstab Analyses 154
The Switch Function 156Comparing the IIf and Switch Functions 157
Summary 159
Part III Advanced Analysis Techniques 161
Chapter 7 Adding Dimension with Subqueries and DomainAggregate Functions 163Enhancing Your Analysis with Subqueries 164
Why Use Subqueries? 165Subquery Ground Rules 165Creating Subqueries Without Typing SQL Statements 165Using IN and NOT IN with Subqueries 168Using Subqueries with Comparison Operators 169Using Subqueries as Expressions 170Using Correlated Subqueries 170
Uncorrelated Subqueries 171Correlated Subqueries 171Using a Correlated Subquery as an Expression 173
Click here to buy the book.
Contents xix
Using Subqueries Within Action Queries 173A Subquery in a Make-Table Query 173A Subquery in an Append Query 173A Subquery in an Update Query 174A Subquery in a Delete Query 174
Domain Aggregate Functions 177Understanding the Different Domain Aggregate Functions 178Examining the Syntax of Domain Aggregate Functions 179
Using No Criteria 180Using Text Criteria 180Using Number Criteria 180Using Date Criteria 181
Using Domain Aggregate Functions 181Calculating the Percent of Total 182Creating a Running Count 183Using a Value from the Previous Record 184
Summary 186
Chapter 8 Running Descriptive Statistics in Access 189Basic Descriptive Statistics 190
Running Descriptive Statistics with Aggregate Queries 190Determining Rank, Mode, and Median 191
Ranking the Records in Your Dataset 191Getting the Mode of a Dataset 192Getting the Median of a Dataset 194
Pulling a Random Sampling from Your Dataset 196Advanced Descriptive Statistics 198
Calculating Percentile Ranking 198Determining the Quartile Standing of a Record 200Creating a Frequency Distribution 202
Summary 207
Chapter 9 Scheduling and Running Batch Analysis 209Introduction to Access Macros 210
Dealing with Access Macro Security 210The Quick Fix 212The Long-Term Fix 213
Creating Your First Macro 213Essential Macro Actions 216
Manipulating Forms, Queries, Reports, and Tables 216The Access Environment 216Executing Processes 217Outputting Data 217
Setting Up and Managing Batch Analysis 218Getting Organized 218
Click here to buy the book.
xx Contents
Using a Logical Naming Convention 218Using the Description Property 221
Setting Up a Basic Batch Analysis 222Building Smarter Macros 223
If. . .Then in Access 2010 Macros 224If. . .Then in Access 2007 Macros 225If. . .Then. . .Else in Access 2010 Macros 225If. . .Then. . .Else in Access 2007 Macros 227
Looping with Macros 228Scheduling Macros to Run Nightly 232
Using an AutoExec Macro to Schedule Tasks 232Using the Windows Task Scheduler 233
Using Command Lines to Schedule Tasks 238When to Use Command Lines to Schedule Tasks Instead
of AutoExec 239Scheduling a Macro to Run Using a Command Line 239
Summary 240
Chapter 10 Leveraging VBA to Enhance Data Analysis 243Creating and Using Custom Functions 244
Creating Your First Custom Function 245Creating a Custom Function that Accepts Arguments 248
Controlling Analytical Processes with Forms 251The Basics of Passing Data from a Form to a Query 251Enhancing Automation with Forms 255
Enumerating Through a Combo Box 258Processing Data Behind the Scenes 260
Processing Data with RunSQL Statements 261The Basics of the RunSQL Method 261Using RunSQL Statements 262
Advanced Techniques Using RunSQL Statements 263Suppressing Warning Messages 263Passing a SQL Statement as a Variable 264Passing User-Defined Parameters from a Form to Your
SQL Statement 264Summary 265
Part IV Reports, Dashboards, and Visualization in Access 267
Chapter 11 Presenting Data with Access Reports 269Access Report Basics 269
Creating Your First Report 269Viewing Your Report 271
Report View 271Layout View 273
Click here to buy the book.
Contents xxi
Design View 273Page Footer 275Report Footer 276
Creating and Modifying Grouped Reports 276Grouping 277Sorting and Totaling 279
Creating a Report from Scratch 283Creating Your Source Data 283Building the Report in Design View 285
Summary 289
Chapter 12 Using Pivot Tables and Pivot Charts in Access 291Pivot Tables in Access? 292The Anatomy of a Pivot Table 292
The Totals and Detail Area 293The Row Area 294The Column Area 294The Filter Area 294
Creating a Basic Pivot Table 295Creating an Advanced Pivot Table with Details 300Saving Your Pivot Table 302Sending Your Access Pivot Table to Excel 303Pivot Table Options 303
Expanding and Collapsing Fields 304Changing Field Captions 304Sorting Data 306Grouping Data 306Using Date Groupings 308Filter for Top and Bottom Records 310Adding a Calculated Total 311
Working with Pivot Charts in Access 313Pivot Chart Fundamentals 314
Data Area 314Series Area 314Category Area 314Filter Area 316
Creating a Basic Pivot Chart 316Formatting Your Pivot Chart 319
Summary 321
Chapter 13 Enhancing Queries and Reports with Visualizations 323Basic Visualization Techniques 323
Using Number Formatting Tricks to Enhance Reporting 324Using Conditional Formatting in Access 326
Click here to buy the book.
xxii Contents
Apply Conditional Formatting to a Field Based on itsOwn Value 327
Apply Conditional Formatting Based on anotherControl’s Value 329
Clearing Conditional Formatting 330Advanced Visualization Techniques 331
Enhancing Queries and Reports with Data Bars 331Introducing the STRING Function 331Extending Data Bars to Reports 334
Sprucing up Queries and Reports with Symbols 335Using Your Own Dashboard Graphics in Access 339
Storing External Graphics in an Access Table 339Using the Graphics Table 341Using Multiple Sets of Graphics 342
Summary 343
Part V Advanced Excel and Access Integration Techniques 345
Chapter 14 Getting Access Data into Excel 347The Different Methods for Importing Access Data 347
The Drag and Drop Method 347Using the Export Wizard from Access 348Using Get External Data from Excel 350Using MS Query 353
Starting MS Query 354Setting up Your Data Source 355Building Your Custom Data Pull 357
Summary 362
Chapter 15 Using VBA to Move Data between Excel and Access 365Understanding ADO Fundamentals 366
The Connection String 366Declaring a Recordset 368
Return Read Only Data from a Table or Query 368Return Updateable Data from a Table or Query 369
Writing Your First ADO Procedure 369Referencing the ADO Object Library 370Writing the Code 371Using the Code 373
Writing Your First ADO/SQL Data Extract 374Using Criteria in Your SQL Statements 376
Set Numeric Criteria 377Set Textual Criteria 377Set Date Criteria 377
Click here to buy the book.

Contents xxiii
Set Multiple Criteria 377Using the LIKE Operator with ADO 378
Common Scenarios Where VBA Can Help 380Query Data from an Excel Workbook 380Append Records to an Existing Excel Table 382Append Excel Records to an Existing Access Table 384Querying Text Files 386
Summary 387
Chapter 16 Exploring Excel and Access Automation 389Understanding the Concept of Binding 389
Early Binding 390Late Binding 390
Automating Excel from Access 391Creating Your First Excel Automation Procedure 391Automating Data Export to Excel 394
Sending one Recordset to Excel 394Sending Two Datasets to Two Different Tabs in the Same
Workbook 396Automating Excel Reports: Without Programming Excel 398Using Find and Replace to Adjust Macro-Generated Code 404Running an Excel Macro from Access 406Optimizing Macro-Generated Code 407
Removing Navigation Actions 408Deleting Code that Specifies Default Settings 408Cleaning Up Double Takes and Mistakes 409Temporarily Disabling Screen Updating 410
Automating Access from Excel 411Setting the Required References 411Running an Access Query from Excel 412Running Access Parameter Queries from Excel 413Running an Access Macro from Excel 418Opening an Access Report from Excel 419Opening an Access Form from Excel 419Compacting an Access Database from Excel 420
Summary 422
Chapter 17 Integrating Excel and Access with XML 423Why XML? 423Understanding XML 424
The XML Declaration 424Processing Instructions 425Comments 425
Click here to buy the book.
xxiv Contents
Elements 425The Root Element 426Attributes 427Namespaces 428
Creating a Simple Reporting Solution with XML 429Exporting XML Data from Access 429Utilize XML Data in Excel 432
Creating a Data Entry Process Using XML 434Creating the Data Entry Schema in Access 434Setting up the Data Entry Form in Excel 435Exporting Results from Excel to XML 436Getting the Results Back into Access 437
Summary 439
Chapter 18 Integrating Excel and Other Office Applications 441Integrating Excel with Microsoft Word 441
Creating a Dynamic Link to an Excel Table 442Linking an Excel Table to Word 442Preventing the Link from Automatically Updating 444
Getting Excel Data to a Word Document Using Automation 445Creating a Word Mail Merge Document 448Simulating the Word Mail Merge Function from Excel 452
Integrating Excel with PowerPoint 456Creating a PowerPoint Slide with a Title 456Copying a Range of Cells to a Presentation 458Sending All Excel Charts to the Presentation 460Converting a Workbook into a PowerPoint Presentation 462
Integrating Excel and Outlook 465Mailing the Active Workbook 465Mailing a Specific Range 466Mailing to All Email Addresses in Your Contact List 468Saving All Attachments in a Folder 470Saving Certain Attachments to a Folder 471
Summary 474
Part VI Appendixes 475
Appendix A Access VBA Fundamentals 477Covering the Basics in 10 Steps 477
Step 1: Creating a Standard Module 478Step 2: Creating a Function 478Step 3: Giving Your Function Purpose with a Procedure 479Step 4: Testing Your Function 480
Click here to buy the book.
Contents xxv
Step 5: Declaring a Variable 481Step 6: Assigning a Value to a Variable 481Step 7: Compiling Your Newly Created Function 482Step 8: Saving Your Newly Created Function 482Step 9: Running Your Function in a Macro 483Step 10: Running Your Function from a Form 484
Letting Access Teach You VBA 485
Appendix B Understanding and Using SQL 489Understanding Basic SQL 489
The SELECT Statement 491Selecting Specific Columns 491Selecting All Columns 492
The WHERE Clause 492Making Sense of Joins 493
Inner Joins 493Outer Joins 494
Getting Fancy with Advanced SQL Statements 495Expanding Your Search with the Like Operator 496Selecting Unique Values and Rows without Grouping 496Grouping and Aggregating with the GROUP BY Clause 498
The HAVING Clause 498Setting Sort Order with the ORDER BY Clause 499Creating Aliases with the AS Clause 499
Creating a Column Alias 499Creating a Table Alias 499
SELECT TOP and SELECT TOP PERCENT 500Top Values Queries Explained 500SELECT TOP 500SELECT TOP PERCENT 502
Performing Action Queries via SQL Statements 502Make-Table Queries Translated 502Append Queries Translated 503Update Queries Translated 503Delete Queries Translated 503
Creating Crosstabs with the TRANSFORM Statement 503Using SQL Specific Queries 504
Merging Datasets with the UNION Operator 504Creating a Table with the CREATE TABLE Statement 506Manipulating Columns with the ALTER TABLE Statement 506
Adding a Column with the ADD Clause 507Altering a Column with the ALTER COLUMN Clause 507Deleting a Column with the DROP COLUMN Clause 507Dynamically Adding Primary Keys with the ADD
CONSTRAINT Clause 508
Click here to buy the book.
xxvi Contents
Appendix C Query Performance, Database Corruption, and OtherThoughts 509Optimizing Query Performance 509
Understanding Access’s Query Optimizer 509Steps You Can Take to Optimize Query Performance 510
Normalizing Your Database Design 510Using Indexes on Appropriate Fields 510Optimizing by Improving Query Design 512Compacting and Repairing Your Database Regularly 513
Handling Database Corruption 513Signs and Symptoms of a Corrupted Database 514
Watching for Corruption in Seemingly Normal Databases 514Common Errors Associated with Database Corruption 515
Recovering a Corrupted Database 516Steps You Can Take to Prevent Database Corruption 517
Backing Up Your Database on a Regular Basis 517Compacting and Repairing Your Database on a Regular
Basis 518Avoiding Interruption of Service While Writing to Your
Database 518Never Working with a Database from Removable Media 519
Getting Help in Access 519Location Matters When Asking for Help 519Online Help Is Better than Offline Help 520Diversifying Your Knowledgebase with Online Resources 520
Appendix D Data Analyst’s Function Reference 521Abs 521Asc 522Atn 522Choose 522Chr 523Cos 523Date 523DateAdd 523DateDiff 524DatePart 526DateSerial 527DateValue 527Day 528DDB 528Domain Aggregate Functions 529Exp 531FormatCurrency 531
Click here to buy the book.
Contents xxvii
FormatDateTime 532FormatNumber 532FormatPercent 533FV 534Hour 535IIf 535InStr 535InStrRev 536IPmt 537IRR 537IsError 538IsNull 538IsNumeric 538LCase 539Left 539Len 539Log 540Mid 540Minute 540MIRR 541Month 541MonthName 542Now 542NPer 542NPV 543NZ 543Partition 544Pmt 544PPmt 545PV 546Rate 546Replace 547Right 548Rnd 548Round 549Second 549Sgn 550Sin 550SLN 550Space 551SQL Aggregate Functions 551Sqr 552Str 552
Click here to buy the book.
xxviii Contents
StrConv 553String 554StrReverse 554Switch 554SYD 555Tan 555Time 556TimeSerial 556TimeValue 556Trim, LTrim, RTrim 557TypeName 557UCase 558Val 559VarType 559Weekday 560WeekdayName 561Year 561
Index 563
Click here to buy the book.