the expected rate of credit losses on banks loan ... · the expected rate of credit losses on...
TRANSCRIPT

The Expected Rate of Credit Losses on Banks’ Loan Portfolios
Trevor Harris, Urooj Khan, and Doron Nissim
Columbia Business School
October, 2011
Preliminary – Please do not quote or distribute without permission
Abstract
This study develops a timely and unbiased measure of expected credit losses. The expected rate of credit losses (ExpectedRCL) is a linear combination of various credit risk-related measures disclosed by banks. ExpectedRCL performs substantially better than net charge-offs, realized credit losses, and fair value of loans in predicting credit losses, and reflects all the explanatory power of the credit loss-related information in these variables. It may therefore serve as a benchmark for loan yield in evaluating bank performance and value creation. Although banks have been disclosing fair value estimates for their loan portfolios since 1992, these estimates appear to perform relatively poorly in capturing expected credit losses. Investors also appear to not fully incorporate the expected credit losses in pricing bank stocks, as ExpectedRCL is negatively and significantly related to subsequent stock returns. The evidence provided by the study is also relevant for policy deliberation as standard setters contemplate revising existing rules relating to loss provisioning and requiring the recognition of some expected credit losses.

1
1. Introduction
Despite financial crises having occurred over centuries (Reinhart and Rogoff 2009),
measurement, reporting and analysis of the profitability and credit risk of banks remains
controversial. For most banks, lending is a primary source of value creation and risk. The
economic profitability of lending is determined by the yield charged relative to the cost of funds
lent and credit risk realized. The measurement and analysis difficulty arises, in part, because
loan yields are set based on expectations about uncertain future interest rates and credit risk
outcomes. Although, nominal interest income (or net interest income) incorporates a credit risk
component, current accounting rules do not allow recognition of any ex-ante credit risk as a
provision to offset the nominal yield, arguably because of the lack of reliability in measuring the
risk, and a perception that managers will bias their estimates to manage earnings. Currently,
banks use an incurred loss model to account for loan losses. Under the incurred loss model, a
bank can make a provision to reserve for losses only if it can document that a loss is probable
and it can be reasonably estimated. This issue is at the heart of the procyclicality debate in the
most recent financial crisis and has led accounting standard setters and regulators to revisit
current practice. John Dugan, U.S. Comptroller of the Currency, has argued for the incurred loss
model to be changed to allow provisions to be made in a timelier manner (OCC 2009). Standard
setters are currently deliberating implementing an expected loss model for loans that would
reflect, in loan loss provisions, any changes in expected future cash collections from loans,
including expected increases as well as decreases (IASB 2009).
Irrespective of the eventual policy decision, a question that arises is whether existing
credit-related measures and disclosures provided by banks can be used to better assess the risks
and profitability of banks loan portfolios. This is the primary question we focus on in this paper.

2
In particular, we attempt to develop a timely and unbiased measure of expected credit losses on
banks’ loan portfolios using publicly disclosed credit-related information about their loan
portfolios.
Currently, banks disclose average loan yield, loan duration, and the composition of the
loan portfolio, including the amount of nonperforming loans (NPLs). Each of these measures
provides some indication of credit quality. On an ongoing basis banks write-off loans that are
deemed to be uncollectible (charge-offs) and then periodically, when balance sheets are
prepared, they report an allowance for loan and lease losses (ALLL) that reflects a reserve
against period end loans. The ALLL is based on outstanding loan balances and presumably
NPLs, but by regulation banks can only use current patterns of incurred losses rather than an ex
ante notion of credit risk, when estimating the ALLL. The charge to income is termed a
provision for loan and lease losses (PLLL), and reflects both net loan charge-offs (NCOs) and
the change in ALLLs over the relevant period.
Current accounting principles in commercial and industrial companies require us to
match against revenue all relevant costs. This is at the heart of accrual accounting and the notion
of “core” or sustainable operating profits used in financial analysis. There is a potential analogy
in banks. A bank prices credit risk into the rate it charges borrowers on their loans, so for
appropriate matching and to reflect the “core” operating profitability the bank should reflect that
risk as an expense or contra-revenue charge1. In principle, the PLLL would reflect this portion
of risk and matching would be maintained. How well does PLLL achieve this? Experience in
credit crises and past research suggests that the answer is not too well. Research has shown that
PLLL and the related ALLL have some important limitations, including: (1) they can be used to
1 A simple analogy would be a warranty reserve. The reserve is created at the time of sale to reflect the expected costs that will be incurred so that the profitability of the product reflects the ex-ante measure of future costs too.
3
manipulate book value of equity and earnings (Beaver et al. 1989; Elliott et al. 1991; Griffin and
Wallach 1991; Beaver and Engel 1996; Bushman and Williams 2011), (2) they can contain
substantial measurement error, and (3) they are primarily backward looking as they reflect only
incurred losses, not expected losses , and (4) the ALLL only relates to the currently reported
loans and does not reflect activity during the entire accounting period. Given the concerns with
ALLL and PLLL, as measures of the charge for credit risk, the objective of this study is to
develop an improved, timely and unbiased measure of the expected credit losses using existing
measures and disclosures.
A common misconception is that the ALLL reflects all expected credit losses for the
portfolio of loans. Under current GAAP this is not the case; as the ALLL generally reflects
probable losses based on events that have incurred to that point rather than actual expected future
losses. A notable difference arises as expected credit risk appears as soon as a loan is extended
and not when the loss is finally identified as probable. The dilemma for policy-makers and
investors is whether there is any way to obtain objective evidence of expected credit losses. A
measure of expected credit losses is important not only for evaluating the credit quality of the
loan portfolio and the bank’s performance but also for the vexing issue of capital adequacy. If a
bank earns a relatively high nominal interest rate on its loan portfolio simply by taking on more
credit risk, and it is not expensing the higher expected rate of credit losses, profitability is
overstated. If capital ratios are not adjusted appropriately, there is likely to be a capital shortfall
once the extra credit risk materializes, especially if banks manage their capital balances to a
percentage of reported assets, as is often the case.
Regulators and policy makers have blamed the current loan loss provisioning rules for
accentuating capital pro-cyclicality (Bank for International Settlements 2008; Financial Stability

4
Forum 2009a; 2009b). Regulators argue that the current incurred-loss provisioning method
contributes to pro-cyclicality by delaying the recognition of expected losses up until economic
downturns – exactly when capital becomes more expensive or simply unavailable to weaker
institutions, thereby magnifying the impact of economic downturns (Basel Committee on
Banking Supervision 2000). On March 2, 2009, in a speech to the Institute of International
Bankers, the Comptroller of the Currency, John Dugan, remarked that the current loan loss
provisioning rules based on the incurred-loss model led to loan loss provisioning becoming pro-
cyclical and magnifying the impact of recent economic downturn.
The impact of not recognizing expected loan losses in a timely manner on bank capital is
further amplified by economic cycles. Under the current rules, during economic upswings, loan
loss provisions are low because few credit losses are identified (or “incurred”) while creditors
prosper. However, during downturns loan loss provisions increase because loan defaults are
incurred and more probable so the provisions catch up and are relatively high. Keeton (1999) and
Jimenez and Saurina (2005) show that an increase in loan growth during an economic upswing
leads to higher loan losses during the downturn suggesting that expected credit losses are under-
provisioned during the upswing. In the same vein, Laeven and Majnoni (2003) and Bikker and
Metzemakers (2005) document that the impact of economic cycles on banks’ capital is magnified
because banks delay provisioning for credit losses until cyclical downturns have already set in.
Banks and their regulators traditionally target capital levels with “excess” capital being
reinvested (with leverage) or returned to shareholders.
Given these criticisms of the incurred-loss model of loan loss provisioning, the Financial
Accounting Standards Board (FASB) and International Accounting Standards Board (IASB) are
currently contemplating requiring the recognition of some expected credit losses, but they are yet

5
to settle on the exact approach. An important objective and contribution of this study is to use
existing disclosures to develop an unbiased and timely metric of expected credit losses relevant
for policy deliberations. Further, to the extent that financial market participants depend on
accounting information in their capital allocation decisions, delayed and asymmetric recognition
of losses under the current rules potentially deprives the markets of timely information regarding
the value of bank assets (Barth and Landsman 2010). Our proposed measure of expected credit
losses mitigates the effects of delayed and asymmetric recognition of losses under the incurred
loss model by recognizing credit losses in an unbiased and a timelier manner. By validating an
objective measure of expected credit losses, the analysis in this paper can also contribute to the
ongoing debate of appropriate measures of risk-adjusted capital.
This study models an expected rate of credit losses (ExpectedRCL) as a linear
combination of several credit-related measures currently disclosed by banks. More specifically,
the information in reported credit losses, non-performing loans, average loan yield, duration of
the loan portfolio and composition of the loan portfolio is used to estimate the ExpectedRCL. To
mitigate the impact of discretionary managerial choices in recognizing loan losses (Beaver et al.
1989; Elliott et al. 1991; Bushman and Williams 2011), the study applies adjustments based on
theoretical considerations and empirical findings. The out-of-sample predictive accuracy of the
expected credit losses metric is evaluated based on its ability to predict actual next-year credit
losses as well as to explain management’s expectations of future credit losses embedded in the
disclosed fair value of loans. Finally, we examine whether investors fully incorporate the
information in the ExpectedRCL in pricing bank stocks.
We use accounting data from regulatory consolidated financial statements (FR Y9C
reports) for the period Q1:1996 through Q2:2012 to estimate our metric of expected rate of credit

6
losses. In our estimation model, the coefficients on the various credit-risk related variables have
the expected signs and are highly significant. The most significant explanatory variables include
current year NCOs, a measure of unexpected change in NPLs, and the level of NPLs. We also
estimate the model separately for the period preceding the subprime financial crisis (Q4:1996-
Q2:2007) and for the period since the financial crisis (Q3:2007-Q2:2012). The coefficients
generally have the same signs in both sub-periods but, as expected (Keeton 1999; Jimenez and
Suarina 2005), they almost all change significantly between the two sub-periods consistent with
greater credit loss implications since the beginning of the financial crisis.
In our out-of-sample prediction analyses, we find that ExpectedRCL performs well in
predicting credit losses. More specifically, ExpectedRCL performs substantially better than
NCOs or the realized rate of credit losses in predicting credit losses.2 Further, ExpectedRCL
reflects all the information in either of these two variables for predicting credit losses. Consistent
with the high significance of the estimated rate of credit losses in explaining realized credit
losses, the disclosed fair value of loans is negatively correlated with ExpectedRCL. However, the
disclosed fair value of loans does not add to the information contained in ExpectedRCL in
explaining realized credit losses. In contrast, ExpectedRCL contains substantial incremental
information relative to the fair values of loans in explaining realized credit losses. In the stock
return predictability analysis, we find that prices do not reflect the information in ExpectedRCL
in a timely manner. ExpectedRCL is negatively associated with future stock returns so investors
seem to underreact to the information in ExpectedRCL, especially when it is substantially
different from net charge offs.
2 We estimate the realized rate of credit losses by attempting to undo the discretion embedded in loan charge-offs. See section 3 for more details on the estimation of the realized rate of credit losses.

7
The failure of the disclosed fair value of loans to fully reflect publicly available
information about loan credit losses is disconcerting. Banks have been disclosing fair value
estimates for their loan portfolios since 1992, and yet these estimates appear to perform
relatively poorly in capturing expected credit losses. Consistent with our findings, Cantrell et al.
(2012) also document that fair values of loans do a poor job of predicting credit losses. They
find that, relative to fair value of loans, historical cost information is more useful at predicting
future net chargeoffs, non-performing loans, and bank failures.
These findings suggests that if standard setters change the incurred loss model toward the
recognition of expected losses, they should require banks to use relatively objective methods for
estimating credit losses and mandate extended, consistent and understandable credit-related
disclosures.
In addition to contributing to the current policy debates about measuring and reporting of
credit losses, this study is related to other research issues in accounting, banking and finance.
Prior studies examine the cross-sectional and time-series determinants of banks’ PLLL
timeliness, such as loan portfolio composition and market, contractual, and regulatory incentives
for bank managers to exercise discretion over LLPs (e.g., Liu and Ryan 1995; 2006). Laeven and
Majnoni (2003) provide empirical evidence of banks delaying provisioning for bad loans until
cyclical downturns have set in, thereby magnifying the impact of economic cycles on banks’
income and capital. Some recent studies examine the impact of timeliness of loan loss
provisioning on pro-cyclicality of bank lending (Beatty and Liao 2011), discipline and
monitoring of bank risk-taking (Bushman and Williams 2012), stock liquidity risk, bank tail-
risk, and the contribution to systemic risk (Bushman and Williams 2011). Bhat et al. (2012)
document that the different types of disclosures of credit risk modeling impacts the timeliness of

8
loan loss provisioning and pro-cyclicality of loan origination. Several studies have also used the
timeliness and estimation errors of banks’ loan loss provisioning as a proxy for their
transparency or disclosure quality (Bushman and Williams 2011; Ng and Rusticus 2011). This
study contributes to these literatures by developing a metric of expected credit losses that is more
timely and unbiased relative to the existing credit-risk related disclosures provided by banks.
The rest of the study proceeds as follows. Section 2 describes existing credit measures
and their limitations. Section 3 develops the methodology for estimating the expected rate of
credit losses. Section 4 discusses the sample selection procedures and sample data. The empirical
findings are presented in section 5, and section 6 concludes the paper.
2. Credit Quality Metrics
The primary disclosures relevant for evaluating the credit quality of banks’ loan
portfolios are the ALLL, the PLLL, loan charge-offs [LCOs], NPLs, average loan yield, and loan
composition. We discuss each of these metrics and their limitations in evaluating the credit risk
of banks’ loan portfolios next.
2.1 The allowance and provision for loan and lease losses
The reported ALLL represents management’s estimate of the amount of loans and leases
held for investment that the bank will be unable to collect, based on current information and
events as of the date of the financial statements. The allowance is netted against loans on the
balance sheet. No allowance is recognized for loans and leases held for sale because they are
reported at the lower of cost or fair value.

9
In a classical accrual (matching) model, the concept of a provision for loan and lease
losses is the charge against revenue for the credit risk that is embedded in the yield when it is
reported as revenue, plus any additional expected “excess” loss on an outstanding loan balance3.
The PLLL is calculated as the total of NCOs and the change in the ALLL during the period due
to operating activities (i.e., excluding changes due to non-operating activities such as business
combinations, divestitures, and foreign currency translation affects). As a result, PLLL includes
both a measure of current credit risk and any measurement errors in either the beginning or
ending ALLL. The PLLL is a major expense in most banks’ income statements.
While users of banks’ financial information often use the ALLL and PLLL as indicators
of credit risk or expected credit losses, these metrics have several important limitations. First,
both measures are highly discretionary, and research shows that they are often used by banks to
manage book value and earnings (e.g., Beaver et al. 1989; Elliott et al. 1991; Griffin and Wallach
1991, Beaver and Engel 1996; Bushman and Williams 2011). Banks can exercise discretion over
ALLL and PLLL to smooth earnings across business cycles, to adjust regulatory capital, or to
manage taxes (e.g., Moyer 1990; Scholes, Wilson, Wolfson 1990; Beatty, Chamberlain, and
Magliolo 1995; Collins, Shackelford, and Wahlen 1995; Ahmed, Takeda, Thomas 1999; Liu and
Ryan 2006). Second, even in the absence of intentional bias, the ALLL and PLLL often contain
substantial measurement error as they are based on subjective estimates. The relative magnitude
of the error is especially large for the provision, which is calculated indirectly based on the
change in the allowance and so reflects any measurement error in either the beginning or ending
balance of the allowance.4 Third, the ALLL and PLLL are supposed to reflect only incurred
3 The incremental provision would be for the portion of the expected loss that is not already captured in the yield being charged. This would presumably only arise after the initial loan is made. 4 For a similar argument with respect to the relative measurement error of balance sheet versus income statement securities’ gains and losses, see Barth 1994.

10
(probable) losses, not expected ones. “Under GAAP, the purpose of the ALLL is not to absorb
all of the risk in the loan portfolio, but to cover probable credit losses that have already been
incurred.”5 Fourth, the ALLL provides a snapshot at a point in time and it does not reflect
activity during the entire accounting period. It relates only to period end reported loans. Also, the
ALLL will vary as a portion of loans as a result of the composition of the loan portfolio itself as
well as due to the relative conservativeness of any charge-off policy, which impacts the loan
balances.
Consistent with the above limitations, research shows that the ALLL and PLLL provide
little or no incremental information relative to other credit risk measures—primarily NPLs—in
explaining bank share prices (e.g. Beaver et al 1989, Calomiris and Nissim 2012). Moreover, due
to the discretionary nature of the PLLL, in many cases loan loss provisions are positively rather
than negatively associated with bank stock returns and future cash flows (e.g., Beaver et al.
1989; Elliott et al. 1991; Griffin and Wallach 1991; Wahlen 1994; Liu and Ryan 1995; and
Beaver and Engel 1995).
2.2 Loan charge-offs
When a loan is deemed uncollectible, the loan balance is charged-off and the ALLL is
reduced by the same amount. LCOs minus recoveries of previously charged-off loans are known
as NCOs. NCOs do not directly affect the balance sheet or income statement, but they reduce the
ratio of the allowance to the gross book value of loans, which in turn may create pressure to
increase the provision (a relatively low allowance-to-loans ratio may imply an inadequate
allowance).
5 The Interagency Policy Statement on the Allowance for Loan and Lease Losses, issued by the federal financial institution regulatory agencies in December 2006 (http://www.fdic.gov/news/news/financial/2006/fil06105a.pdf).

11
LCOs are often considered to be less discretionary than the PLLL or the ALLL (Moyer
1990; Wahlen 1994; Collins, Shackelford and Wahlen 1995; Beaver and Engel 1996), primarily
because banks are required to follow policies under which consumer loans are charged-off when
they become a certain number of days delinquent (see Appendix A). However, banks still have
some flexibility in implementing the guidance; for example, they are allowed to use more
conservative charge-off policies. Moreover, for collateral-dependent loans and for most
commercial and industrial loans, banks have substantial discretion in measuring the amount of
loss to be charged-off. Prior studies have demonstrated discretionary charge-off behavior by
banks (e.g., Liu and Ryan 2006).
One approach to mitigate the impact of managerial discretion on LCOs is to measure
charge-offs net of recoveries. NCOs may be less sensitive than gross charge-offs to variation in
policies and implementation since firms that use conservative charge-off policies have large
recoveries, which offset previously inflated charge-offs. However, the timing of the recovery
relative to the charge-off could distort the utility of NCOs as a measure of the cost of credit
quality that is needed to match against revenue for measuring the economic profitability of a
bank. NCOs will also be a poor indicator of credit losses when banks delay charging-off loans to
avoid a decline in the ALLL and a resulting increase in the PLLL; as may have occurred in the
recent financial crisis (Calomiris and Nissim 2012; Vyas 2011). Stated another way, NCOs are
only expected to work well when the size and credit quality of the loan portfolio is relatively
stable over time and charge-off policies are implemented consistently. Another issue with net
loan charge-offs is that they can be relatively untimely; especially for large, heterogeneous loans
for which charge-off decisions are made loan by loan, as in commercial loans. The lack of
timeliness of NCOs is amplified when economic conditions are changing as at the beginning of

12
an economic downturn NCOs typically remain low for a while even though credit risk is rising.
The opposite is true at the beginning of an economic upturn (Ryan 2007).
2.3 Nonperforming loans
NPLs are usually defined as the total of nonaccrual loans and restructured (troubled)
loans. Nonaccrual loans are loans on which interest accruals have been discontinued due to
borrowers’ financial difficulties. Typically, an unsecured loan is placed on non-accrual status
once interest payments are 90 days past due, but this is not a requirement. A loan is considered
restructured when the bank grants a concession to the debtor that changes the terms of the loan to
prevent it from being charged-off so long as the debtor can fulfill the new terms.
NPLs are considered relatively nondiscretionary (Beaver et al. 1989; Griffin and Wallach
1991) and accordingly have served as instruments in previous studies to partition other measures
of credit quality into discretionary and nondiscretionary components (Wahlen, 1994; Beaver and
Engel 1996; Collins, Shackelford and Wahlen 1995). Beaver et al (1989) indicate that although
nonaccrual and restructured loans are relatively nondiscretionary, their measurement does
involve judgments that vary across banks6. Banks differ in the delinquency periods that trigger
non-accrual classification, and some banks recast loan terms to avoid delinquency classification,
a practice referred to as “evergreening”. In addition, firms that employ relatively conservative
charge-off policies have relatively lower NPL levels since they tend to remove large portions of
problem loans from their books, and NPLs relate to reported loans only.
Even if all banks were using identical NPL classification and charge-offs policies, NPL
may not be fully comparable in the cross-section. Loan composition varies considerably across 6 For example, in its 2007 Annual Report, CapitalSouth Bancorp states, “Anticipating an extended downturn in the real estate market, we took a more aggressive approach in determining which loans were put on nonaccrual status during 2007.” page 42.

13
banks, and there are differences in NPL classification criteria across loan categories. Relatedly,
the likelihood of default and the expected loss given default vary substantially across categories
of NPLs, for example because of collateral such as guarantees by the U.S. government or its
agencies (Araten et al. 2004). Some of these shortcomings can be mitigated by “measuring”
NPLs as accruing loans that are delinquent by at least 90 days excluding the portion guaranteed
or otherwise covered by the U.S. government or its agencies. However, this would still not
eliminate the issue of loans with other collateral and different loss given default rates.
As we have said, in assessing a bank’s economic profitability, a measure of credit quality
should be matched against the income generated. So even if the above mentioned shortcomings
of NPLs are reduced, NPLs may still not fully capture differences in loans’ credit quality across
banks. One reason is that NPLs ignore loans written off or paid off in a period. Even more
importantly, NPLs reflect loans that have proven to be problematic, not those that are expected to
be problematic because credit risk has been taken and this risk is reflected in the interest rate
charged.
2.4 Loan yield
Given that a primary determinant of the interest rate that banks charge on loans is the expected
rate of credit losses, the (tax-equivalent7) average interest rate on the loan portfolio can be used
as an (imperfect) indicator of the expected rate of credit losses at loan origination. Measurement
error in this credit quality proxy results from two sources. First, the loans’ yield is affected by
additional factors besides the expected rate of credit losses, including the macroeconomic and
interest rate environment, loan duration, interest rate characteristics (e.g., fixed versus variable or
7 We gross up the interest rate on tax-exempt loans based on the disclosures provided. However, this is generally immaterial.

14
hybrid rate), and embedded options (e.g., prepayment penalties, interest rate floors or ceiling).8
Second, the expected rate of credit losses on existing loans changes over time, while their yield
remains unchanged or floats with market rates.
2.5 Loan Duration
Loan duration is likely to contain relevant information about the expected rate of credit
losses for at least two reasons. Banks are often more reluctant to extend long-term credit to high
credit risk borrowers or for unsecured lending. Therefore, the expected rate of credit losses is
likely to be negatively related to loan maturity. The second effect is related to the inclusion of the
loans’ yield variable. Holding credit risk constant, loans’ yield typically increases with loan
duration due to the liquidity premium. Thus, when loan duration is relatively low, the same loan
yield implies a relatively high rate of expected credit losses. Unlike the previous effect, however,
this indirect effect reverses when the term-structure is inverted.
2.6 Loan composition
Banks’ loan portfolios consist primarily of real estate loans (the largest group),
commercial and industrial (C&I) loans, and consumer loans. Other loans include loans to
depository institutions, loans to farmers, loans to foreign governments and official institutions,
loans to non-depository financial institutions, and lease financing receivables. The actual and
expected rate of credit losses vary substantially across as well as within these categories (Nissim
and Penman 2007). Moreover, the predictability of credit losses also varies across loan
categories, with losses on small or infrequently renegotiated loans such as consumer loans being
more predictable than losses on large and frequently renegotiated loans such as foreign and
commercial loans (Liu and Ryan 1995). Credit losses on individually small and homogenous
loans (e.g., credit card receivables and other consumer loans) are usually statistically estimated
8 Additionally, loan yield as well as credit risk is also impacted by the type of collateral and guarantees, if any.
15
based on historical data and past experiences. Thus, the ALLL recorded for such loans should be
reasonably close to the expected credit losses on these loans based on historical data, subject to
there being more variability at different stages of a credit cycle. On the other hand, credit losses
on individually large and heterogeneous loans (e.g., C&I loans and commercial real estate loans)
are typically evaluated on a loan-by-loan basis by loan officers. SFAS No. 5’s criteria for
recognizing credit losses for such loans often are not met until shortly before this type of loan
defaults (Ryan 2007). More discretion exists in estimating credit losses for large and
heterogeneous loans and empirical research finds that loan officers’ incentives are to hide loan
default on the loans they originated (Udell 1989; Berger and Udell 2002).
Historically, the rate of credit losses was lowest for real estate loans and highest for
consumer loans, especially credit card loans. However, this was largely as a result of the quality
of the underlying collateral relative to the loans being made. During the 2005 through 2007
period when loans were being made on inflated real estate prices, the poor quality of the real
estate collateral relative to the size of loans being made against it (including the second liens)
realistically added to the credit risk, rather than mitigated it. So during the financial crisis, banks
incurred large credit losses on real estate loans, especially closed-end loans secured by 1-4
family residential properties with junior liens.
The substantial differences in credit losses across the loan categories, and the variation in
loan composition across banks, suggest that one should consider loan composition when
estimating expected credit losses. For example, large banks tend to hold relatively high
proportions of consumer and C&I loans and therefore have relatively high credit loss rates
(Nissim and Penman 2007). Yet, the differences in the sensitivity of the various loan categories

16
to changes in macro conditions suggest that loan composition effects should be allowed to vary
over time.
3. Methodology
Given current disclosures, we specify the following model for the expected rate of credit
losses for period t (����������) based on information available at time t-1:
���������� =∝�+∝� ������������ +∝� ������������ +∝� ������������
+∝� ���������������� +∝ ���������������� +∝! ����������������� + "��� (1)
Where RealizedRCL is the realized rate of credit losses, measured relative to the average balance
of loans during the period. NPL is non-performing loans, defined as the total of non-accruing
loans, restructured loans, and accruing 90+ days delinquent loans. LoansYield is the ratio of tax-
equivalent interest income on loans to the average balance of loans. FloatLoanRatio is an
estimate of the proportion of loans that reprice or mature within one year, a proxy for loan
duration9. The intercept (∝�) and the two loan composition variables capture the average effects
of the three primary loan categories.10,11 "��� represents the net effect of all other relevant
information at time t-1 for the prediction of the expected rate of credit losses in period t that is
omitted from Equation (1). 9 Specifically, we estimate the proportion of floating rate loans using the ratio of floating rate loans and securities to the total of loans and securities. We estimate floating rate loans and securities by subtracting the total of (1) “interest-bearing balances due from depository institutions,” and (2) “federal funds sold and securities purchased under agreements to resell” from “earning assets that are repricable within one year or mature within one year.”
10 As discussed in Sections 2, loan portfolios also include additional smaller categories which are generally more comparable to C&I loans than to real estate or consumer loans.
11 While using loan composition information in measuring expected credit loss rates is likely to improve the accuracy of prediction, it does have important limitations. First, there are many types of loan within each of the three major categories that we include in our estimation (real estate, consumer, and C&I), and considering the sub-categories would introduce too many parameters for our empirical analysis. Second, loans of the same type may still have different expected loss rates. For example, credit losses generally increase with bank size, with loan composition accounting for only a portion of that correlation (Nissim and Penman 2007). It appears that within each loan category, large banks have bigger losses presumably because they are willing to take on greater ex ante risk without fear of bankruptcy.

17
Equation (1) is not directly estimable because the expected rate of credit losses (the
measure we are aiming to estimate) is unobservable. However, with unbiased expectations, the
difference between the realized and expected rates of credit losses should be unpredictable
“white noise”:
���������� = ���������� + "�#$% (2)
Thus, model (1) can be re-expressed by substituting Equation (2) into Equation (1):
���������� =∝�+∝� ������������ +∝� ������������ +∝� ������������
+∝� ���������������� +∝ ���������������� +∝! ����������������� + "�& (3)
Where "�& = "��� + "�#$%. Of course, ���������� can only be observed after the end of period
t and is yet to be precisely defined.
To measure the realized rate of credit losses, we start with net charge-offs during the
period. As discussed in Section 2.2, banks exercise some discretion in recognizing charge-offs.
Therefore, to derive an unbiased estimate of credit losses we need to estimate and “undo” the
discretionary component of LCOs. If there is no bias in LCOs then we expect most loans that are
eventually charged-off to be first classified as nonperforming, however not all NPLs will become
LCOs. A biased LCO policy will impact the level of loans and the NPLs. We use this logic to
estimate an expected portion of LCOs. Specifically, we estimate an unexpected change in
nonperforming loans during a period and use a fraction of this to estimate the discretionary
charge-offs (with a negative relation). The fraction we use also is intended to capture an
unexpected change in NPLs that arises for other reasons and as stated not all NPLs end up being
written off.

18
More specifically, to estimate the unexpected change in NPLs, we recognize that when
the credit quality of loans is relatively stable, changes in NPLs should be due to changes in the
size of the loan portfolios. Thus, any increase in NPLs that cannot be attributed to a change in the
size of the loan portfolio suggests that either the credit quality of the loan portfolio has
deteriorated during the period or the bank has misstated NCO. Either way, to derive a more
representative measure of realized credit loss we need to adjust current NCO for a portion of the
unexplained change in NPLs. To do so, we start by estimating the unexpected change in NPLs
during period t (∆���()*+,)as:
∆���()*+, = ��� − ����� × ������������ (4)
and specify the realized rate of credit losses as:
���������� = �1� + 2∆���()*+,34������ = �1�34������ + 2 ∆���()*+,34������ (5)
where NCO is Net Charge-Offs; 2 is a parameter to be estimated, that represents the credit loss
equivalent of a dollar of unexpected change in NPLs; 2∆���()*+, which is an estimate of
discretionary loan charge-offs; and AveLoans is the average balance of loans during the period.
Using Equation (5), Equation (3) can be re-expressed as follows:
�1�34������ =∝�+∝� �1���34�������� +∝� 2 ∆�����()*+,34�������� − 2 ∆���()*+,34������
+∝� ������������ +∝� ������������ +∝� ����������������
+∝ ���������������� +∝! ����������������� + "�& (6)
Equation (6) is estimable because after period t all the variables are observable, including
∆56%789:;<=>*%?@)A7 . However, OLS estimation would result in biased and inconsistent estimates, because

19
∆56%789:;<=>*%?@)A7 is likely to be strongly positively correlated with "�&. This follows because unexpected
shocks to credit quality are likely to affect both NPLs and realized credit losses. Fortunately,
consistent estimates of the parameters can still be derived by redefining the intercept and
disturbance of Equation (6) as follows:
∝�∗=∝�− 2 ∆���()*+,34������CCCCCCCCCCCCCC
(7)
"�∗ = "�& − 2 D∆���()*+,34������ −∆���()*+,34������CCCCCCCCCCCCCCE
(8)
Where ∆56%789:;<=>*%?@)A7CCCCCCCCCCC
is the cross-sectional average of ∆56%789:;<=>*%?@)A7 , and estimating the following model:
�1�34������ =∝�∗+∝� �1���34�������� +∝� 2 ∆�����()*+,34��������
+∝� ������������ +∝� ������������ +∝� ����������������
+∝ ���������������� +∝! ����������������� + "�∗ (9)
Equation (9) satisfies the OLS assumptions because, by definition, unexpected shocks to
NPL are uncorrelated with time t-1 information, as measured by the explanatory variables. The
adjustment to the intercept is required because in any given period the average credit loss shock
across all banks is not likely to be zero. However, because this adjustment is assumed to be
constant in the cross-section, it does not affect the cross-sectional differences in the estimated
rate of credit losses across banks (on which we focus).
Each quarter during the sample period, we estimate Equation (9) using all available
observations and then use Equation (7) to estimate the intercept, ∝�. We next use the estimated

20
parameters and the current values of the explanatory variables to estimate the expected rate of
credit losses for the next year (����������&�F ):
����������&�F =∝�+∝� �1�34������ +∝� 2 ∆���()*+,34������ +∝� �������� +∝� ���������� +∝� ��������������
+∝ ������������ +∝! ������������� (10)
After estimating the expected rate of credit losses, we evaluate its ability to predict realized
credit losses and compare it to alternative credit risk measures. For a sub-sample with available
information, we also examine whether the estimated expected rate of credit losses helps explain
the disclosed fair value of loans, and whether it contains all the credit-related information
contained in the disclosed fair value of loans as well as incremental information. Finally, we
examine whether investors incorporate all the information in ExpectedRCL in pricing bank
stocks.
4. Sample and Data
We extract accounting data from regulatory consolidated financial statements (FR Y-9C
reports) that BHCs submitted to the Federal Reserve System for the period Q1:1996-Q2:2012.
Under the Bank Holding Company Act, BHCs with total consolidated assets above a certain
threshold amount, or that satisfy certain other conditions (e.g., have public debt), are required to
file the FR Y-9C report on a quarterly basis. The asset-size threshold for filing the FR Y-9C
report was $150 million through the fourth quarter of 2005, after which it was increased to $500
million. To make the sample comparable over time, we delete observations with total assets less
than $500 million in March 2006 prices.

21
FR Y-9C reports contain a uniform and detailed calendar year-to-date income statement,
an end-of-quarter balance sheet, and supplementary information. These data become available
for all domestic BHCs approximately two months after the end of each calendar quarter, and are
made available for download by the Federal Reserve.12 To create our sample, we downloaded
these files and merged them with the quarterly COMPUSTAT files and CRSP files to obtain
market value and return data.13
We start the sample period in 1996 because information required for measuring the FR
Y-9C variables is unavailable for earlier periods. We measure all income statement quantities
combining the trailing four quarters of data to eliminate the effects of seasonality and to smooth
out short-term shocks.14 Thus, the sample includes 63 quarters of data, Q4:1996 through
Q2:2012. To mitigate the impact of outliers, we trim extreme values of each of the variables.15
Summary statistics from the distributions of the variables are provided in Table 1. For our
sample, the average (median) ALLL is 1.54% (1.37%) of gross loans held for investment. The
ratio of PLLL to average gross loans has a mean (median) of 0.65 (0.37) percent. The average
(median) NCOs as a percentage of average gross loans equals 0.51 (0.25). On average, 1.65% of
gross loans are classified as NPLs and 0.22% of gross loans are estimated to be unexpected
12 FR Y-9C reports are available at http://chicagofed.org/applications/bhc_data/bhcdata_index.cfm.
13 We linked the FR Y-9C data with the CRSP and COMPUSTAT data using a dataset that is provided by the federal reserve bank of New York (http://www.newyorkfed.org/research/banking_research/datasets.html).
14 Seasonality affects quarterly data for accounting as well as economic reasons. For example, Liu et al. (1997) find that loan provisions are often delayed to the fourth fiscal quarter when the audit occurs.
15 Extreme values of the variables were identified using the following procedure. For each variable, we calculated the 5st and 95th percentiles of the empirical distribution (P5 and P95 respectively) and trimmed observations outside the following range: P1 – 1 × (P95 – P5) to P95 + 1 × (P95 – P5). For normally distributed variables, this range covers approximately 4.95 standard deviations from the mean in each direction (= 1.65 + 1 × (1.65 - (-1.65)), which is more than 99.99% of the observations. For variables with relatively few outliers, the percentage of retained observations is also very high (often 100%). We repeated all the analyses using alternative outlier filters and estimation methodologies, and confirmed the robustness of the findings.

22
NPLs. The average loan in our sample has a yield of 7.31% and the median loan yield is 7.11
percent.
Turning to loan composition, real estate loans constitute about 70% of loans on average,
with commercial and industrial loans a distant second at 16%. Consumer loans on average
account for less than 8% of loan portfolios, and all other loans are less than 5%. The variability
of the proportion of “other loans” across the observations is small relative to the other loan
categories, suggesting that the sum of the three explicit loan composition ratios—real estate,
commercial and industrial, and consumer—has very low variability. Therefore, to mitigate
multicollinearity, only two of the proportions are included in the regressions.
Table 2 presents descriptive statistics from the distributions of the variables for two sub-
periods – (1) the period preceding the subprime financial crisis (Q4:1996-Q2:2007), and (2) the
period following the onset of the subprime financial crisis (Q3:2007-Q2:2012). The mean values
of the explanatory variables have all changed significantly since the beginning of the financial
crisis. In particular, each of the credit quality variables indicates considerably higher credit risk.
The average of the ratio of ALLL to gross loans increased from 1.4% in the period preceding the
financial crisis to 1.79% in period starting with the onset of the financial crisis. The mean PLLL
and NCOs as percentages of average gross loans nearly tripled from 0.41% and 0.31% in the pre-
crisis period to 1.13% and 0.91% in the post-crisis period, respectively. Similarly, the average of
the ratio of NPLs to gross loans increased from 0.8% to 3.10%.
5. Empirical Results
In the following sections we present the results of our empirical analyses. We begin with
estimation of the expected rate of credit losses and then evaluate its out-of-sample predictive

23
ability by comparing the significance of the expected rate of credit losses to that of other credit
risk measures in explaining next-year realized credit losses. Next, we examine the extent to
which the expected rate of credit losses explains the variation in the fair value of loans and
whether the fair value of loans contains all the information in the expected rate of credit losses.
We also examine whether the information in the fair value of loans is incremental to that
contained in the expected rate of credit losses. We then evaluate the pricing of the expected rate
of credit losses; specifically, we test whether this variable predicts subsequent stock returns.
Finally, we refine some of our analyses and perform robustness tests.
5.1 Estimating the expected rate of credit losses
To estimate the expected rate of credit losses, we perform quarterly cross-sectional
regressions of Equation (9). The summary statistics from the cross-sectional regressions are
presented in Table 3. Four sets of summary statistics are presented: (1) for all 63 cross-sectional
regressions (Q4:1996-Q2:2012), (2) for the period preceding the financial crisis (Q4:1996-
Q2:2007), (3) since the financial crisis (Q3:2007-Q2:2012), and (4) for the difference between
the two sub-periods. For each set of regressions and each coefficient, we report the time-series
mean of the coefficient, the time series t-statistic (the ratio of the time-series mean to the time-
series standard error), and the time-series median of the cross-sectional t-statistic. For the
difference in the two sub-periods statistics (the last two rows in the table), we report the
difference between the two mean coefficients and the corresponding t-statistic.
Focusing first on the estimates for the full sample period, we observe that most
coefficients have the expected signs and are highly significant. As expected, the most significant
explanatory variable for next year’s net charge-offs rate is the current year net charge-offs rate,

24
with a persistence parameter greater than 0.5. Also highly significant are the unexpected change
in NPL (γ) and the level of NPL (α2). The γ coefficient is of particular interest – it represents the
proportion of the unexpected change in NPL that turns into a credit loss in the following year.
The estimated value of this parameter for the full sample period is approximately 0.17, implying
that each dollar of unexpected NPL results in 17 cents of recognized loss in the following year.
As we see in the later analysis this parameter differs across a credit cycle in the expected
direction.
As expected, loans’ yield and loan composition are also associated with future credit
losses. High yield loans (α3), floating rate loans (α4), and consumer loans (α6) are on average
riskier than other loans, after controlling for other loan characteristics.
Turning to the sub-periods and related difference statistics, we observe that while the
coefficients generally have the same signs in both sub-periods, the magnitudes of almost all
changed significantly. Both the persistence parameter (α1) and the proportion of the unexpected
change in NPL that turns into credit losses (γ) increased significantly since the beginning of the
financial crisis. The coefficient on NPL (α2) also increased significantly. Thus, credit losses since
the beginning of the financial crisis increased not only because of deteriorating credit profiles of
borrowers as reflected in NPLs and NCOs (see Table 2), but also because of greater loss
implications of each dollar of NPLs and NCOs. The only coefficient that changes sign between
the two sub-periods is that on the proportion of real estate loans (α5). Prior to the financial crisis
real estate loans had much lower loss ratios than other loans, but this has changed since the
beginning of the financial crisis. In contrast, consumer loans have significantly larger loss ratios
compared to other loans throughout the sample period.
25
There is little authoritative guidance as to when loan charge offs should be recorded. In
principle, loan charge-offs should be recorded only when a loan is deemed to be uncollectible
with a high probability. Consumer loans are an exception to this principle – revolving consumer
loans (e.g., credit card receivables) must be charged off no later than 180 days past due, and
closed-end consumer loans (e.g., installment loans) must be charged off no later than 120 days
past due, regardless of the probability of collection. While the charge off policies with respect to
consumer loans tend to be more systematic and definitive across banks while those for other type
of loans are more ambiguous and vary in the cross-section. Therefore, users of financial
statements can benefit from more detailed and granular disclosures about non-consumer loans to
better understand charge offs for such loan categories.
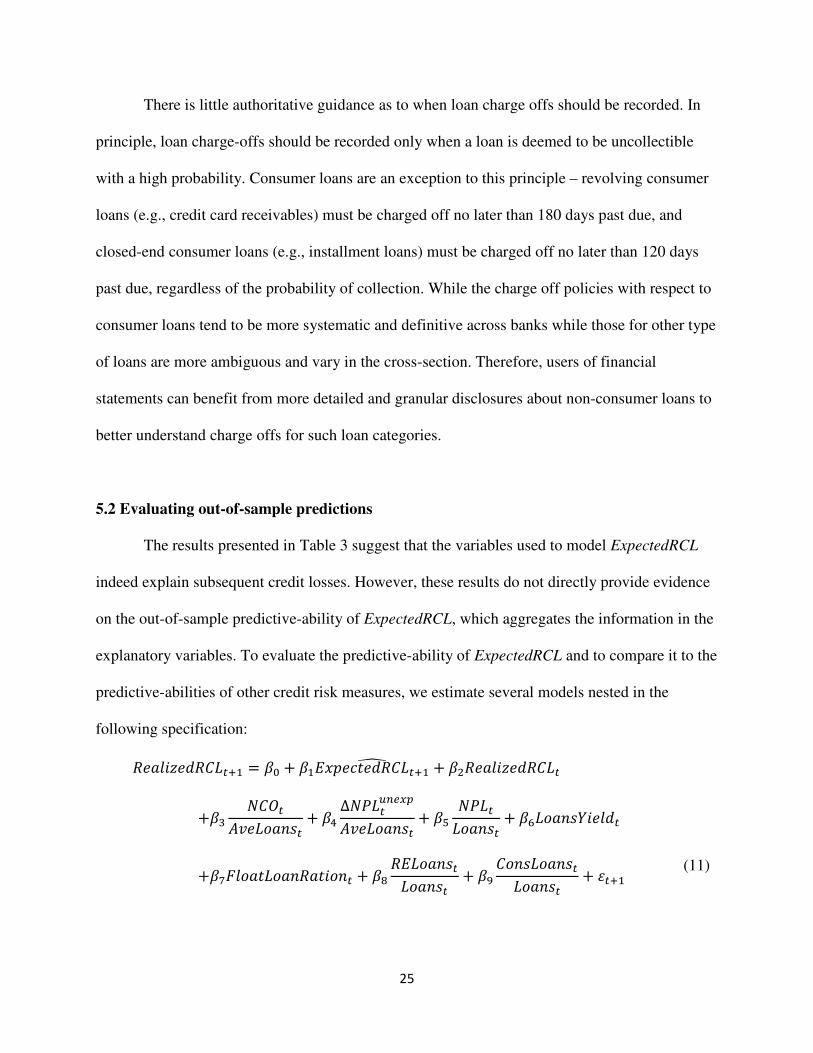
5.2 Evaluating out-of-sample predictions
The results presented in Table 3 suggest that the variables used to model ExpectedRCL
indeed explain subsequent credit losses. However, these results do not directly provide evidence
on the out-of-sample predictive-ability of ExpectedRCL, which aggregates the information in the
explanatory variables. To evaluate the predictive-ability of ExpectedRCL and to compare it to the
predictive-abilities of other credit risk measures, we estimate several models nested in the
following specification:
����������&� = G� + G�����������&�F +G����������� +G� �1�34������ + G� ∆���()*+,34������ + G �������� + G!����������
+GH��������������� + GI ������������ + GJ ������������� + "�&� (11)

26
where ����������&�F is estimated as described in Section 3 using the values of the
explanatory variables in period t and the estimated coefficients from time t regression of
Equation (9) (i.e., with period t NCOs as the dependent variable and time t-1 explanatory
variables).
The results from the estimation of the various models nested in Equation (11) are
presented in Table 4. The results suggest that ExpectedRCL performs substantially better than
either net charge-offs or the realized rate of credit losses in predicting next period’s credit losses.
Moreover, it reflects all the information that is captured by either one of these two variables.
When ExpectedRCL is included in the model along with either the realized rate of credit losses or
NCOs, it is the only significant variable. However, the realized rate of credit losses performs
substantially better than—and captures all the information in—NCOs, confirming the importance
of adjusting NCOs for unexpected changes in NPLs due to the amount of loans extended. Indeed,
the final regression in Table 4 demonstrates the significance of unexpected changes in NPLs in
predicting credit losses as well as that of NPLs and loans’ yield; the coefficient on each of these
variables is positive and highly significant.
5.3 Loans’ fair value and the expected rate of credit losses
If ExpectedRCL reflects information relevant for the prediction of credit losses it should
help explain management’s estimate of the fair value of loans.16 To examine the extent to which
ExpectedRCL explains variation in the disclosed fair value of loans, we estimate models nested
in the following specification:
�K���������� = G� + G�����������&�F +G�����������
16 It is usually assumed that the fair value of a loan will measure all of its current credit and interest rate risk.

27
+G� �1�34������ + G� ∆���()*+,34������ + G �������� + G!����������
+GH�������������� + GI ������������ + GJ ������������� + "�&� (12)
where FVLoanst is the disclosed fair value of all loans, including both loans held for investment
and loans held for sale, and all other variables are as defined above.
We obtain fair value information from SNL Financial. US companies have been
disclosing the fair value of most of their financial instruments—including loans—on an annual
basis since 1992 and on a quarterly basis since the second quarter of 2009. SNL collects this
information since 2005. Our sample for this analysis, therefore, includes 17 cross-sections (t):
Q4:05, Q4:06, Q4:07, Q4:08, Q2:09-Q2:12. We merged the fair value data with the FR Y-9C
data using various identifiers and verified that all matches are correct.
Before discussing the results, reported in Table 5, we note that given the small number of
cross-sections, the time-series t-statistics should be interpreted with caution. However, the
median cross-sectional t-statistics allow for meaningful inference given the reasonably large size
of each cross-section. As shown, ExpectedRCL is highly significant in explaining the disclosed
fair value of loans. However, unlike the results for predicting credit losses (presented in Table 4),
NCOs are slightly more significant than the expected rate of credit losses and provide
incremental information relative to ExpectedRCL. The final set of regressions indicates the
source of this difference in results compared to Table 4. Loans’ fair value increases rather than
declines with the unexpected change in NPLs. This result suggests that banks “manage” NCOs
and the disclosed fair value of loans in a consistent way. When banks understate NCOs, which
causes an unexpected increase in NPLs, they also overstate the disclosed fair value of loans. This

28
result is consistent with prior evidence regarding the quality and “management” of disclosed
loans fair values (e.g., Barth et al 1997, Eccher et al 1997, Nissim 2003).
Having established that the disclosed fair value of loans reflects at least some of the
information that is contained in ExpectedRCL, we next examine whether the disclosed fair value
contains (1) all the information that is captured by ExpectedRCL, and (2) incremental
information to that contained in ExpectedRCL. We conduct these tests by estimating models that
are nested in the following specification:
����������&� = G� + G� �K���������� + G�����������&�F
+G� �1�34������ + G� ∆���()*+,34������ + G �������� + G!����������
+GH�������������� + GI ������������ + GJ ������������� + "�&� (13)
The results of estimating the various models nested in Equation (13) are presented in
Table 6. As expected, loans’ fair value is significantly related to subsequent credit losses.
However, this relationship is substantially weaker than the correlation between the expected and
realized rates of credit losses. Moreover, loans’ fair value does not appear to add much to the
ExpectedRCL when predicting credit losses. On the other hand, the association between FVLoans
and RealizedRCL decreases substantially when ExpectedRCL are included in the model along
with FVLoans. The coefficient on FVLoans reduces from -0.074 (t-stat -5.2) to -0.008 (t-stat -
2.0) when ExpectedRCL are included. The final set of regressions indicates that the relatively
low significance of loans’ fair value in explaining credit losses is not due to loans’ fair value
reflecting variation in loan characteristics such as loans’ yield, as loans’ fair value remains at
best marginally significant after these variables are controlled for (the inclusion of other loan
characteristics in the regression effectively orthogonalizes loans’ fair value with respect to these

29
variables, allowing its coefficient to capture credit-related information not reflected in the
included loan characteristics or other non-credit related information in loans’ fair value). In
summary, we find that loan’s fair value does not capture all the information in ExpectedRCL, and
it does not seem to provide incremental information relative to ExpectedRCL in predicting credit
losses. These results provide further support for the inferences from Table 5 regarding the low
quality and potential “management” of loan fair value.
5.4 Stock return predictability
In the previous section we have shown that ExpectedRCL contains incremental credit
loss-related information relative to the disclosed fair value of loans. In other words, it appears
that bank managers do not fully incorporate the information in ExpectedRCL when measuring
the fair value of their loan portfolios. We next examine whether investors commit a similar error
when valuing bank stocks. Specifically, we examine whether ExpectedRCL predicts subsequent
annual stock returns. We conduct this test by estimating models that are nested in the following
specification:
����&� = G� + G�����������&�F +G� �1�34������ + G�L��� + G��MNOP + "�&� (14)
Where Rett+1 is the stock return during the 365 days starting 75 days after the end of the fiscal
quarter,17 Size is the log of the market value of equity 75 days after the end of the fiscal quarter,
LogBTM is the log of the book-to-market ratio, measured using book value at the end of the
quarter and market value 75 days after the end of the fiscal quarter, and all other variables are as
17 As discussed in Section 4, Fr Y-9C data are typically made available for all BHCs within two month from fiscal quarter end. To allow for delay reporting that might have occurred for some BHCs in some quarters, we start the stock return window 75 days after the end of the fiscal quarter.

30
defined above. We control for size and the book-to-market ratios following Barber and Lyon
(1997), but the results are not sensitive to the inclusion of these controls.
The first set of regressions in Table 7 demonstrates that ExpectedRCL performs very well
in predicting stock returns; it appears that investors do not price this information in a timely
fashion and so are surprised when realized losses are subsequently disclosed. Notably, the
control variables Size is insignificant and LogBTM is only marginally significant. The next two
sets of regressions show that the return predictability of ExpectedRCL is due to investors’ under-
reaction to net charge-offs, but even more so to their lack of consideration of other information
that is reflected in ExpectedRCL. In fact, when both ExpectedRCL and net charge-offs are
included in the regression the coefficient on ExpectedRCL becomes substantially more negative
and the net charge-offs coefficient turns positive. Thus, it appears that investors underreact to
ExpectedRCL especially when it is substantially different from net charge-offs.
5.5 Refinements and robustness tests
In this section, we examine the robustness of our findings by refining some of our
analyses. Specifically, we consider alternative ways for measuring the coefficients and variables
used in estimating ExpectedRCL.
In the main analysis we use only the most recent coefficients of Equation (9) to estimate
ExpectedRCL, effectively assuming that there is no incremental information in prior coefficient
estimates. This assumption is not likely to hold given the limited size of each cross section and
the substantial magnitude of unexpected credit losses. On the other hand, as we show in section
5.1, the coefficients change considerably over time, so the most recent estimates are likely to be
less biased compared to prior estimates. To evaluate this bias/noise trade-off, we repeat the

31
analysis extrapolating from the time-series of the coefficient estimates. Table 8 replicates the
first regression of Table 4 using six alternative estimates of ExpectedRCL, derived using: (1) a
moving average of the last four coefficient estimates, and (2) exponential smoothing of the
coefficient estimates with a smoothing factor of 0.9, 0.75, 0.5, 0.25 and 0.1.18 As shown,
extrapolating from past coefficient estimates rather than using the most recent coefficients has a
relatively small effect on the results. The ExpectedRCL coefficient is positive and highly
significant in predicting credit losses irrespective of whether the most recent coefficient
estimates are used to estimate ExpectedRCL or if it is estimated by extrapolation from the time-
series of the coefficient estimates. Still, it appears that there is some potential for improving
credit loss forecasts by incorporating past coefficient estimates, particularly when using low
exponential smoothing factors (i.e., when giving higher weight to past estimates).
Since net charge-offs and the unexpected change in NPL used in estimating the
parameters of Equations (7) and (9) are measured using trailing four quarter data, the explanatory
variables of Equation (9) are at least a year old at the time the parameters are estimated. An
alternative approach for measuring net charge-offs and the unexpected change in NPL, which
allows for a substantially shorter delay, is to measure these variables using annualized quarterly
data. This approach allows for more recent information to reflect itself in the estimated
parameters, but at the cost of using seasonal and potentially noisy information. Table 9 replicates
the first regression of Table 4 with ExpectedRCL estimated using annualized credit losses. As
shown, using annualized instead of TFQ information in estimating ExpectedRCL slightly
improves the predictive-ability of this variable.
18 The predicted value (st+1) for the series xt under exponential smoothing with a smoothing factor f is f*xt + (1-f)*st, where s1=x0.

32
6. Conclusion
The current loan loss provisioning rules, based on the incurred-loss provisioning method,
have been blamed by regulators and policy makers for accentuating pro-cyclicality. Given the
criticism of the current rules, standard setters are contemplating modifying the existing loss
provisioning rules to require the recognition of expected losses. This study develops a timely and
unbiased metric of the expected rate of credit losses that uses a linear combination of several
credit-risk related measures currently disclosed by banks.
The proposed metric, the expected rate of credit losses (ExpectedRCL), performs
substantially better than net charge-offs or the realized rate of credit losses in predicting credit
losses and it appears to reflect all the credit loss-related information in either of these two
variables. This result does not suggest that improvements cannot be made in banks estimating
and providing for expected losses, but rather that using the framework in this paper there are
ways to estimate future realized credit losses, in the cross section, from current disclosures. We
also find that investors do not seem to fully incorporate this proxy for expected credit losses in
the pricing of bank stocks.
We also provide some insight on the question of whether the disclosed fair value of loans
provides a good measure of expected credit losses as it should in principle. We find that the
disclosed fair value of loans is correlated with ExpectedRCL. However, the loans’ fair value does
not capture all the information in ExpectedRCL and it does not provide much incremental
information relative to ExpectedRCL in predicting credit losses. We also find that investors do
not fully incorporate all the information in ExpectedRCL in pricing bank stocks. ExpectedRCL is
a more timely and unbiased measure of expected credit losses relative to the existing credit risk-
related measures disclosed by banks. As such, it can serve as a benchmark for loan yield in

33
evaluating bank performance and value creation in lending, and it can be used in ongoing policy
deliberations.
The failure of the disclosed fair value of loans to reflect even publicly available
information about loan credit losses is disconcerting. Banks have been disclosing fair value
estimates for their loan portfolios since 1992, and yet these estimates appear to perform
relatively poorly in capturing expected credit losses. Investors appear to commit similar errors.
These finding suggests that if standard setters will indeed change the incurred loss model toward
the recognition of expected losses, they should at the very least require banks to benchmark their
estimates against these relatively objective methods for estimating credit losses and mandate
extended, consistent and understandable credit-related disclosures.

34
Appendix A: UNIFORM RETAIL CREDIT CLASSIFICATION AND ACCOUNT
MANAGEMENT POLICY
The following is the FDIC policy regarding retail credit classification. It has been in effect since 2000 and was last updated on December 3, 2009. See http://www.fdic.gov/regulations/laws/rules/5000-1000.html. The agencies’ classifications used for retail credit are Substandard, Doubtful, and Loss. These are defined as follows:19 Substandard: An asset classified Substandard is protected inadequately by the current net worth and paying capacity of the obligor, or by the collateral pledged, if any. Assets so classified must have a well-defined weakness or weaknesses that jeopardize the liquidation of the debt. They are characterized by the distinct possibility that the institution will sustain some loss if the deficiencies are not corrected. Doubtful: An asset classified Doubtful has all the weaknesses inherent in one classified Substandard with the added characteristic that the weaknesses make collection or liquidation in full, on the basis of currently existing facts, conditions, and values, highly questionable and improbable. Loss: An asset, or portion thereof, classified Loss is considered uncollectible, and of such little value that its continuance on the books is not warranted. This classification does not mean that the asset has absolutely no recovery or salvage value; rather, it is not practical or desirable to defer writing off an essentially worthless asset (or portion thereof), even though partial recovery may occur in the future. The Uniform Retail Credit Classification and Account Management Policy establishes standards for the classification and treatment of retail credit in financial institutions. Retail credit consists of open- and closed-end credit extended to individuals for household, family, and other personal expenditures, and includes consumer loans and credit cards. For purposes of this policy, retail credit also includes loans to individuals secured by their personal residence, including first mortgage, home equity, and home improvement loans. Because a retail credit portfolio generally consists of a large number of relatively small-balance loans, evaluating the quality of the retail credit portfolio on a loan-by-loan basis is inefficient and burdensome for the institution being examined and for examiners. Actual credit losses on individual retail credits should be recorded when the institution becomes aware of the loss, but in no case should the charge-off exceed the time frames stated in this policy. This policy does not preclude an institution from adopting a more conservative internal policy. Based on collection experience, when a portfolio's history reflects high losses and low recoveries, more conservative standards are appropriate and necessary.
19 Although the Board of Governors of the Federal Reserve System, Federal Deposit Insurance Corporation, Office of the Comptroller of the Currency, and Office of Thrift Supervision do not require institutions to adopt identical classification definitions, institutions should classify their assets using a system that can be easily reconciled with the regulatory classification system.

35
The quality of retail credit is best indicated by the repayment performance of individual borrowers. Therefore, in general, retail credit should be classified based on the following criteria: • Open- and closed-end retail loans past due 90 cumulative days from the contractual due date
should be classified Substandard.
• Closed-end retail loans that become past due 120 cumulative days and open-end retail loans that become past due 180 cumulative days from the contractual due date should be classified Loss and charged off. In lieu of charging off the entire loan balance, loans with non-real estate collateral may be written down to the value of the collateral, less cost to sell, if repossession of collateral is assured and in process.20
• One- to four-family residential real estate loans and home-equity loans that are past due 90
days or more with loan-to-value ratios greater than 60 percent should be classified Substandard. Properly secured residential real estate loans with loan-to-value ratios equal to or less than 60 percent are generally not classified based solely on delinquency status. Home-equity loans to the same borrower at the same institution as the senior mortgage loan with a combined loan-to-value ratio equal to or less than 60 percent need not be classified. However, home equity loans where the institution does not hold the senior mortgage, that are past due 90 days or more should be classified Substandard, even if the loan-to-value ratio is equal to, or less than, 60 percent.
For open- and closed-end loans secured by residential real estate, a current assessment of value should be made no later than 180 days past due. Any outstanding loan balance in excess of the value of the property, less cost to sell, should be classified Loss and charged off.
• Loans in bankruptcy should be classified Loss and charged off within 60 days of receipt of
notification of filing from the bankruptcy court or within the time frames specified in this classification policy, whichever is shorter, unless the institution can clearly demonstrate and document that repayment is likely to occur. Loans with collateral may be written down to the value of the collateral, less cost to sell. Any loan balance not charged off should be classified Substandard until the borrower re-establishes the ability and willingness to repay for a period of at least six months.
• Fraudulent loans should be classified Loss and charged off no later than 90 days of discovery or within the time frames adopted in this classification policy, whichever is shorter.
20 For operational purposes, whenever a charge-off is necessary under this policy, it should be taken no later than the end of the month in which the applicable time period elapses. Any full payment received after the 120- or 180-day charge-off threshold, but before month-end charge-off, may be considered in determining whether the charge-off remains appropriate. OTS regulation 12 CFR 560.160(b) allows savings institutions to establish adequate (specific) valuation allowances for assets classified Loss in lieu of charge-offs. Open-end retail accounts that are placed on a fixed repayment schedule should follow the charge-off time frame for closed-end loans.

36
• Loans of deceased persons should be classified Loss and charged off when the loss is determined or within the time frames adopted in this classification policy, whichever is shorter.
Other Considerations for Classification If an institution can clearly document that a past due loan is well secured and in the process of collection, such that collection will occur regardless of delinquency status, then the loan need not
be classified. A well-secured loan is collateralized by a perfected security interest in, or pledges of, real or personal property, including securities with an estimable value, less cost to sell, sufficient to recover the recorded investment in the loan, as well as a reasonable return on that amount. In the process of collection means that either a collection effort or legal action is proceeding and is reasonably expected to result in recovery of the loan balance or its restoration to a current status, generally within the next 90 days.
37
References
Ahmed, A., C. Takeda, and S. Thomas. 1999. Bank loan loss provisions: A reexamination of
capital management, earnings management, and signaling effects. Journal of Accounting
and Economics 28(1): 1 – 25. Araten, M., M. Jacobs Jr., and P. Varshney. 2004. Measuring LGD on commercial loans: An 18-
year internal study. The RMA Journal (May). Bank for International Settlements. 2008. Note for the FSF Working Group on Market and
Institutional Resilience Addressing Financial System Procyclicality: A Possible Framework.
Barber, B. M., and J. D. Lyon. 1997. Firm Size, Book-to-Market Ratio, and Security Returns: A
Holdout Sample of Financial Firms. Journal of Finance 52(2): 875-883. Barth, M. E. 1994. Fair value accounting: Evidence from investment securities and the market
valuation of banks. The Accounting Review 69 (January): 1-25. Barth, M., W. Beaver, and W. Landsman. 1996. Value-relevance of banks’ fair value disclosures
under SFAS No. 107. The Accounting Review (October): 513-537. Barth, M. E., and W. R. Landsman. 2010. How did financial reporting contribute to the financial
crisis? European Accounting Review 19 (3): 399 – 423. Basel Committee on Banking Supervision. 2000. Financial stability and the Basel capital accord.
March. Bank of Insternational Settlements. Beatty, A., S. Chamberlain, and J. Magliolo. 1995. Managing financial reports of commercial
banks: The influence of taxes, regulatory capital, and earnings. Journal of Accounting
Research 33(2): 231 – 261. Beaver, W. H., C. Eger, S. Ryan, and M. Wolfson. 1989. Financial reporting, supplemental
disclosures, and bank share prices. Journal of Accounting Research 27 (Autumn): 157-178.
Beaver, W. H. and E. E. Engel, “Discretionary Behavior with Respect to Allowance for Loan
Losses and the Behavior of Security Prices.” Journal of Accounting and Economics 22, 177-206, (1996).
Berger, A., and G. Udell. 2002. Small business credit availability and relationship lending: The
importance of bank organisational structure. The Economic Journal 122: 32 – 53. Bikker, J.A., and P.A.J. Metzemakers. 2005. Bank provisioning behavior and procyclicality.
Journal of International Financial Markets, Institutions, and Money 15(2): 141 – 157.

38
Bhat, G., S.G. Ryan, and D. Vyas. 2012. The Implications of Banks’ Credit Risk Modeling Disclosures for their Loan Loss Provision Timeliness and Loan Origination Procyclicality. Working Paper New York University.
Bushman, R.M. and C.D. Williams. 2011. Delayed expected loss recognition and the risk profile
of banks. Working Paper University of North Carolina at Chapel Hill. Bushman, R.M., and C.D. Williams. 2012. Bank transparency and the discipline of risk-taking
behavior. Journal of Accounting and Economics forthcoming. Calomiris, C., and D. Nissim. 2012. “Crisis-Related Shifts in the Market Valuation of Banking
Activities”, NBER Working Paper 17868. Cantrell, B., J. McInnis, and C. Yust. 2012. Predicting credit losses: Loan fair values versus
historical costs. University of Texas at Austin Working Paper. Collins, J. H., D. A. Shackelford and J. M. Wahlen. 1995. Bank Differences in the Coordination
of Regulatory Capital, Earnings, and Taxes. Journal of Accounting Research 33, 263-291.
Dugan, J. 2009. Loan Loss Provisioning and Pro-Cyclicality. Available at
http://www.occ.treas.gov/news-issuances/speeches/2009/pub-speech-2009-16.pdf Eccher, E. A., K. Ramesh, and S. R. Thiagarajan. 1996. Fair value disclosures by bank holding
companies. Journal of Accounting and Economics 22 (1-3): 79-117. Elliott, J. A., J. D. Hanna, and W. H. Shaw. 1991. The evaluation by the financial markets of
changes in bank loan loss reserve levels. The Accounting Review 66 (October): 847-861. Financial Stability Forum. 2009a. Report of the FSF Working Group on Provisioning. March,
2009. Financial Stability Forum. 2009b. Report of the FSF on Addressing Procyclicality in the
Financial System. April, 2009. Griffin, P. A., and S. J. R. Wallach. 1991. Latin American lending by major U.S. banks: The
effects of disclosures about nonaccrual loans and loan loss provisions. The Accounting
Review 66 (October): 830-846. International Accounting Standards Board. 2009. Financial Instruments: Amortized cost and
impairment. IASB, London, UK. Jimenez, G., and J. Saurina. 2005. Credit cycles, credit risk, and prudential regulation. Bank of
Spain working paper.

39
Keeton, W.R. 1999. Does faster loan growth lead to higher loan losses? Federal Reserve Bank of Kansas City, Economic Review.
Laeven, L., and G. Majnoni. 2003. Loan loss provisioning and economic slowdowns: Too much,
too late? Journal fo Financial Intermediation 12: 178 – 197. Liu, C., and S. Ryan. 1995. The effect of loan portfolio composition on the market reaction to
and anticipation of loan loss provisions. Journal of Accounting Research 33 (Spring): 77-94.
Liu C. and S.G. Ryan. 2006. Income smoothing over the business cycle: Changes in banks’
coordinated management of provisions for loan losses and loan charge‐offs from the pre‐ 1990 bust to the 1990s boom. The Accounting Review 81, (2): 421-441.
Liu C. and S.G. Ryan, and J. Wahlen. 1997. Differential valuation implications of loan loss
provisions across banks and fiscal quarters. The Accounting Review 72, (1): 133–146. Moyer, S. E., “Capital Adequacy Ratio Regulations and Accounting Choices in Commercial
Banks.” Journal of Accounting and Economics 13, 123-154, (1990). Nissim, D. “Reliability of Banks’ Fair Value Disclosure for Loans,” Review of Quantitative
Finance and Accounting 20, 355-384 (2003). Nissim, D. and S. Penman. “Fair Value Accounting in the Banking Industry”, Center for
Excellence in Accounting and Security Analysis, 1-75, (2007). Available at http://www.columbia.edu/~dn75/research.htm.
Ng, J., and T. O. Rusticus. 2011. Banks’ Survival during the Financial Crisis: The Role of
Financial Reporting Transparency. Working Paper Northwestern University. Office of the Comptroller of the Currency. 2009. Comptroller Dugan urges less pro-cyclical
approaches to reserves. OCC March 2, 2009. Ryan, S. 2007. Financial instruments and institutions: Accounting and disclosure rules. Second
edition. John Wiley & Sons. Scholes, M., G. Wilson, and M. Wolfson. 1990. Tax planning, capital planning, and financial
reporting strategy for commercial banks. Review of Financial Studies 3 (4): 625 – 650. Udell, G. 1999. Loan quality, commercial loan review and loan officer contracting. Journal of
Banking and Finance 13(3): 367- 382. Vyas, D. 2011. The timeliness of accounting write-downs by U.S. financial institutions during
the financial crisis of 2007-2008. Journal of Accounting Research 49 (3): 823-860.

40
Wahlen, J. M., The Nature of Information in Commercial Bank Loan Loss Disclosures.” The
Accounting Review 69, 455-478, (1994).

41
Table 1
Summary statistics for the full sample
Obs. Mean SD 5% 25% Med. 75% 95%
Charge-offs / average gross loans 46,770 0.61% 0.79% 0.02% 0.15% 0.34% 0.70% 2.30% Recoveries / average gross loans 46,689 0.09% 0.10% 0.00% 0.03% 0.06% 0.12% 0.29% Net charge-offs / average gross loans 46,762 0.51% 0.74% 0.00% 0.10% 0.25% 0.58% 2.08% Unexpected NPL / average gross loans 46,448 0.24% 1.14% -1.05% -0.21% 0.03% 0.44% 2.43% Nonaccruing loans / gross loans 48,666 1.21% 1.61% 0.04% 0.28% 0.61% 1.43% 4.69% Restructured loans / gross loans 48,103 0.19% 0.47% 0.00% 0.00% 0.00% 0.08% 1.19% Delinquent loans / gross loans 48,495 0.15% 0.22% 0.00% 0.00% 0.06% 0.20% 0.61% Nonperforming loans / gross loans 48,731 1.65% 2.11% 0.09% 0.43% 0.86% 1.91% 6.18% Real estate loans / gross loans 49,156 69.87% 18.47% 35.31% 60.27% 72.88% 83.10% 94.39% Consumer loans / gross loans 48,646 7.64% 8.34% 0.26% 1.68% 4.54% 10.86% 24.86% Commercial loans / gross loans 48,876 16.08% 10.21% 2.66% 9.05% 14.48% 21.03% 35.09% Other loans / gross loans 48,444 4.53% 5.66% 0.01% 0.73% 2.52% 6.06% 16.47% Average tax-equivalent loans’ yield 47,154 7.31% 1.57% 5.21% 6.11% 7.11% 8.46% 9.86% Estimated ratio of floating rate loans 49,299 40.49% 17.10% 14.04% 28.41% 40.01% 51.63% 69.73% Allowance / gross loans held for investment 48,916 1.54% 0.71% 0.77% 1.12% 1.37% 1.75% 2.95% Prov. for loan losses / average gross loans 46,782 0.65% 0.85% 0.02% 0.19% 0.37% 0.72% 2.44% Fair value of loans / gross loans 6,420 0.98 0.03 0.91 0.97 0.99 1.00 1.03
The sample period is Q4:1996 through Q2:2012. Balance sheet items are generally measured at the end of the quarter. Income statement items are measured using trailing four quarters data. Details on variable definitions are provided in the text. The disclosed fair value of loans is available for a subset of firms in 17 quarters (Q4:05, Q4:06, Q4:07, Q4:08, and Q2:09-Q2:12).

42
Table 2
Summary statistics for sub-periods
Q4:1996-Q2:2012 Q4:1996-Q2:2007 Q3:2007-Q2:2012 Difference
mean Med. Q-Ran Mean Med. Q-Ran mean Med. Q-Ran mean t-stat
Charge-offs / average gross loans 0.60% 0.33% 0.54% 0.40% 0.26% 0.36% 1.01% 0.62% 1.14% 0.61% 67.5
Recoveries / average gross loans 0.09% 0.06% 0.09% 0.09% 0.06% 0.09% 0.09% 0.05% 0.09% 0.00% -4.3
Net charge-offs / average gross loans 0.50% 0.24% 0.47% 0.31% 0.18% 0.30% 0.91% 0.54% 1.06% 0.60% 71.9
Unexpected NPL / average gross loans 0.25% 0.03% 0.65% -0.03% -0.02% 0.40% 0.80% 0.48% 1.60% 0.83% 60.5
Nonaccruing loans / gross loans 1.20% 0.60% 1.10% 0.60% 0.40% 0.60% 2.30% 1.70% 2.50% 1.70% 100.4
Restructured loans / gross loans 0.17% 0.00% 0.07% 0.05% 0.00% 0.02% 0.42% 0.05% 0.57% 0.37% 67.1
Delinquent loans / gross loans 0.15% 0.06% 0.20% 0.15% 0.08% 0.20% 0.15% 0.04% 0.18% -0.01% -3.9
Nonperforming loans / gross loans 1.60% 0.80% 1.40% 0.80% 0.60% 0.70% 3.10% 2.30% 3.30% 2.30% 101.2
Real estate loans / gross loans 69.77% 72.77% 22.84% 66.93% 69.69% 23.65% 74.81% 77.93% 18.28% 7.88% 47.2
Consumer loans / gross loans 7.70% 4.61% 9.25% 9.39% 6.83% 11.06% 4.70% 2.53% 4.48% -4.69% -66.3
Commercial loans / gross loans 16.12% 14.53% 11.96% 16.90% 15.29% 12.63% 14.74% 13.26% 10.51% -2.15% -22.8
Other loans / gross loans 4.53% 2.52% 5.32% 4.66% 2.66% 5.43% 4.31% 2.23% 4.99% -0.35% -6.4
Average tax-equivalent loans’ yield 7.30% 7.10% 2.30% 7.90% 7.90% 2.20% 6.30% 6.10% 1.30% -1.50% -122.8
Estimated ratio of floating rate loans 40.66% 40.20% 23.12% 42.06% 41.94% 22.62% 37.88% 36.57% 23.19% -4.18% -25.8
Allowance / gross loans held for investment 1.53% 1.36% 0.62% 1.40% 1.31% 0.50% 1.79% 1.55% 0.97% 0.39% 51.8
Prov. for loan losses / average gross loans 0.65% 0.37% 0.52% 0.41% 0.29% 0.33% 1.13% 0.73% 1.19% 0.73% 75.4
Fair value of loans / gross loans 0.981 0.985 0.026 0.984 0.984 0.013 0.980 0.986 0.029 -0.004 -5.6
The sample period is Q4:1996 through Q2:2012. Balance sheet items are generally measured at the end of the quarter. Income statement items are measured using trailing four quarters data. Details on variable definitions are provided in the text. The disclosed fair value of loans is available for a subset of firms in 17 quarters (Q4:05, Q4:06, Q4:07, Q4:08, and Q2:09-Q2:12).

43
Table 3
Summary statistics from cross-sectional regressions for estimating expected credit losses
�1�34������ =∝�∗+∝� �1���34�������� +∝� 2 ∆�����()*+,34��������
+∝� ������������ +∝� ������������ +∝� ����������������
+∝ ���������������� +∝! ����������������� + "�∗ (9)
α0*
α1 γ α2 α3 α4 α5 α6 Mean R2 Mean Obs.
t=Q4:97-Q2:12 mean(coef.) -0.0018 0.5201 0.1676 0.0828 0.0301 0.0022 -0.0008 0.0042 0.48824 671 t(mean(coef.)) -3.3 28.1 12.3 19.8 5.4 5.5 -2.1 10.9 median(t(coef.)) -1.4 13.3 3.8 4.8 2.3 1.0 -1.8 1.9
t=Q4:97-Q2:07 mean(coef.) -0.0003 0.4908 0.1279 0.0770 0.0280 0.0006 -0.0023 0.0035 0.48469 639 t(mean(coef.)) -0.8 23.9 9.3 14.5 8.2 4.4 -7.9 7.6 median(t(coef.)) -1.2 13.4 3.1 5.1 2.3 0.6 -2.5 2.3
t=Q3:07-Q2:12 mean(coef.) -0.0046 0.5773 0.2450 0.0942 0.0342 0.0053 0.0022 0.0054 0.49518 734 t(mean(coef.)) -3.9 16.9 11.5 15.5 2.2 7.0 4.6 9.3 median(t(coef.)) -2.1 13.1 4.5 4.1 1.1 3.0 1.1 1.2 mean(diff) -0.0043 0.0865 0.1170 0.0172 0.0062 0.0048 0.0044 0.0019 0.0105 95 t(diff) -3.4 2.2 4.6 2.1 0.4 6.2 8.0 2.6 0.4 6.2
The sample period (t) is Q4:1997 through Q2:2012. Balance sheet items are generally measured at the end of the quarter. Income statement items are measured using trailing four quarters data. Details on variable definitions are provided in the text. mean(coef.) is the time-series mean of the corresponding regression coefficient. t(mean(coef.)) is the t-statistic of the mean coefficient (the ratio of the time-series mean to its standard error). median(t(coef.)) is the time-series median of the regression t-statistic.

44
Table 4
Summary statistics from cross-sectional regressions for evaluating out-of-sample predictions of credit losses
����������&� = G� + G�����������&�F +G����������� + G� �1�34������ + G� ∆���()*+,34������ +G �������� + G!���������� + GH�������������� + GI ������������ + GJ ������������� + "�&�
(11)
β0
β1 β2 β3 β4 β5 β6 β7 β8 β9 Mean R2 Mean Obs.
mean(coef.) 0.0018 0.9872 0.3915 667 t(mean(coef.)) 4.2 22.7 median(t(coef.)) 2.7 21.5 mean(coef.) 0.0023 0.6954 0.3649 667 t(mean(coef.)) 7.7 22.0 median(t(coef.)) 7.4 21.1 mean(coef.) 0.0027 0.7222 0.3375 667 t(mean(coef.)) 6.7 22.8 median(t(coef.)) 7.8 19.3 mean(coef.) 0.0018 0.9631 0.0053 0.3994 667 t(mean(coef.)) 4.5 13.9 0.1 median(t(coef.)) 2.2 6.0 0.5 mean(coef.) 0.0018 0.9077 0.0490 0.4018 667 t(mean(coef.)) 4.4 13.9 1.3 median(t(coef.)) 2.5 8.4 1.2 mean(coef.) 0.0023 0.5696 0.1109 0.3788 667 t(mean(coef.)) 7.6 1.1 0.2 median(t(coef.)) 7.2 5.2 -1.3 mean(coef.) -0.0027 0.5503 0.0901 0.0644 0.0394 0.0031 0.0004 0.0035 0.4316 667 t(mean(coef.)) -3.5 25.1 8.5 9.1 5.5 5.0 0.6 7.1 median(t(coef.)) -1.8 12.1 3.4 3.2 2.6 1.4 -1.5 1.6
The sample period (t) is Q4:1997 through Q2:2011. Balance sheet items are generally measured at the end of the quarter. Income statement items are measured using trailing four quarters data. Details on variable definitions are provided in the text. mean(coef.) is the time-series mean of the corresponding regression coefficient. t(mean(coef.)) is the t-statistic of the mean coefficient (the ratio of the time-series mean to its standard error). median(t(coef.)) is the time-series median of the regression t-statistic.

45
Table 5
Summary statistics from cross-sectional regressions for evaluating the extent to which the expected rate of credit losses explains variation in
the disclosed fair value of loans
�K���������� = G� + G�����������&�F +G����������� + G� �1�34������ + G� ∆���()*+,34������ +G �������� + G!���������� + GH�������������� + GI ������������ + GJ ������������� + "�&�
(12)
β0
β1 β2 β3 β4 β5 β6 β7 β8 β9 Mean R2 Mean Obs.
mean(coef.) 0.9980 -1.4145 0.1556 339 t(mean(coef.)) 634.8 -6.5 median(t(coef.)) 341.7 -8.4 mean(coef.) 0.9970 -1.0628 0.1496 339 t(mean(coef.)) 665.3 -6.8 median(t(coef.)) 378.0 -8.3 mean(coef.) 0.9970 -1.2631 0.1623 339 t(mean(coef.)) 697.4 -7.1 median(t(coef.)) 389.1 -8.8 mean(coef.) 0.9980 -1.5705 0.1147 0.1592 339 t(mean(coef.)) 630.1 -5.3 0.5 median(t(coef.)) 325.2 -2.2 0.0 mean(coef.) 0.9980 -0.5827 -0.7764 0.1691 339 t(mean(coef.)) 648.7 -4.8 -5.5 median(t(coef.)) 345.6 -1.1 -1.9 mean(coef.) 0.9980 0.2420 -1.4604 0.1678 339 t(mean(coef.)) 658.3 1.2 -6.1 median(t(coef.)) 375.7 0.5 -2.4 mean(coef.) 0.9850 -0.8192 0.1754 -0.2609 0.3908 -0.0136 -0.0023 -0.0327 0.2032 339 t(mean(coef.)) 304.8 -5.4 3.4 -10.9 5.6 -5.6 -1.2 -5.5 median(t(coef.)) 56.5 -4.3 1.3 -2.3 1.8 -1.1 -0.5 -1.2
The sample includes 17 cross-sections (t): Q4:05, Q4:06, Q4:07, Q4:08, Q2:09-Q2:12. Balance sheet items are generally measured at the end of the quarter. Income statement items are measured using trailing four quarters data. Details on variable definitions are provided in the text. mean(coef.) is the time-series mean of the corresponding regression coefficient. t(mean(coef.)) is the t-statistic of the mean coefficient (the ratio of the time-series mean to its standard error). median(t(coef.)) is the time-series median of the regression t-statistic.

46
Table 6
Summary statistics from cross-sectional regressions for comparing the predictive-ability of the estimated expected rate of
credit losses and the disclosed fair value of loans
����������&� = G� + G� �K���������� + G�����������&�F +G� �1�34������ + G� ∆���()*+,34������ +G �������� + G!���������� + GH�������������� + GI ������������ + GJ ������������� + "�&�
(13)
β0
β1 β2 β3 β4 β5 β6 β7 β8 β9 Mean R2 Mean Obs.
mean(coef.) 0.0846 -0.0747 0.0786 320 t(mean(coef.)) 5.5 -5.2 median(t(coef.)) 6.0 -5.2 mean(coef.) 0.0039 0.8880 0.4123 320 t(mean(coef.)) 4.0 9.2 median(t(coef.)) 4.4 15.5 mean(coef.) 0.0119 -0.0081 0.8742 0.4150 320 t(mean(coef.)) 2.5 -2.0 9.1 median(t(coef.)) 0.6 -0.4 13.8 mean(coef.) -0.0009 -0.0074 0.4626 0.1108 0.0967 0.0719 0.0060 0.0055 0.0070 0.4500 320 t(mean(coef.)) -0.2 -2.2 6.6 5.3 5.1 3.3 5.8 4.1 2.4 median(t(coef.)) -0.2 -0.4 6.7 1.9 3.8 1.0 1.9 1.7 1.2
The sample includes 13 cross-sections (t): Q4:05, Q4:06, Q4:07, Q4:08, Q2:09-Q2:11. Balance sheet items are generally measured at the end of the quarter. Income statement items are measured using trailing four quarters data. Details on variable definitions are provided in the text. mean(coef.) is the time-series mean of the corresponding regression coefficient. t(mean(coef.)) is the t-statistic of the mean coefficient (the ratio of the time-series mean to its standard error). median(t(coef.)) is the time-series median of the regression t-statistic.

47
Table 7
Summary statistics from cross-sectional regressions of annual stock return on beginning-
of-period measures of expected credit losses and control variables
����&� = G� + G�����������&�F +G� �1�34������ + G�L��� + G��MNOP + "�&� (14)
β0
β1 β2 β3 β4 Mean R2 Mean Obs.
mean(coef.) 0.0796 -8.9556 0.0042 0.0379 0.1004 303 t(mean(coef.)) 1.8 -6.9 0.8 1.9 median(t(coef.)) 1.6 -2.0 -0.3 1.0
mean(coef.) 0.0725 -3.5411 0.0012 0.0192 0.0919 303 t(mean(coef.)) 1.6 -3.8 0.2 0.9 median(t(coef.)) 1.5 -0.9 -0.5 0.7
mean(coef.) 0.0971 -27.4105 15.6314 0.0024 0.0406 0.1177 303 t(mean(coef.)) 2.2 -4.8 3.9 0.5 2.0 median(t(coef.)) 1.7 -2.5 1.9 -0.4 0.6
The sample period (t) is Q4:1997 through Q2:2011. Details on variable definitions are provided in the text. mean(coef.) is the time-series mean of the corresponding regression coefficient. t(mean(coef.)) is the t-statistic of the mean coefficient (the ratio of the time-series mean to its standard error). median(t(coef.)) is the time-series median of the regression t-statistic.

48
Table 8
Summary statistics from cross-sectional regressions for evaluating out-of-sample
predictions of the expected rate of credit losses, measured using alternative extrapolation
methods for the coefficients of Equation (9)
����������&� = G� + G�����������&�F +"�&�
β0
β1 Mean R2 Mean Obs.
Most recent mean(coef.) 0.0018 0.9872 0.3915 667 t(mean(coef.)) 4.2 22.7
median(t(coef.)) 2.7 21.5 Moving average (4) mean(coef.) 0.0017 1.0171 0.3936 667 t(mean(coef.)) 4.3 20.4
median(t(coef.)) 2.3 21.8 Exponential smoothing (0.9) mean(coef.) 0.0017 0.9904 0.3924 667 t(mean(coef.)) 4.2 22.6
median(t(coef.)) 2.7 21.5 Exponential smoothing (0.75) mean(coef.) 0.0017 0.9956 0.3935 667 t(mean(coef.)) 4.2 22.3 median(t(coef.)) 2.8 21.6
Exponential smoothing (0.5) mean(coef.) 0.0017 1.0071 0.3948 667 t(mean(coef.)) 4.3 21.5 median(t(coef.)) 2.2 21.5 Exponential smoothing (0.25) mean(coef.) 0.0016 1.0163 0.3966 667 t(mean(coef.)) 4.5 20.4 median(t(coef.)) 2.5 21.6 Exponential smoothing (0.1) mean(coef.) 0.0014 1.0717 0.4057 667 t(mean(coef.)) 5.1 21.0 median(t(coef.)) 2.7 22.3
The sample period (t) is Q4:1997 through Q2:2011. Balance sheet items are generally measured at the end of the quarter. Income statement items are measured using trailing four quarters data. Details on variable definitions are provided in the text. mean(coef.) is the time-series mean of the corresponding regression coefficient. t(mean(coef.)) is the t-statistic of the mean coefficient (the ratio of the time-series mean to its standard error). median(t(coef.)) is the time-series median of the regression t-statistic.

49
Table 9
Summary statistics from cross-sectional regressions for evaluating out-of-sample
predictions of the expected rate of credit losses, measured using Equation (9) coefficients
estimated with annualized instead of trailing-four-quarters dependent variable
����������&� = G� + G�����������&�F +"�&�
β0
β1 Mean R2 Mean Obs.
Trailing four quarters mean(coef.) 0.0018 0.9872 0.3915 667 t(mean(coef.)) 4.2 22.7
median(t(coef.)) 2.7 21.5 Annualized quarterly data mean(coef.) 0.0017 1.0206 0.3999 667 t(mean(coef.)) 4.6 23.8 median(t(coef.)) 3.8 21.5
The sample period (t) is Q4:1997 through Q2:2011. Balance sheet items are generally measured at the end of the quarter. Income statement items are measured using trailing four quarters data. Details on variable definitions are provided in the text. mean(coef.) is the time-series mean of the corresponding regression coefficient. t(mean(coef.)) is the t-statistic of the mean coefficient (the ratio of the time-series mean to its standard error). median(t(coef.)) is the time-series median of the regression t-statistic.