why do banks hide losses? - new york university
TRANSCRIPT

Why Do Banks Hide Losses?∗
Thomas Flanagan†
Amiyatosh Purnanandam‡
First Draft: February, 2019
This Draft: June, 2020
Abstract
Despite plenty of anecdotal evidence of hidden losses in banks, there is no sys-tematic study analyzing the economic drivers of this behavior: we simply do not getto observe what banks are hiding unless they are caught. Using a regulatory changein India that forced all commercial banks to reveal the extent of hidden losses, weuncover two key economic forces behind this behavior: lack of close supervision bythe shareholders and high-powered managerial incentive contracts. Specifically, bankswith higher shareholding by distant and passive Foreign Institutional Investors (FIIs)hide more and these effects become especially strong for banks where CEOs get highlycompensated for reported profits. Our findings caution against using high-poweredcompensation contracts linked to observable performance measures as a substitute fordiluted monitoring: instead of solving the agency problem, it can result in perversemisreporting incentives.
Keywords: underreporting, monitoring, incentivesJEL Classification: G21, G28
∗We are grateful to Jack Bao, Sugato Bhattacharyya, Jennifer Dlugosz (Discussant), Glenn Harrison(Discussant), M.P. Narayanan, Uday Rajan, Paolo Pasquariello, Avanidhar Subrahmanyam, Toni Whited,Christopher Williams as well as participants at the 2019 FDIC/JFSR Bank Research Conference, 2019 CEAR-CenFIS Financial System of the Future Conference, 2020 SFS Cavalcade, and seminars at the University ofMaastricht, Michigan, Oklahoma, Rotterdam and Tilburg for helpful comments. A previous version of thispaper was circulated as “Underreporting of Bank Risk: Does Shareholder-Manager Distance Matter?”.
†Ross School of Business, University of Michigan; email: [email protected].‡Ross School of Business, University of Michigan; email: [email protected].

1 Introduction
Intermediation comes with opacity. Banks specialize in making loans to opaque borrowers,
and consequently, their activities become nontransparent to outsiders. Therefore, truthful
reporting of banks’ profitability and riskiness is vital for almost all banking regulations such
as capital requirements, deposit insurance premiums, and bailout assistance, to name a
few. Market discipline too becomes ineffective if banks’ reported profits and risks deviate
from their actual values.1 Hence a careful examination of the economic drivers of truthful
reporting is of utmost importance to the banking literature. Unfortunately, there is very
limited empirical evidence on this important issue: we simply do not get to observe what
banks are hiding.
While we do get to see sporadic episodes of misreporting of profits and bad loans when
banks are caught by the regulators, it is rare to find systematic data on underreporting
of losses by the entire banking sector of an economy.2 Our paper exploits an unexpected
event in the Indian banking sector, where a policy change by the central bank of India
(the Reserve Bank of India, or RBI in the rest of the paper) in 2015 mandated all banks
to come clean on the extent of bad loans they had been hiding in their financial reports.
After a sector-wide supervisory audit, banks were now required to report both the extent
of underreporting of non-performing loans (NPLs), and consequently the overreporting of
profits due to inadequate provisioning against the hidden losses.3 The economic magnitude
of this shock was large: collectively banks had reported profits of over $9 billion during 2016
and 2017 before accounting for the hidden losses. Once these losses were accounted for, as
1Pillar 3 of the Basel Committee on Banking Supervision is exclusively focused on this issue: “Pillar 3 ofthe Basel Framework lays out a comprehensive set of public disclosure requirements that seek to providemarket participants with sufficient information to assess an internationally active bank’s material risks andcapital adequacy.”
2For example, Wells Fargo hid $1.2 billion of bad loans before the housing crash of 2008-09 to qualify forthe FHA insurance. Regions Bank misclassified $164 millions of losses in 2009, which was uncovered by theSEC in 2014.
3We use NPLs (non-performing loans) and NPAs (non-performing assets) interchangeably in the paper torefer to corporate loans that were in default since the RBI’s documents use the term NPAs for these loans.
1
per the RBI’s new disclosure policy, profits dropped to less than half at about $4 billion.
The unexpected revelation of these losses that have been building up due to decisions taken
in the past by the bankers provides us with an unparalleled opportunity to study the drivers
of loss hiding behavior, which in turn allows us to draw some broader conclusions about the
banking sector beyond the specific settings of India. Our setting is particularly attractive
in teasing out economic drivers of misreporting from the bank’s investment decisions since
much of the bad loans were made before the regulatory change. Specifically, the regulator
inspected the books of banks and uncovered instances of hidden losses for loans that were
typically made years ago. Banks used various methods to hide losses such as changing the
terms and conditions of loans made to a defaulting borrower to make it a “performing loan”,
extending new loans to pay for the old loans of borrowers close to default, and simply delaying
the recognition of losses. RBI’s supervisory audit uncovered these losses by inspecting the
internal books of banks, comparing the loss recognition of the same borrower across banks,
and evaluating the borrower’s financial conditions based on public information.4 Overall,
using a standard methodology, the process ended up with a fairly detailed assessment of the
extent of loan losses banks were hiding.
What could motivate a bank to hide its losses? Theoretical literature and institutional
details provide two non-mutually exclusive motivations, one driven by shareholder-regulator
conflict and the other by manager-shareholder conflict. By hiding their loan losses, banks’
reported-profits become higher than the true profits and the reported level of risk lower than
the true risk.5 Together they can lower the bank’s regulatory capital requirement, giving rise
to the shareholder-regulator conflict. Such behavior is likely to be more prevalent when banks
4For example, the former Governor of the RBI, Prof. Raghuram Rajan states in his report to India’sparliament:“Banks were simply not recognizing bad loans. They were not following uniform procedures –a loan that was non-performing in one bank was shown as performing in others. They were not makingadequate provisions for loans that had stayed NPA for a long time. .... We proceeded to ensure in our bankinspections in 2015 that every bank followed the same norms on every stressed loan. We especially lookedfor signs of ever-greening. A dedicated team of supervisors ensured that the Asset Quality Review (AQR),completed in October 2015 and subsequently shared with banks, was fair and conducted without favor.”
5Specifically, lower levels of non-performing loans mean lower loan loss provisioning, and hence higherprofits.
2
have lower equity capital or when they face a lower level of supervision from the regulators.
Additionally, managers can gain from the perception of better performance either directly
through higher compensation or indirectly through a better labor market reputation. Thus
managers are more likely to hide losses if their compensation depends on short-term reported
performance, even if it destroys long-term value for the shareholders. Managerial myopia
has been analyzed extensively in the literature (see e.g., Narayanan (1985), Stein (1989) and
Von Thadden (1995)). Rajan (1994) develops a model in which short-sighted bank managers
try to change the market’s perception of true performance by inflating earnings or concealing
losses, for example by continuing to lend to defaulters. In fact, Rajan (1994) emphasizes this
agency problem can arise ‘even if the bank is well capitalized’. This line of work suggests the
importance of shareholder-manager conflicts in explaining the hiding behavior.
We measure shareholder-manager conflicts by the nature and composition of the share-
holders of the bank. Our proxies are motivated by the basic idea that shareholders are less
likely to monitor when they are least informed about the true quality of a bank’s lending
portfolio, and when they are likely to reward the managers heavily for reported performance
measures. The fraction of shares held by the foreign institutional shareholders (FIIs) provides
a meaningful measure of this construct in our setting. These investors are likely to have less
information about the quality of loan books compared to local investors such as domestic
institutions and promoters. Some of these local investors, for example, have close ties with the
borrowers of the bank through cross-holdings and other independent business relationships.
Distance as a metric of information asymmetry has been well studied in the broader
banking literature (e.g., Stein (2002) and Petersen and Rajan (2002)). Distant monitors
are more likely to rely on hard information such as reported NPL numbers, providing
incentives and opportunities to the managers for hiding losses. Brennan and Cao (1997)
show theoretically and empirically that FII portfolios are more responsive to public signals of
information relative to their domestic counterparts.6
6A number of papers have documented evidence of information disadvantage of foreign investors compared
3
The FIIs’ greater reliance on public information creates two reinforcing effects on manager’s
misreporting incentives: (a) they are less likely to be caught, and (b) their stock price, and
hence compensation, is likely to be high with better publicly reported performance. Thus
the potential punishment from misreporting comes down, whereas potential reward goes
up. As a result, we expect increased hiding for banks with higher FII shareholding. This
narrative, however, is not obvious. FIIs can bring in their superior governance technology to
put pressure on underperforming managers, and improve governance in the domestic firm.
Aggarwal, Erel, Ferreira, and Matos (2011) and Bena, Ferreira, Matos, and Pires (2017),
for example, provide evidence that higher FII ownership boosts investment and governance
of non-financial firms. Our empirical analysis is therefore of independent interest as well:
whether the FIIs improve the disclosure practices of their portfolio banks in emerging markets
or make it worse.7
While the FII shareholding is our key proxy for shareholder monitoring, we also analyze
the effect of concentrated shareholdings and board monitoring on the hiding behavior as in
the earlier literature on corporate governance. For board specific monitoring we use standard
proxies from the literature such as the size of the board and the fraction of independent
directors (e.g., see Adams and Mehran (2012)).
Our main sample covers all commercial banks in India for fiscal years 2016 and 2017,
i.e., two years immediately after the new disclosure requirement consequent to the RBI’s
audit of the non-performing assets (NPAs) of commercial banks in 2015.8 We find that one
standard deviation increase in the FII’s shareholding is related to a statistically significant
27.2% higher underreporting of the bank’s gross NPLs. On the other hand, there is no
meaningful relationship between the domestic financial institutions (DIIs) shareholdings and
to local investors (see e.g., Kang and Stulz (1997) )7Boot and Macey (2003) highlight a fundamental trade-off inherent in any corporate governance mechanism:
proximity versus objectivity. Proximity increases the information of the monitors, but proximate monitorscan become too close to the management, losing the objectivity required for monitoring.
8Most of the hidden losses became public during these two years right after the policy change, providing uswith a clean setting to tease out the hiding behavior before the banks could change their lending or reportingdecisions in response to the new regulation itself.
4

hidden losses. Thus, our results are not coming from institutional shareholding; rather, it is
specific to distant, foreign shareholding, who are likely to possess relatively little information
and therefore incur higher monitoring costs. Lending support to the monitoring based
interpretation of our results, we show that hidden losses are higher when the FII shareholding
is more dispersed. We find no meaningful relation between board-level variables such as the
independence of the board and the hiding behavior. The result is broadly consistent with the
findings of Adams and Mehran (2012) in the context of the governance of the U.S. banks.
Further, the effect of FII shareholding remains significant even after controlling for board
level governance measures.
The FII shareholding is not randomly assigned, generating a genuine endogeneity concern
with our study. What could be the alternative explanations behind our finding that links the
FIIs to underreporting, if it is not our preferred monitoring-based explanation? A potential
threat to our identification could be the hidden ability of the managers of the banks with
high FII shareholdings. If banks with higher FII shareholdings have managers with poor
ability to recognize losses in time, then our estimates may end up picking up that effect. We
find this interpretation less plausible because the hidden losses arose mainly from the failure
to recognize obvious cases of default, for example by rolling over the debt of a defaulting
borrower.
To address the endogeneity concerns more directly and identify the monitoring channel,
we make use of the fact that FIIs’ investment in emerging markets is driven primarily by
the inclusion (and weight) of a particular stock in popular Emerging Market Indices such as
MSCI. Certain Indian banks are included in MSCI’s India index, while others are not. We
use the MSCI index inclusion as an instrument for the FII shareholding to identify the effect
of the distant shareholders on the underreporting behavior. MSCI states that the inclusion of
a stock in its index is mainly determined by factors such as liquidity, diversification benefits,
and the market capitalization of the firm. We find a strong effect of FII shareholding on the
underreporting of losses in the IV model using the MSCI index inclusion as the instrument
5
while controlling for the index inclusion factors in the regression model.9 Similar to Appel
et al. (2016), our exclusion restriction relies on the idea that controlling for these factors, the
inclusion of a bank in the index does not affect the underreporting except through its impact
on the FII shareholdings. Further, we show that our instrument does not explain variation
in the holdings of the domestic financial institutions (DIIs), proving further support to our
claim that the inclusion in the MSCI index drives variation in FII’s shareholding and not
other institutional shareholding.
In the next set of tests, we establish a link between managerial incentives and misreporting
in years leading up to the RBI’s audit. In the first test, we investigate the effect of FII
shareholding on the hiding behavior across the public-sector (i.e., majority government-owned)
and the private-sector (i.e., not government-owned) banks of the country.10 Private bank
managers earn significantly higher compensation and a large part of their compensation is
performance-based.11 Thus the private-public divide provides us with a natural variation in
the extent of benefits managers derive from inflated short-term performance metrics. We
show that private banks have higher misreporting, but it is the interaction of private banks
with FII shareholding that provides the most meaningful variation in the hiding behavior.
Within the set of private banks, one standard deviation higher FII shareholding is associated
with about 39.4% higher misreporting. Within public sector banks, FII shareholding has no
impact on misreporting.
Private and public banks also differ on dimensions other than compensation contracts. For
9There is a large literature on the use of index inclusion as an instrument for active versus passivemonitoring. A similar instrument is used in Aggarwal et al. (2011) and Bena et al. (2017). A closely relatedliterature uses the inclusion of companies in the Russell 1000 index as an instrument (Boone and White,2015; Appel, Gormley, and Keim, 2016; Schmidt and Fahlenbrach, 2017). This literature provides interestinginsights into the nature and extent of governance exerted by passive funds. While our focus is different, ourstudy contributes to that literature by bringing in a new dimension to passive investing in the internationalcontext: their reliance on hard information to reward managers who are distant.
10The majority-owner of a public-sector bank is the government of India, whereas the private-sector banksare primarily owned by non-government entities. Both types of banks in our sample are publicly traded andhave FII investments in them.
11For example in 2015 the CEO of the largest private-sector bank, the ICICI Bank, earned 24.6 timeshigher compensation than the CEO of the largest public sector bank, namely the State Bank of India (SBI).
6
example, the public-sector banks are likely to have lower shareholder-regulator conflict. As
we show, it is the interaction of FII shareholding and the private-bank status that drives our
result. Hence the result is unlikely due to shareholder-regulator conflict. A common narrative
is that private sector banks are able to attract better talent and are more efficient with
their screening and monitoring technology. Our results show that the perceived superiority
of these banks does not translate into better reporting. Our results are consistent with
Subrahmanyam (2005) that talented managers may be good at both running the firm and
committing fraud that goes undetected.
We directly assess the effect of managerial compensation on misreporting behavior in
our next test by examining the effect of compensation policies across banks. Two results
stand out. When CEOs’ compensation is high, firms underreport more. Second, the effect of
compensation on underreporting is considerably higher for banks with large FII shareholding.
Overall these results paint a clear picture: diluted monitoring from distant shareholders
combined with high compensation results in higher hiding.
To better understand the economic drivers of this behavior, we next investigate how banks
responded to increased shareholdings by the FIIs in the years leading up to the regulation
change. Using the panel of all bank-year observations from 2005 to 2015 and employing
bank and year fixed-effects specification, we show that bank’s reported profits go up and
NPLs come down as the fraction of FII shareholdings goes up.12 During the same time
period, we show that CEO’s compensation becomes more tightly linked to the reported NPL
ratios for banks with higher FII shareholdings. This result is consistent with the idea that
as the distance between the principal and agent increases, the principal is more likely to
lean on hard pieces of information for decision making (see Stein (2002)). The FIIs rely on
12Banks often disclose these measures as the key drivers of compensation for their top management. Forexample, while discussing the measures used to set compensation policy, ICICI bank in its annual report for2017-18 states that: “The main performance metrics include profits, loan growth, deposit growth, risk metrics(such as quality of assets), compliance with regulatory norms, refinement of risk management processes andcustomer service. The specific metrics and weightages for various metrics vary with the role and level of theindividual.”
7

reported profitability and NPLs to evaluate the local managers, and the managers respond
by providing better-than-actual NPLs.
These results paint a broad picture: performance-sensitive contracts may not be a complete
substitute for the lack of monitoring. In fact, without proper monitoring, linking compensation
to observable performance metrics can have a deleterious impact on the agent’s behavior.
U.S. institutions are known to deploy high powered performance-based incentive contracts in
their firms (see Hartzell and Starks (2003)). Our study shows that the effectiveness of such a
practice crucially depends on the information set of these institutions.
Our paper provides a first look at how shareholder monitoring and managerial incentives
affect the hiding decision using precise data on hidden loans. We build on various streams
of literature in finance and accounting. First, our work connects to the literature on the
measurement and monitoring of risks in banks (e.g., see Behn, Haselmann, and Vig (2016),
Begley, Purnanandam, and Zheng (2017), Bushman and Williams (2015) and Plosser and
Santos (2014)). Second, our paper relates to the literature on shareholder monitoring
(e.g., see the survey in Edmans and Holderness (2017)) and incentives to commit fraud.
Using accounting restatements, Burns and Kedia (2006) show that option-based managerial
incentives are positively related to incentives to misreport. Jayaraman and Milbourn (2015)
underscore the importance of audit quality in this link. Povel, Singh, and Winton (2007)
develop a theoretical model linking monitoring costs and misreporting incentives.
We also contribute to the literature on the effect of investments by institutional investors,
specifically foreign shareholders, on domestic firms (see e.g., Gillan and Starks (2007), Bena
et al. (2017)). Our paper highlights a previously undocumented cost of FII investment:
their reliance on (observable) performance-sensitive compensation contracts can facilitate
untruthful reporting by the domestic firms.
Finally, our paper relates to the literature on the detection of zombie lending and its
impact on the real economy (e.g., see Caballero, Hoshi, and Kashyap (2008)). Specifically
8

in the Indian context, Kulkarni, Ritadhi, Vij, and Waldock (2019) study the build-up of
credit to insolvent firms by Indian banks and its implication for the allocation of credit in
the economy. Chari, Jain, and Kulkarni (2019) investigate the role of regulatory forbearance
on the buildup of zombie loans in India. Blattner, Farinha, and Rebelo (2019) develop a
measure of zombie lending for Portuguese banks to study the impact of a weak banking sector
on productivity.
2 Indian Banking Sector and the Policy Change
The Indian banking sector is characterized by very large nation-wide banks that are either
a private-sector bank or a public-sector one. In the public-sector banks, the Government of
India is the majority, but not the only, shareholder. The private-sector banks have practically
no direct government stakes. After the liberalization of the Indian economy in 1991, several
regulations that earlier restricted shareholdings by foreign investors were relaxed. Over time,
Foreign Institutional Investors (FIIs) have taken a considerable stake in Indian banks, both
in the private-sector banks and the public-sector banks. Other prominent shareholder groups
are “promoters”, “domestic financial institutions”, “corporate bodies”, and “individuals”.
Promoters are either the Government of India for public sector banks or individuals for
private sector banks. We provide descriptive statistics on the fraction of shares held by each
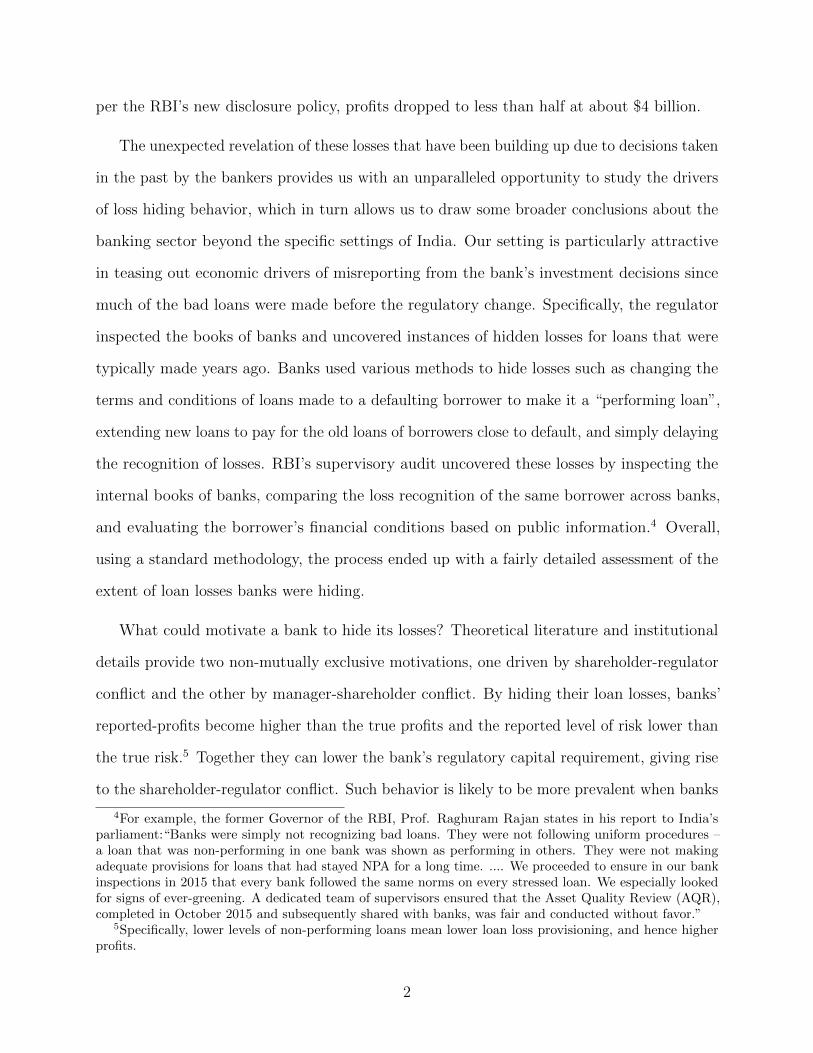
of these groups later in the paper. Figure A2 provides an example of the shareholding pattern
for Yes Bank, a bank in our sample.
The largest public sector bank, the State Bank of India (SBI), has an asset base of 328
billion dollars as of 2015, whereas two of the largest private sector banks ICICI Bank and
HDFC Bank have assets of 104 and 94 billion dollars, respectively on the same date. All
three banks, as well as most other banks in the country, have branch networks across the
country. Some banks specialize in regional markets, but even these banks are generally very
large.
9

2005− 2014
Earlier Disclosure Regime
2015
AQR
2017
NPL Divergence Discovered
2018
Bad loans made, hidden
Evergreening, Underprovisioning
RBI Audit Report Made Public
Post - April 2017
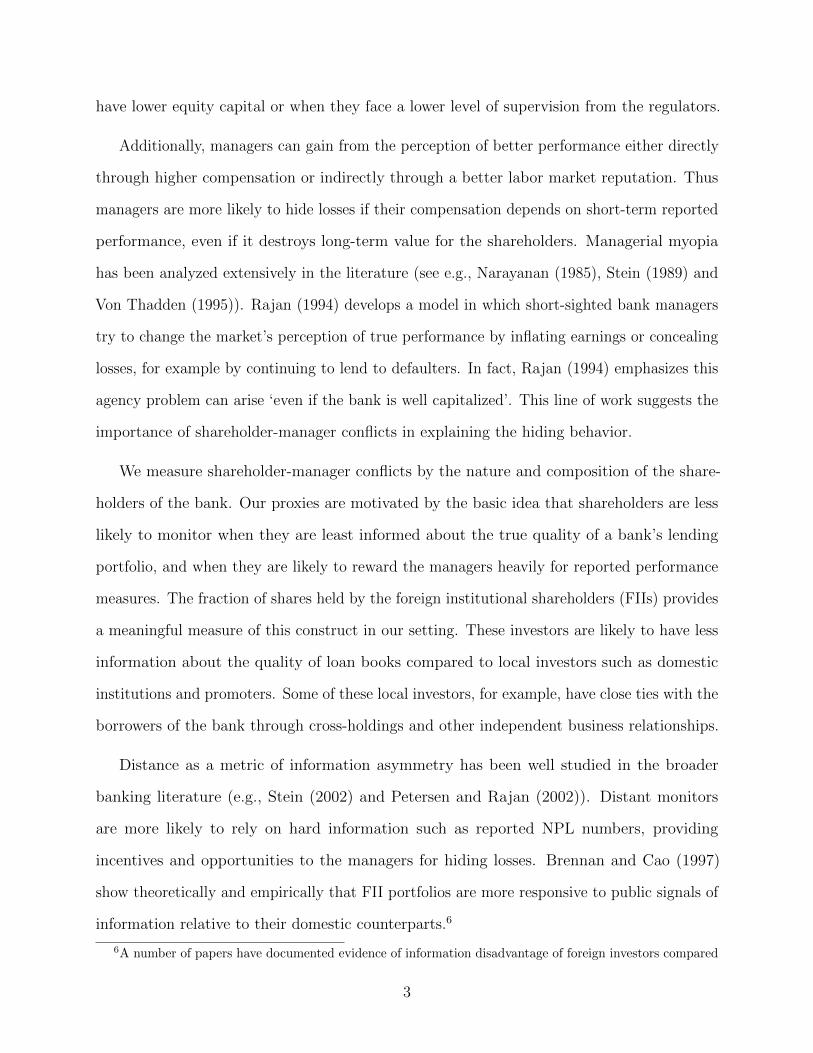
The issue of non-performing loans has been an important issue for market participants
and regulators in India for a very long time. Chari et al. (2019) provide an excellent overview
of the evolution of non-performing loans in India starting from the mid-2000s. In 2015, the
then Governor of RBI, Prof. Raguram Rajan, took several steps to deal with the problem of
rising NPLs in Indian banks. One of the key steps was to recognize the extent of NPLs that
banks truly had. This line of thinking motivated the first Asset Quality Review (AQR) by
the RBI in 2015, the beginning of the process for detection and better reporting of NPLs in
the country.
In its monetary policy statement dated September 29, 2015, RBI explicitly discussed
the issue of underreporting of NPLs and provisions: “As a part of its supervisory process,
the Reserve Bank assesses compliance by banks with extant prudential norms on income
recognition, asset classification and provisioning (IRACP). There have been divergences
between banks and the supervisor as regards asset classification and provisioning. In order
to bring in greater transparency, better discipline with respect to compliance with IRACP
norms as well as to involve other stakeholders, the Reserve Bank will mandate disclosures in
the notes to accounts to the financial statements of banks where such divergences exceed a
specified threshold. Instructions in this regard are being issued separately.”
RBI mandated that banks report the divergence in their publicly reported NPLs and
NPLs assessed by RBI as per its supervisory audit in a specified format if the extent of
underreporting exceeds some threshold. As per the RBI’s circular “In order to ensure greater
transparency and promote better discipline with respect to compliance with IRACP norms, it
has been decided that banks shall make suitable disclosures as per Annex, wherever either (a)
10

the additional provisioning requirements assessed by RBI exceed 15 percent of the published
net profits after tax for the reference period or (b) the additional Gross NPAs identified by
RBI exceed 15 percent of the published incremental Gross NPAs for the reference period,
or both.” Thus banks that exceeded the 15% divergence level, as described above, were
required to disclose the extent of divergence, called the NPA or NPL divergence, in their
annual statements/financial results. RBI provided a very precise format to disclose these
losses and we present one such example from Yes Bank in Appendix A. We obtain our data
from these public disclosures.
Banks began to report the extent of hidden losses starting from fiscal year 2015-16, and
most of the underreporting were uncovered in the first two years after the new policy, i.e., in
2015-16 and 2016-17. We collect data from the financial statements of all Indian commercial
banks for both 2015-16 and 2016-17 fiscal years for our main tests. In additional analyses,
we also include the divergence data from 2017-18 and 2018-19. As expected, the level of
divergence came down significantly in these two years since the banks had enough time to
adapt to the new regime: the regulatory shock uncovered a large number of hidden losses
soon after the RBI audit, providing us with an excellent setting to analyze their economic
drivers in the immediate aftermath of the policy change.
While we do not have access to the precise data and methodology used by RBI to detect
the divergence, some general principles are well known. In general, a loan is divergent if it is
misclassified according to RBI IRACP norms for non-performing loans13. In its initial AQR
conducted in 2015, the RBI focused on issues such restructured loans where original terms
of the loans were modified to avoid classifying a bank as an NPLs. For example, a bank
can delay classifying a loan as a bad loan by continuing to lending to a defaulting borrower,
i.e., by ever-greening the loan, sometimes called the ‘extend and pretend’ policy.14 Second,
13The full list of IRACP norms are available at https://www.rbi.org.in/Scripts/BS_
ViewMasCirculardetails.aspx?id=990814As per RBI’s Deputy Governor Mr. N.S. Vishwanathan’s address to the industry practitioners on August
30, 2016: “During the five years to March 2015, banks have resorted to restructuring of loans in many casesto postpone recognition of non-performance, or what we now call ‘extend and pretend’, rather than using it
11

if a loan to the same corporate borrower was classified as NPL by one bank, other banks
with similar loan terms were required to classify their loans as NPLs as well. Overall, the
entire effort was geared towards cleaning up the accounts of India’s bank, a policy initiative
undertaken by the then governor of the bank.
While the issue of the build-up of hidden loans was debated for some time (see Chari et al.
(2019)), it was not clear whether the RBI or the government will indeed conduct such an
audit. The consequences of such misreporting for the top managers of the banks were also not
clear. For example, no CEO of the top bank of the country was punished for the suspicion of
hiding losses before the RBI’s audit. Market observers attributed the changes in the RBI’s
policy largely to the change in its top leadership. Even from the market’s perspective, the
extent of NPL divergence was not completely anticipated. Figure 2 presents the average
return around a window of 5 days of the announcement of NPL divergence by the banks
in the first year of reporting. The divergent banks had a negative abnormal return of -6%,
compared to +1% return for banks that did not report any divergence. In sum, the regime
change in the RBI’s audit policy provides us with a setting where the lending decisions were
made under the assumption of partial or no knowledge of the detection of hidden losses and
the economic consequences that followed.
3 Data and Sample
We collect data from three primary sources: annual reports of banks during 2016 and
2017, RBI’s statistics on Indian Banks, and Prowess database. Data on misreporting comes
from the annual reports. As discussed earlier banks were required to report both the extent
of hidden NPLs and the resulting underreporting of loan loss provisions as a note to the
shareholders if such losses exceeded a certain threshold. Data on financial conditions of banks
as a tool to preserve the economic value of the units as intended. As a result, until 2016 the restructuredassets constituted more than 50% of the stressed assets of all scheduled commercial banks masking the actualextent of deterioration of the loan portfolios....”
12
and shareholding patterns come from RBI and Prowess.
Our sample covers all scheduled commercial banks of India that were required to report
NPA divergence in their annual report. This covers practically the entire banking sector
in the country. The only significant group that we miss from this sample is foreign banks
operating in India. This group has only a minor market share in the country. Our main test
linking NPL underreporting to FII shareholding is based on fiscal year 2016 and 2017 data.
In total, we have 73 bank-year observations covering 37 distinct banks. Of this sample, 53
observations are for bank-years that reported NPA divergence, i.e., for these banks the extent
of underreporting exceeded the 15% threshold criteria in the year. In our regression analysis,
we use both an ordinary linear regression analysis and Tobit model to tease out the economic
drivers of hiding.
It is worth emphasizing that the relatively smaller sample size presents some challenges in
terms of the power of the tests. However, since we have the entire population of banks in India,
our analysis does not have any sample selection concerns. In addition to the NPL divergence
test, we also investigate the relationship between FII shareholding and the firm’s performance
over 2005-2015 period to understand the dynamics of firm behavior and remuneration in
response to FII shareholding. These results are based on the sample of all private and public
sector banks during this period, with a panel of 377 bank-year observations.
3.1 Descriptive Statistics
Table 1 provides summary statistics of key variables used in our study broken down into
two periods: (i) 2016 & 2017, i.e., the main sample for our tests on NPL hiding (Panel
A), and (ii) 2005-2015 period based on which we investigate firm performance and CEO
remuneration in periods leading up to the policy change on disclosure of the NPLs (Panel B).
As shown in Panel A, the extent of underreporting has been quite large. Out of 37 banks
in the sample, 32 reported divergence at least once. Thus 86% of banks exceeded the 15%
13

threshold for reporting requirements at least in one of these two years. Of the reporters, the
average firms underreported 23% of its NPL and 18.5% of provisions. Figure 1 demonstrates
the magnitude of underreporting on a yearly basis.
To put it in the aggregate context, during these two years banks in our sample reported
aggregate profits of 9.2 billion dollars before the detection of underreporting. Once we
account for the underreporting, 58% of these reported profits disappear due to additional
loan loss provisions the banks were required to make on account of underreporting. In terms
of aggregate NPLs, the banking sector as a whole underreported (gross) NPL of 20 billion
dollars which is 172% of the reported incremental (gross) NPL during these two years. Thus
our setting is economically very meaningful. Indeed, there has been an intense debate in the
regulatory as well as the investment community in India about these NPL divergences and
its implication for financial stability and bank lending.
Contrasting the profitability numbers in Panel A and B, it is clear that the banking
sector reported much better performance during 2005-2015 period, and was under stress in
2016-2017 even before accounting for the hidden losses. Indian economy grew at an average
annual growth rate of 7.73% during 2005-2015, and the banking sector grew with it. However,
as pointed out earlier banks made significant amounts of bad loans during this period that
started to reflect in their balance sheet in the later parts of this period.
Panel A also provides the summary statistics of our key explanatory variables. Institutional
investors – domestic and foreign combined – hold about 32% of shares in banks, with FIIs
holding about half (16%). Table 2 provides a more detailed breakdown of the shareholding
structure across different classes of shareholders. Broadly they can be divided into three
groups: promoters, institutions, and non-institutions. Promoters are the initial sponsors of
these banks. For public sector banks, it is the government of India, whereas for private banks
typically the promoter is an individual or a family. The median number for promoter holding
is 61% because the government holds the majority stake in the public sector banks. More
14

important for us, there is a large cross-sectional variation, both within private and public
banks, along these dimensions. FII shareholding ranges from 3.43% at the 25th percentile to
24.5% at the 75th percentiles. We exploit these variations in our tests.
4 Results
Our primary test uses an ordinary linear regression model for the subset of banks that
disclose positive values of NPL divergence. The dependent variable is the log ratio of actual
NPL to the reported NPL at the bank-year level. Since banks were required to disclose
the amount of NPL divergence only if it exceeded a certain threshold, we also complement
the linear regression model with a Tobit model.15 As discussed earlier, the value of the
reporting threshold was bank-specific, 15% of incremental NPL of the bank during the year.
Hence we need to transform these variables to ensure that the left censoring occurs at the
same point for every bank. We do so by transforming the NPL numbers in the following
manner: (Actual NPL - Reporting Threshold)/Reported NPL. For a bank that falls just at
the reporting threshold, the reported NPL equals the difference between the actual NPL and
the threshold value, i.e., the transformed value for such a bank equals one.16 We then take
the log transform of this variable to construct our dependent variable for the Tobit regression.
With the log transformed values, the left censoring occurs at zero for each bank. We provide
an example of this construction method in Appendix B.
We first present the extent of underreporting by banks that exceeded the reporting
threshold across different quintiles of FII shareholdings, measured at the end of 2015 fiscal
year. The results are presented in Figure 3. A remarkable pattern emerges from this plot.
15We also present the estimation results from an alternative econometric approach: interval regression inAppendix A3.
16The disclosure requirement has two criteria. We construct the censored variable based only on one ofthe two criteria, the primary one: i.e., the divergence is above 15% of incremental NPA. The other criteria,namely the divergence exceeding 15% of net profits, complicates the economic interpretation because somebanks have negative profits. This choice has only a minor impact on our analysis and inference.
15
For the first three quintiles of FII shareholding, which works out to shareholdings of less
than 9.48%, the extent of underreporting is much lower compared to the top two quintiles.
The positive relationship between FII shareholding and underreporting is almost monotonic.
Compared to the lowest FII shareholding quintile, banks in the highest quintile have 58%
higher underreporting.
Table 3 presents the regression results that account for the size and capital position of
the bank, as well as an indicator variable that captures the year fixed effect, i.e., whether the
underreporting is from fiscal year 2016 or 201717. Panel A presents the OLS regression results
for the set of banks that exceeded the 15% threshold. As seen in Column (1), increased FII
shareholding is associated with significantly higher hiding of losses. For the ease of exposition,
we standardize all explanatory variables by subtracting the respective mean and dividing the
difference by the standard deviation of the variable18. Thus all estimates represent the effect
of one s.d. change in X-variable on the Y-variable. One s.d. change in FII shareholding is
associated with 27.2% higher underreporting. There is no meaningful relationship between
the capital position of the bank, our key proxy for the shareholder-regulator conflict, and the
hiding behavior.
Columns (2)-(3) show that it is only the FII shareholding, and not the domestic institu-
tional shareholding, that is driving our results. For example, compared to Column (1) that
uses FII shareholding as the main explanatory variable, in Column (2) that instead uses DII
shareholding, the R2 of the model drops from 46% to 21%; while the coefficient is highly
significant for FII, the estimate on DII is statistically zero. Hence our results point to a
special effect of foreign investors, and not simply institutional investors.
Panel B uses the entire sample, including banks that were below the underreporting
threshold, in a Tobit framework19. One s.d. higher FII shareholding is associated with
17We measure FII shareholding and other explanatory variables in 2015, before the underreporting wasdisclosed.
18The only exception is indicator explanatory variables.19Results using Interval Regression are similar and reported in Appendix D.
16

about 35.6% higher underreporting, and the result is significant at 5% level. The economic
magnitude is in line with the OLS estimates discussed earlier.
In our next test, we investigate whether the concentration of FII shareholding matters for
hidden losses. Concentrated holdings by shareholders are likely to increase the benefits of
monitoring. When there are fewer FII shareholders for the same level of total shareholdings,
the monitoring is likely to be higher. In order to capture this effect, we create a variable
1No. FII
that measures the inverse of the number of FIIs present in a bank, i.e., a measure of
concentrated shareholding. We interact this variable with total FII shareholding to assess
whether the positive effect of FII shareholding on the hiding behavior changes when the
shareholders are less dispersed.
Results are provided in Table 4. We find a negative and significant coefficient on the
interaction of FII shareholding and our concentration measure ( 1No. FII
). Further, the
independent effect of total FII shareholding is even higher compared in this model that
includes the interaction term: one s.d. increase in FII shareholding is associated with 35%
higher hiding in this model compared to the corresponding estimate of 27% in the model
that does not control for the interaction effect. Overall, these results show that banks hide
more when their shareholders are distant and dispersed. As shown in Panel B of the Table,
the Tobit estimates are even stronger.
Other monitoring devices: In our next set of tests, we focus on board monitoring
using a number of proxies for this variable based on prior literature. Results are provided in
Table 5. We find that board size, the duality of CEO and the chairman role, and the fraction
of board outsiders do not significantly explain variation in bank hiding. We do find some
evidence of regulatory monitoring on the board: banks with RBI members on the board are
associated with 28.3% less underreporting. In Column (6), we include all board monitoring
variables in one specification. Only RBI membership is significantly associated with bank
hiding at the 5% level. We introduce FII shareholding to the model in Column (7), and its
17

coefficient is still positive, significant, and very close in magnitude to the original estimate. A
clear pattern emerges from these findings: FII shareholding is one of the key drivers of loss
hiding behavior, with board monitoring having little-to-no impact.
4.1 Instrumental Variable Regressions
A key concern with our interpretation that lack of monitoring by FIIs causes hiding
behavior is that it is not the FII’s shareholding but some omitted variable that drives both the
FII’s shareholding and hiding behavior. What could potentially be these omitted variables
that explain the variation in FII shareholding and loss hiding at the same time? One natural
candidate is the hidden governance characteristics that attract higher FII shareholding and
at the same time also incentivize untruthful reporting. As per this alternative, FIIs invest in
firms with poor governance characteristics and our estimate simply captures that correlation.
This alternative explanation does not seem plausible based on earlier work that shows that
FIIs are more likely to invest in firms with better governance on other observable dimensions.
Hence the direction of bias should go against our findings. Further, we control for several
governance variables such as board size and independence and show that the relation between
FII shareholding and underreporting does not get explained by these variables.
However, if banks with higher FII shareholding are simply bad at assessing the extent
of NPLs they have, then our results could be due to the hidden ability to understand
NPLs. Could our results be driven by this force? We address this more directly by using an
interesting driver of FII shareholding in a firm: its inclusion in broadly tracked MSCI index.
The MSCI emerging market has a considerable influence on how an FII picks a stock within
a country. The index provides weights based on the country, sector, and firms within the
sector to provide a well-diversified benchmark to foreign investors. The inclusion is based on
a number of factors, the most important of them being the size of the market capitalization,
float-adjusted market capitalization, liquidity (as measured by trade volume), fraction of
18
shares available to foreign investors (greater than 15%), and minimum trading time. When
the index changes the weights of a country or a particular stock in the country, the FII’s
investments in the company changes too. For example, in May 2019, the MSIC emerging
market index increased its weight on Chinese Class A shares, a move that may have resulted
in an outflow of almost $1 billion from the Indian markets as per some analysts.20
Motivated by these features of the index and its impact on FII’s shareholding in a firm,
we use the inclusion of a bank in the index as an instrument for our IV regression. The
instrument, MSCI, is equal to 1 if the bank’s stock is included in the MSCI India domestic
index in May 2015 and 0 otherwise.21 The banks in the index at this time were HDFC bank,
ICICI Bank, Kotak Bank, Axis Bank, State Bank of India, IndusInd Bank, Yes Bank, and
Bank of Baroda. Note that the index includes both private and public sector banks.
The exclusion restriction relies on the assumption that the inclusion in MSCI index is
not influenced by omitted variables of concern such as the hidden ability of the managers
to understand and account for the true levels of NPLs. This is a plausible assumption
since indices such as MSCI are often designed to capture the diversification benefit these
stocks provide to an international investor and the fact that change in weight depends on a
host of factors including the changes in weight across countries, sectors, and companies. A
similar instrument is used in Aggarwal et al. (2011) and Bena et al. (2017). A closely related
literature uses the inclusion of companies in the Russell 1000 index as an instrument (Boone
and White, 2015; Appel et al., 2016; Schmidt and Fahlenbrach, 2017) for passive investing to
understand whether such investments affect firm outcomes. Unlike the Russell index which
relies primarily on float-adjusted market capitalization, the MSCI index relies on multiple
criteria mentioned above to determine index inclusion. Following Appel et al. (2016), we
control for the determinants of index inclusion in our empirical specifications22. Therefore,
20See https://economictimes.indiatimes.com/markets/stocks/news/msci-rejig-may-lead-to-1-billion-fii-outflow-from-india/articleshow/69321966.cms?from=mdr
21The same set of banks in the index was constant through November 201622Data on the stocks’ free float shares to compute float-adjusted market capitalization is taken from
Datastream. We define liquidity as the annualized traded value ratio, the liquidity measure used by MSCI.
19

our identification strategy is similar in spirit to Appel et al. (2016): conditional on the index
inclusion criteria, we assume that the MSIC inclusion affects hiding behavior only through
its impact on FII’s shareholding in the bank.
We provide the IV estimation results in Table 6. Panel A produces the OLS estimates,
Panel B Tobit. We document the first stage regression results, the reduced form results, and
finally, the second stage results in both panels. We focus on the model specification that
includes the index inclusion criteria in addition to our instrument: the indicator variable
for index inclusion. As shown in Column (2) of Panel A our instrument is strong in the
sense of statistical relevance. Inclusion in MSCI index is associated with 1.31 standard
deviations or 18.68% higher holding by the FIIs. The first stage F-statistic for the excluded
instrument is about 10 and the R2 of the model is 82%: we have a strong, relevant instrument.
Figure 4 shows the relevance of this instrument graphically by plotting the average FII
shareholdings across three groups: banks included in the MSCI index, non-included private
banks, and non-included public banks. Clearly, MSCI inclusion strongly affects the extent of
FII shareholdings in a bank.
The reduced form estimate linking underreporting to the instrument directly shows that
banks that were included in the MSCI index underreported 75.9% higher NPLs. As we
mentioned earlier, MSCI index included both private-sector and public-sector banks. These
banks collectively underreported significantly higher amounts of NPLs compared to all other
banks. In fact, comparing MSCI included banks with the rest of public and private-sector
banks, we find that it is the MSCI subsample that underreported the maximum amount of
NPLs. MSCI group underreported by 64.6%, compared to 21.6% for the remaining private
sector banks and 9.2% for the remaining public sector banks as shown in Figure 5. Column (6)
The first step to compute the annualized traded value ratio is to take the median daily trading value overa month. Next, MSCI takes the monthly traded value ratio by dividing the median daily trading value bythe float-adjusted market capitalization at the end of the month. The annualized traded value ratio is the12 month average of the monthly traded value ratios multiplied by 12. Foreign Room is calculated as %Maximum Foreign Investment - %Existing Foreign Investment. In India, private and public banks havea %Maximum Foreign Investment of 74% and 20%, respectively. We take % FII as % Existing ForeignInvestment.
20
produces the second stage IV estimates: one s.d. higher FII shareholdings is associated with
about 57.8% higher underreporting. The effect is statistically significant at 1%. Compared
to the corresponding OLS estimate of 27%, IV estimates are slightly higher. IV estimates
are also larger after controlling for determinants of index inclusion: market capitalization,
float-adjusted market capitalization, liquidity, and foreign room. This is consistent with
our earlier argument that active investment by the FIIs target firms that are better at
governance, hence the selection bias should go against our findings. When we tease out the
variation that comes from passive index based investing, we more likely recover the portion of
non-information based investing and our results become slightly stronger in economic terms.
4.2 Private-sector vs. Public-sector Banks
We investigate the effect of private-sector versus public-sector banks with two key motiva-
tions. First, we want to investigate if our results are simply driven by the government’s stake
in the bank instead of distant monitors. Second, private-sector banks have much stronger
incentive based compensation contracts compared to their public-sector counterparts. Hence
this test allows us to see whether our results are driven by banks whose managers stand to
gain more from underreporting.
Table 7 documents the results. For expositional simplicity, we reproduce the estimates
linking FII shareholding and underreporting in Column (1). Column (2) shows that private
banks had a much higher level of underreporting, both based on OLS estimates (Panel
A) and Tobit estimates (Panel B). Private banks have about 57% higher underreporting
conditional on reporting their NPA divergence (Panel A). Notice the model fit of Column
(1) versus Column (2). FII shareholding explains larger variation in underreporting (R2 of
46%) than the private-public divide (R2 of 34%). The key estimates are contained in Column
(4) that includes both these variables – FII and Private – along with their interaction term.
In the OLS model, the interaction term is positive and significant, whereas the individual
21
effects are statistically insignificant. Thus the higher level of underreporting is concentrated
within private banks with high FII shareholdings. The interaction term is positive and
significant in the Tobit model as well. As expected, there is a high positive correlation
between FII and Private (0.8676 correlation coefficient). However, even within the set of
private banks as the FII shareholding increased banks underreport more. Thus our results
linking FII to underreporting are not simply explained away by the private-public divide.
This points to the importance of the shareholder-manager conflict driving the results as
opposed to the shareholder-regulator conflict. We explore the second possibility that it is the
compensation-based incentives of private sector banks that are driving our result in our next
test.
4.3 Compensation
We gather data on the total remuneration of the CEOs of all the banks in our sample.
First, we hand collect the names of each bank’s CEO’s over the period 2005-2017. Second,
we merge this information with the board of directors data in Prowess, which provides
information on total remuneration. We begin our analysis with some univariate results. In
Figure 6, we plot the average underreporting by banks that fall in different quintiles based
on the remuneration of the CEO. The relationship is stark. As CEO compensation increases,
the extent of misreporting increases in a monotonic fashion as well. Compared to the lowest
paid CEO quintile, the higher paid CEO’s bank has 65% higher misreporting. Observations
in the top two quintiles are all private sector banks.
Regression results are provided in Table 8. Banks with highly compensated CEOs
underreport more. One standard deviation higher compensation is associated with about 26%
higher underreporting (Column 1). As shown in Column (2), the interaction term between
FII shareholding and remuneration is positive and significant. The finding shows that banks
with larger FII shareholding and large remuneration are the ones that underreport more. This
22
result is a more direct version of our earlier result where we show that FII shareholding in
private banks is the main driving force behind our results. However, the remuneration based
test allows us to establish the economic channel more precisely: it captures the variation in
compensation across banks and shows that when CEOs stand to gain more they hide more.
4.4 Historical Performance
We now look at how CEOs were compensated for their performance during 2005-2015,
i.e., during a period when the disclosure policy was relatively less truthful, to gain further
insight into the relationship between compensation contract linked to hard information and
misreporting behavior. We proceed in two steps to do so. We first investigate whether
banks reported better performance as FIIs increased their shareholdings. Subsequently, we
investigate whether the CEOs were rewarded more for improved performance. Together,
these tests allow us to link increased FII shareholding to improved hard performance and
managerial incentives to hide losses.
In Table 9, we estimate the following model linking FII shareholdings to reported perfor-
mance:
perfit = αi + yeart + β × FIIit + εit
perfit measures bank i’s performance in year t, and FIIIit is the percentage shareholding
of the FIIs in that bank-year. The model includes both bank and year fixed-effects to soak
away yearly variation in the performance of the banking sector as well as bank specific
differences in performance. We use three measures of performance: the ratio of NPLs to total
assets, the profitability of the bank as measured by its net profits scaled by total assets, and
the level of outstanding loans. The model is estimated with 377 bank-year observations from
2005 to 2015, i.e., using information from the period before the RBI’s regulation change.
A clear pattern emerges. As FII shareholdings increase, banks report lower levels of
23

NPLs (Column 1), higher profitability (Column 2), and higher growth in the lending portfolio
(Column 3). A one s.d. increase in FII is associated with a 0.686% lower NPL-to-Asset ratio,
0.178% higher net profit ratio, and 15.6% more loans. Thus, FII shareholding is associated
with high growth and profits, all with lower NPLs. Given our earlier results on underreporting,
clearly some of this better reported performance came from hiding of the losses, rather than
more prudent lending decisions. Did the CEOs benefit from this? We answer this question
by investigating how CEOs were compensated during this period. We regress their (log of)
annual compensation on performance metrics, including NPLs, to assess how tightly their
compensation is linked to observable, reported performance metrics. Results are provided in
Table 10.
We first provide a regression of compensation on key performance metrics: profitability,
NPL ratio, growth rate, and asset size on the entire sample. The model includes bank and year
fixed effects. CEOs get compensated more when their banks show lower NPLs. The economic
magnitude of NPL is highly significant. A one s.d. lower NPL ratio (or a 3.53 drop in NPL
ratio) is associated with 26.2% higher CEO compensation. The model as a whole explains a
reasonable portion of variation across bank CEO’s compensation with an overall R2 of 86%
and within-bank R2 of 6%. Next, we break our sample into two groups: high and low FII
shareholding based on the median value of the average of each banks’ FII shareholding over
the entire sample. A clear pattern emerges: these performance metrics explain a significantly
higher fraction of variation in CEO compensation when FII shareholding is high: overall
and within R2 of 91% and 13%, respectively. In contracts for low FII shareholding banks,
the corresponding R2 are much lower at 40% and 1%. These results show that FIIs depend
more on reported performance metrics, especially the levels of NPLs, in setting the CEO’s
compensation contract. As shown in Columns (2) and (3) of the Table, for the higher FII
shareholding group, one s.d. lower NPLs is associated with 27.0% increase in the CEO’s
compensation, whereas the corresponding number is a statistically insignificant 5.5% for the
lower FII shareholding group. Thus banks with higher FII shareholding link their CEO’s
24

compensation much more tightly with these observable metrics, especially with the level of
NPLs.
We explore this analysis further by estimating the following model with both the high and
low FII shareholding groups together. This analysis allows us to pin down the compensation-
NPL relationship as a function of the level of FII shareholding and complements the results
presented above that estimate this relationship separately for the two groups.
compit = αi + yeart + β ×NPLit + γ × FIIit + θ × FIIit ×NPLit + εit
As shown in Column (4), there is a negative and significant coefficient on the interaction
term (coefficient θ in the regression above), indicating that as FII shareholding increases, the
CEO’s compensation becomes more sensitive to the reported levels of NPLs. Column (5)
supplements this analysis by showing that the CEOs of banks with higher FII shareholding
were paid more. Combined with the estimates of Column (4), it is clear that the lower levels
of NPLs contributed significantly to the higher compensation of these CEOs.
Together these results show that distant monitors rely more on observable metrics to
compensate their managers. This is consistent with a model such as Holmstrom (1979), in
which it is optimal to compensate managers in opaque firms with high pay-for-performance.
Without specifying the entire “action space” of managers, however, these are suboptimal
contracts if CEOs are able to manipulate accounting profits to boost their compensation
(Healy (1985)). Managers, unfortunately, engaged in misreporting to show better performance
to benefit from pay-for-performance contracts. Thus distant monitors should be cautious in
using performance linked contracts as a substitute for information-gathering and monitoring.
25

4.5 Robustness Tests
We conduct a series of robustness checks to provide further support to our main claim
that distant monitors coupled with performance-linked compensation contracts are the key
driver of our findings. First, we re-run our earlier tests using a set of richer control variables.
Our base tests so far controlled for the firm’s capitalization ratio, size, and year fixed effects.
Now we include additional variables such as asset growth and the level of GNPA scaled by
total assets in the model. The asset growth rate accounts for the investment opportunities of
the bank, whereas the level of GNPA captures the quality of the investment portfolio itself.
Table A4 in Appendix D presents these results. Our main results remain the same.
4.5.1 IV Placebo
Clearly, we cannot test the exclusion restriction of our instrument, MSCI index inclusion.
However, we can rule out any mechanical relationship between the instrument and underre-
porting using a placebo test in the following manner: we use MSCI inclusion as an instrument
for DII shareholdings. This placebo test allows us to comment on whether our instrument is
picking up variation in institutional holding rather than distant monitors. We regress DII
shareholding on the MSCI instrument in Table A5 in Appendix D using the same first stage
specification as in our actual IV test. As expected, the coefficient is not statistically different
from zero and has a very small t statistic. Furthermore, the F statistic is small and less than
1 in all specifications.
This result is useful because it shows the instrument works intuitively: MSCI index
inclusion only attracts FII but not DII investment. DII shareholders, whom we have shown
to be better monitors, are unaffected by MSCI inclusion. Therefore, we can at least rule out
that MSCI inclusion is related to DII investors with preferences for banks with lower NPL
underreporting.
26

5 Conclusion
We show that managers are more likely to hide losses, and thus inflate short term profits
when their shareholders are distant. Distance amplifies information frictions and hinders the
shareholders’ ability to properly monitor the managers. Thus managers are able to engage in
misreporting without facing any significant probability of getting caught. When they stand
to gain from inflated performance measures, misreporting incentives go up as well. At a
very broad level, our paper shows that distant monitors should use caution in relying on
performance-linked compensation contracts as a substitute for monitoring: it can make the
problem worse by providing the managers an incentive to engage in untruthful reporting.
27

Figure 1: Economic Magnitude of Underreporting
Figure 2: Event Study Reaction
28

Figure 3: GNPA Underreporting by quantiles of %FII
Figure 4: FII Shareholding by MSCI Inclusion Instrument
29

Figure 5: GNPA Underreporting by MSCI Inclusion Instrument
Figure 6: GNPA Underreporting by quantiles of Total Remuneration
30

Table 1: Summary Statistics
Table 1 contains summary statistics for the banks in our sample. Panel A reports measures in 2016 and2017 during which we observe banks underreporting. Panel B reports summary statistics over the historicalperiod 2005-2015. GNPAUR and ProvisionUR are the amounts of GNPA and Provisions underreportingscaled by total assets. Capital is the Tier 1 Capital Ratio. %Inst and %FII are the percentages of bankequity owned by institutional and foreign institutional investors. %FII
No. FII is the average shareholding byFII. %RBI is the percentage of bank equity owned by RBI. RBI Mem is an indicator equal to 1 if boardmember represents the RBI. Board Size is the number of board members. CEOChair is an indicatorequal to 1 if the chair is also the CEO of the Bank. %Outsiders and %Audit Board Outsiders are thefraction of board and audit board members who are outsiders to the bank. GNPA is the amount ofgross non-performing assets scaled by total assets. Provisions are the amount of provisions for grossnon-performing assets in millions of dollars. NetProfit is net profits after taxes in millions of dollars.Total Assets is total assets in millions of dollars. Remun. is the amount of total remuneration awardedto the bank’s CEO in dollars. Lev is total debt plus total deposits divided by total assets. TobinQ isbank book value divided by market value of bank. ROE and ROA are the bank’s return on equity andreturn on assets in that fiscal year. All variables are measured at the end of a bank’s fiscal year.
Panel A: Observed Underreporting Period: 2016-2017
N Mean SD P10 P25 P50 P75 P90
GNPA UR 53 23.022 34.445 3.103 5.913 11.988 24.219 53.359Provision UR 53 18.477 22.272 2.849 4.944 10.058 20.570 44.899Capital 73 9.907 2.808 7.520 8.020 9.050 11.260 14.210%Inst. 73 31.853 18.983 13.640 17.780 25.940 41.760 61.390%FII 73 16.101 14.257 1.500 3.430 11.720 24.520 39.710%FII
No. FII73 0.122 0.208 0.021 0.036 0.055 0.124 0.245
%RBI 73 40.949 35.793 0.000 0.000 61.255 70.760 80.985RBI Mem. 73 0.575 0.498 0.000 0.000 1.000 1.000 1.000Board Size 72 14.417 2.336 12.000 13.000 14.000 16.000 18.000CEO Chair 73 0.466 0.502 0.000 0.000 0.000 1.000 1.000%Outsiders 73 29.455 26.021 0.000 0.000 30.000 50.000 66.667%Audit Board Outsiders 73 39.448 36.672 0.000 0.000 33.333 66.667 100.000GNPA 73 0.050 0.032 0.010 0.018 0.045 0.073 0.087Provisions 72 1041.093 1223.588 41.508 100.409 577.698 1572.829 2969.109Net Profit 73 126.471 571.781 -422.730 -131.163 54.449 171.374 558.192Total Assets 73 49749 65569 5357 15306 32622 56085 105405Remun. 61 274434 406606 21589 33243 47709 176314 881708
Panel B: Historical Period: 2005-2015
N Mean SD P10 P25 P50 P75 P90
Capital 377 10.090 2.567 7.520 8.050 9.300 11.500 14.210%Inst. 377 28.432 14.539 10.640 18.320 26.880 35.850 49.010%FII 377 16.894 14.075 1.740 3.770 11.820 27.910 39.710Lev. 377 0.896 0.032 0.847 0.882 0.906 0.917 0.924TobinQ. 377 1.073 0.129 0.995 1.017 1.044 1.085 1.166ROA 377 0.951 0.554 0.330 0.640 0.980 1.330 1.610ROE 377 14.032 7.763 5.717 9.843 14.796 19.124 22.032GNPA 375 0.018 0.010 0.007 0.010 0.015 0.023 0.033Provisions 375 313.327 597.595 16.647 53.046 128.086 347.793 658.646Net Profit 377 272.820 393.401 16.416 61.745 139.727 290.628 734.619Total Assets 377 31745 42765 2542 7608 18229 37728 76413Remun. 277 192103 295163 9224 28531 52022 184141 656307
31

Table 2: Shareholding Composition
Table 2 contain summary statistics for shareholder ownership of banks during 2016 and 2017 when weobserve underreporting. Promoters, Institutions, and Non-Institutions roughly make up 100% of bankownership. Indented variables break down these amounts into finer categories. %IndianProm. and%ForeignProm. are the percentages of bank equity owned by Indian and Foreign Promoters .%FIIand %DII are the percentages of bank equity owned by foreign and domestic institutional investors.%Mutual Fund, %Insurance, and %Bank are the percentage of bank equity owned by domestic mutualfunds, insurance funds, and banks. These are a subcategory of %DII. %Corp. is the percentage of bankequity owned by non-promoter corporate bodies. %Individuals is percentage of bank equity owned bynon-promoter individuals. All variables are measured at the end of a bank’s fiscal year.
N Mean SD P25 P50 P75
Promoters 73 46.829 30.246 16.720 61.260 70.760%Indian Prom. 70 47.918 30.487 20.190 61.350 72.830%Foreign Prom. 63 1.020 3.951 0.000 0.000 0.000
Institutions 73 31.853 18.983 17.780 25.940 41.760%FII 73 16.101 14.257 3.430 11.720 24.520%DII 73 14.539 7.026 9.730 13.850 18.720
%Domestic Mutual Fund 73 5.602 6.163 0.040 4.380 9.520%Domestic Insurance 73 8.268 6.704 1.430 10.140 14.100%Domestic Banks 73 1.748 3.513 0.110 0.210 1.700
Non-Institutions 73 21.201 21.628 7.400 11.520 21.510%Corp. Bodies 73 3.807 5.145 0.820 1.510 5.380%Individuals 73 15.352 15.914 6.010 8.350 13.330
32

Table 3: Shareholder Monitoring
OLS Dependent variable is log(Actual NPL/Reported NPL). In the Tobit panel, the dependent variable islog of (Actual NPL - 0.15 x Incremental NPL)/Reported NPL. %FII and %DII are the percentages ofbank equity owned by foreign and domestic institutional investors. Capital is the Tier 1 Capital Ratio.All explanatory variables are measured in 2015 (prior to underreporting disclosures). All explanatoryvariables are standardized such that coefficients can be interpreted as the effect from a one s.d. increase.Panel A is estimated via OLS for the sample of banks we observe reporting divergences. Panel B containsresults from a Tobit regression using the sample of all banks in 2016 and 2017. Observations are censoredbelow by the 15% minimum GNPA required to report. Standard errors are clustered at the bank level.
Panel A: OLS
(1) (2) (3)
%FII 0.272∗∗ 0.284∗∗
(2.16) (2.27)%DII 0.049 0.081
(0.55) (1.12)Capital -0.081 0.172∗∗ -0.096
(-0.94) (2.09) (-1.11)Log(Assets) -0.004 -0.065 -0.023
(-0.16) (-1.35) (-1.08)Year FE Yes Yes Yes
Observations 53 53 53R2 0.458 0.207 0.488
Panel B: Tobit
(1) (2) (3)
%FII 0.356∗∗ 0.360∗∗
(2.23) (2.25)%DII -0.010 0.035
(-0.11) (0.43)Capital -0.215∗ 0.051 -0.223∗
(-1.86) (0.79) (-1.89)Log(Assets) 0.012 -0.024 0.003
(0.39) (-0.58) (0.09)Year FE Yes Yes Yes
Observations 73 73 73Pseudo R2 0.222 0.018 0.227
t statistics in parentheses∗ p < .10, ∗∗ p < .05, ∗∗∗ p < .01
33

Table 4: Shareholder Concentration
OLS Dependent variable is log(Actual NPL/Reported NPL). In the Tobit panel, the dependent variableis log of (Actual NPL - 0.15 x Incremental NPL)/Reported NPL. %Inst, %FII, and %DII are thepercentage of bank equity shares held by institutional, foreign institutional, and domestic institutionalinvestors. 1
No. FII is the inverse of the number of FII shareholders. %FIINo. FII is the average shareholding
by FII. Capital is the Tier 1 Capital Ratio. All explanatory variables are measured in 2015 (prior tounderreporting disclosures). Panel A is estimated via OLS for the sample of banks we observe reportingdivergences. Panel B contains results from a Tobit regression using the sample of all banks in 2016 and2017. Observations are censored below by the 15% minimum GNPA required to report. Robust standarderrors are clustered at the bank level.
Panel A: OLS
(1) (2) (3)
%FII 0.354∗∗ 0.385∗∗
(2.45) (2.69)1
No. FII-0.004 -0.005(-0.40) (-0.36)
%FII × 1No. FII
-0.320∗∗ -0.408∗∗
(-2.31) (-2.39)%DII 0.039 0.118
(0.36) (1.34)1
No. DII-0.060 0.110(-1.18) (1.30)
%DII × 1No. DII
-0.019 -0.053(-0.45) (-1.09)
Capital -0.175 0.136∗ -0.190(-1.39) (1.89) (-1.66)
Log(Assets) -0.177∗ -0.081 -0.192∗
(-2.03) (-0.94) (-2.01)Year FE Yes Yes Yes
Observations 52 52 52R2 0.560 0.240 0.603
Panel B: Tobit
(1) (2) (3)
%FII 0.477∗∗∗ 0.502∗∗∗
(2.81) (2.81)1
No. FII0.025 0.005(1.26) (0.21)
%FII × 1No. FII
-0.376∗∗ -0.403∗∗
(-2.57) (-2.19)%DII -0.031 0.039
(-0.30) (0.45)1
No. DII-0.064 0.069(-0.68) (0.67)
%DII × 1No. DII
0.013 0.009(0.32) (0.15)
Capital -0.351∗∗ 0.033 -0.339∗∗
(-2.31) (0.35) (-2.29)Log(Assets) -0.206∗∗ -0.040 -0.187∗
(-2.06) (-0.38) (-1.77)Year FE Yes Yes Yes
Observations 72 72 72Pseudo R2 0.331 0.021 0.341
t statistics in parentheses∗ p < .10, ∗∗ p < .05, ∗∗∗ p < .01
34

Table 5: Role of the Board
OLS Dependent variable is log(Actual NPL/Reported NPL). Board Size is the number of board members.RBI Mem is an indicator equal to 1 if board member represents the RBI. CEO Chair is an indicatorequal to 1 if the chair is also the CEO of the Bank. %Outsiders and %Audit Board Outsiders are thefraction of board and audit board members who are outsiders to the bank. %FII is the percentage ofbank equity shares held by foreign institutional investors. All explanatory variables are measured in2015 (prior to underreporting disclosures). All continuous explanatory variables are standardized suchthat coefficients can be interpreted as the effect from a one s.d. increase. Underreporting is observedin years 2016 and 2017. Panel A is estimated via OLS for the sample of banks we observe reportingdivergences. Panel B contains results from a Tobit regression using the sample of all banks in 2016 and2017. Observations are censored below by the 15% minimum GNPA required to report. Standard errorsare clustered at the bank level.
Panel A: OLS
(1) (2) (3) (4) (5) (6) (7)
Board Size -0.073 -0.042 -0.075 -0.070 -0.061 -0.059 -0.092(-1.12) (-0.79) (-1.14) (-1.20) (-1.04) (-0.84) (-1.27)
RBI Mem. -0.283∗∗ -0.219∗∗ -0.096(-2.15) (-2.05) (-1.29)
CEO Chair -0.098 -0.078 0.046(-1.09) (-0.77) (0.76)
%Outsiders 0.115 0.173 0.129(1.41) (0.77) (0.79)
%Audit Board Outsiders 0.103∗ -0.102 -0.134(1.74) (-0.49) (-0.78)
%FII 0.273∗∗
(2.12)Capital 0.162∗ 0.068 0.140∗ 0.096 0.088 0.046 -0.095
(2.03) (0.99) (1.95) (1.48) (1.14) (0.50) (-1.07)Log(Assets) -0.037 0.006 -0.023 -0.019 -0.017 0.014 0.017
(-1.29) (0.17) (-0.75) (-0.65) (-0.57) (0.34) (0.54)Year FE Yes Yes Yes Yes Yes Yes Yes
Observations 52 52 52 52 52 52 52R2 0.218 0.302 0.234 0.282 0.258 0.352 0.533
Panel B: Tobit
(1) (2) (3) (4) (5) (6) (7)
Board Size -0.067 -0.061 -0.061 -0.074 -0.065 -0.056 -0.086(-0.78) (-0.92) (-0.76) (-0.86) (-0.82) (-0.78) (-1.17)
RBI Mem. -0.472∗ -0.375 -0.220(-1.85) (-1.64) (-1.51)
CEO Chair -0.227 -0.107 0.060(-1.21) (-0.67) (0.46)
%Outsiders 0.117 -0.010 0.031(1.05) (-0.04) (0.18)
%Audit Board Outsiders 0.179 0.095 -0.039(1.65) (0.39) (-0.20)
%FII 0.336∗∗
(2.02)Capital 0.038 -0.095 0.004 -0.028 -0.080 -0.143 -0.261∗∗
(0.60) (-1.18) (0.06) (-0.37) (-0.98) (-1.63) (-2.21)Log(Assets) -0.006 0.055 0.024 0.015 0.026 0.072 0.055
(-0.19) (1.14) (0.55) (0.37) (0.71) (1.18) (1.21)Year FE Yes Yes Yes Yes Yes Yes Yes
Observations 72 72 72 72 72 72 72Pseudo R2 0.023 0.112 0.050 0.044 0.063 0.129 0.268
t statistics in parentheses∗ p < .10, ∗∗ p < .05, ∗∗∗ p < .01 35

Table 6: FII instrumented by MSCI Index Inclusion
Table 6 estimates the effect of FII shareholding on NPL underreporting using an IV. The instrument,MSCI, is defined as 1 if the bank was included in the MSCI India domestic index in 2015 and 0 otherwise.The Columns (1) & (2) present the first stage where FII shareholding (standardized) is regressed on theinstrument. Columns (3) & (4) present the reduced form regression. Columns (5) & (6) reports the secondstage of the instrumented FII shareholding on NPL underreporting. %FII is the percentage of bank equityshares owned by foreign institutional investors. Capital is the Tier 1 Capital Ratio. FreeF loatMarketCapis the market cap computed only using free floating shares. Liquidity is the 12-month average tradingvalue ratio as defined by MSCI. ForeignRoom is the maximum % of foreign share allowed minus existingforeign investment. OLS Dependent variable is log(Actual NPL/Reported NPL). In the Tobit panel, thedependent variable is log of (Actual NPL - 0.15 x Incremental NPL)/Reported NPL. Underreporting isobserved in years 2016 and 2017. All explanatory variables are measured in 2015 (prior to underreportingdisclosures). All continuous explanatory variables are standardized such that coefficients can be interpretedas the effect from a one s.d. increase. Standard errors are clustered at the bank level.
Panel A: IV
First Stage Reduced Form Second Stage
(1) (2) (3) (4) (5) (6)
MSCI 1.278∗∗∗ 1.314∗∗∗ 0.502∗∗ 0.759∗∗
(4.62) (3.23) (2.35) (2.31)%FII 0.393∗∗∗ 0.578∗∗∗
(2.84) (3.26)Capital 0.664∗∗∗ 0.685∗∗∗ 0.067∗ 0.074 -0.194∗ -0.322∗∗
(6.43) (4.05) (1.76) (1.19) (-1.75) (-2.05)Log(Assets) -0.194∗∗∗ -0.071 -0.059∗∗ 0.022 0.018 0.063
(-3.79) (-0.26) (-2.31) (0.21) (0.54) (0.39)Liquidity 0.162 0.045 -0.049
(1.33) (0.68) (-0.73)MarketCap -0.340 -0.325∗ -0.128
(-1.06) (-1.88) (-0.55)FreeF loatMarketCap 0.295 0.124 -0.046
(0.92) (1.35) (-0.22)ForeignRoom 0.158 0.064 -0.027
(0.74) (0.80) (-0.23)Year FE Yes Yes Yes Yes Yes Yes
Observations 53 52 53 52 53 52
R2 0.799 0.817 0.463 0.588 0.406 0.275F First Stage 21.341 10.414
Panel B: Tobit IV
First Stage Reduced Form Second Stage
(1) (2) (3) (4) (5) (6)
MSCI 1.144∗∗∗ 1.123∗∗∗ 0.586∗∗ 0.833∗∗
(4.18) (2.90) (2.14) (2.04)%FII 0.490∗∗∗ 0.714∗∗∗
(2.72) (3.14)Capital 0.591∗∗∗ 0.607∗∗∗ -0.013 -0.054 -0.308∗∗ -0.483∗∗∗
(7.51) (4.22) (-0.25) (-0.86) (-2.30) (-2.64)Log(Assets) -0.156∗∗ -0.033 -0.065 0.209 0.019 0.227
(-2.55) (-0.10) (-1.50) (1.55) (0.51) (0.94)FreeF loatMarketCap 0.325 0.178 -0.049
(1.03) (1.54) (-0.21)Liquidity 0.084 -0.131 -0.185∗∗
(0.68) (-1.58) (-2.30)MarketCap -0.338 -0.487∗∗ -0.241
(-0.97) (-2.41) (-0.84)ForeignRoom 0.109 0.166 0.068
(0.54) (1.39) (0.43)Year FE Yes Yes Yes Yes Yes Yes
Observations 73 72 73 72 73 72
R2 0.740 0.753
Pseudo R2 0.194 0.307F First Stage 17.470 8.419
t statistics in parentheses∗ p < .10, ∗∗ p < .05, ∗∗∗ p < .01 36

Table 7: Foreign Institutional Investors and Private Banks
OLS Dependent variable is log(Actual NPL/Reported NPL). In the Tobit panel, the dependent variableis log of (Actual NPL - 0.15 x Incremental NPL)/Reported NPL. %Inst, %FII, and %DII are thepercentage of bank equity shares held by institutional, foreign institutional, and domestic institutionalinvestors. Private an indicator variable whether less than % 50 of the bank is owned by the state.Capital is the percentage of Tier 1 Capital. All explanatory variables are measured in 2015 (prior tounderreporting disclosures). All continuous explanatory variables are standardized such that coefficientscan be interpreted as the effect from a one s.d. increase. Underreporting is observed in years 2016 and2017. Panel A is estimated via OLS for the sample of banks we observe reporting divergences. Panel Bcontains results from a Tobit regression using the sample of all banks in 2016 and 2017. Observations arecensored below by the 15% minimum GNPA required to report. Robust standard errors are clustered atthe bank level.
Panel A: OLS
(1) (2) (3) (4)
%FII 0.272∗∗ 0.295 0.034(2.16) (1.52) (0.48)
Private 0.569∗∗ -0.079 -0.023(2.26) (-0.24) (-0.08)
Private× %FII 0.394∗∗
(2.12)Capital -0.081 -0.073 -0.068 -0.076
(-0.94) (-1.09) (-0.78) (-0.78)Log(Assets) -0.004 0.089∗ -0.019 -0.042
(-0.16) (1.81) (-0.29) (-0.60)Year FE Yes Yes Yes Yes
Observations 53 53 53 53R2 0.458 0.343 0.459 0.535
Panel B: Tobit
(1) (2) (3) (4)
%FII 0.356∗∗ 0.310 -0.225(2.23) (1.41) (-1.44)
Private 0.816∗∗ 0.146 0.420(2.15) (0.48) (1.51)
Private× %FII 0.689∗∗
(2.46)Capital -0.215∗ -0.226∗ -0.231∗∗ -0.250∗∗
(-1.86) (-1.91) (-2.13) (-2.26)Log(Assets) 0.012 0.151∗ 0.039 0.025
(0.39) (1.98) (0.69) (0.46)Year FE Yes Yes Yes Yes
Observations 73 73 73 73Pseudo R2 0.222 0.166 0.225 0.328
t statistics in parentheses∗ p < .10, ∗∗ p < .05, ∗∗∗ p < .01
37
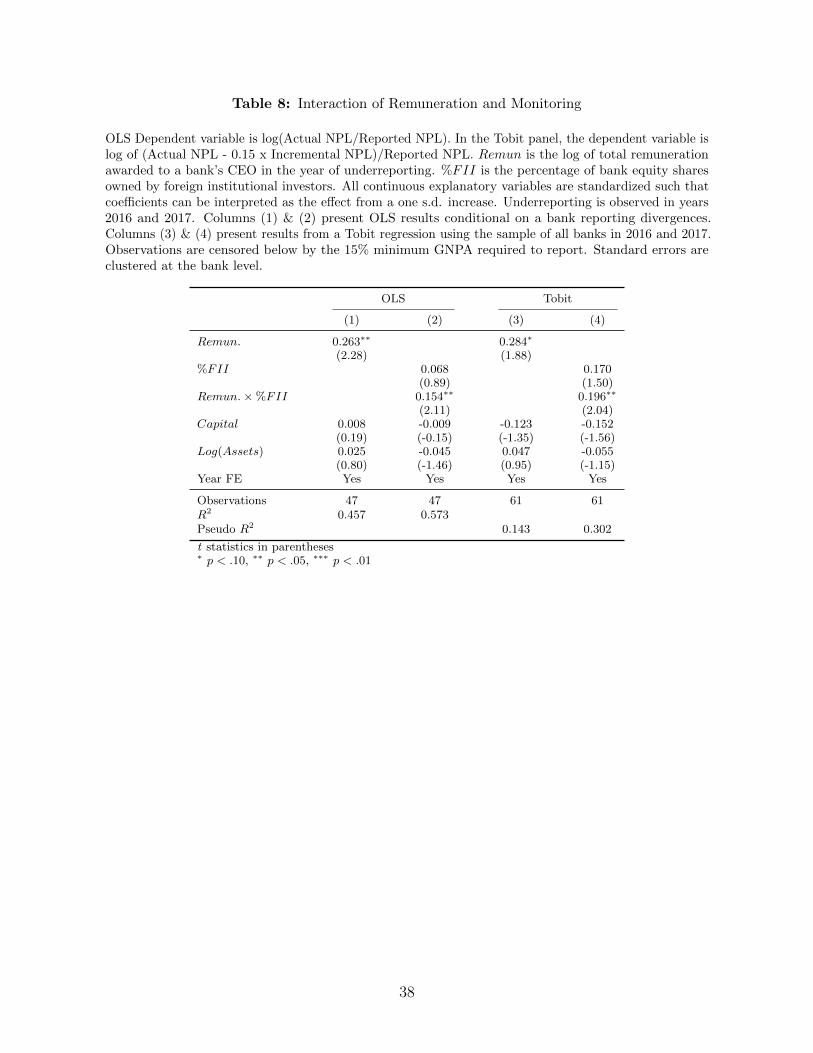
Table 8: Interaction of Remuneration and Monitoring
OLS Dependent variable is log(Actual NPL/Reported NPL). In the Tobit panel, the dependent variable islog of (Actual NPL - 0.15 x Incremental NPL)/Reported NPL. Remun is the log of total remunerationawarded to a bank’s CEO in the year of underreporting. %FII is the percentage of bank equity sharesowned by foreign institutional investors. All continuous explanatory variables are standardized such thatcoefficients can be interpreted as the effect from a one s.d. increase. Underreporting is observed in years2016 and 2017. Columns (1) & (2) present OLS results conditional on a bank reporting divergences.Columns (3) & (4) present results from a Tobit regression using the sample of all banks in 2016 and 2017.Observations are censored below by the 15% minimum GNPA required to report. Standard errors areclustered at the bank level.
OLS Tobit
(1) (2) (3) (4)
Remun. 0.263∗∗ 0.284∗
(2.28) (1.88)%FII 0.068 0.170
(0.89) (1.50)Remun.× %FII 0.154∗∗ 0.196∗∗
(2.11) (2.04)Capital 0.008 -0.009 -0.123 -0.152
(0.19) (-0.15) (-1.35) (-1.56)Log(Assets) 0.025 -0.045 0.047 -0.055
(0.80) (-1.46) (0.95) (-1.15)Year FE Yes Yes Yes Yes
Observations 47 47 61 61R2 0.457 0.573Pseudo R2 0.143 0.302
t statistics in parentheses∗ p < .10, ∗∗ p < .05, ∗∗∗ p < .01
38
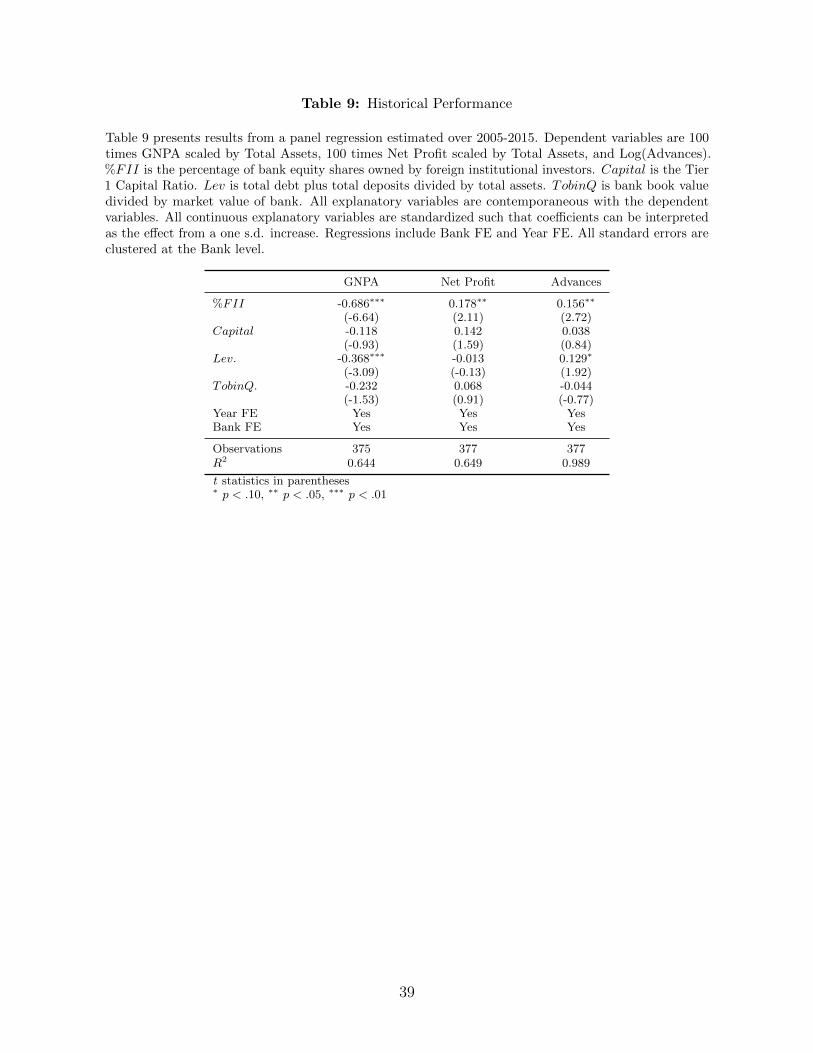
Table 9: Historical Performance
Table 9 presents results from a panel regression estimated over 2005-2015. Dependent variables are 100times GNPA scaled by Total Assets, 100 times Net Profit scaled by Total Assets, and Log(Advances).%FII is the percentage of bank equity shares owned by foreign institutional investors. Capital is the Tier1 Capital Ratio. Lev is total debt plus total deposits divided by total assets. TobinQ is bank book valuedivided by market value of bank. All explanatory variables are contemporaneous with the dependentvariables. All continuous explanatory variables are standardized such that coefficients can be interpretedas the effect from a one s.d. increase. Regressions include Bank FE and Year FE. All standard errors areclustered at the Bank level.
GNPA Net Profit Advances
%FII -0.686∗∗∗ 0.178∗∗ 0.156∗∗
(-6.64) (2.11) (2.72)Capital -0.118 0.142 0.038
(-0.93) (1.59) (0.84)Lev. -0.368∗∗∗ -0.013 0.129∗
(-3.09) (-0.13) (1.92)TobinQ. -0.232 0.068 -0.044
(-1.53) (0.91) (-0.77)Year FE Yes Yes YesBank FE Yes Yes Yes
Observations 375 377 377R2 0.644 0.649 0.989
t statistics in parentheses∗ p < .10, ∗∗ p < .05, ∗∗∗ p < .01
39

Table 10: Compensation Regression by FII Groups
Table 10 presents results from a panel regression estimated over 2005-2015. Dependent variable is the logof total remuneration awarded to the Bank’s CEO. The first column is estimated over the entire sample.The second and third columns are split by the median of the average of each banks’ FII shareholdingover the entire sample. ROE is the bank’s return on equity in that fiscal year. GNPARatio is GrossNPAs divided by advances. %FII is the percentage of bank equity shares owned by foreign institutionalinvestors. All explanatory variables are contemporaneous with the dependent variables. All continuousexplanatory variables are standardized such that coefficients can be interpreted as the effect from a ones.d. increase. Regressions include Bank FE and Year FE. Standard errors are clustered at the bank level.
(1) (2) (3) (4) (5)Full Sample High FII Low FII Full Sample Full Sample
ROE 0.017 0.055 -0.188 0.084(0.26) (0.85) (-1.31) (0.89)
GNPARatio -0.262∗ -0.270∗∗ -0.055 -0.293∗∗
(-1.93) (-2.37) (-0.15) (-2.51)Log(Assets) 0.720∗∗ 0.797∗∗ 0.919 0.394 0.161
(2.19) (2.42) (1.22) (1.44) (0.95)%FII 0.113∗ 0.220∗∗∗
(1.78) (3.74)GNPARatio× %FII -0.194∗∗∗
(-2.75)ROE × %FII 0.112∗∗∗
(3.04)
Bank FE Yes Yes Yes Yes YesYear FE Yes Yes Yes Yes YesR2 0.86 0.91 0.40 0.86 0.86Within R2 0.06 0.13 0.01 0.09 0.07Observations 274 153 121 274 276
t statistics in parentheses∗ p < .10, ∗∗ p < .05, ∗∗∗ p < .01
40

References
Adams, Renee B, and Hamid Mehran, 2012, Bank board structure and performance: Evidence
for large bank holding companies, Journal of financial Intermediation 21, 243–267.
Aggarwal, Reena, Isil Erel, Miguel Ferreira, and Pedro Matos, 2011, Does governance
travel around the world? evidence from institutional investors, Journal of Financial
Economics 100, 154–181.
Appel, Ian R, Todd A Gormley, and Donald B Keim, 2016, Passive investors, not passive
owners, Journal of Financial Economics 121, 111–141.
Begley, Taylor A, Amiyatosh Purnanandam, and Kuncheng Zheng, 2017, The strategic
underreporting of bank risk, The Review of Financial Studies 30, 3376–3415.
Behn, Markus, Rainer FH Haselmann, and Vikrant Vig, 2016, The limits of model-based
regulation.
Bena, Jan, Miguel A Ferreira, Pedro Matos, and Pedro Pires, 2017, Are foreign investors
locusts? the long-term effects of foreign institutional ownership, Journal of Financial
Economics 126, 122–146.
Blattner, Laura, Luisa Farinha, and Francisca Rebelo, 2019, When losses turn into loans: the
cost of undercapitalized banks.
Boone, Audra L, and Joshua T White, 2015, The effect of institutional ownership on firm
transparency and information production, Journal of Financial Economics 117, 508–533.
Boot, Arnound WA, and Jonathan R Macey, 2003, Monitoring corporate performance: the
role of objectivity, proximity, and adaptability in corporate governance, Cornell L. Rev. 89,
356.
Brennan, Michael J, and H Henry Cao, 1997, International portfolio investment flows, The
Journal of Finance 52, 1851–1880.
41

Burns, Natasha, and Simi Kedia, 2006, The impact of performance-based compensation on
misreporting, Journal of Financial Economics 79, 35–67.
Bushman, Robert M., and Christopher D. Williams, 2015, Delayed expected loss recognition
and the risk profile of banks, Journal of Accounting Research 53, 511–553.
Caballero, Ricardo J, Takeo Hoshi, and Anil K Kashyap, 2008, Zombie lending and depressed
restructuring in japan, American Economic Review 98, 1943–77.
Chari, Anusha, Lakshita Jain, and Nirupama Kulkarni, 2019, The unintended consequences
of regulatory forbearance.
Edmans, Alex, and Clifford G Holderness, 2017, Blockholders: A survey of theory and
evidence.
Gillan, Stuart L, and Laura T Starks, 2007, The evolution of shareholder activism in the
united states, Journal of Applied Corporate Finance 19, 55–73.
Hartzell, Jay C, and Laura T Starks, 2003, Institutional investors and executive compensation,
The Journal of Finance 58, 2351–2374.
Healy, Paul M., 1985, The effect of bonus schemes on accounting decisions, Journal of
Accounting and Economics 7, 85–107.
Holmstrom, Bengt, 1979, Moral hazard and observability, Bell Journals of Economics 10,
74–91.
Jayaraman, Sudarshan, and Todd Milbourn, 2015, Ceo equity incentives and financial
misreporting: The role of auditor expertise, The Accounting Review 90, 321–350.
Kang, Jun-Koo, and Rene Stulz, 1997, Why is there a home bias? an analysis of foreign
portfolio equity ownership in japan, Journal of Financial Economics 46, 3–28.
42
Kulkarni, Nirupama, SK Ritadhi, Siddharth Vij, and Katherine Waldock, 2019, Unearthing
zombies, Available at SSRN 3495660 .
Narayanan, MP, 1985, Managerial incentives for short-term results, The Journal of Finance 40,
1469–1484.
Petersen, Mitchell A, and Raghuram G Rajan, 2002, Does distance still matter? the
information revolution in small business lending, The Fournal of Finance 57, 2533–2570.
Plosser, Matthew, and Joao Santos, 2014, Banks’ incentives and the quality of internal risk
models.
Povel, Paul, Rajdeep Singh, and Andrew Winton, 2007, Booms, busts, and fraud, The Review
of Financial Studies 20, 1219–1254.
Rajan, Raghuram G, 1994, Why bank credit policies fluctuate: A theory and some evidence,
The Quarterly Journal of Economics 109, 399–441.
Schmidt, Cornelius, and Rudiger Fahlenbrach, 2017, Do exogenous changes in passive
institutional ownership affect corporate governance and firm value?, Journal of Financial
Economics 124, 285–306.
Stein, Jeremy C, 1989, Efficient capital markets, inefficient firms: A model of myopic corporate
behavior, The Quarterly Journal of Economics 104, 655–669.
Stein, Jeremy C, 2002, Information production and capital allocation: Decentralized versus
hierarchical firms, The Fournal of Finance 57, 1891–1921.
Subrahmanyam, Avanidhar, 2005, A cognitive theory of corporate disclosures, Financial
Management 34, 5–33.
Von Thadden, Ernst-Ludwig, 1995, Long-term contracts, short-term investment and monitor-
ing, The Review of Economic Studies 62, 557–575.
43
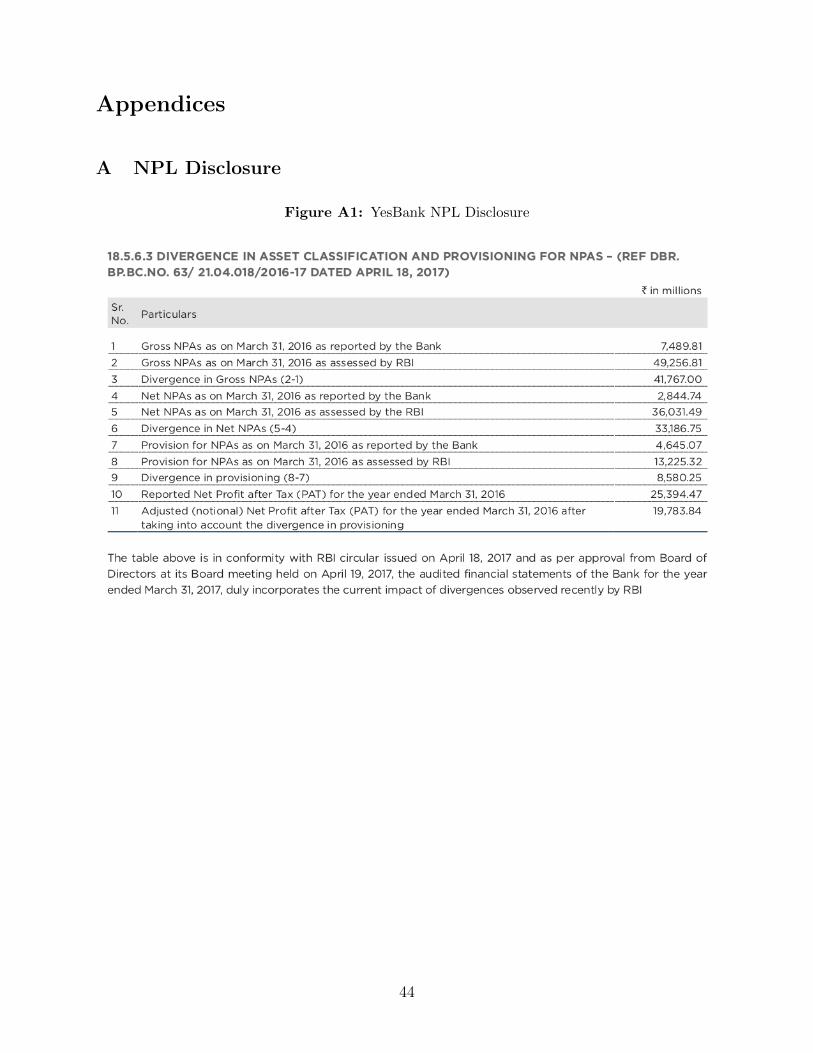
Appendices
A NPL Disclosure
Figure A1: YesBank NPL Disclosure
44

B Variable Construction
Table A1: Variable Descriptions
Variable Description Source
GNPA Underreporting Log(Actual NPL/Reported NPL) Hand Collected
Provision Underreporting Log(Actual Provision/Reported Provisions) Hand Collected
Remuneration Log of Total Remuneration awarded to the CEO Hand Collected & Prowess
GNPA Gross Non-Performing Assets / Total Assets RBI Statistics
Capital Tier 1 Capital Ratio RBI Statistics
Net Profit Net Profits/Total Assets RBI Statistics
Lev. (Total Debt + Total Deposits)/Total Assets Prowess
Market Cap Closing Price × Shares Out Prowess
Tobin Q Book Value/Market Cap Prowess
% FII FII Shares/Total Number of Shares Prowess
% Inst. Inst. Shares/Total Number of Shares Prowess
% DII DII Shares/Total Number of Shares Prowess
% RBI RBI Shares/Total Number of Shares Prowess
Average % FII FII Shares/Number of FII Investors Prowess
ROA Return on Assets RBI Statistics
ROE Return on Equity RBI Statistics
GNPA Ratio Gross Non-Performing Assets / Advances RBI Statistics
Board Size Number of Directors on Board Prowess
RBI Mem. Indicator if RBI member serves on the Board Prowess
CEO Chair Indicator if CEO is chair of the Board Prowess
% Outsiders Percentage of Independent Board Members Prowess
% Audit Board Outsiders Percentage of Independent Members on Audit Board Prowess
Tobit Underreporting Dependent Variable: As described in the main text, the Tobit de-
pendent variable is the log of (Actual NPL - 0.15 x Incremental NPL)/Reported NPL23. The
intuition behind this measure is that it captures the minimum NPL a bank could report before
having to disclose as per the RBI mandate. Since each bank has a different minimum NPL
threshold, the measure standardizes the cutoff for every bank in the sample. For example,
23Incremental NPL is the subset of NPL that only became non-performing in the most recent reportingperiod
45
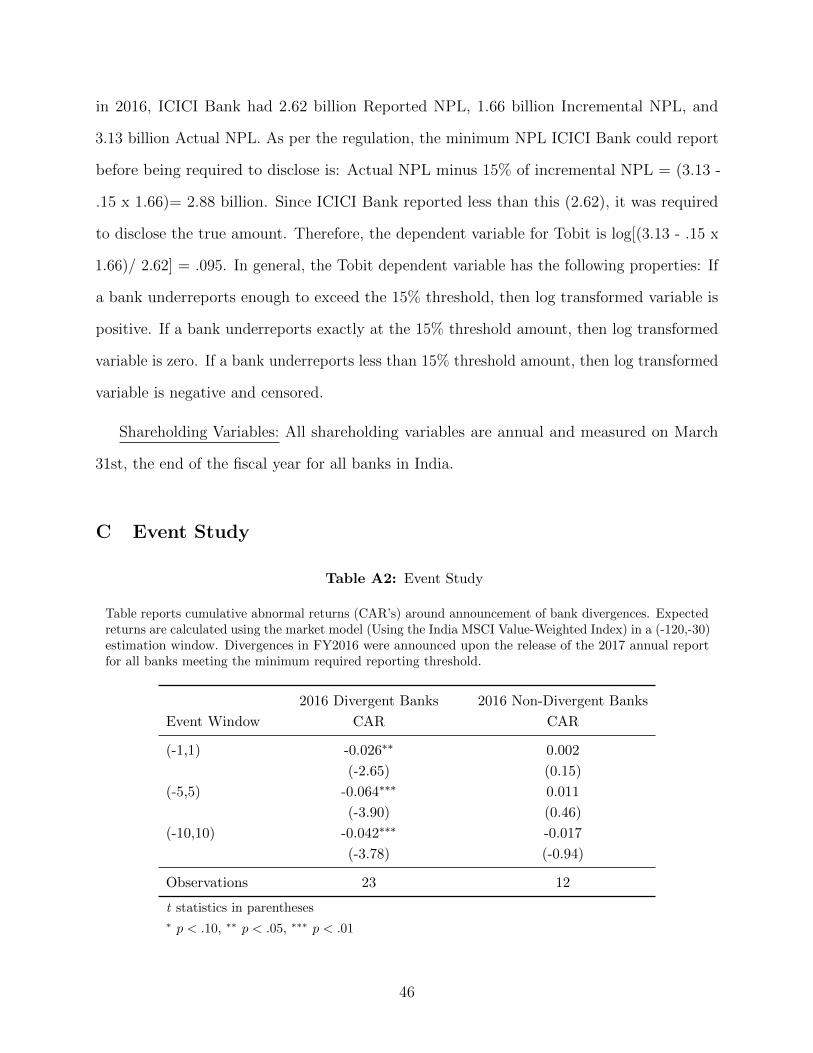
in 2016, ICICI Bank had 2.62 billion Reported NPL, 1.66 billion Incremental NPL, and
3.13 billion Actual NPL. As per the regulation, the minimum NPL ICICI Bank could report
before being required to disclose is: Actual NPL minus 15% of incremental NPL = (3.13 -
.15 x 1.66)= 2.88 billion. Since ICICI Bank reported less than this (2.62), it was required
to disclose the true amount. Therefore, the dependent variable for Tobit is log[(3.13 - .15 x
1.66)/ 2.62] = .095. In general, the Tobit dependent variable has the following properties: If
a bank underreports enough to exceed the 15% threshold, then log transformed variable is
positive. If a bank underreports exactly at the 15% threshold amount, then log transformed
variable is zero. If a bank underreports less than 15% threshold amount, then log transformed
variable is negative and censored.
Shareholding Variables: All shareholding variables are annual and measured on March
31st, the end of the fiscal year for all banks in India.
C Event Study
Table A2: Event Study
Table reports cumulative abnormal returns (CAR’s) around announcement of bank divergences. Expectedreturns are calculated using the market model (Using the India MSCI Value-Weighted Index) in a (-120,-30)estimation window. Divergences in FY2016 were announced upon the release of the 2017 annual reportfor all banks meeting the minimum required reporting threshold.
2016 Divergent Banks 2016 Non-Divergent Banks
Event Window CAR CAR
(-1,1) -0.026∗∗ 0.002
(-2.65) (0.15)
(-5,5) -0.064∗∗∗ 0.011
(-3.90) (0.46)
(-10,10) -0.042∗∗∗ -0.017
(-3.78) (-0.94)
Observations 23 12
t statistics in parentheses∗ p < .10, ∗∗ p < .05, ∗∗∗ p < .01
46

D Additional Results and Tables
Figure A2: Yes Bank Shareholder Structure
47

Table A3: Interval Regression
Dependent variable is log(Actual NPL/Reported NPL). Interval regression bounds the amount underre-porting of banks that did disclose underreporting between 0% and 15% of incremental NPL. %FII and%DII are the percentages of bank equity owned by foreign and domestic institutional investors. Privatean indicator variable whether less than 50 % of the bank is owned by the state. Remun is the log of totalremuneration awarded to a bank’s CEO in the year of underreporting. Underreporting is observed inyears 2016 and 2017. Standard errors are clustered at the bank level.
(1) (2) (3) (4) (5)
%FII 0.247∗∗ 0.255∗∗ 0.011 0.111∗
(2.22) (2.24) (0.17) (1.73)%DII 0.016 0.041
(0.31) (0.78)Private 0.069
(0.37)Private× %FII 0.334∗∗
(2.33)Remun. 0.032
(0.64)Remun.× %FII 0.132∗
(1.96)Capital -0.121∗ 0.051 -0.132∗ -0.127∗ -0.095∗
(-1.74) (1.52) (-1.84) (-1.92) (-1.65)Log(Assets) 0.003 -0.018 -0.007 -0.014 -0.031
(0.15) (-0.78) (-0.31) (-0.31) (-1.01)Year FE Yes Yes Yes Yes Yes
Observations 73 73 73 73 61
t statistics in parentheses∗ p < .10, ∗∗ p < .05, ∗∗∗ p < .01
48
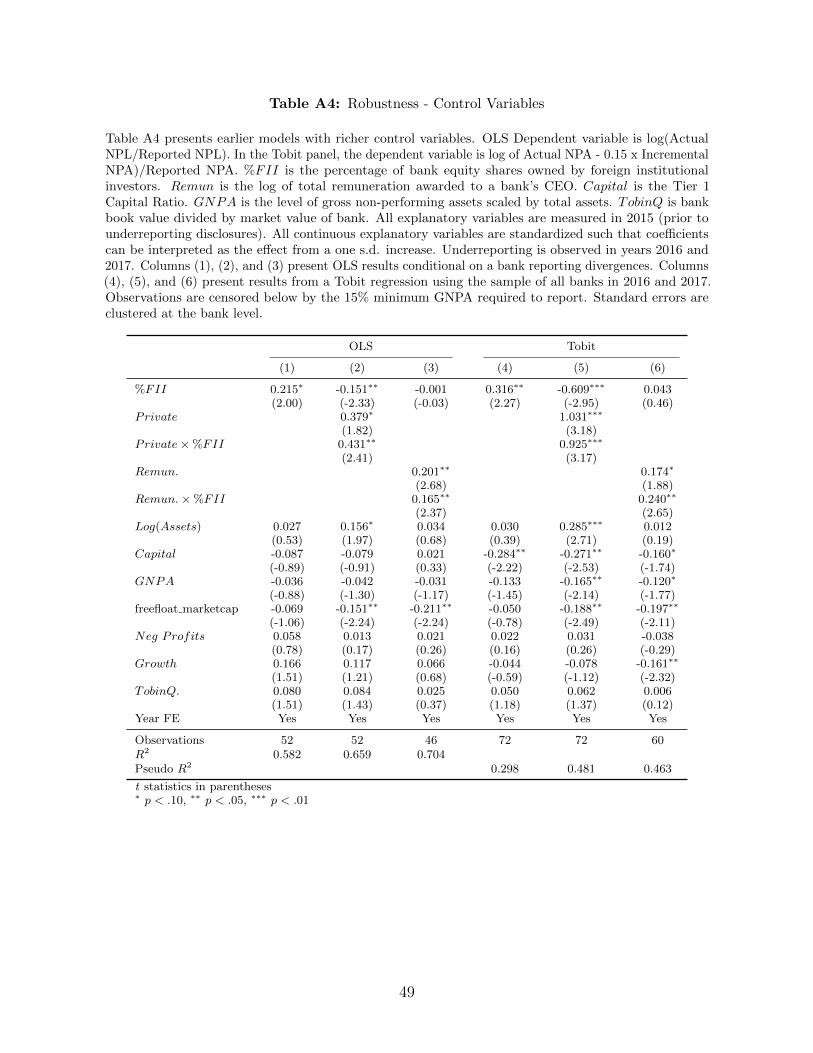
Table A4: Robustness - Control Variables
Table A4 presents earlier models with richer control variables. OLS Dependent variable is log(ActualNPL/Reported NPL). In the Tobit panel, the dependent variable is log of Actual NPA - 0.15 x IncrementalNPA)/Reported NPA. %FII is the percentage of bank equity shares owned by foreign institutionalinvestors. Remun is the log of total remuneration awarded to a bank’s CEO. Capital is the Tier 1Capital Ratio. GNPA is the level of gross non-performing assets scaled by total assets. TobinQ is bankbook value divided by market value of bank. All explanatory variables are measured in 2015 (prior tounderreporting disclosures). All continuous explanatory variables are standardized such that coefficientscan be interpreted as the effect from a one s.d. increase. Underreporting is observed in years 2016 and2017. Columns (1), (2), and (3) present OLS results conditional on a bank reporting divergences. Columns(4), (5), and (6) present results from a Tobit regression using the sample of all banks in 2016 and 2017.Observations are censored below by the 15% minimum GNPA required to report. Standard errors areclustered at the bank level.
OLS Tobit
(1) (2) (3) (4) (5) (6)
%FII 0.215∗ -0.151∗∗ -0.001 0.316∗∗ -0.609∗∗∗ 0.043(2.00) (-2.33) (-0.03) (2.27) (-2.95) (0.46)
Private 0.379∗ 1.031∗∗∗
(1.82) (3.18)Private× %FII 0.431∗∗ 0.925∗∗∗
(2.41) (3.17)Remun. 0.201∗∗ 0.174∗
(2.68) (1.88)Remun.× %FII 0.165∗∗ 0.240∗∗
(2.37) (2.65)Log(Assets) 0.027 0.156∗ 0.034 0.030 0.285∗∗∗ 0.012
(0.53) (1.97) (0.68) (0.39) (2.71) (0.19)Capital -0.087 -0.079 0.021 -0.284∗∗ -0.271∗∗ -0.160∗
(-0.89) (-0.91) (0.33) (-2.22) (-2.53) (-1.74)GNPA -0.036 -0.042 -0.031 -0.133 -0.165∗∗ -0.120∗
(-0.88) (-1.30) (-1.17) (-1.45) (-2.14) (-1.77)freefloat marketcap -0.069 -0.151∗∗ -0.211∗∗ -0.050 -0.188∗∗ -0.197∗∗
(-1.06) (-2.24) (-2.24) (-0.78) (-2.49) (-2.11)Neg Profits 0.058 0.013 0.021 0.022 0.031 -0.038
(0.78) (0.17) (0.26) (0.16) (0.26) (-0.29)Growth 0.166 0.117 0.066 -0.044 -0.078 -0.161∗∗
(1.51) (1.21) (0.68) (-0.59) (-1.12) (-2.32)TobinQ. 0.080 0.084 0.025 0.050 0.062 0.006
(1.51) (1.43) (0.37) (1.18) (1.37) (0.12)Year FE Yes Yes Yes Yes Yes Yes
Observations 52 52 46 72 72 60R2 0.582 0.659 0.704Pseudo R2 0.298 0.481 0.463
t statistics in parentheses∗ p < .10, ∗∗ p < .05, ∗∗∗ p < .01
49
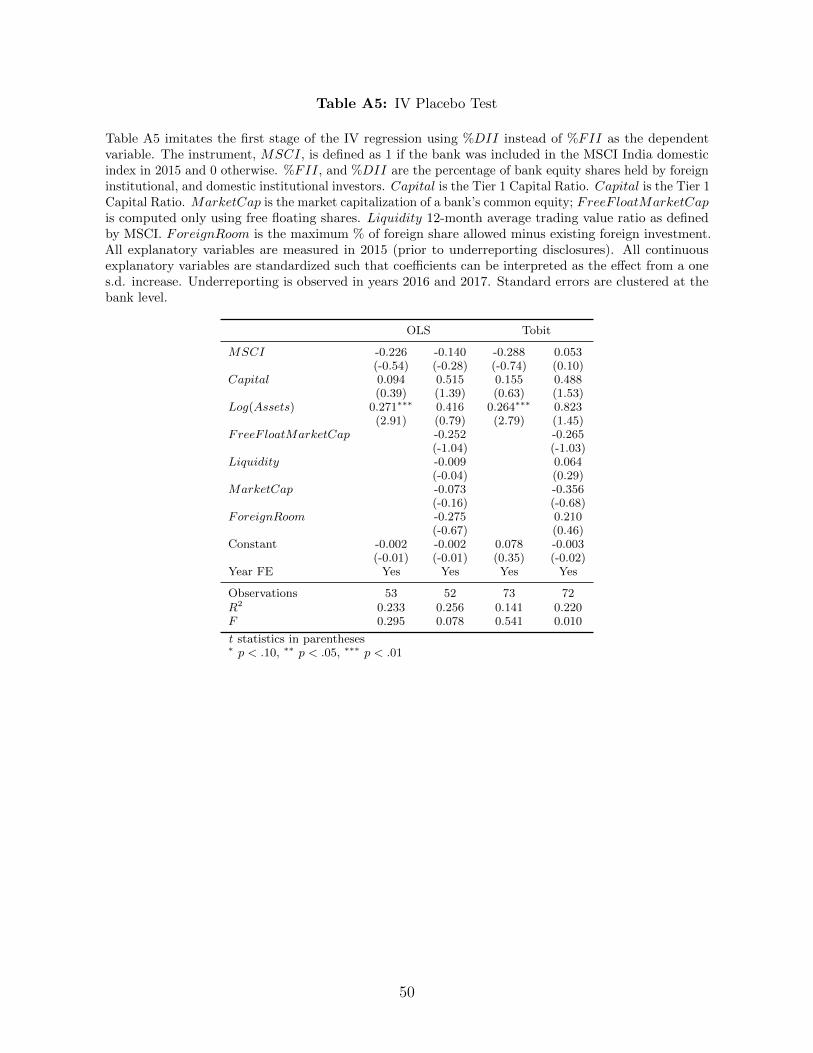
Table A5: IV Placebo Test
Table A5 imitates the first stage of the IV regression using %DII instead of %FII as the dependentvariable. The instrument, MSCI, is defined as 1 if the bank was included in the MSCI India domesticindex in 2015 and 0 otherwise. %FII, and %DII are the percentage of bank equity shares held by foreigninstitutional, and domestic institutional investors. Capital is the Tier 1 Capital Ratio. Capital is the Tier 1Capital Ratio. MarketCap is the market capitalization of a bank’s common equity; FreeF loatMarketCapis computed only using free floating shares. Liquidity 12-month average trading value ratio as definedby MSCI. ForeignRoom is the maximum % of foreign share allowed minus existing foreign investment.All explanatory variables are measured in 2015 (prior to underreporting disclosures). All continuousexplanatory variables are standardized such that coefficients can be interpreted as the effect from a ones.d. increase. Underreporting is observed in years 2016 and 2017. Standard errors are clustered at thebank level.
OLS Tobit
MSCI -0.226 -0.140 -0.288 0.053(-0.54) (-0.28) (-0.74) (0.10)
Capital 0.094 0.515 0.155 0.488(0.39) (1.39) (0.63) (1.53)
Log(Assets) 0.271∗∗∗ 0.416 0.264∗∗∗ 0.823(2.91) (0.79) (2.79) (1.45)
FreeF loatMarketCap -0.252 -0.265(-1.04) (-1.03)
Liquidity -0.009 0.064(-0.04) (0.29)
MarketCap -0.073 -0.356(-0.16) (-0.68)
ForeignRoom -0.275 0.210(-0.67) (0.46)
Constant -0.002 -0.002 0.078 -0.003(-0.01) (-0.01) (0.35) (-0.02)
Year FE Yes Yes Yes Yes
Observations 53 52 73 72R2 0.233 0.256 0.141 0.220F 0.295 0.078 0.541 0.010
t statistics in parentheses∗ p < .10, ∗∗ p < .05, ∗∗∗ p < .01
50