the experience of development banks - inct/ppedinctpped.ie.ufrj.br/spiderweb/dymsk_4/4-9s ferraz...
TRANSCRIPT
João Carlos Ferraz Vice President
Central Banks, Financial Systems and Economic Development
The experience of Development Banks
2012 Money and Banking Conference Buenos Aires, October 1st, 2012

Not an exception but very common institution: in countries under different regimes, at different stages of development.
BDC (2009): 235 DIs in 92 countries.
International Benchmark Study on Development Institutions. Business Development Canada, 2009
WB (2012): 90 DIs in 61 countries. By 2009, total assets of US$ 2.01 trillion; loan portfolio of US $1.59 trillion.
Global Survey of Development Banks. Policy Research Working Paper, n. 5969. Washington: World Bank, 2012.
Different types of Development Institutions: Development Banks, Specialized Agencies (Credit, Guarantee or Equity), Development Financing Institutions (usually multilateral)
Development Institutions: very common and most relevant institutions
2

OECD: institutions providing long term loans that are beyond the capacity or the willingness of others to do so.
After 2007/8, “rediscovery” of DBs: Confidence builder, long term financing, risk mitigating institution.
But not at all without controversy! For: Crowding out private industry Having discretionary power (“pick winners”) Being an ambiance conducive to cronyism
Development Banks: what they are
3

Not a homogeneous group, differing in:
Ownership structure (fully vs. partially owned by government)
Target sectors and clients (narrow vs. wide focus)
Lending models (first-tier vs. second-tier)
Credit conditions (subsidized vs. market interest rates)
Regulation and supervision (special regime vs regime applicable to all banks)
Corporate governance (independent vs. government controlled boards)
Development Banks: not one alike
4
BNDES
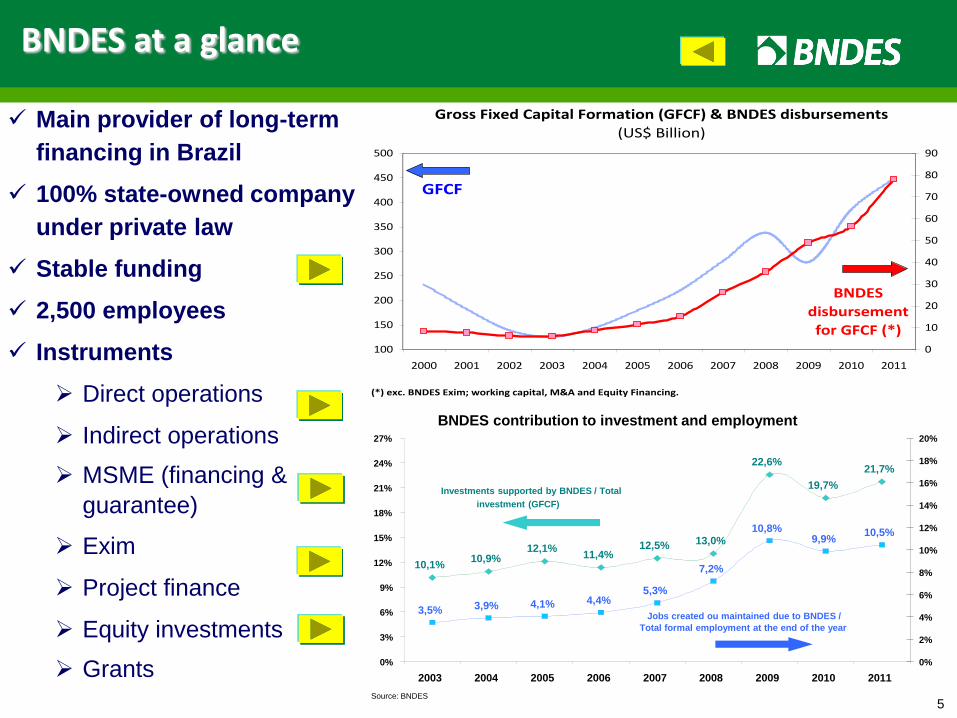
Main provider of long-term
financing in Brazil
100% state-owned company
under private law
Stable funding
2,500 employees
Instruments
Direct operations
Indirect operations
MSME (financing &
guarantee)
Exim
Project finance
Equity investments
Grants
BNDES at a glance
Gross Fixed Capital Formation (GFCF) & BNDES disbursements
(US$ Billion)
GFCF
BNDES
disbursement
for GFCF (*)100
150
200
250
300
350
400
450
500
2000 2001 2002 2003 2004 2005 2006 2007 2008 2009 2010 2011
0
10
20
30
40
50
60
70
80
90
(*) exc. BNDES Exim; working capital, M&A and Equity Financing.
BNDES contribution to investment and employment
10,1% 10,9%
12,1% 11,4%
12,5% 13,0%
22,6%
19,7%
21,7%
3,5% 3,9% 4,1% 4,4% 5,3%
7,2%
10,8% 9,9%
10,5%
0%
3%
6%
9%
12%
15%
18%
21%
24%
27%
2003 2004 2005 2006 2007 2008 2009 2010 2011
0%
2%
4%
6%
8%
10%
12%
14%
16%
18%
20%
Source: BNDES
Investments supported by BNDES / Total
investment (GFCF)
Jobs created ou maintained due to BNDES /
Total formal employment at the end of the year
5
6
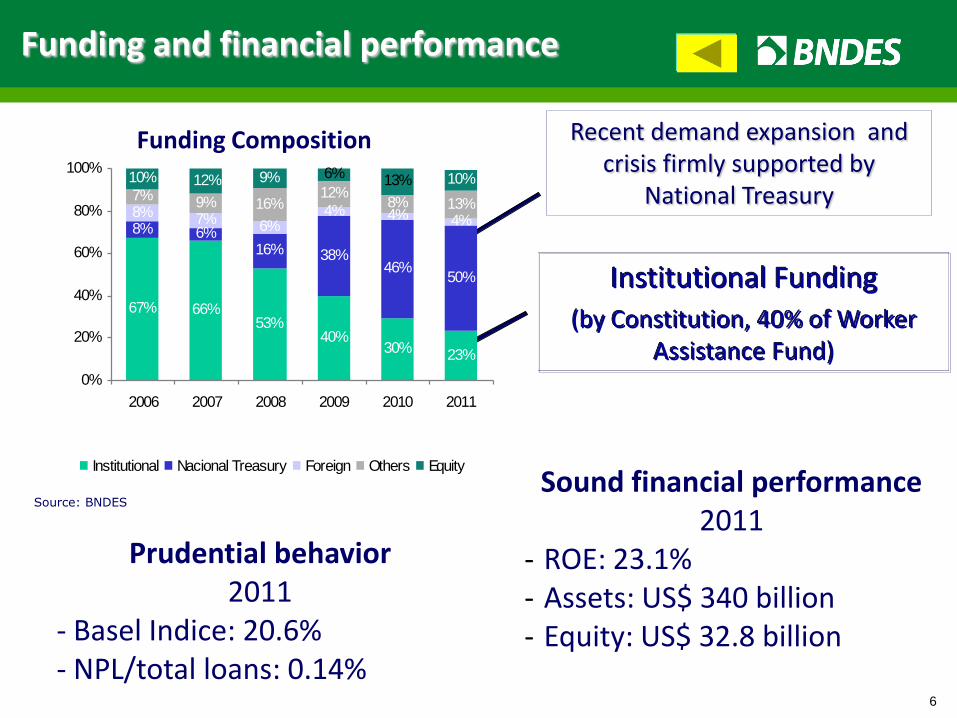
Funding Composition
Prudential behavior 2011
- Basel Indice: 20.6% - NPL/total loans: 0.14%
Source: BNDES
Funding and financial performance
Recent demand expansion and crisis firmly supported by
National Treasury
Institutional Funding
(by Constitution, 40% of Worker Assistance Fund)
Sound financial performance 2011
- ROE: 23.1% - Assets: US$ 340 billion - Equity: US$ 32.8 billion
67% 66%53%
40%30% 23%
8% 6%16% 38%
46%50%
8% 7% 6%4% 4% 4%
7% 9% 16%12%
8% 13%
10%10% 12% 9% 6% 13%
0%
20%
40%
60%
80%
100%
2006 2007 2008 2009 2010 2011
Institutional Nacional Treasury Foreign Others Equity
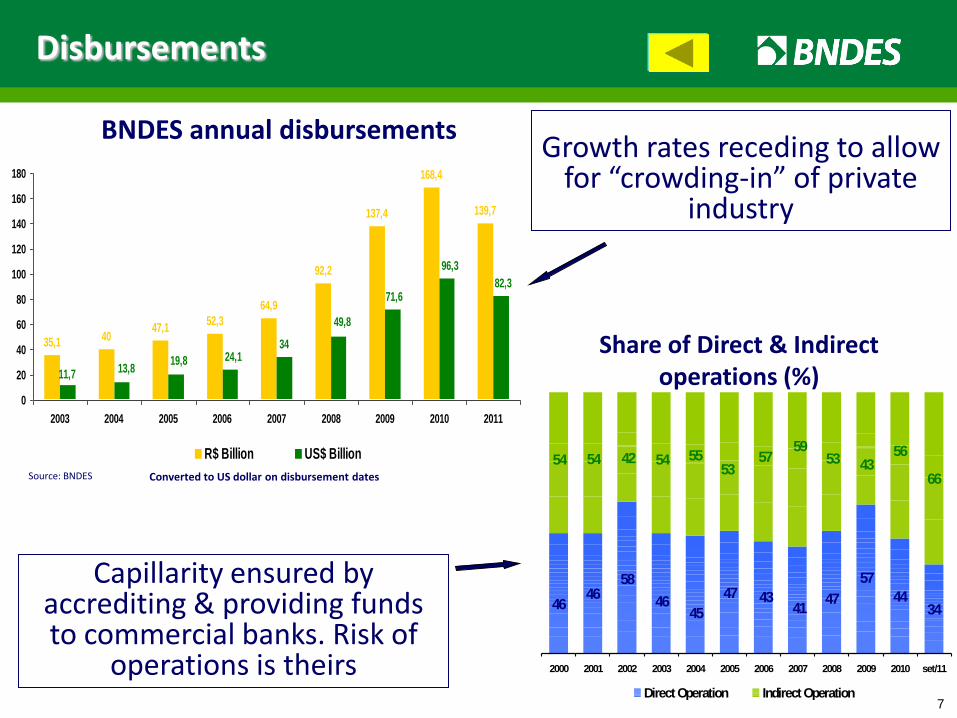
BNDES annual disbursements
Converted to US dollar on disbursement dates
35,1 4047,1
52,3
64,9
92,2
137,4
168,4
139,7
34
82,3
96,3
71,6
49,8
24,119,813,811,7
0
20
40
60
80
100
120
140
160
180
2003 2004 2005 2006 2007 2008 2009 2010 2011
R$ Billion US$ Billion
Growth rates receding to allow for “crowding-in” of private
industry
Source: BNDES
Share of Direct & Indirect operations (%)
Capillarity ensured by accrediting & providing funds to commercial banks. Risk of
operations is theirs
Disbursements
4434
66
57
4741
4347
4546
5846
46
565753
555442545459
53 43
2000 2001 2002 2003 2004 2005 2006 2007 2008 2009 2010 set/11
Direct Operation Indirect Operation7

8
Financing by type of clients
Share of MSMEs in total disbursement
N° of MSMEs supported in 2011
45.83557.480
109.121
176.678
235.984
0
50.000
100.000
150.000
200.000
250.000
2007 2008 2009 2010 2011
Cartão BNDES: - 510,000 active cards - 2011: R$ 7.6 bi - 2012: R$ 11. bi (expected)
85.5% of townships with active operations with BNDES credit card for SMEs
Source: BNDES
21,5%
31,8%
35,9%
41,4%
24,0% 24,8%
15%
20%
25%
30%
35%
40%
45%
2007 2008 2009 * 2010 * 2011 up to march 2012
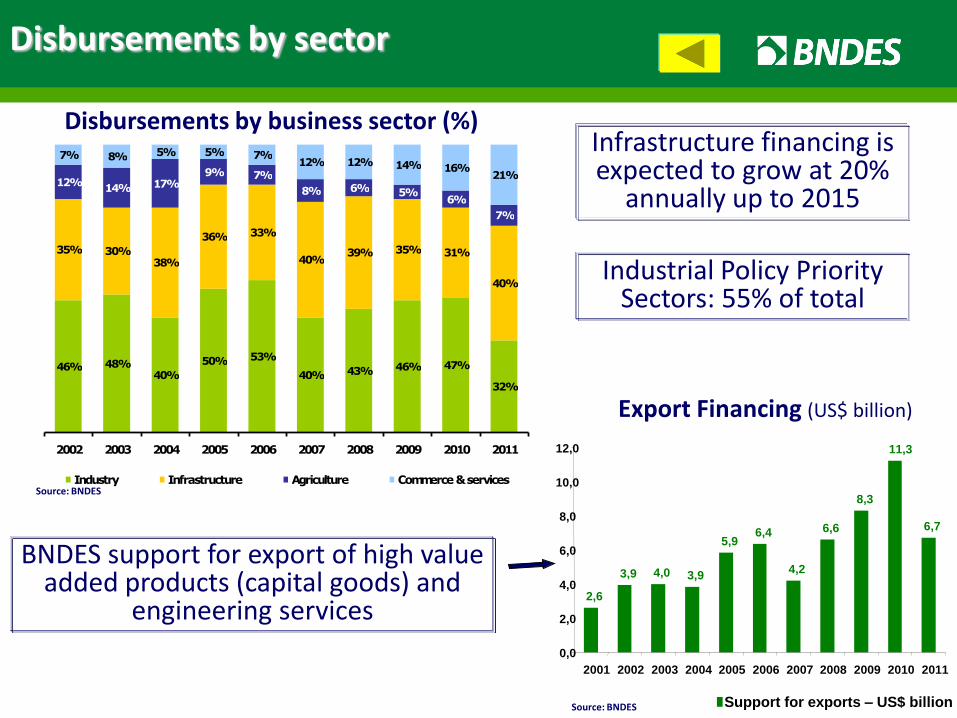
Disbursements by business sector (%)
Source: BNDES
Disbursements by sector
2,6
3,9 4,0 3,9
5,9 6,4
4,2
6,6
8,3
11,3
6,7
0,0
2,0
4,0
6,0
8,0
10,0
12,0
2001 2002 2003 2004 2005 2006 2007 2008 2009 2010 2011
Support for exports – US$ billion
Export Financing (US$ billion)
BNDES support for export of high value added products (capital goods) and
engineering services
Source: BNDES
Infrastructure financing is expected to grow at 20%
annually up to 2015
Industrial Policy Priority Sectors: 55% of total
46% 48%40%
50% 53%
40% 43% 46% 47%
32%
35% 30%38%
36% 33%
40%39% 35% 31%
40%
12%14% 17%
9% 7%
8% 6% 5%6%
7%
7% 8% 5% 5% 7%12% 12% 14% 16%
21%
2002 2003 2004 2005 2006 2007 2008 2009 2010 2011
Industry Infrastructure Agriculture Commerce & services

BNDES as an Investment Bank
Source: BNDES.
BNDES Equity Portfolio (USD million) BNDES Portfolio in PE/VC Funds
USD million (April/2012) – USD/R$ = 1,90
Brazil´s largest investor in PE & VC
BNDES brand attracts new investors
Long experience: 35 years involved with capital markets
66,8
60,5
22,5
28,2
49,7
25,3
59,1
75,6
52,450,848,1
25,1
13,412,28,46,90,0
10,0
20,0
30,0
40,0
50,0
60,0
70,0
80,0
2005 2006 2007 2008 2009 2010 2011 mar/ 12
US$
billio
n
MARKET VALUE COST VALUE
3718671Education
Fund Focus#
Funds
#
Corps.
All
Commit.
Equity
BNDES
Commit.
Equity
Innovation 9 100 247 95
Infrastruct 7 45 2.176 448
Governance 4 20 482 84
Environment 3 5 745 205
Regional 2 10 79 14
Agribusiness 2 8 598 119
Food 1 4 49 11
Total 29 199 4.562 1.013
3718671Education
Fund Focus#
Funds
#
Corps.
All
Commit.
Equity
BNDES
Commit.
Equity
Innovation 9 100 247 95
Infrastruct 7 45 2.176 448
Governance 4 20 482 84
Environment 3 5 745 205
Regional 2 10 79 14
Agribusiness 2 8 598 119
Food 1 4 49 11
Total 29 199 4.562 1.013
10
11
Finance expansion of capacity, fill gaps, fix failures, induce externalities…
Foster an innovative, sustainable long term financing industry
Contribute to systemic stability (anti-cyclical role)
Appropriate and distribute (to society, via the State) returns of (financial) investment decisions
Scope of potential contributions to development

12
Political priority: The role/mandate of a DB must be enforced at the highest political level
Stable funding: the basic asset to finance long term
Scale and scope: A DB must have the means – resources and instruments- for accomplishing mandates.
Capacity to change: Flexible adaptation to different stages and momentum of a country development.
Competences and values: a servant of public interest; effectiveness and efficiency; team player: an instrument to build the future.
Essential assets and capabilities
Of course, these assets are not “ready made”…

Development Banks, financial industry and economic development
Each Development Bank is a singular institution. No role model exists.
As market based finance has proved to not induce sustainable development, a stronger configuration for a national finance industry is where private and public institutions co-live (But… attention!!! Time and place do matter in defining the mode of relation. Again, no role model exists…)
A Development Bank should not be the vanguard nor the rearguard but the co-guard of development
13

João Carlos Ferraz Vice President
Central Banks, Financial Systems and Economic Development
The experience of Development Banks
2012 Money and Banking Conference Buenos Aires, October 1st, 2012