the ferc’s return on common equity...
TRANSCRIPT
B YR O B E R T K E Y T O N
F I N A N C I A L A N A L Y S TF E D E R A L E N E R G Y R E G U L A T O R Y C O M M I S S I O N
4 / 2 9 / 1 6
The FERC’s Return on Common Equity Methodology
Disclaimer: The views expressed in this presentation do not necessarily represent the views of the Commission.

Return on Common Equity Method
A two-step (two-stage) Discounted Cash Flow (DCF) method was adopted by the FERC in Opinion No. 531 (2014)
Formula K=(1 + .5(g))(D/P) + g g=(2/3)(ST) + (1/3)(LT)
2
Reason for Methodological Change
Reason for Change Mature Industry Narrows the zone of reasonableness Consistency may have been a factor: in general, the same two-
step DCF method used in FERC natural gas proceedings
3
Formation of Proxy Group Companies
Screening Criteria Tracked by Value Line Allow companies with plus or minus one credit rating (S&P or
Moody’s) from subject company’s credit rating Pays dividends, no dividend cuts No significant merger or acquisition activity Has a short-term growth estimate
4

Performing a two-step DCF Analysis
Inputs to two-step DCF method Stock prices Dividends Short-term earnings growth estimates Long-term Gross Domestic Product (GDP) growth estimates
5
Data Period and Effective Period
Data Period Six months, in general, is sufficient time to diminish any
aberrations in stock prices
Prospective effective period In general, use the most recent six-month data period available
Locked-in effective period In general, use the most recent six-month data period that
includes the locked-in period
6
DCF Analysis Example
Ameren Corporation (AEE) for the six-month data period from July 1, 2015 to December 31, 2015.
Taken from my filed update testimony in the MISO ROE Complaint case filed at the FERC under Docket No. EL15-45.
7
Stock prices
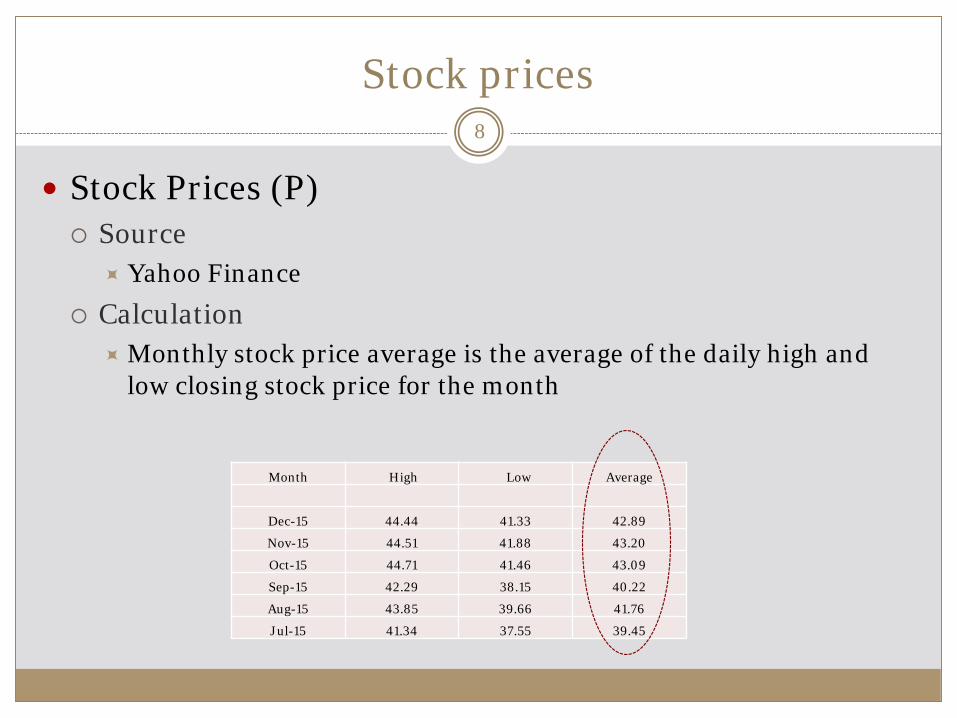
Stock Prices (P) Source
Yahoo Finance Calculation
Monthly stock price average is the average of the daily high and low closing stock price for the month
Month High Low Average
Dec-15 44.44 41.33 42.89
Nov-15 44.51 41.88 43.20
Oct-15 44.71 41.46 43.09
Sep-15 42.29 38.15 40.22
Aug-15 43.85 39.66 41.76
Jul-15 41.34 37.55 39.45
8

Dividends
Dividends (D) Source
Standard & Poor’s Monthly Stock Guide or equivalent source Calculation
Current dividend (declared) for each month annualized
Declared Dividend Indicated DividendMonth
Dec-15 0.4250 1.70 Nov-15 0.4250 1.70 Oct-15 0.4250 1.70 Sep-15 0.4100 1.64 Aug-15 0.4100 1.64 Jul-15 0.4100 1.64
9
Unadjusted Dividend Yield
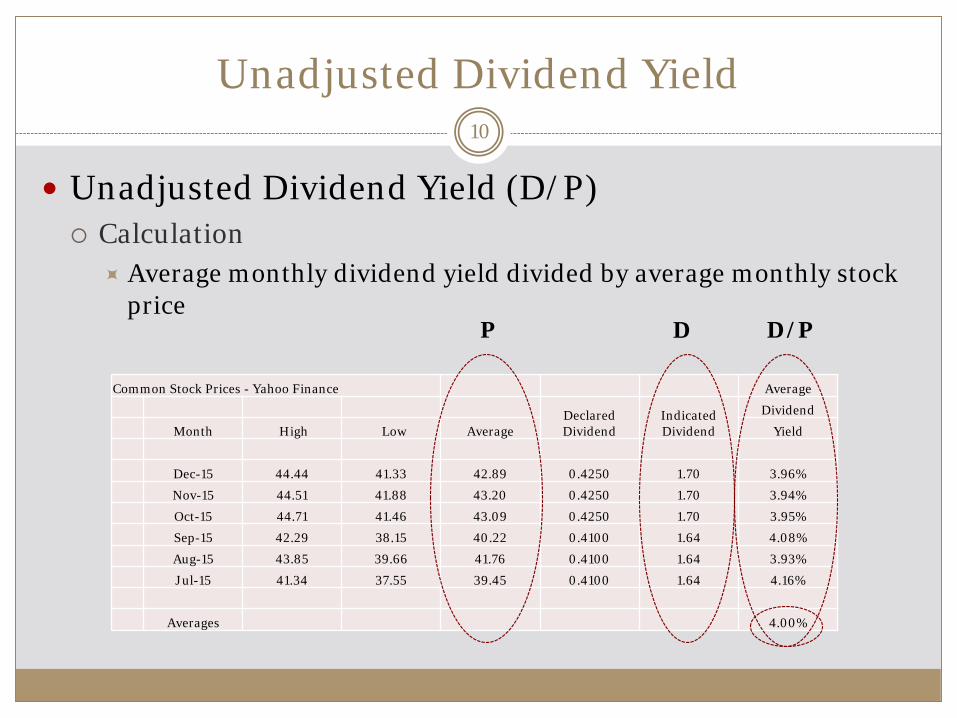
Unadjusted Dividend Yield (D/P) Calculation
Average monthly dividend yield divided by average monthly stock price
Common Stock Prices - Yahoo Finance Average
Declared Dividend
Indicated Dividend
Dividend
Month High Low Average Yield
Dec-15 44.44 41.33 42.89 0.4250 1.70 3.96%
Nov-15 44.51 41.88 43.20 0.4250 1.70 3.94%
Oct-15 44.71 41.46 43.09 0.4250 1.70 3.95%
Sep-15 42.29 38.15 40.22 0.4100 1.64 4.08%
Aug-15 43.85 39.66 41.76 0.4100 1.64 3.93%
Jul-15 41.34 37.55 39.45 0.4100 1.64 4.16%
Averages 4.00%
P D/PD
10
Dividend Adjustment Factor
Purpose Compensate investors for potential quarterly dividend
increases during the year
Calculation (1+.5(g))(D/P), (g) being the composite growth For AEE, (1+.5(g))(4%)
11
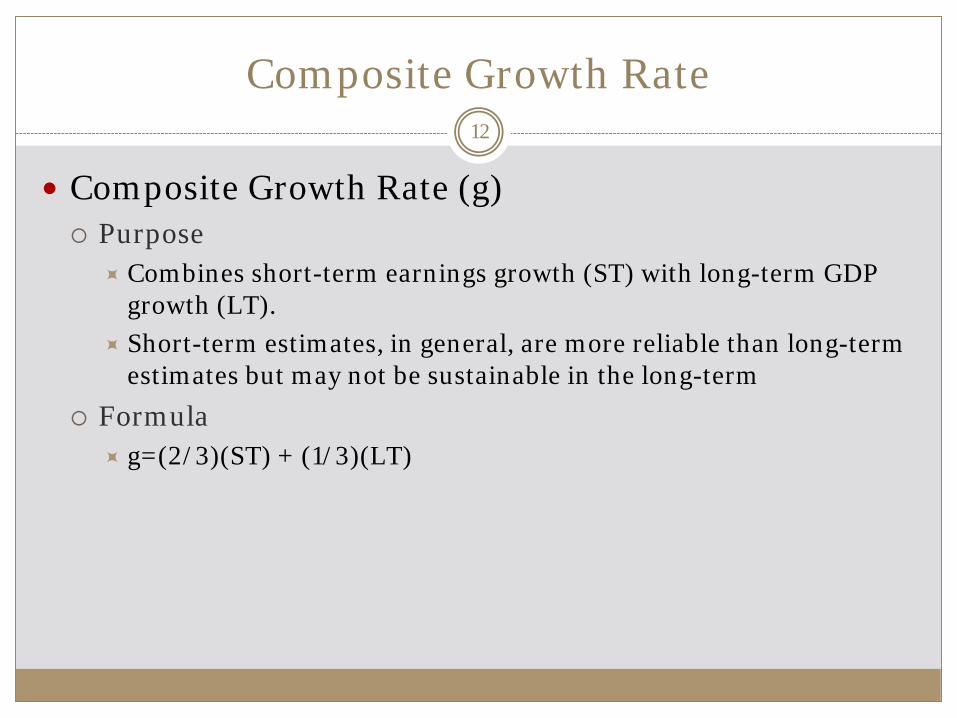
Composite Growth Rate
Composite Growth Rate (g) Purpose
Combines short-term earnings growth (ST) with long-term GDP growth (LT).
Short-term estimates, in general, are more reliable than long-term estimates but may not be sustainable in the long-term
Formula g=(2/3)(ST) + (1/3)(LT)
12

Short-term Earnings Growth Estimate
Purpose Short-term earnings growth (ST), 3-5 years, used as a
substitute for short-term dividend growth.
Source Institutional Brokers’ Estimate System (IBES) retrieved at
Yahoo Finance AEE had an IBES estimate of 6% as of January 8, 2016
Opinion No. 531 IBES or a comparable source. Preference for analysis to consist of short-term earnings
growth estimates all from one source.
13
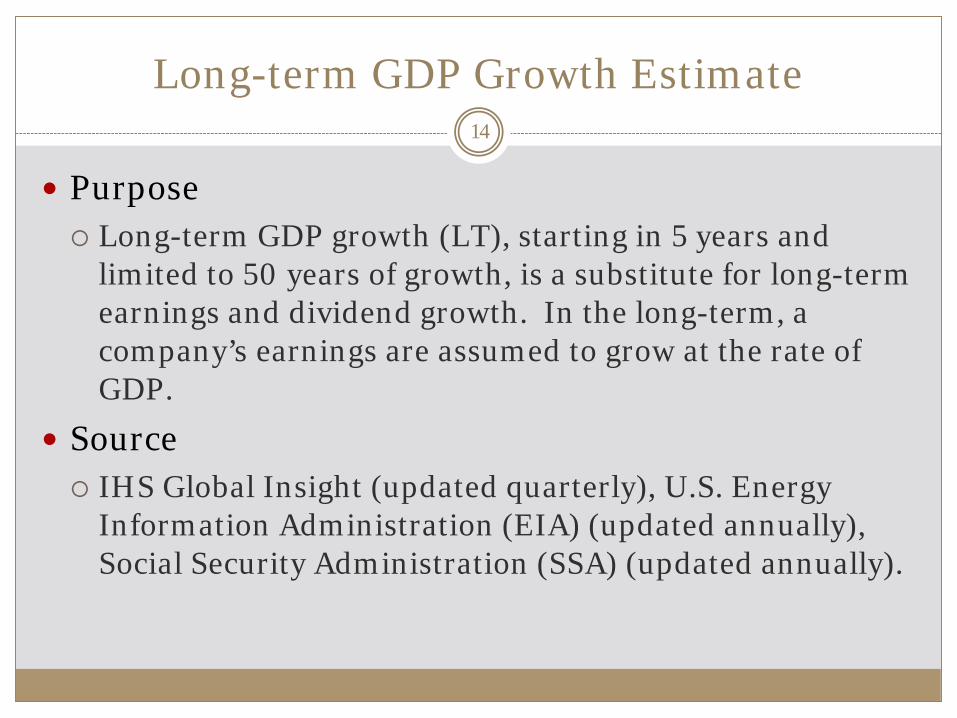
Long-term GDP Growth Estimate
Purpose Long-term GDP growth (LT), starting in 5 years and
limited to 50 years of growth, is a substitute for long-term earnings and dividend growth. In the long-term, a company’s earnings are assumed to grow at the rate of GDP.
Source IHS Global Insight (updated quarterly), U.S. Energy
Information Administration (EIA) (updated annually), Social Security Administration (SSA) (updated annually).
14
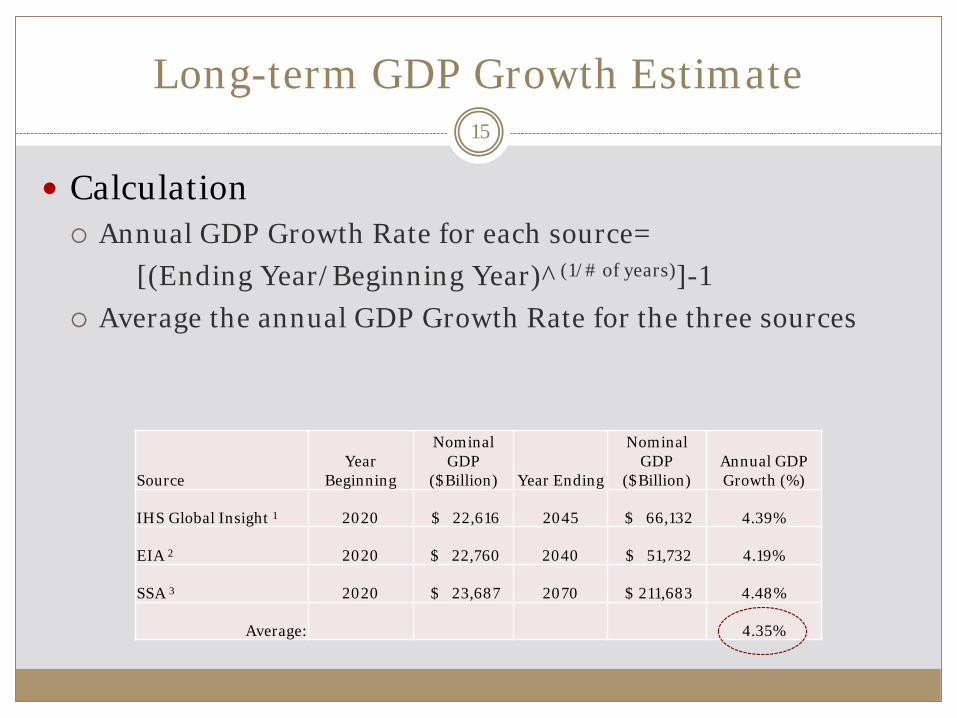
Long-term GDP Growth Estimate
Calculation Annual GDP Growth Rate for each source=
[(Ending Year/Beginning Year)^(1/# of years)]-1 Average the annual GDP Growth Rate for the three sources
SourceYear
Beginning
Nominal GDP
($Billion) Year Ending
Nominal GDP
($Billion)Annual GDP Growth (%)
IHS Global Insight 1 2020 $ 22,616 2045 $ 66,132 4.39%
EIA 2 2020 $ 22,760 2040 $ 51,732 4.19%
SSA 3 2020 $ 23,687 2070 $ 211,683 4.48%
Average: 4.35%
15
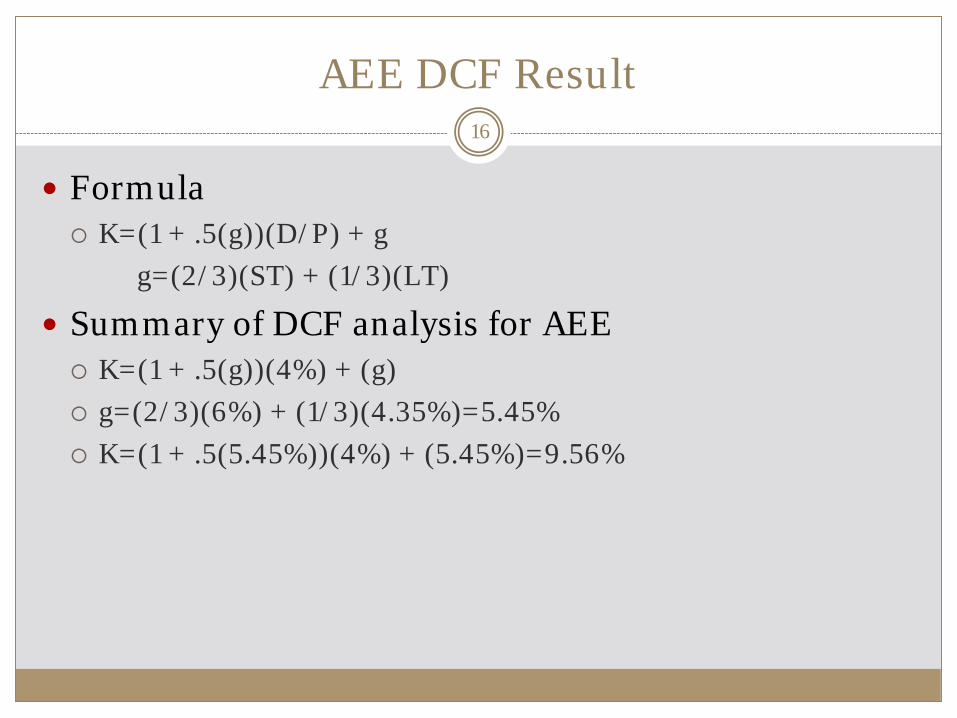
AEE DCF Result
Formula K=(1 + .5(g))(D/P) + g
g=(2/3)(ST) + (1/3)(LT)
Summary of DCF analysis for AEE K=(1 + .5(g))(4%) + (g) g=(2/3)(6%) + (1/3)(4.35%)=5.45% K=(1 + .5(5.45%))(4%) + (5.45%)=9.56%
16
DCF Results
Screening criteria Low-end DCF outlier result screen
Based on 100 basis point threshold above corresponding six-month average utility bond yield
High-end DCF outlier result screen No prescribed method reflecting current market conditions Check for unsustainable or skewed results (Trial Staff)
This screening criteria defines the zone of reasonableness (range)
17
Measure of Central Tendency
Central Tendency Median: single utility Midpoint: establishing an RTO-wide ROE
Multiple utilities may reflect a spectrum of DCF results Upper midpoint (Opinion No. 531) – Anomalous market
conditions exist in establishing an RTO-wide ROE In general, for a single utility, if the Commission were to
determine that anomalous market conditions exist, Trial Staff believes that the true 75th percentile would be the appropriate measure of central tendency.
18
Adjustments within Zone of Reasonableness
Any adjustments deviating from the measure of central tendency must remain within the zone of reasonableness (range). Risk adjustment Inclusion of RTO and/or incentive adders Anomalous market conditions
Not all point estimates within the range are assumed to be just and reasonable for ratemaking purposes
19

Questions20