inside ferc’s gas market report - platts ferc’s gas market report analysis several major...
TRANSCRIPT

Friday, October 9, 2015
www.platts.com www.twitter.com/PlattsGas NATURAL GAS
INSIDE FERC’s GAS MARKET REPORT
ANALYSIS Several major pipeline expansion projects are scheduled to begin service November 1, the start of the winter season for the gas markets. Some will simply expand pipeline capacity and throughput, increasing takeaway capacity from the Northeast. Others are expected to facilitate incremental production growth.
In total, about 2.44 Bcf/d of incremental capacity is expected to come online through the rest of the year, pushing the total takeaway capacity from the Northeast this year to 3.9 Bcf/d — largely from REX’s Zone 3 East-to-West and TETCO’s Uniontown to Gas City.
The new capacity on REX has supported growth in Utica production; however, utilization has only averaged 79% of project capacity since September 1. The Uniontown to Gas City project has seen flows through the Sarahsville compressor jump from an average of 355 MMcf/d in August to 581 MMcf/d since September 1, though still only a 77% utilization rate based on the listed capacity of 750 MMcf/d.
Bentek Energy, a unit of Platts, expects utilization to increase as winter demand picks up and prices gain strength.
Northeast pipe expansions to boost production as winter season begins
ANALYSIS The upcoming winter in the New England gas market appears likely to be similar to last winter because there have been no major changes in infrastructure and the Federal Energy Regulatory Commission has accepted a similar reliability plan for the region.
The New England winter market has been highly constrained in the past and prone to major price spikes due to pipeline deliverability limitations. Winter cash prices at Algonquin city-gates spiked to as high as $67/MMBtu during the winter of 2013-14, prompting the expansion of a winter reliability program designed to encourage more fuel diversity and alternative supply options.
Last winter’s reliability program included LNG imports, which helped soften natural gas price spikes. The program grants end-of-season compensation for LNG contract volumes that were available for use during the winter but were not called upon to produce energy, giving utilities additional assurance when purchasing supply for the winter.
Last winter’s market was somewhat less volatile, including cash basis highs at Algonquin city-gates that only reached $26/MMBtu despite the retirement of the 563-MW Vermont Yankee nuclear plant and the 805-MW Salem Harbor coal generating station.
New England winter outlook similar to last, with LNG limiting price spikes
M&A Just three months after rejecting a takeover bid from Energy Transfer Equity as not being generous enough, The Williams Companies late last month agreed to be acquired under very similar terms.
The merger, valued at $37.7 billion, would create the third largest energy company in North America and one of the five largest energy companies in the world, the companies said in a joint statement.
Although the deal terms are similar to an unsolicited ETE takeover offer Williams turned down in June, the total value of the merger has shrunk along with the values of both companies. At the time the current deal was announced, it valued Williams at $43.50 per share. While this represents a 4.6% premium to Williams closing share price on September 26, the earlier offer had placed Williams’s stock value at $64 per share.
In another change from that earlier bid, which had been all-stock, ETE sweetened the current deal with a cash component. In the current offer, Williams’ stockholders will have the right to elect to receive either ETC common shares or a combination of cash and shares.
The merger would create a company with more than 100,000 miles of pipeline transporting gas, NGLs and other energy products, and a large network of midstream assets. Energy Transfer owns about 71,000 miles of pipeline and a midstream and processing network that
ETE purchase of Williams to create North American, global energy giant
INsIdE ThIs IssuE
Markets
Gas on top in July, edges out coal 3Production, storage to keep winter prices flat 4
LNG
LNG export developers counter dire forecasts 13Jordan Cove clears environmental hurdle 14
Pipelines
Mountain Valley targets W.Va., Va. end-users 15Algonquin maintenance to continue into November 16
Exploration and Production
E&Ps use varied strategies for downturn: IPAA speakers 17US Interior official pushes Arctic rules despite Shell’s move 18
M&A
Southern positions itself for the future with AGL: CEO 19NextEra Energy completes purchase of NET Midstream 20
Regulation
Bay defends FERC environment policies 22Moeller to leave FERC at month’s end 23
Mexico
US pipeline gas to Mexico, replacing LNG imports 24
(continued on page 26)(continued on page 26)
2
OctOber 9, 2015INSIDe Ferc’S GAS MArKet rePOrt
copyright © 2015 McGraw Hill Financial
Officers of the corporation: Harold McGraw III, chairman; Doug Peterson, President and chief executive Officer; Lucy Fato, executive Vice President and General counsel; Jack F. callahan, Jr., executive Vice President and chief Financial Officer; elizabeth O’Melia, Senior Vice President, treasury Operations.
Gas Market Report Questions?email: NAGas&[email protected]
Manager North America Gas and Power Contentrocco canonica, +1-720-264-6626Anne Swedberg, +1-720-264-6728
EditorsJim Magill, +1-713-658-3229Jasmin Melvin, +1-202-383-2161chris Newkumet, +1-202-383-2141Arjun Sreekumar, +1-713-655-2258Mark Watson, +1-713-658-3214
Editorial Director, North American Gas and Power PricingMark callahan
Editorial Director, North American Gas and Power ContentJames O’connell
Global Editorial Director, PowerSarah cottle
Manager, Advertisement SalesKacey comstock
Friday, October 9, 2015
Chief Content OfficerMartin Fraenkel
Platts PresidentImogen Dillon Hatcher
Advertisingtel : +1-720-264-6631
INSIDE FERC’s GAS MARKET REPORT
copyright © 2015 by Platts, McGraw Hill Financial
To reach Platts: e-mail:[email protected]; North America: tel:800-PLAttS-8; Latin America: tel:+54-11-4121-4810; europe & Middle east: tel:+44-20-7176-6111; Asia Pacific: tel:+65-6530-6430
Restrictions on Use: You may use the prices, indexes, assessments and other related information (collectively, “Data”) in this publication only for your personal use or, if your company has a license from Platts and you are an “Authorized User,” for your company’s internal business. You may not publish, reproduce, distribute, retransmit, resell, create any derivative work from and/or otherwise provide access to Data or any portion thereof to any person (either within or outside your company including, but not limited to, via or as part of any internal electronic system or Internet site), firm or entity, other than as authorized by a separate license from Platts, including without limitation any subsidiary, parent or other entity that is affiliated with your company, it being understood that any approved use or distribution of the Data beyond the express uses authorized in this paragraph above is subject to the payment of additional fees to Platts.
Disclaimer: DAtA IN tHIS PUbLIcAtION IS bASeD ON MAterIALS cOLLecteD FrOM ActUAL MArKet PArtIcIPANtS. PLAttS, ItS AFFILIAteS AND ALL OF tHeIr tHIrD-PArtY LIceNSOrS DIScLAIM ANY AND ALL WArrANtIeS, eXPreSS Or IMPLIeD, INcLUDING, bUt NOt LIMIteD tO, ANY WArrANtIeS OF MercHANtAbILItY Or FItNeSS FOr A PArtIcULAr PUrPOSe Or USe AS tO tHe DAtA, Or tHe reSULtS ObtAINeD bY ItS USe Or AS tO tHe PerFOrMANce tHereOF. A reFereNce tO A PArtIcULAr INVeStMeNt, SecUrItY, rAtING Or ANY ObSerVAtION cONcerNING A SecUrItY Or INVeStMeNt PrOVIDeD IN tHe DAtA IS NOt A recOMMeNDAtION tO bUY, SeLL Or HOLD SUcH INVeStMeNt Or SecUrItY Or MAKe ANY
OtHer INVeStMeNt DecISIONS. NeItHer PLAttS, NOr ItS AFFILIAteS Or tHeIr tHIrD-PArtY LIceNSOrS GUArANtee tHe ADeQUAcY, AccUrAcY, tIMeLINeSS Or cOMPLeteNeSS OF tHe DAtA Or ANY cOMPONeNt tHereOF Or ANY cOMMUNIcAtIONS, INcLUDING bUt NOt LIMIteD tO OrAL Or WrItteN cOMMUNIcAtIONS (WHetHer IN eLectrONIc Or OtHer FOrMAt), WItH reSPect tHeretO.
AccOrDINGLY, ANY USer OF tHe DAtA SHOULD NOt reLY ON ANY rAtING Or OtHer OPINION cONtAINeD tHereIN IN MAKING ANY INVeStMeNt Or OtHer DecISION. PLAttS, ItS AFFILIAteS AND tHeIr tHIrD-PArtY LIceNSOrS SHALL NOt be SUbJect tO ANY DAMAGeS Or LIAbILItY FOr ANY errOrS, OMISSIONS Or DeLAYS IN tHe DAtA. tHe DAtA AND ALL cOMPONeNtS tHereOF Are PrOVIDeD ON AN “AS IS” bASIS AND YOUr USe OF tHe DAtA IS At YOUr OWN rISK.
Limitation of Liability: IN NO eVeNt WHAtSOeVer SHALL PLAttS, ItS AFFILIAteS Or tHeIr tHIrD-PArtY LIceNSOrS be LIAbLe FOr ANY INDIrect, SPecIAL, INcIDeNtAL, PUNItIVe Or cONSeQUeNtIAL DAMAGeS, INcLUDING bUt NOt LIMIteD tO LOSS OF PrOFItS, trADING LOSSeS, Or LOSt tIMe Or GOODWILL, eVeN IF tHeY HAVe beeN ADVISeD OF tHe POSSIbILItY OF SUcH DAMAGeS, WHetHer IN cONtrAct, tOrt, StrIct LIAbILItY Or OtHerWISe.
Permission is granted for those registered with the copyright clearance center (ccc) to photocopy material herein for internal reference or personal use only, provided that appropriate payment is made to the ccc, 222 rosewood Drive, Danvers, MA 01923, phone (978) 750-8400. reproduction in any other form, or for any other purpose, is forbidden without express permission of McGraw Hill Financial. For article reprints contact: the YGS Group, phone +1-717-505-9701 x105. text-only archives available on Dialog File 624, Data Star, Factiva, LexisNexis, and Westlaw.
Platts is a trademark of McGraw Hill Financial
South American LNG is published weekly by Platts, a division of McGraw Hill Financial, registered office: two Penn Plaza, 25th Floor, New York, N.Y. 10121-2298.
spans Texas, the Gulf Coast and the Midcontinent.Williams owns about 33,000 miles of pipeline, concentrated
in the Northeast. Its most important asset, the Transcontinental Gas Pipe Line system, connects the gas-producing regions of South Texas with hungry Northeast markets, including New York City.
The merger also is expected to have a significant impact on the NGL side of the business, said Kendall Puig, an analyst with Platts unit Bentek Energy. “They’re creating a huge company that’s probably more close to the size of Enterprise,” the largest NGL player, she said.
The combination would connect Williams’ gas processing plants and pipelines to the Energy Transfer system, which includes Sunoco, giving the Williams’ assets increased access to the petrochemical complex in Mont Belvieu, Texas, as well storage and marine terminals in the Northeast.
“Sunoco has Mariner East and Marcus Hook that could export NGLs that are being produced in William plants,” Puig said. “It connects Williams’ assets with more export options.”
Williams backs out of deal to buy affiliateIn a joint statement on September 28, the two companies
said their respective boards of directors each had approved the merger.
The ETE merger with Williams was predicated on Williams’ decision to cancel a previously announced merger agreement between Williams and its affiliate Williams Partners. Williams had announced that deal, which it valued at $13.8 billion, in May in a bid to simplify its corporate structure.
As part of the ETE/Williams merger deal, Williams Partners will retain its current name and remain an independent publicly traded
partnership headquartered in Tulsa.“I believe that the combination of Williams and ETE will create
substantial value for both companies’ stakeholders that would not be realized otherwise,” Kelcy Warren, ETE’s chairman, said in the joint statement.
“After a comprehensive evaluation of strategic alternatives, including extensive discussions with numerous parties, the Williams board of directors concluded that a merger with Energy Transfer Equity is in the best interests of Williams’ stockholders and all of our other stakeholders,” Williams Chairman Frank MacInnis said.
“Williams’ intense focus on connecting the best natural gas supplies to the best natural gas markets will be a significant complement to the ETE family of diverse energy infrastructure,” Williams President and CEO Alan Armstrong said.
ETE said it expects that the earnings from these commercial synergies will exceed $2 billion/year by 2020. The combined company is expected to make a capital investment of more than $5 billion to achieve the hoped-for synergies.
A source familiar with the deal said ETE approached Williams in April to open merger negotiations. ETE went public with its offer in a letter to Williams dated May 19, followed by a letter to the Williams board June 18, spelling out its offer of a $53 billion all-equity buyout.
Initial buyout offer rejectedWilliams’ board rejected that offer saying it “significantly
undervalues Williams and would not deliver value commensurate with what Williams expects to achieve on a standalone basis and through other growth initiatives, including the pending acquisition of [Williams Partners].”

3
OctOber 9, 2015INSIDe Ferc’S GAS MArKet rePOrt
copyright © 2015 McGraw Hill Financial
At the time, Williams said it would review its strategic alternatives and the company reportedly entered into talks with several other big pipeline companies about a possible merger, talks that eventually went nowhere.
If it is consummated, “this deal would be identical to the proposed and rejected deal outlined in mid-June (split-adjusted),” Jefferies analyst Christopher Sighinolfi said in a note to investors on September 28.
Sighinolfi added that although many William shareholders would view the merger announcement in a positive light, “we believe some shareholders may be disappointed as the implied value is identical to what was rejected just three months earlier and were perhaps expecting a marginal uplift in implied deal terms.”
The deal is expected to be immediately accretive to cash flow and distributions for both companies, the statement said.
— Jim Magill
MARkETs
Gas on top in July, edges out coal in power generation for full monthFor only the second time this year, and only the second time since such data started being collected in 1973, gas-fired power edged coal-fired generation for a full calendar month, according to a report released October 7 by the US Energy Information Administration.
For the month of July, gas fueled 35% of the nation’s total electricity generation compared to coal’s 34.9%. The only other time gas edged out coal was in April, with 92,516 GWh for gas versus 88,516 GWh for coal for the month.
But coal quickly took back the lead in May. At the time, EIA predicted it would be the last time in 2015 gas would best coal in power generation. They made the prediction based on an expected increase in gas prices that never materialized.
“Monthly coal-fired generation is expected to continue exceeding natural gas-fired generation for the remainder of 2015, as natural gas prices slowly rise from their April average price of $2.61/MMBtu to about $3.30/MMBtu by December,” read the EIA report at the time.
Instead, gas prices have continued a downward trend due to unprecedented production levels coupled with improved efficiencies. The monthly average price at Henry Hub declined from $4.14/MMBtu in July 2014 to $2.91/MMBtu in July 2015, and it has since fallen to $2.72/MMBtu for September. The sustained low prices hint July is not the last time this year gas passes coal for a month. The winter is also expected to set another record for gas production, averaging 74 Bcf/d throughout the season.
Since last July, coal-fired generation has slipped in every region, but was most pronounced in the Mid-Atlantic where it fell 3.6%, according to EIA data. Texas was next where it witnessed a 1.9% drop. Meanwhile, gas-fired power gained ground in every region, growing the most in the Southeast at 7.6% followed by the Central US at 6.6%.
A recent winter outlook study by Natural Gas Supply Association (NGSA) expects continued growth in the electric sector throughout the winter. The study forecast a substantial winter-over-winter gas demand
growth in the power sector of 5% or 1.1 Bcf/d, with a total winter fuel switching of 5.6 Bcf/d. The winter record of 6 Bcf/d of coal-to-gas switching occurred in winter 2011-12.
“The continued stability and abundant supply of natural gas is great news for consumers,” said Bill Green, NGSA chairman. “We anticipate neutral pressure on prices compared to last winter.”
“We anticipate temporary fuel-switching to natural gas to reach near-record levels this winter,” Green added.
Multiple factors have played a role in coal’s slow demise. Gas started climbing the ladder when the shale boom began in 2007 leading to lower prices. More recently, stricter environmental standards have prompted more and more utilities to switch from coal- to gas-fired power plants as well as adding renewables to company portfolios. These regulations include the US Environmental Protection Agency’s Mercury and Air Toxics Standard and the more recently unveiled Clean Power Plan.
And the new ozone standards announced last week might prompt even more coal plant closures. Under the EPA’s new 70 ppb limit of ground-level ozone, 37 coal-fired generators scattered across the country fail to meet the new standards. According to the EPA’s Regulatory Impact Analysis, 30 of those plants either do not have selective catalytic reduction systems, or scrubbers, while the remaining seven have scrubbers, but fail to use them on a regular basis.
— Brandon Evans
Production, storage, other factors expected to keep winter prices flatChanges in natural gas production, storage, weather and customer demand are likely to keep this winter’s natural gas prices flat compared to last year, the Natural Gas Supply Association said September 30 in its winter outlook.
The combined factors are likely to “place neutral pressure” on winter 2014-15 prices, compared with last winter when Henry Hub prices averaged $3.21/MMBtu, NGSA said.
Slightly lower demand this winter will be balanced by a rise in domestic production levels, partially offset by lower net imports, according to an analysis prepared for the group by Energy Ventures Analysis. The net effect should be storage withdrawals of about 1.1 Bcf/d less than last winter, EVA said.
NGSA emphasized strong natural gas production and storage inventories approaching a new record.
“The picture that emerged for the upcoming winter is one of a flexible natural gas market that is able to respond to changes in weather and customer demand with abundant production and storage,” said Bill Green, chairman of NGSA and vice president of downstream marketing for Devon Energy.
The forecast predicts a slight dip in overall demand, down 0.7% to 90.2 Bcf/d, driven mostly by weather that is likely to be 7% warmer, lowering demand from residential and commercial sectors by 2.5 Bcf/d on average. That decline would be partly offset by strong demand growth of 5% or 1.1 Bcf/d in the electric sector, mostly attributed to fuel switching when utilities change over to gas-fired power temporarily

4
OctOber 9, 2015INSIDe Ferc’S GAS MArKet rePOrt
copyright © 2015 McGraw Hill Financial
because of lower fuel costs.EVA expects winter fuel switching to be 5.6 Bcf/d, near record
levels and up from 4.8 Bcf/d last year, NGSA said. Also driving the power sector increase is the permanent shift to gas-fired generation as coal plants are retired in efforts to comply with EPA Mercury and Air Toxics Standards.
On the demand side, the forecast sees a less than 1% increase from the industrial sector, although farther out, NGSA projected 3.9 Bcf in new industrial demand between now and 2020, pointing to 51 new projects and 15 expansions approved and under construction.
Projections call for demand to mirror last year’sThe demand projections assume average growth in GDP similar to
last winter, applying neutral pressure on prices. Manufacturing output is projected to grow only 0.7%, down from 3.3% growth the prior winter, it said, in part reflecting world economic conditions and a strong dollar.
The outlook predicts record natural gas production of 74.4 Bcf/d this winter, buoyed by drilling efficiencies and new pipeline infrastructure, to provide more than enough supply and putting neutral pressure on prices. That’s up from 73.0 Bcf/d last winter.
On storage, the group saw a potential for record inventories of gas this winter, applying downward pressure on prices.
The forecast assumes weather this winter at 3% warmer than the 30-year average, accounting for 3,432 heating degree days versus 3,685 days a year earlier. But it said the greatest uncertainty is in the weather forecast — if the winter turns out to be very cold, or similar to last winter, demand could be 2.5 Bcf/d more than projected, according to EVA.
Looking more closely at production, the report said declines in gas and oil prices have pulled down gas and oil-directed drilling 41% and 58% respectively, but that on a year-or-year basis, production is still up, with a 1.5 Bcf/d rise projected for this winter.
“Since 2013, shale’s continued to outperform our expectations and continue to grow,” Green told reporters. “The story is supply, supply, supply. It just keeps coming.”
Last year’s outlook “missed it” on the weather, which turned out to be colder than projected, and production, which surpassed expectations, Green noted.
He pointed to technological advances, such as the potential for repeat hydraulic fracking on older wells where only a portion of the gas was extracted, as averting a production drop in response to the current low-price environment and the drop in the number of well completions.
Separately, net imports are projected to decline, the EVA report said, due to increased exports to Mexico, the start of LNG exports from the Lower 48 states this winter and the reduction in Canadian imports, EVA said.
In the near term, Green said the early LNG exports are unlikely to affect prices, given the supply resources available.
The outlook relied on data from Energy Ventures Analysis and the Energy Information Administration for its demand and supply projections and IHS Economics for its economic projections.
— Maya Weber
Maintenance helps lift Northeast bidweek prices; other regions fallMonthly bidweek natural gas prices for October delivery fell at most locations, though Northeast points increased as the region was entering the chillier part of the year with several pipeline maintenance events on the books.
New England prices got the biggest lifts, with the Algonquin Gas Transmission city-gates and Tennessee Gas Pipeline zone 6 delivered both rising more than 80 cents month over month, Platts’ Inside FERC’s Gas Market Report price survey showed.
At Transcontinental Gas Pipe Line, zone 6 New York, prices were up 10 cents, or about 5%, to $2.23/MMBtu.
Transco began maintenance on Thursday at Station 515 as part of ongoing work on the Leidy Southeast Project expansion, which is set to enter service December 1. The Station 515 maintenance is scheduled to last through October 22.
Throughput at 515 will be capped at about 1.4 Bcf/d during the maintenance, down from a prior-month average of 1.7 Bcf/d, according to Bentek Energy, a unit of Platts.
Amid the maintenance, the Transco, Leidy Line receipts point remained one of the lowest prices in the October survey at just over $1/MMBtu, though its increase of 14 cents, or about 16%, marked one of the larger month-over-month increases.
Elsewhere on the Northeastern grid, Algonquin has several maintenance events slated for the month, including maintenance on the 30-inch-diameter mainline, will reduce capacity through the Stony Point compressor station to 530 MMcf/d from October 20 to November 2, down from a design capacity of roughly 1.5 Bcf/d.
AGT said based on historical nominations through Stony Point, it anticipates restrictions to interruptible, secondary services and potentially primary firm services.
The Algonquin city-gates index price was the only point in the survey higher than it was in the same month a year ago, topping the October 2014 price by 15 cents, according to Platts historical data.
With many weather forecasts painting pictures of a mild October, strong power burn has continued to give Northeast prices some support.
Year to date, Northeast power demand has averaged 6 Bcf/d, about 100 MMcf/d higher than the same period in 2012. Bentek said it expects the trend to continue through the rest of 2015 for an expected yearly average of 5.8 Bcf/d. That compares with an average of nearly 5.6 Bcf/d in the record year of 2012, according to Bentek data.
Texas Eastern Transmission gave notice to the US Federal Energy Regulatory Commission that it has commenced partial service on its Ohio Pipeline Energy Network project.
The OPEN project is will enable TETCO to flow an incremental 550 MMcf/d of firm capacity south from Zone M-2 to delivery points in Zones M-1 and West Louisiana.
TETCO M-2 October bidweek prices rose 5 cents to average $1.18/MMBtu, while TETCO M-3 inched up 2 cents to average $1.28/MMBtu.
Along the Gulf Coast, Henry Hub fell 8 cents to average $2.56/MMBtu. That closely mirrored the NYMEX Henry Hub October futures contract’s settlement of $2.563/MMBtu, down from September’s

5
OctOber 9, 2015INSIDe Ferc’S GAS MArKet rePOrt
copyright © 2015 McGraw Hill Financial
CLosING PRICEs foR NYMEX hENRY hub GAs fuTuREs CoNTRACT
Trading date 9/23 9/24 9/25 9/28 9/29 9/30 10/1 10/2 10/5 10/6Contract volume 253,756 336,894 305,592 301,577 255,583 288,925 361,754 270,858 219,946 317,670open interest 904,728 909,250 904,663 904,442 906,835 929,768 941,278 935,680 939,200 943,756
Oct 2015 $2.569 $2.591 $2.564 $2.563** $—- $—- $—- $—- $—- $—-Nov 2015 2.638 2.674 2.631 2.670 2.586 2.524 2.433 2.451 2.450 2.470Dec 2015 2.793 2.841 2.802 2.837 2.763 2.701 2.631 2.664 2.676 2.673Jan 2016 2.907 2.958 2.918 2.951 2.884 2.831 2.763 2.798 2.806 2.806Feb 2016 2.912 2.965 2.925 2.957 2.891 2.842 2.775 2.808 2.816 2.818Mar 2016 2.882 2.935 2.895 2.926 2.861 2.814 2.749 2.778 2.787 2.791Apr 2016 2.759 2.802 2.764 2.788 2.731 2.688 2.629 2.651 2.663 2.672May 2016 2.761 2.802 2.766 2.789 2.735 2.695 2.639 2.661 2.676 2.688Jun 2016 2.792 2.832 2.799 2.822 2.770 2.731 2.675 2.697 2.712 2.724Jul 2016 2.827 2.865 2.833 2.856 2.806 2.769 2.713 2.735 2.749 2.761Aug 2016 2.840 2.878 2.845 2.868 2.818 2.780 2.727 2.748 2.761 2.772Sep 2016 2.836 2.873 2.838 2.861 2.813 2.774 2.722 2.742 2.755 2.766Oct 2016 2.863 2.899 2.866 2.889 2.840 2.801 2.750 2.770 2.784 2.793Nov 2016 2.945 2.985 2.947 2.964 2.918 2.881 2.831 2.852 2.872 2.882Dec 2016 3.104 3.145 3.108 3.123 3.086 3.050 3.001 3.022 3.044 3.054Jan 2017 3.209 3.250 3.213 3.227 3.189 3.152 3.102 3.123 3.146 3.152Feb 2017 3.205 3.244 3.206 3.219 3.181 3.146 3.096 3.117 3.139 3.145Mar 2017 3.145 3.185 3.147 3.155 3.120 3.086 3.034 3.056 3.075 3.083
12-month ave. 2.793 2.835 2.798 2.824 2.792 2.746 2.684 2.709 2.720 2.728
Source: New York Mercantile Exchange
**Final Settlement price
$2.638/MMBtu.The October Henry bidweek price marked about a 37% decline
from the October 2014 price of $4.04/MMBtu.In southeast Texas, the Houston Ship Channel was down 12 cents
to $2.50/MMBtu. West Texas point El Paso-Permian Basin dropped 11 cents to a $2.42/MMBtu average.
Upper Midwest prices saw some mixed movements, with the Chicago city-gates stumbling 8 cents to $2.70/MMBtu. Dawn, Ontario ticked upward 1 cent to a $2.94/MMBtu average.
The Rockies Express Pipeline East-to-West Project capacity that has come online in the last couple of months is likely contributing downward pressure to the Chicago market as the project allows additional supply from the Marcellus to flow into that area.
Rockies points also may be feeling the effects of the project as Cheyenne Hub dropped 6 cents to average $2.41/MMBtu.
In Western Canada, Westcoast, Station 2 plummeted 31 cents, or 22%, to C$1.09/Gj as capacity restrictions downstream at the Huntingdon delivery area were scheduled to continue through October.
Northwest Pipeline at the Canadian Border was flat to average $2.41/MMBtu.
To the south, the Pacific Gas & Electric city-gate dipped 3 cents to $3.07/MMBtu, while Southern California Gas fell 9 cents to $2.62/MMBtu.
— Patrick Badgley
EIA forecasts drop for winter heating expense; warmer weather predictedExpectations for winter temperatures to be above the 10-year average across much of the US would drag natural gas expenditures for the average household down 10% from last winter’s costs, the Energy Information Administration said October 6 in its monthly outlook.
The agency’s October Short-Term Energy Outlook, which took a hard look at projected winter fuel needs, forecast residential gas demand to fall 6% this winter.
Henry Hub natural gas spot prices are expected to be 13% below last winter’s prices, EIA said, but residential prices for gas will only see a 4% decline from last winter. EIA explained that “changes in spot prices do not quickly translate into lower delivered residential prices” as the rates utilities charge are often “set by state utility commissions a year or more in advance and reflect the cost of gas purchased over many months.” The agency added that residential prices also “include a fixed component to cover utility operating costs and the cost to transport the natural gas.”
Nearly half of all US households keep warm during the winter with gas.
“Natural gas supplies should be adequate to meet demand this winter, as average household natural gas consumption during the heating season is expected to be the lowest in four years,” EIA Administrator Adam Sieminski said in an October 6 statement.
He added, “If winter temperatures come in as expected by US government weather forecasters, US consumers will pay less to stay warm this winter no matter what heating fuel they use.”
About 39% of US households rely on electricity as their primary heating source. Those households are expected to spend about $30, or 3%, less on heating costs this winter “as a result of 1% lower residential electricity prices and 2% lower consumption than last winter,” EIA said.
However, these projections, EIA cautioned, are based on the latest forecasts from the National Oceanic and Atmospheric Administration, and “weather can be unpredictable.”
“Under a 10% colder scenario, EIA projects natural gas consumption to be 1% higher than last year, but expenditures would still be 4% lower than last year. Under a 10% warmer scenario, EIA

6
OctOber 9, 2015INSIDe Ferc’S GAS MArKet rePOrt
copyright © 2015 McGraw Hill Financial
PRICEs of sPoT GAs dELIvEREd To PIPELINEs, oCTobER 1 ($/MMbtu)
Index Low high volume deals
ANR Pipeline Co.
Louisiana IGBBF03 2.49 2.49 2.49 4 4Oklahoma IGBBY03 2.36 2.34 2.38 170 13
Enable Gas Transmission, LLC.
East IGBCA03 2.45 2.45 2.46 30 6
Colorado Interstate Gas Co.
Rocky Mountains IGBCK03 2.36 2.33 2.43 313 20
Columbia Gas Transmission Corp.
Appalachia IGBDE03 2.39 2.37 2.45 131 34Appalachia (Non-IPP) IGBJU03 1.18 1.18 1.18 28 4
Columbia Gulf Transmission Co.
Louisiana IGBBG03 2.50 2.49 2.50 25 2Mainline IGBBH03 2.47 2.42 2.48 290 37
dominion Transmission Inc.
Appalachia IGBDC03 1.17 1.15 1.22 363 78
El Paso Natural Gas Co.
Permian Basin IGBAB03 2.42 2.40 2.46 451 65San Juan Basin IGBCH03 2.43 2.41 2.46 103 18
florida Gas Transmission Co.
Zone 1 IGBAW03 2.54 2.54 2.55 15 3Zone 2 IGBBJ03 2.54 2.53 2.56 70 13Zone 3 IGBBK03 2.56 2.55 2.58 139 17
kern River Gas Transmission Co.
Wyoming IGBCL03 2.46 2.44 2.53 282 48
Millennium Pipeline Co
East receipts IGBIW03 1.08 1.04 1.13 81 26
Natural Gas Pipeline Co. of America
Midcontinent zone IGBBZ03 2.46 2.41 2.51 146 21Texok zone IGBAL03 2.50 2.45 2.51 245 25South Texas zone IGBAZ03 2.48 2.47 2.48 45 6
Northern border Pipeline Co.
Ventura Transfer Point IGBGH03 2.65* 2.65 2.65 NA 0
Northern Natural Gas Co.
Demarcation IGBDV03 2.63 2.57 2.68 212 35Ventura, Iowa IGBDU03 2.64 2.62 2.70 43 8
Northwest Pipeline Corp.
Rocky Mountains IGBCP03 2.43 2.37 2.53 445 55Canadian border IGBCT03 2.41 2.38 2.46 101 22
oneok Gas Transportation LLC
Oklahoma IGBCD03 2.38 2.34 2.43 322 31
Panhandle Eastern Pipe Line Co.
Texas, Oklahoma (mainline) IGBCE03 2.38 2.37 2.45 336 30
southern Natural Gas Co.
Louisiana IGBBO03 2.52 2.52 2.56 40 9Southern Star Central Gas Pipeline Inc.Texas, Oklahoma, Kansas IGBCF03 2.41 2.38 2.47 34 15
Tennessee Gas Pipeline Co.
Louisiana, 500 leg IGBBP03 2.50 2.49 2.60 75 18Louisiana, 800 leg IGBBQ03 2.48 2.48 2.49 50 9Texas, zone 0 IGBBA03 2.46 2.46 2.47 139 8Zone 4-Ohio IGBHO03 NA NA NA NA 0Zone 4-200 leg IGBJN03 1.60 1.58 1.66 195 20Zone 4-300 leg IGBFL03 0.96 0.94 1.06 136 39Zone 4-313 pool IGCFL03 1.28 1.27 1.30 25 8
Texas Eastern Transmission Corp.
M-1 30-inch (Kosi) IGBDI03 2.37 2.36 2.38 6 3M-2 receipts IGBJE03 1.18 1.13 1.22 242 50East Louisiana zone IGBBS03 2.42 2.41 2.43 33 7West Louisiana zone IGBBR03 2.46 2.46 2.46 40 4East Texas zone IGBAN03 2.47 2.47 2.47 0.79 1South Texas zone IGBBB03 2.47 2.47 2.47 8 1
Texas Gas Transmission Corp.
Zone 1 IGBAO03 2.47 2.46 2.50 101 8Zone SL IGBBT03 2.51* 2.51 2.51 NA 0
Transcontinental Gas Pipe Line Corp.
Zone 1 IGBBC03 2.49 2.48 2.50 103 22Zone 2 IGBBU03 2.51* 2.51 2.51 NA 0Zone 3 IGBBV03 2.53 2.53 2.54 31 9Zone 4 IGBDJ03 2.53 2.53 2.55 189 29Leidy Line receipts IGBIS03 1.03 1.01 1.15 405 70
Transwestern Pipeline Co.
Permian Basin IGBAE03 2.36 2.35 2.39 82 13San Juan Basin IGBGK03 2.45 2.40 2.48 35 4
Trunkline Gas Co.
Louisiana IGBER03 2.49* 2.49 2.49 NA 0Zone 1A IGBGF03 2.47 2.47 2.50 23 6
expects declines of 14% in consumption and 17% in expenditures compared with last year,” the agency said.
For households that heat with electricity, a colder winter would see a 1% rise in residential electricity demand, with expenditures expected to be flat from last winter, EIA said. “Residential electricity prices would not rise immediately, but the effect of colder temperatures would pass through to retail electricity rates over the succeeding months of 2016.”
The report highlighted that pipeline constraints continue to pose a threat to gas-fired generation, so day-to-day price volatility was still likely for the winter.
But an analyst speaking at a supply and demand forecast event Tuesday said that he believed the market was “tremendously overpricing … New England gas this winter out of fear, auto-correlation and the ‘I don’t know’ factors” inherent to such projections.
Charles Blanchard, lead natural gas analyst at Bloomberg New Energy Finance, referred to spot gas prices at the Algonquin Citygate hub as “a spiky market” that must be thought about in terms of the frequency of price spikes and the level to which prices will spike.
“We determined, given NOAA’s outlook on temperatures this year, how many price spikes should there be, and it’s fewer than last year,” he told attendees at the 2015 Winter Energy Outlook Conference hosted by DOE’s Office of Electricity Delivery and Energy Reliability, EIA and the National Association of State Energy Officials.
Further, he said price spikes would be constrained to the cost of generators’ fuel alternatives, which in New England are LNG and oil. “Both of those are much cheaper than they were last winter,” he said.
According to Blanchard, distillate fuel oil is currently priced at about $11.50/MMBtu delivered to Boston, while residual oil is at about $7.50/MMBtu. Spot LNG prices are closer to $7/MMBtu now as well.
“So whereas last year you might have had the spike to $12, $13, $15 for LNG, this year you don’t have to spike too much above $7 to get hold of incremental gas or incremental negative molecules of gas by oil switching,” Blanchard said.
Fear and the natural auto-correlation phenomenon, where individuals assume this winter will be bad because the last two winters bad, were driving expectations for higher gas prices in New England.
Blanchard added that the pipeline capacity issues that have driven up New England gas prices in the past would probably be solved by the
Index Low high volume deals

7
OctOber 9, 2015INSIDe Ferc’S GAS MArKet rePOrt
copyright © 2015 McGraw Hill Financial
addition of one or two new pipelines “in the pretty near future.”Sieminski noted that gas-fired electricity generation surpassed
generation from coal for July — the second time that has ever happened. But “higher natural gas prices by February are expected to keep the amount of natural gas-fired electric generation below coal-fired generation levels at least through the winter months,” Sieminski said.
EIA lowered its forecast for fourth-quarter Henry Hub natural gas spot prices to $2.83/MMBtu, 12 cents below its estimate in September. The agency expects monthly average spot prices “to remain lower than $3/MMBtu through January, and lower than $3.50/MMBtu” through the end of 2016, the report said.
The report added that Henry Hub natural gas prices are projected to average $2.81/MMBtu in 2015 and $3.05/MMBtu in 2016.
Despite these relatively low gas prices, “increases in drilling efficiency will continue to support growing natural gas production,” EIA said.
The agency raised its natural gas marketed production estimate for Q3 by 350 MMcf/d to 79.37 Bcf/d, while its Q4 estimate was unchanged at 79.61 Bcf/d.
The report added that gas marketed production is expected to grow at an annual rate of 5.6% in 2015 to 79.06 Bcf/d and at 1.9% in 2016 to 80.58 Bcf/d.
Production continues to outpace demand through EIA’s forecasted period.
The agency raised its Q3 demand estimate by 320 MMcf/d to 66.39 Bcf/d, while lowering its Q4 demand estimate by 1 Bcf/d to 77.99 Bcf/d.
EIA said that demand for US gas for the full year is expected to average 76.20 Bcf/d — 320 MMcf/d below last month’s estimate — compared with 73.15 Bcf/d in 2014.
By sector, gas demand for power is projected to rise in 2015, supported by gas prices below $3/MMBtu, but fall off in 2016 as gas prices edge up, EIA said. “Industrial sector consumption remains flat in 2015 and increases by 4.2% in 2016, as new industrial projects, particularly in the fertilizer and chemicals sectors, come online late this year and next year, and as industrial consumers continue to experience low natural gas prices,” the agency said.
Gas demand in the residential and commercial sectors is forecast to decline in both 2015 and 2016, the report said.
— Jasmin Melvin
spark spreads differ by region amid gas and power price drop ANALYSIS Spark spread movements have varied by region following a drop in both gas and power prices as such factors as renewables and weather have impacted margins earned by generators.
Based on gas and power prices at 13 major electricity trading hubs across the US, the simple average October spark spread is down $5.17/MWh from September and $10.51/MWh from August.
Power prices at those hubs this year have averaged about $40/MWh, down 35% from the same period in 2014.
Henry Hub natural gas prices have averaged $2.78/MMBtu year to date, 39% below the same period in 2014. Henry Hub prices recently hit their lowest level since early 2012, $2.26/MMBtu.
Regional trends mixed for gas-fired generatorsGas-fired generators in the Northeast and Midwest have benefited
from firming power prices on account of unseasonably high September demand, while generation margins were pressured in the rest of the country by factors like higher-than-normal wind generation or regionally elevated gas prices.
Temperatures in the Midwest and Northeast were about 3-4 degrees above normal, which sustained cooling demand and drove elevated power demand. Average September peak load registered 5% higher than 2014 in ISO-NE and MISO and 8% higher in NYISO.
Elevated demand in these regions propped up power prices in the face of falling fuel costs, and gas-fired generators saw market clearing spark spreads rise approximately $3-4/MWh.
While ERCOT and SPP also saw higher-than-normal peak load and falling gas prices in September, high levels of wind generation weighed
MARkET CENTER sPoT GAs PRICEs, oCTobER 1 ($/MMbtu) Index Low high volume deals
Northeast
Texas Eastern, zone M-3 IGBEK03 1.28 1.26 1.35 176 42Transco, zone 5 delivered IGBEN03 2.61 2.60 2.64 71 19Transco, zone 6 N.Y. IGBEM03 2.23 2.18 2.26 103 22Transco, zone 6 non-N.Y. IGBEL03 2.27 2.20 2.43 116 33Transco, zone 6 non-N.Y. North IGBJS03 2.24 2.20 2.28 92 27Transco, zone 6 non-N.Y. South IGBJT03 2.38 2.31 2.43 24 6Iroquois, receipts IGBCR03 3.00 2.96 3.06 76 25Iroquois, zone 2 IGBEJ03 3.03 2.98 3.06 16 10Algonquin city-gates IGBEE03 3.50 3.41 3.61 75 21Tennessee, zone 6 delivered IGBEI03 3.36 3.31 3.45 72 25Niagara IGBCS03 1.62 1.61 1.81 5 2Leidy Hub IGBDD03 1.21 1.21 1.21 30 2Lebanon Hub IGBFJ03 2.57 2.52 2.62 25 4Rockies Express, Clarington Ohio IGBGO03 NA NA NA NA 0
upper Midwest
Chicago city-gates IGBDX03 2.70 2.66 2.73 105 24Consumers Energy city-gate IGBDY03 2.89 2.88 2.90 33 9Mich Con city-gate IGBDZ03 2.86 2.84 2.88 186 33Emerson, Viking GL IGBCW03 2.78 2.74 2.79 16 4ANR Pipeline, ML 7 IGBDQ03 2.79 2.76 2.90 7 4Dawn, Ontario IGBCX03 2.94 2.92 3.00 277 73
south Louisiana
Henry Hub IGBBL03 2.56 2.55 2.56 75 9
East Texas
Houston Ship Channel IGBAP03 2.50 2.50 2.53 25 3Katy IGBAQ03 2.53 2.52 2.56 15 3
West Texas
Waha IGBAD03 2.40 2.38 2.44 160 18
Rockies/Northwest
Cheyenne Hub IGBCO03 2.41 2.39 2.43 99 10TCPL Alberta, AECO-C# IGBCU03 2.64 2.56 2.73 769 182Westcoast Energy, station 2# IGBCZ03 1.09 0.97 1.37 138 34
California
PG&E Malin, Ore. IGBDO03 2.52 2.50 2.57 78 22PG&E city-gate IGBEB03 3.07 2.96 3.13 232 44PG&E South IGBDM03 2.60* 2.60 2.60 NA 0Southern California Gas Co. IGBDL03 2.62 2.58 2.68 223 32SoCal Gas city-gate IGBGG03 2.80 2.70 2.85 89 16
National Average
# All prices $/MMBtu except TCPL Alberta, AECO-C and Westcoast Energy, station 2, which is Canadian$/GJ (gigajoule). All volumes in (000) MMBtu/day.

8
OctOber 9, 2015INSIDe Ferc’S GAS MArKet rePOrt
copyright © 2015 McGraw Hill Financial
on power prices, driving spark spreads lower.Average peak load in ERCOT was 5% higher this September
compared to last year, but total wind generation climbed almost 5% from August and accounted for 9.3% of the fuel mix in September, up from 7.7% in August and 6.3% in September 2014.
ERCOT reached a new record wind generation peak on September 13 of 11,467 MW, which was close to 30% of the load.
As a result, spark spreads at ERCOT North Hub fell to $13.05/MWh, less than half of August levels. Ignoring peak demand days in August, which led to scarcity pricing events in ERCOT, September spark spreads were still down almost $9/MWh.
Similarly, gas prices in SPP averaged about $2.66/MMBtu in September, down 12 cents/MMBtu from August and $1.24/MMBtu from 2014. Wind generation, however, accounted for almost 14% of market share in September, up from 9% in August, driving spark spreads at SPP North Hub down almost $4/MWh from August to settle at $16.81/MWh.
PJM and CAISO also saw falling spark spreads in September. However, these declines were the result of regional gas price increases. Gas prices for generators in the PJM Western region also climbed 21% over August to hit $1.42/MMBtu in September. Average gas prices for generators in the CAISO SP15 region climbed 39% from August to an average of $3.51/MMBtu in September.
Year-to-date spark spreads declineOn a national level, power prices have fallen faster than gas prices,
pushing the year-to-date simple average spark spread down 67 cents to $16.11/MWh.
Spark spreads in CAISO, PJM, ISO-NE, and SPP have all slid more than 10% year over year. SPP has seen the biggest decline with year-to-date average spark spreads down over 35% to $19.05/MWh.
Spark spreads in the MISO region have increased 3% to $15.20/MWh so far in 2015.
Despite recent downward trends, ERCOT spark spreads have increased 15%, to an average of $11.67/MWh this year.
Gas-fired generators in NYISO have posted the highest average spark spreads in 2015 at $22.53/MWh, up more than 20% from last year.
— George McGuirk
LNG
LNG export developers counter dire forecasts with demand expectationsA Cheniere Energy executive pushed back against the recent spate of grim analyst assessments of the global LNG market, arguing that upcoming supplies would help open up new demand markets, particularly as the decade turns over, with Europe presenting a promising outlet for North American supplies.
Speaking at the North American Gas Forum in Washington, DC, on October 5, Cheneire Senior Vice President Anatol Feygin said there has been “too much emphasis on the negative,” and an excessive focus on weakness in demand from Asia driven by South Korea.
The biggest factor leading to sluggish global LNG demand has been a lack of incremental supply rather than a lack of demand, he argued, noting there was only one meaningful LNG expansion, Exxon’s Paupau New Guinea project, in the past year.
As more supply comes online, the market will see healthy demand growth play out, he said, and particularly as the decade draws to a close, he said the balance will change.
“We do think that we’ll see a meaningful incremental supply coming to the market toward the end of this decade,” he said.
In the medium term, he said, low oil prices may be felt as legacy contracts and business models, such as 20-year take-or-pay contracts unable to support incremental investments.
But, going forward, legacy markets are not likely to be major contributors, and the type of contracts used are likely to be altered as well, he said, suggesting those 20-year contracts may no longer be the norm.
Europe as a swing factorHe identified Europe as having the potential to be a more dynamic
and price sensitive market for additional volumes.Europe may serve as a swing factor in the Atlantic market, especially,
as legacy contracts run out, and the supply from legacy sources is less economic and those countries are less long in LNG, he said.
“In general, that will aid buyers with portfolio diversity and pricing diversity,” once North American LNG hits the market, he argued. Europe is well-placed, with substantial vaporization capacity and underutilized import capability, to import more as merchant generators become more sophisticated and price signals pass through more efficiently, he said.
European production declines will also add opportunities for North American players, he added.
He acknowledged that in 2015, 20-year take-or-pay contracts were essentially non-existent, in part because buyers didn’t need added volumes — and he said 2015 saw very few projects moving through final investment decisions amid continued low oil prices.
But, with projects in limbo, he suggested there could a substantial risk to supply at the end of this decade into next.
As prices move lower, the world has not yet recalibrated to the new normal, Feygin said. But as buyers start to believe the new dynamic is structural, rather than passing price volatility, the market may see more demand from the industrial and power sector — a shift that may quickly play out with use of new large floating storage and regasification, he said.
A more flexible market is emerging on the buyer and supplier side, he added, suggesting there will no longer be a need for 20-year deals for integrated projects. That shift, he said, has been behind Cheneire’s moved toward incremental brownfield projects and small-scale LNG.
‘Whole pockets of demand’: sempra LNG presidentSimilarly, Octavio Simoes, president of Sempra LNG, questioned
analysts’ bleak projections for the global LNG market, saying that “if you look back, there weren’t that many consultants that ever really forecast many things right when they happened.”
While he noted demand has declined in Europe, citing a variety of
9
OctOber 9, 2015INSIDe Ferc’S GAS MArKet rePOrt
copyright © 2015 McGraw Hill Financial
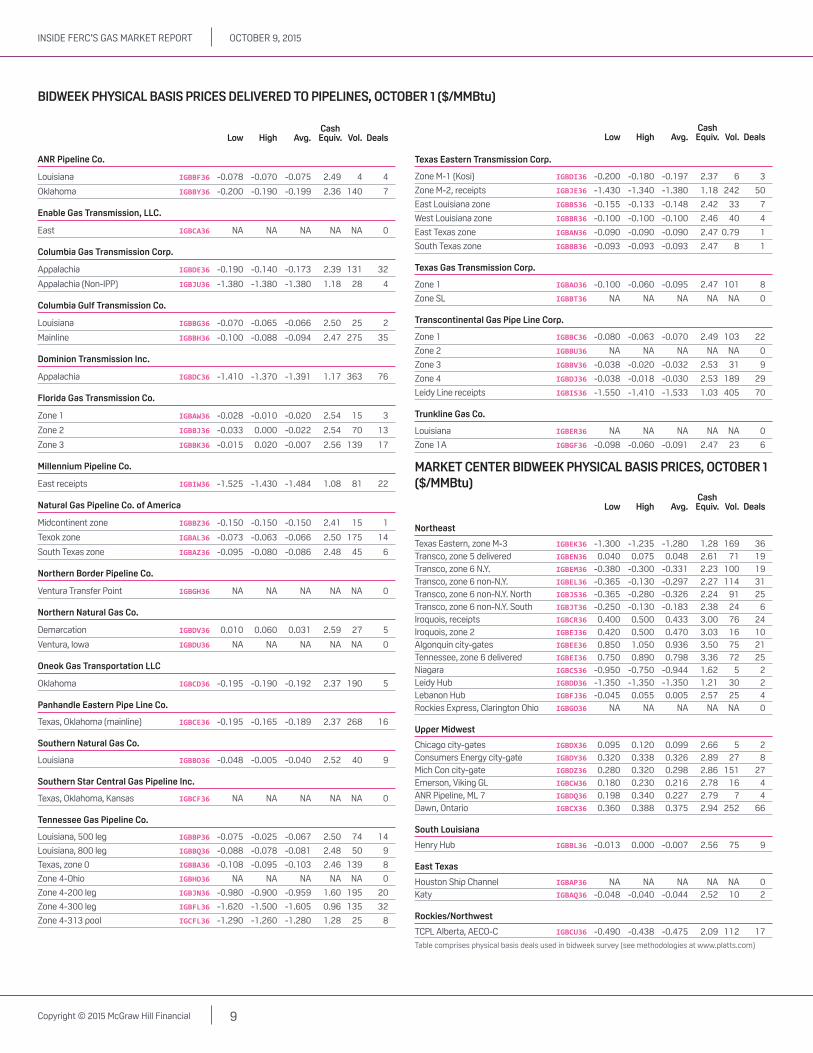
bIdWEEk PhYsICAL bAsIs PRICEs dELIvEREd To PIPELINEs, oCTobER 1 ($/MMbtu)
Cash Low high Avg. Equiv. vol. deals
ANR Pipeline Co.
Louisiana IGBBF36 -0.078 -0.070 -0.075 2.49 4 4
Oklahoma IGBBY36 -0.200 -0.190 -0.199 2.36 140 7
Enable Gas Transmission, LLC.
East IGBCA36 NA NA NA NA NA 0
Columbia Gas Transmission Corp.
Appalachia IGBDE36 -0.190 -0.140 -0.173 2.39 131 32
Appalachia (Non-IPP) IGBJU36 -1.380 -1.380 -1.380 1.18 28 4
Columbia Gulf Transmission Co.
Louisiana IGBBG36 -0.070 -0.065 -0.066 2.50 25 2
Mainline IGBBH36 -0.100 -0.088 -0.094 2.47 275 35
dominion Transmission Inc.
Appalachia IGBDC36 -1.410 -1.370 -1.391 1.17 363 76
florida Gas Transmission Co.
Zone 1 IGBAW36 -0.028 -0.010 -0.020 2.54 15 3
Zone 2 IGBBJ36 -0.033 0.000 -0.022 2.54 70 13
Zone 3 IGBBK36 -0.015 0.020 -0.007 2.56 139 17
Millennium Pipeline Co.
East receipts IGBIW36 -1.525 -1.430 -1.484 1.08 81 22
Natural Gas Pipeline Co. of America
Midcontinent zone IGBBZ36 -0.150 -0.150 -0.150 2.41 15 1
Texok zone IGBAL36 -0.073 -0.063 -0.066 2.50 175 14
South Texas zone IGBAZ36 -0.095 -0.080 -0.086 2.48 45 6
Northern border Pipeline Co.
Ventura Transfer Point IGBGH36 NA NA NA NA NA 0
Northern Natural Gas Co.
Demarcation IGBDV36 0.010 0.060 0.031 2.59 27 5
Ventura, Iowa IGBDU36 NA NA NA NA NA 0
oneok Gas Transportation LLC
Oklahoma IGBCD36 -0.195 -0.190 -0.192 2.37 190 5
Panhandle Eastern Pipe Line Co.
Texas, Oklahoma (mainline) IGBCE36 -0.195 -0.165 -0.189 2.37 268 16
southern Natural Gas Co.
Louisiana IGBBO36 -0.048 -0.005 -0.040 2.52 40 9
southern star Central Gas Pipeline Inc.
Texas, Oklahoma, Kansas IGBCF36 NA NA NA NA NA 0
Tennessee Gas Pipeline Co.
Louisiana, 500 leg IGBBP36 -0.075 -0.025 -0.067 2.50 74 14
Louisiana, 800 leg IGBBQ36 -0.088 -0.078 -0.081 2.48 50 9
Texas, zone 0 IGBBA36 -0.108 -0.095 -0.103 2.46 139 8
Zone 4-Ohio IGBHO36 NA NA NA NA NA 0
Zone 4-200 leg IGBJN36 -0.980 -0.900 -0.959 1.60 195 20
Zone 4-300 leg IGBFL36 -1.620 -1.500 -1.605 0.96 135 32
Zone 4-313 pool IGCFL36 -1.290 -1.260 -1.280 1.28 25 8
Texas Eastern Transmission Corp.
Zone M-1 (Kosi) IGBDI36 -0.200 -0.180 -0.197 2.37 6 3
Zone M-2, receipts IGBJE36 -1.430 -1.340 -1.380 1.18 242 50
East Louisiana zone IGBBS36 -0.155 -0.133 -0.148 2.42 33 7
West Louisiana zone IGBBR36 -0.100 -0.100 -0.100 2.46 40 4
East Texas zone IGBAN36 -0.090 -0.090 -0.090 2.47 0.79 1
South Texas zone IGBBB36 -0.093 -0.093 -0.093 2.47 8 1
Texas Gas Transmission Corp.
Zone 1 IGBAO36 -0.100 -0.060 -0.095 2.47 101 8
Zone SL IGBBT36 NA NA NA NA NA 0
Transcontinental Gas Pipe Line Corp.
Zone 1 IGBBC36 -0.080 -0.063 -0.070 2.49 103 22
Zone 2 IGBBU36 NA NA NA NA NA 0
Zone 3 IGBBV36 -0.038 -0.020 -0.032 2.53 31 9
Zone 4 IGBDJ36 -0.038 -0.018 -0.030 2.53 189 29
Leidy Line receipts IGBIS36 -1.550 -1.410 -1.533 1.03 405 70
Trunkline Gas Co.
Louisiana IGBER36 NA NA NA NA NA 0
Zone 1A IGBGF36 -0.098 -0.060 -0.091 2.47 23 6
MARkET CENTER bIdWEEk PhYsICAL bAsIs PRICEs, oCTobER 1 ($/MMbtu) Cash Low high Avg. Equiv. vol. deals
Northeast
Texas Eastern, zone M-3 IGBEK36 -1.300 -1.235 -1.280 1.28 169 36Transco, zone 5 delivered IGBEN36 0.040 0.075 0.048 2.61 71 19Transco, zone 6 N.Y. IGBEM36 -0.380 -0.300 -0.331 2.23 100 19Transco, zone 6 non-N.Y. IGBEL36 -0.365 -0.130 -0.297 2.27 114 31Transco, zone 6 non-N.Y. North IGBJS36 -0.365 -0.280 -0.326 2.24 91 25Transco, zone 6 non-N.Y. South IGBJT36 -0.250 -0.130 -0.183 2.38 24 6Iroquois, receipts IGBCR36 0.400 0.500 0.433 3.00 76 24Iroquois, zone 2 IGBEJ36 0.420 0.500 0.470 3.03 16 10Algonquin city-gates IGBEE36 0.850 1.050 0.936 3.50 75 21Tennessee, zone 6 delivered IGBEI36 0.750 0.890 0.798 3.36 72 25Niagara IGBCS36 -0.950 -0.750 -0.944 1.62 5 2Leidy Hub IGBDD36 -1.350 -1.350 -1.350 1.21 30 2Lebanon Hub IGBFJ36 -0.045 0.055 0.005 2.57 25 4Rockies Express, Clarington Ohio IGBGO36 NA NA NA NA NA 0
upper Midwest
Chicago city-gates IGBDX36 0.095 0.120 0.099 2.66 5 2Consumers Energy city-gate IGBDY36 0.320 0.338 0.326 2.89 27 8Mich Con city-gate IGBDZ36 0.280 0.320 0.298 2.86 151 27Emerson, Viking GL IGBCW36 0.180 0.230 0.216 2.78 16 4ANR Pipeline, ML 7 IGBDQ36 0.198 0.340 0.227 2.79 7 4Dawn, Ontario IGBCX36 0.360 0.388 0.375 2.94 252 66
south Louisiana
Henry Hub IGBBL36 -0.013 0.000 -0.007 2.56 75 9
East Texas
Houston Ship Channel IGBAP36 NA NA NA NA NA 0Katy IGBAQ36 -0.048 -0.040 -0.044 2.52 10 2
Rockies/Northwest
TCPL Alberta, AECO-C IGBCU36 -0.490 -0.438 -0.475 2.09 112 17
Table comprises physical basis deals used in bidweek survey (see methodologies at www.platts.com)
Cash Low high Avg. Equiv. vol. deals

10
OctOber 9, 2015INSIDe Ferc’S GAS MArKet rePOrt
copyright © 2015 McGraw Hill Financial
dAILY PRICEs of sPoT GAs dELIvEREd To PIPELINEs ($/MMbtu) Midpoint Midpoint Midpoint Midpoint Midpoint Midpoint Midpoint Midpoint Midpoint Midpoint 9/23 9/24 9/25 9/28 9/29 9/30 10/1 10/2 10/5 10/6
ANR Pipeline Co.Louisiana 2.515 2.500 2.455 2.535 2.480 2.405 2.325 2.235 2.255 2.290Oklahoma 2.440 2.425 2.375 2.460 2.380 2.380 2.270 2.110 2.170 2.270
Enable Gas Transmission, LLC.East 2.540 2.495 2.460 2.505 2.435 2.390 2.240 2.115 2.185 2.205
Colorado Interstate Gas Co.Rocky Mountains 2.485 2.470 2.410 2.425 2.415 2.305 2.215 2.050 2.075 2.155
Columbia Gas Transmission Corp.Appalachia 2.435 2.415 2.375 2.465 2.390 2.340 2.250 2.125 2.185 2.215Appalachia non-IPP 1.300 N.A. 1.120 N.A. 1.280 1.250 1.260 N.A. 1.170 N.A.
Columbia Gulf Transmission Co.Louisiana 2.520 2.485 2.460 2.525 2.470 2.405 2.320 2.235 2.275 2.295Mainline 2.505 2.480 2.450 2.540 2.455 2.395 2.310 2.200 2.255 2.280
dominion Transmission Inc.South Point 1.275 1.190 1.035 1.185 1.240 1.220 1.200 0.840 1.140 1.010North Point 1.280 1.180 1.050 1.175 1.245 1.210 1.195 0.825 1.135 1.010
El Paso Natural Gas Co.Permian Basin 2.545 2.530 2.465 2.530 2.465 2.385 2.330 2.135 2.250 2.265San Juan Basin 2.540 2.550 2.460 2.530 2.465 2.385 2.310 2.130 2.240 2.260Bondad 2.530 2.540 2.460 2.530 2.450 2.360 2.310 2.125 2.230 2.255South Mainline 2.720 2.735 2.650 2.705 2.630 2.545 2.490 2.330 2.440 2.405
florida Gas Transmission Co.Zone 1 2.540 2.520 2.500 2.580 2.485 2.440 2.340 2.230 2.270 2.325Zone 2 2.550 2.530 2.505 2.590 2.495 2.445 2.350 2.245 2.295 2.315Zone 3 2.550 2.530 2.500 2.585 2.520 2.480 2.365 2.260 2.300 2.310
kern River Gas Transmission Co.Opal plant 2.550 2.555 2.485 2.540 2.465 2.395 2.330 2.120 2.230 2.265
Millennium Pipeline Co.East receipts 1.220 1.155 1.035 1.135 1.220 1.025 0.970 0.825 0.935 0.960
Natural Gas Pipeline Co. of AmericaMidcontinent zone 2.535 2.515 2.460 2.565 2.480 2.405 2.315 2.165 2.225 2.290Texok zone 2.535 2.510 2.480 2.575 2.495 2.415 2.330 2.200 2.260 2.315South Texas zone 2.525 2.475 2.460 2.585 2.450 2.400 2.325 2.195 2.250 2.330Amarillo reciept 2.585 2.535 2.500 2.580 2.530 2.475 2.360 2.195 2.230 2.310
Northern border Pipeline Co.Ventura Transfer Point 2.650 2.615 2.540 2.630 2.630 2.530 2.410 2.270 2.330 2.385
Northern Natural Gas Co.Demarcation 2.650 2.625 2.545 2.635 2.570 2.520 2.430 2.280 2.310 2.365Ventura, Iowa 2.660 2.620 2.550 2.640 2.595 2.535 2.420 2.275 2.320 2.385
Northwest Pipeline Corp.Wyoming 2.530 2.510 2.455 2.510 2.440 2.355 2.270 2.070 2.150 2.195Canadian border (Sumas) 2.535 2.495 2.455 2.515 2.450 2.680 2.290 2.025 2.135 2.200South of Green River 2.520 2.500 2.440 2.495 2.430 2.325 2.265 2.060 2.180 2.220
oneok Gas Transportation LLCOklahoma 2.410 2.380 2.365 2.460 2.390 2.345 2.265 2.100 2.175 2.190
Panhandle Eastern Pipe Line Co.Texas, Oklahoma (mainline) 2.465 2.455 2.410 2.520 2.480 2.300 2.270 2.090 2.145 2.160
Questar Pipeline Co.Rocky Mountains N.A. 2.490 2.450 2.500 2.400 2.330 2.260 N.A. 2.130 N.A.
southern Natural Gas Co.Louisiana 2.550 2.515 2.480 2.575 2.490 2.435 2.345 2.255 2.295 2.310
southern star Central Gas Pipeline, Inc.Texas, Oklahoma, Kansas 2.455 2.450 2.390 2.465 2.430 2.345 2.265 2.110 2.155 2.175
Tennessee Gas Pipeline Co.Louisiana, 500 leg 2.525 2.480 2.470 2.540 2.465 2.415 2.320 2.260 2.290 2.315Louisiana, 800 leg 2.515 2.475 2.470 2.540 2.470 2.410 2.325 2.250 2.275 2.320Texas, zone 0 2.520 2.470 2.450 2.510 2.460 2.400 2.325 2.200 2.255 2.300Zone 4-Ohio N.A. N.A. N.A. N.A. N.A. N.A. N.A. N.A. N.A. N.A.Zone 4-200 leg 1.725 1.615 1.520 1.430 1.470 1.445 1.460 1.025 1.200 1.1502Zone 4-300 leg 1.075 1.075 0.965 1.065 1.085 0.820 0.700 0.685 0.860 0.850Zone 4-313 pool 1.320 1.280 1.205 1.215 1.320 1.305 1.265 0.990 1.130 1.070
Texas Eastern Transmission Corp.East Louisiana zone 2.500 2.375 2.380 2.495 2.445 2.395 2.295 2.230 2.240 2.295West Louisiana zone 2.515 2.495 2.475 2.535 2.470 2.435 2.345 2.275 2.310 2.340East Texas zone 2.510 2.490 2.465 2.515 2.480 2.420 2.360 2.235 2.200 2.290South Texas zone 2.540 2.485 2.490 2.540 2.490 2.470 2.355 2.290 2.310 2.325M-1 30-inch (Kosi) 2.455 N.A. 2.330 2.480 2.410 2.380 2.280 2.190 2.210 2.280M-1 24-inch N.A. 2.440 2.400 N.A. N.A. N.A. N.A. N.A. N.A. N.A.M-2, receipts 1.265 1.205 1.025 1.200 1.240 1.215 1.215 0.875 1.180 1.055

11
OctOber 9, 2015INSIDe Ferc’S GAS MArKet rePOrt
copyright © 2015 McGraw Hill Financial
Texas Gas Transmission Corp.Zone 1 2.510 2.495 2.465 2.540 2.465 2.410 2.320 2.215 2.265 2.275Zone SL N.A. N.A. N.A. N.A. N.A. N.A. N.A. 2.220 2.250 2.260
Transcontinental Gas Pipe Line Corp.Zone 1 2.520 2.450 2.445 2.530 2.485 2.440 2.325 2.225 2.315 2.295Zone 2 2.520 2.490 2.430 2.550 2.500 N.A. 2.320 2.235 2.280 2.310Zone 3 2.535 2.515 2.480 2.565 2.480 2.445 2.345 2.260 2.300 2.325Zone 4 2.555 2.520 2.485 2.575 2.510 2.455 2.360 2.290 2.300 2.335Leidy Line receipts 1.125 1.170 1.020 1.125 1.105 0.830 0.680 0.755 0.970 0.940
Transwestern Pipeline Co.Permian Basin 2.500 2.510 2.400 2.485 2.450 2.345 2.300 2.105 2.220 2.235San Juan Basin 2.545 2.540 2.465 2.530 2.475 2.375 2.320 2.130 2.250 2.255
Trunkline Gas Co.West Louisiana N.A. N.A. N.A. N.A. N.A. N.A. N.A. N.A. N.A. N.A.East Louisiana 2.540 2.495 2.520 N.A. 2.470 N.A. 2.350 2.280 2.290 N.A.Zone 1A 2.510 2.485 2.455 2.535 2.470 2.410 2.310 2.210 2.275 2.275
MARkET CENTER sPoT GAs PRICEs, ($/MMbtu) Midpoint Midpoint Midpoint Midpoint Midpoint Midpoint Midpoint Midpoint Midpoint Midpoint 9/23 9/24 9/25 9/28 9/29 9/30 10/1 10/2 10/5 10/6
NortheastTexas Eastern, zone M-3 1.380 1.305 1.115 1.305 1.345 1.345 1.310 0.960 1.295 1.100Transco, zone 6 N.Y. 2.305 2.190 1.525 2.050 2.015 2.440 2.130 1.580 2.280 2.395Transco, zone 6 non-N.Y. 2.305 2.225 1.665 2.065 2.015 2.410 2.235 1.705 2.265 2.405Transco, zone 6 non-N.Y. North 2.300 2.175 1.585 2.035 1.990 2.390 2.180 1.675 2.260 2.405Transco, zone 6 non-N.Y. South 2.330 2.280 1.880 2.110 2.085 2.455 2.295 1.810 2.280 2.400Algonquin city-gates 1.975 1.975 1.660 2.025 2.055 1.905 2.045 1.490 2.890 2.870Tennessee, zone 6 delivered 2.005 1.945 1.645 1.940 2.120 2.055 2.025 1.320 2.850 2.800Tennessee, z6 (300 leg) del. N.A. N.A. N.A. N.A. N.A. 1.500 1.500 N.A. N.A. N.A.Niagara N.A. N.A. N.A. N.A. N.A. 1.480 1.500 N.A. N.A. N.A.Leidy Hub N.A. N.A. 1.130 N.A. N.A. 1.240 N.A. N.A. N.A. N.A.Lebanon Hub 2.585 2.570 2.515 2.585 2.530 2.465 2.365 2.225 2.280 2.320Iroquois, receipts 2.905 2.730 2.195 2.900 2.575 2.615 2.580 2.260 2.750 2.730Algonquin, receipts N.A. N.A. N.A. N.A. N.A. N.A. 1.260 N.A. N.A. N.A.Iroquois, zone 2 2.975 2.505 1.845 N.A. 2.510 2.475 2.570 2.025 2.890 2.810Transco, zone 5 delivered 2.600 2.520 2.440 2.645 2.550 2.505 2.405 2.295 2.360 2.400Rockies Express, Clarington Ohio N.A. N.A. N.A. N.A. N.A. N.A. N.A. N.A. N.A. N.A.
southeastFlorida city-gates 2.860 2.860 2.800 N.A. N.A. 2.730 2.660 2.580 N.A. N.A.
upper MidwestChicago city-gates 2.655 2.615 2.590 2.670 2.650 2.570 2.460 2.265 2.350 2.380Consumers Energy city-gate 2.970 2.935 2.910 2.960 2.905 2.825 2.700 2.480 2.530 2.620Mich Con city-gate 2.920 2.875 2.865 2.915 2.860 2.775 2.660 2.450 2.515 2.580ANR Pipeline, ML 7 2.805 2.760 2.640 2.810 2.735 2.630 2.750 2.550 2.420 2.540Dawn, Ontario 3.010 2.985 2.960 3.015 2.950 2.870 2.700 2.380 2.620 2.695Emerson, Viking GL 2.725 2.705 2.650 2.735 2.705 2.630 2.540 2.295 2.550 2.555Alliance, into interstates 2.790 2.760 2.690 2.765 2.785 2.650 2.480 2.300 2.440 2.530Dracut, Mass. N.A. N.A. N.A. N.A. N.A. N.A. N.A. N.A. N.A. N.A.
south LouisianaHenry Hub 2.590 2.565 2.545 2.635 2.530 2.475 2.375 2.265 2.325 2.350
East/south TexasHouston Ship Channel 2.565 2.510 2.520 2.520 2.520 2.530 2.430 2.305 2.340 2.365Katy 2.550 2.515 2.495 2.540 2.520 2.495 2.375 2.290 2.315 2.360Carthage Hub 2.530 2.475 2.465 2.510 2.460 2.385 2.315 2.210 2.185 2.275Agua Dulce 2.640 N.A. N.A. N.A. N.A. N.A. N.A. N.A. N.A. N.A.
West TexasWaha 2.535 2.520 2.465 2.505 2.450 2.380 2.320 2.135 2.235 2.280
Rockies/NorthwestCheyenne Hub 2.500 2.470 2.400 2.475 2.425 2.330 2.235 2.090 2.155 2.230TCPL Alberta, AECO-C* 2.680 2.655 2.655 2.750 2.680 2.645 2.535 2.495 2.475 2.470Stanfield, Ore. 2.565 2.525 2.460 2.500 2.460 2.385 2.260 2.115 2.210 2.225Kern River, delivered 2.715 2.735 2.665 2.740 2.635 2.550 2.480 2.325 2.435 2.440GTN, Kingsgate 2.310 2.320 2.300 2.350 2.270 2.240 2.220 2.100 2.175 2.175Westcoast, station 2 1.025 0.990 0.460 0.400 0.855 0.875 0.800 1.510 1.980 1.490White River Hub 2.515 2.505 2.440 2.490 2.430 2.340 2.270 2.095 2.180 2.220
CaliforniaPG&E Malin, Ore. 2.620 2.605 2.550 2.610 2.530 2.455 2.390 2.195 2.295 2.325PG&E city-gate 3.070 3.055 3.055 3.125 3.060 2.990 2.910 2.820 2.920 2.920PG&E South 2.710 2.725 2.640 2.705 2.625 2.515 2.445 2.305 2.385 2.400Southern California Gas Co. 2.705 2.725 2.635 2.720 2.630 2.530 2.465 2.305 2.425 2.420SoCal Gas city-gate 2.900 2.910 2.825 2.920 2.825 2.750 2.670 2.325 2.635 2.620
* NOTE: Price in C$ per gj.
dAILY PRICEs of sPoT GAs dELIvEREd To PIPELINEs ($/MMbtu) Midpoint Midpoint Midpoint Midpoint Midpoint Midpoint Midpoint Midpoint Midpoint Midpoint 9/23 9/24 9/25 9/28 9/29 9/30 10/1 10/2 10/5 10/6

12
OctOber 9, 2015INSIDe Ferc’S GAS MArKet rePOrt
copyright © 2015 McGraw Hill Financial
factors including loss of industrial competitiveness and policies pushing renewables, he said there are big opportunities for LNG to compete in the long term.
Sempra has looked carefully at declining prices in the short term and nonetheless sees the potential for LNG to compete against long-haul pipe and indigenous production, he said. He pointed to prices in China at the city-gate, as well as those in Algeria and Norway.
“There are whole pockets of demand that have not been accounted for, he said.
He also made a case for US Gulf Coast projects being very competitive, with costs falling below those in Southeast Asia. Another benefit of US liquefaction is that it has broken a paradigm by offering customers volume flexibility, he said.
— Maya Weber
oregon’s Jordan Cove LNG clears environmental hurdle after delaysThe Jordan Cove LNG export project planned for Coos Bay, Oregon, took an important step on September 30 toward securing regulatory approval, when the US Federal Energy Regulatory Commission released the environmental impact statement for the project and an associated pipeline.
The EIS schedule had twice been delayed, most recently because the Department of the Interior’s Bureau of Land Management required more information from Pacific Connector about an alternative pipeline route affecting BLM lands. December 29 is the federal authorization decision deadline for the LNG project and pipeline.
FERC staff in the EIS found the projects would have some limited adverse impacts, but that those could be reduced to “less-than-significant” levels with mitigation measures proposed by the applicants and further steps suggested in the EIS (CP13-483, CP13-492).
Jordan Cove has said the project would use competitively priced gas from Western Canadian and Rocky Mountain sources to export to overseas markets around the Pacific Rim.
It filed an application in May 2013 to build liquefaction and export facilities, including four liquefaction trains, two 160,000-cubic-meter full-containment storage tanks and a new marine slip with two berths. The export terminal, estimated to cost $5.3 billion, would be capable of liquefying the LNG equivalent of 900 MMcf/d of gas.
Pacific Connector Gas Pipeline in June 2013 applied to build a 232-mile pipeline to feed gas to the facility. The 1.06-million Dt/d pipeline would connect with Ruby Pipeline and Gas Transmission Northwest near Malin, Oregon, and run to the proposed export project in Coos County. The $1.74 billion project would also include a 41,000-horsepower compressor station in Klamath County, as well as a number of meter stations.
The projects have faced vehement opposition from the environmental community, which contends the facilities would increase the region’s dependence on natural gas and encourage hydraulic fracturing. Others had focused opposition on the LNG terminal’s location in an area vulnerable to earthquakes and tsunamis, and on the risk of wildfires along the pipeline route.
Addressing some of those concerns, the EIS said the final terminal
design would include seismic specifications and other measures to reduce the impacts from future earthquakes and potential tsunamis. For instance, Jordan Cove would raise the LNG processing area and surround storage tanks with a storm-surge barrier about 60 feet high. The EIS also noted that Pacific Connector would put in place a fire prevention and suppression plan.
bLM to amend land management plansBLM would amend its land management plans for areas including
national forests thorough which the pipeline would traverse. The EIS said BLM could issue a right of way for the pipeline easement over federal lands. That would require concurrence with the Forest Service and Bureau of Reclamation, based on a plan of development that would include further mitigation.
FERC staff also said other agencies will offer further biological opinions and make recommendations to avoid harm to species under their jurisdiction or destruction of critical habitat.
The report sets an additional 102 environmental conditions for the project. It notes that 821 acres of late-successional old growth forest would be impacted by the pipeline, but that the Pacific Connector would compensate with a wildlife habitat mitigation plan.
The report mentions alternatives FERC considered, including the use of existing jurisdictional pipelines. Those were rejected as impractical because either the routes failed to connect the right locations or the systems couldn’t handle sufficient volumes of gas. It said other LNG facilities on the Gulf Coast or East Coast were not reasonable alternatives because they would have longer, less direct routes to Asia, and draw gas from different parts of the country.
The EIS acknowledged that the LNG project could be a significant source of greenhouse gas emissions but found it could also reduce emissions by displacing coal use in Asia. The displacement “depends on a multitude of complex geological and economic factors that cannot reasonably be foreseen,” the EIS said.
In Washington, the EIS was welcomed by Senator John Barrasso, Republican-Wyoming, who had written FERC several times to express support for the project. He called on DOE to quickly give approval, saying the administration needs to give West Coast communities opportunities to access overseas markets that their Gulf Coast and East Coast counterparts have enjoyed.
— Maya Weber
untapped sable basin gas supportive of Nova scotia LNG projects: officialUntapped resources of some 1 Tcf of natural gas in the Sable Basin in Atlantic Canada could emerge as a potential supplier for planned LNG projects in Nova Scotia, Murray Coolican, the province’s deputy energy minister, said September 30.
“That basin is home to Encana’s Deep Panuke and ExxonMobil’s Sable gas projects that are now headed towards a natural decline,” Coolican said at the annual Maritimes Energy Association conference in Halifax. “But there are still [significant discovery licenses] there that Exxon will not develop given the current gas prices. Those could be tapped by other developers.”

13
OctOber 9, 2015INSIDe Ferc’S GAS MArKet rePOrt
copyright © 2015 McGraw Hill Financial
Significant discovery licenses, or SDLs, are defined by the first well drilled on a geological formation that shows by flow testing the existence of hydrocarbons and the potential for sustained production, he said.
Four LNG projects have been proposed for Nova Scotia, which could potentially require a sustained feedstock demand of at least 6 Bcf/d to 8 Bcf/d, Coolican said. They include the 15 million mt/year facility of AC LNG, 10 million mt/year for Goldroro LNG, 4 million mt/year for Bear Head LNG and 250,000 mt/year for Nova Scotia LNG.
“Sourcing feedstock at a cost-competitive price will be a significant element for these projects taking a final investment decision over the next two years and one way out would be to rely on a basket of sources,” Coolican later said in an interview, without giving any figure on the gas price.
Developers of LNG facilities in Nova Scotia will be better off relying on three prime sources for securing gas feedstock, he said, identifying them to be offshore Nova Scotia, the US Northeast (Marcellus and Utica shales) and the Western Canadian Sedimentary Basin in Alberta.
Besides the SDLs in the Sable basin, tapping into associated gas to be produced by BP and Shell could also be a target for developers, Coolican said.
Shell will drill its first exploratory well in its licensed blocks in the neighboring Shelburne Basin in offshore Nova Scotia this fall, while BP plans to drill two years later.
Nova Scotia is estimated to contain 30-50 Tcf of onshore shale gas, but a moratorium is in place on hydraulic fracking that will get in the way of exploiting those resources, he said.
Province faces challenges: CoolicanWhile availability of cheap feedstock poses a challenge for
proposed LNG projects along the Canadian East Coast compared with those in British Columbia in the West, Coolican is hopeful of developers taking a final investment decision from late 2016 onwards.
The shorter travel time for LNG vessels from Nova Scotia to Europe and India, compared with British Columbia, will lower transportation costs for Eastern Canadian developers, he said.
A reduction of 50 cents/MMBtu in transportation cost could result in total savings of some $6 billion for an LNG buyer under a 20-year contract, Racim Gribaa, LNG leader and managing director for corporate finance advisory at Deloitte, said separately from Calgary.
— Ashok Dutta
PIPELINEs
Mountain valley to send gas to Transco, targets end-users in W.va., va. marketsThe proposed Mountain Valley Pipeline is not only planning to send more gas to Transcontinental Gas Pipe Line for markets in the South Atlantic, it also intends to supply utilities and end-users along its bending route through the Virginias.
The pipeline, a joint venture among EQT Midstream Partners and affiliates of NextEra Energy, WGL Holdings and Vega Energy Partners,
has ironed out a deal with Roanoke Gas Company. RGC will become a shipper on the pipeline to supply and expand its southwest Virginia customer base, the companies announced October 1.
Mountain Valley Pipeline, LLC, expects to file a certificate application with the Federal Energy Regulatory Commission by the end of October for the 300-mile, 42-inch diameter pipeline, which has an estimated project cost of $3 billion to $3.5 billion.
If approved, construction is slated to begin late next year with a full in-service date targeted for the fourth quarter of 2018. The line will begin in Wetzel County, West Virginia, where it will connect with a processing plant and an existing Equitrans line. It will terminate in Pittsylvania County, Virginia, at a Transcontinental Gas Pipeline interconnect at Transco Station 165 in the Zone 5 Pool.
Similar to other new pipeline projects in the region, the pipeline is contracting with end-users and utilities rather than primarily production companies. When fully constructed, the Mountain Valley Pipeline project will provide access to the growing demand for natural gas in the Appalachian, Mid-Atlantic and South Atlantic markets for use by local distribution companies, industrial users and power generation facilities.
“RGC Midstream’s agreement with Mountain Valley Pipeline addresses the growing demand for natural gas in our region and enhances the reliability of our Roanoke Gas system,” John D’Orazio, president and CEO of RGC Resources, said in a statement.
“Strengthening our natural gas supply and bringing access to unserved communities is essential for continued progress in southwest Virginia. It will increase the opportunity for economic growth in our region through a combination of industrial expansions, job creation and new investments,” he said.
The proposed line is also designed to address infrastructure constraints associated with the rapid development of natural gas from the Marcellus and Utica shale plays. Production in the area has exceeded the current takeaway capacity on Equitrans. Production from the Utica and Marcellus shales averaged 3.1 Bcf/d in 2010, but rocketed to about 19.6 Bcf/d this year to date. Platts’ unit Bentek Energy expects production to reach more than 30 Bcf/d by 2020, bolstered by pipeline expansions, new natural gas-fired power plants and LNG exports.
The proposed PennEast and Atlantic Coast pipelines also both have almost 100% of capacity already allocated to utilities. This is a shift from recent history where 20 major pipelines slated to go in-service this year or next have 70% of planned capacity additions held by producers rather than utilities and end-users.
Mountain Valley Pipeline is but one on a growing list of proposed projects that, if completed, would have the potential to provide up to 7.5 Bcf/d of gas to the Mid Atlantic and South Atlantic regions by 2018. They all have similar expected in-service dates. The list includes:�� n Transco Western Marcellus (2 Bcf/d; projected in-service date of late 2018)�� DTI Atlantic Coast (1.5 Bcf/d; late 2018)�� Penn East (1 Bcf/d; late 2017)�� Transco Diamond (0.5-1.0 Bcf/d; mid 2018)�� Mountain Valley (2 Bcf/d; late 2018)Many of these projects are also expected to send gas south on
Transco to markets in the Southeast and Gulf Coast and for potential
14
OctOber 9, 2015INSIDe Ferc’S GAS MArKet rePOrt
copyright © 2015 McGraw Hill Financial
LNG exports.Transco’s Western Marcellus pipeline project will “for the first time
offer Western Marcellus and Utica producers serviced by Williams’ Ohio Valley Midstream direct access to the broad range of Transco markets in the Mid-Atlantic and southeastern states, as far south as Florida,” said Rory Miller, senior vice president of Williams’ Atlantic-Gulf Operating Area.
“In addition, this groundbreaking project would provide enhanced supply access for burgeoning Louisiana and Texas Gulf Coast markets accessible through our Station 65 pool.”
— Brandon Evans
Algonquin maintenance to continue into November, disrupting boston supplyAlgonquin Gas Transmission will be conducting maintenance in October and November that will restrict substantial portions of gas to the New England market. This proposed work already has led to price increases in the forward basis market for Algonquin city-gates.
In a revised planned-maintenance schedule on October 2, Algonquin delayed a maintenance project one week, change in the schedule from October 20-November 2 to October 27-November 9. This delay led to basis increases in Algonquin city-gates November contract to levels about 10-15 cents higher than they were at the same time last year.
Algonquin is one of only three major pipelines serving the Boston area — the others being Tennessee Gas Pipeline and Maritimes & Northeast. Production declines offshore eastern Canada and weak LNG imports into the Canaport terminal in New Brunswick have negatively impacted gas supply on the Maritimes pipeline. Consequently, Algonquin and Tennessee run at relatively high utilization rates. Any mainline maintenance on these pipelines is likely to impact throughput and gas prices.
The currently planned maintenance on Algonquin will take place at the Stony Point compressor station in Middlesex County, Connecticut, which has a listed capacity of 1.5 Bcf/d. During the maintenance, the capacity through the station will be reduced to only about 0.5 Bcf/d from October 27 through November 2, a 67% reduction.
Nominations through Stony Point have averaged 1.1 Bcf/d over the past 30 days, suggesting that the New England market will be about 0.6 Bcf/d short gas during the maintenance.
Capacity at Stony Point also will be reduced to 960 MMcf/d from October 21 through 23. Additionally, capacity at the Burrillville compressor station in Providence County, Rhode Island has been reduced because oif maintenance that began September 29. Capacity Burrillville has been reduced from 812 MMcf/d to 600 MMcf/d, and the work is expected to continue through October 11.
Supply alternatives during the upcoming Stony Point maintenance could include reliance on Canadian imports via Iroquois Gas Transmission, which would be a significant change from historical flow patterns. Since the Millennium Pipeline entered service, Algonquin has delivered gas to Iroquois at Brookfield, in Fairfield County, Connecticut.
The Iroquois Brookfield interconnect is downstream of Stony Point, so Algonquin could revert back to receiving gas from Iroquois to help
mitigate supply issues in the New England market.Some additional supply also may come from Tennessee Gas at
Mendon, in Worcester County, Massachusetts. However, the Tennessee 200-Line is typically highly utilized. Spare capacity on the line has averaged about 130 MMcf/d over the past month.
Algonquin November basis has experienced some upward pressure since the revised schedule was released last Friday. The November contract had been traded lower over the last month but has rebounded and could face additional upward pressure if colder weather starts to arrive.
— John Hilfiker
EXPLoRATIoN ANd PRoduCTIoN
E&Ps use varied strategies to tackle industry downturn: IPAA conferenceExploration-and-production companies, buffeted by low oil and gas commodity prices brought on by the robust production from shale plays, are using a variety of strategies to survive the current industry downturn, according to speakers at an oil and gas conference in San Francisco Monday.
Representatives of upstream companies, presenting at the Independent Petroleum Association of America Oil and Gas Investment Symposium, said their firms are depending on a combination of belt-tightening efforts, hedging strategies and technology to deal with the economic doldrums.
J. Russell Porter, president and CEO of Gastar Exploration, said his company is well positioned to continue to thrive because its operations are diversified between two significant core assets, in the Marcellus/Utica natural gas-centric play of Appalachia and the oilier play in the Midcontinent.
Gastar’s acreage position in the Appalachian Basin is about 60,000 net acres, in West Virginia and to a lesser extent Pennsylvania.
Although the bulk of the acreage is in the liquids-rich portion of the basin, about 11,000 net acres is prospective for production from the Marcellus Shale, a dry natural gas play, Porter said.
He said that given current supply and demand trends, he doesn’t expect a rapid turnaround in prices for gas being produced in the Appalachian Basin. “There’s so much gas it’s probably going to keep a lid on gas prices,” he commented.
However, he added that although Henry Hub prices might not be headed upward over the near term, he foresees the basis differential between those prices and the prices fetched by gas producers in the Appalachian Basin as being likely to improve from the producer’s point of view.
Producers in recent years have sought to focus their attention on liquids-rich gas plays rather than on dry gas targets. In more recent months, because the dramatic ramp-up of production has resulted in a glut of natural gas liquids that has served to drive down prices for NGLs, “dry gas economics are actually better than wet gas economics,” Porter said.
15
OctOber 9, 2015INSIDe Ferc’S GAS MArKet rePOrt
copyright © 2015 McGraw Hill Financial
‘We’re big believers in hedging’: Porter“We’re big believers in hedging,” he said, commenting that the
company uses hedging strategies to protect against the downside risk of depressed oil and gas prices. He also noted that he sees “more upside than downside on gas prices.”
In addition to its Appalachian acres, Gastar holds a significant asset position in the Midcontinent, which is prospective for both crude oil and gas production, he said. “We’re in a very good position in the Midcontinent, where most of the capital goes to drilling.
As of June 30, 2014, the company’s consolidated position in the Midcontinent region consisted of about 126,000 net acres, including 84,200 net acres in the Midcontinent Stack Play, which contains more than 500 net Hunton Limestone future locations and a similar number of Woodford Shale and Meramec Shale locations. Gastar operates about 70% of its Midcontinent net acreage.
Porter predicted that the company would see continued growth in its Midcontinent gas production, particularly in the Woodford play, which he said is “gassier than Meramec.”
He added that Gastar, like its competitors in the upstream space, also strives to keep its cost structure down in the current low commodity price environment.
Houston-based Glori Energy uses its Activated Environment for Recovery of Oil (AERO) System in waterflooded oil fields to activate and sustain indigenous reservoir microbial life, which loosens and frees trapped oil.
“Two thirds of all oil that has ever been discovered remains trapped in the rock,” said Victor Perez, Glori’s chief financial officer. He commented that by employing the AERO technology operators can increase the recovery of crude from mature oilfields by releasing between 9% and 12% of the field’s original crude oil resource for production.
Glori Energy makes its money both through the licensing of the technology to third-party producers and by buying mature oilfields from owners that no longer consider them to be core assets, and deriving value from them by lengthening their producing life, he said.
— Jim Magill
us Interior official pushes Arctic rules despite shell’s abandoning explorationShell’s decision to abandon its exploration efforts in US Arctic waters took regulators by surprise and came despite noticeable strides the company made to improve safety drilling offshore Alaska, the top US offshore safety regulator said.
In a wide-ranging interview, Brian Salerno, director of the US Department of Interior’s Bureau of Safety and Environmental Enforcement, said federal regulators would push forward with Arctic drilling regulations despite Shell’s decision to abandon the region.
In addition, Salerno said he was concerned about the impact that low oil and gas prices may be having on offshore drilling safety, adding that his agency may soon overhaul how it oversees offshore operators and said there was a risk that producers were growing less concerned with safety as the years since the Deepwater Horizon pass.
“Is [offshore drilling] as safe as it should be? I don’t know that I
would ever be satisfied,” Salerno said. “As long as we still have fatalities out there, we still have oil spills, we still have losses of well control, ... we still have work to do.”
The September 29 interview came a day after Shell announced that after seven years and $7 billion it was abandoning its exploration efforts in the Chukchi Sea offshore Alaska following disappointing results of an exploratory well it had drilled in the Burger J prospect.
Salerno said the decision was a surprise mainly due to the measures Shell had put in place to improve safety and avoid a repeat of a series of missteps that plagued Shell’s 2012 Arctic operations.
“I think it is fair to say that Shell felt the pressure, not only from whatever might come from a political environment, but also from a public perspective given the 2012 experience,” Salerno said. “They knew that going into it ... and they took the steps to improve their capabilities.”
These steps included greater oversight of contractors, improved infrastructure both offshore and in Shell’s command center in Anchorage, and extensive monitoring improvements to which federal regulators were given access.
shell’s safety performance in Arctic ‘very positive’Salerno said that despite “a few hiccups,” such as damage to the
hull of an icebreaking vessel, which delayed the company’s ability to drill into oil-bearing zones, Shell’s safety performance during this Arctic drilling season was “very positive.”
Still, when announcing its decision to leave the Arctic on September 28, Shell cited the “challenging and unpredictable federal regulatory environment in offshore Alaska” as one of the key reasons behind its departure.
Salerno said Shell was likely referring to future regulations because — other than a new marine mammals protection requirement — the company was facing the same federal regulations that it needed to comply with during the 2012 season.
In February, Interior unveiled new Arctic-specific drilling regulations, which include new response plans for oil spills and stricter requirements for access to source control and containment equipment, among other provisions.
But despite the fact that analysts believe that Shell’s departure will likely keep other producers out of the US Arctic for decades, Salerno said regulators will press forward with finalizing the Arctic drilling regulations before President Obama leaves the White House in 2017.
“It still matters, it’s not pushed [to] the back burner, we’re committed to going forward and finalizing the rule,” he said.
Salerno said regulators felt they needed to provide “clarity” to the industry and public on Arctic drilling rules “should another operator decide to operate their rights under the leases they hold.”
Low prices could impact safety effortsSalerno said he was concerned about the impact of persistently
low oil and gas prices on offshore safety. If prices stay low, companies may spend less on training personnel, maintenance may be delayed and other cost-cutting measures may be taken, he said.
The longer the ongoing industry downturn extends, “there’s always

16
OctOber 9, 2015INSIDe Ferc’S GAS MArKet rePOrt
copyright © 2015 McGraw Hill Financial
the worry that safety starts to slip,” and accidents increase, he said.In addition, he said companies with more capital are likely the ones
with more to spend on sophisticated safety systems. He said while BSEE has recently seen a dip in fatalities in offshore operations, there has been an uptick in injuries, and well control losses and lifting accidents have remained steady.
“As you look across the board, not everybody is blessed with deep pockets, so it becomes a concern for us and something we have to pay close attention to,” he said.
At the same time, Salerno said the fervent commitment to offshore safety the industry showed following the Deepwater Horizon oil spill in the Gulf of Mexico in 2010 seems to be fading.
“The further [Deepwater Horizon] recedes into the past, that sense of urgency starts to degrade as well,” he said. “There’s a sense that, hey, we’ve solved the problem, we put some new standards in place and everything is OK now. Well, it ignores the human component.”
Salerno said that federal regulators are considering a new way for how they oversee offshore operators, which may give more leniency to operators who have fully adopted BSEE’s Safety and Environmental Management Systems, or SEMS, rule.
“That may result in a somewhat different type inspection approach with that company than with a company that hasn’t made a similar commitment,” he said. “We’re still working the variables on how we would do that; obviously past performance comes into play, as well as complexity of an operation, but commitment to those SEMS principles is a key factor.”
— Brian Scheid
Wyoming court ruling delays fracking rule implementation on federal landA ruling handed down by a federal judge in Wyoming on September 30 will again delay the implementation of proposed Bureau of Land Management rules to regulate fracking on federal and Indian land.
US District Judge Scott Skavdahl granted a preliminary injunction sought by the petitioners in a case seeking to halt the implementation of the rules, which BLM proposed in March.
The judge’s decision prohibits BLM from implementing the rules while the suit filed by the Independent Petroleum Association of America and the Western Energy Alliance is pending.
In an interview Wednesday, Mark Barron, an attorney for the petitioners, said the judge agreed with petitioners’ arguments that BLM had overstepped its authority in trying to implement the fracking rule.
“The court really reached two different conclusions: one is an argument that is advanced by the states and the Ute Indian tribe that Congress hasn’t authorized BLM to regulate hydraulic fracturing in the first place,” he said.
Skavdahl found that this argument was likely to succeed on its merits.
In addition Skavdahl’s ruling stated that “even if the agency did not lack jurisdiction, the evidence in the record was insufficient to justify the changes that the rule would establish,” Barron said.
In March, IPAA and WEA filed a petition asking the federal court to
review the proposed rules. The suit was later joined by four Western states — Wyoming, North Dakota, Colorado and Utah — and the Ute Indian Tribe, who argued that the implementation of the final fracking rule was likely to cause undue burdens to oil and gas companies operating on federal and Indian lands.
Rules were to go into effect in JuneThe case has already delayed the implementation of the proposed
rules, which had been scheduled to go into effect on June 24. On June 23, Skavdahl postponed the final rule’s effective date at least until after the Department of Justice filed the administrative record in the lawsuit.
Barron said it is impossible to predict how long it would take for the petition case to be concluded. “It’s in the court’s hands. Four to five months is not unrealistic, but neither is a year,” he said.
WEA members were “overjoyed that we are finally getting relief from the courts regarding the regulatory overreach of the Obama administration,” Kathleen Sgamma, WEA’s vice president of government and public affairs, said in a September 30 statement.
Said IPAA President Barry Russell: “Today’s decision is consistent with IPAA’s position that BLM’s efforts are not needed and that states are — and have for 60 years been — in the best position to safely regulate hydraulic fracturing.”
BLM spokesman Jeff Krauss said the agency is consulting with the Office of the Solicitor and the Department of Justice about the decision. “While the matter is being resolved, the BLM will follow the court’s order and will continue to process applications for permit to drill and inspect well sites under its pre-existing regulations,” he said.
— Jim Magill
M&A
southern positions itself for the future with gas giant AGL acquisition: CEoOnce seen as a conservative coal generator resistant to change, Southern Company has emerged as a “swashbuckling, risk taking organization making billion-dollar bets on a low carbon economy,” the head of a Washington think tank said.
Jason Grumet, founder and president of the Bipartisan Policy Center, moderated a discussion with Southern Company CEO Tom Fanning on October 1 on energy innovation.
Noting the stark change in public perception of the company, Grumet quipped that he was convinced that Southern was “a dinosaur from the future here to anchor innovation in a culture of customer service, economic growth and shareholder value.”
Taking a line from hockey great Wayne Gretzky, Fanning said Southern was simply trying to “skate to where the puck will be,” and that philosophy was part of the impetus behind the planned acquisition of AGL Resources.
Southern in August unveiled a $12 billion plan to acquire AGL. If approved by AGL shareholders and regulators in Georgia, Illinois, New Jersey, Maryland and Virginia, the combined entity would become the

17
OctOber 9, 2015INSIDe Ferc’S GAS MArKet rePOrt
copyright © 2015 McGraw Hill Financial
leading purchaser of natural gas in the US.Fanning said the deal, which grew out of a February dinner
conversation between himself and AGL CEO John Somerhalder, would make it easier for the combined entity to help develop natural gas infrastructure, especially pipelines to deliver gas from booming unconventional fields to Southern and AGL utilities.
Southern owns Alabama Power, Georgia Power, Mississippi Power and Gulf Power, which together serve about 4.5 million electric customers. AGL, in turn, owns several gas-only local distribution companies, including Atlanta Gas Light in Georgia, Nicor Gas in northern Illinois, Virginia Natural Gas in eastern Virginia, and Elizabethtown Gas in New Jersey. Taken together, the utilities serve about 4.5 million customers.
“Thinking about gas infrastructure as an important part of Southern Company’s infrastructure was just compelling to me,” Fanning said.
He added that while Southern will see its share of gas generation likely top 50% by 2020, the company remains “thin” in terms of institutional knowledge and background in the gas sector. The AGL deal brings not only new assets, but AGL’s culture, capability, skill and expertise to Southern, Fanning said.
But Southern isn’t putting all its eggs in one basket, taking the Obama administration’s all-of-the-above energy policy to heart.
Southern boasts on its website that it is “building the first new nuclear units in a generation in Georgia; using proprietary cutting-edge coal gasification technology to build a facility in Mississippi that generates electricity from coal with a carbon footprint better than that of a natural gas-fired plant; partnering with Turner Renewable Energy on solar projects in California, New Mexico, Nevada and North Carolina; and has built one of the world’s largest wood-fired biomass generating facilities in Texas.”
“What you need is the right portfolio. It’s not an argument of either-or,” Fanning said.
He cautioned against too heavy a push for renewables and energy efficiency, which he joked would lead to a future full of low-lit romantic dinners because there would not be enough energy from relying solely on those sources. “What you need is a portfolio of generation that will be able to — in a clean, safe, reliable and affordable way — deliver the most growing part of our energy complex, and that is electricity,” he said.
Southern’s generation mix includes about 32% coal and around 48% gas, Fanning said. Nuclear and a small amount of hydro round out the portfolio.
In addition to a diverse generation mix, Fanning said Southern also valued a diverse workforce, which enables it to pull rom a greater vision and skills set when dealing with unforeseen issues, and revolutionaries who “throw sand in the gears and ask the troubling questions” to ensure that a company continues to excel even after experiencing success.
Nation’s increasing reliance on gas ‘irrefutable’While a mixed bag of energy sources was necessary, Fanning
acknowledged that it was “irrefutable” that the US should increasingly look to natural gas to meet its power needs.
But in doing so, five things would need to happen to ensure the best energy policy for an increased reliance on gas-fired generation, Fanning said.
“We need to come to grips with all the environmental issues around fracking [and] we need to build out infrastructure … to move the gas from where it is to where it needs to be,” he said.
Third, the country must get a handle on the long-term implications of demand curve shifts, such as what happens to price and volatility, as gas is expected to play a bigger role in not just power generation, but transportation, retail consumption and other sectors as well, he said.
He continued, “We also need to manage that volatility” with more developed products for hedging as the current options “in the financial sector aren’t what they need to be.”
Lastly, he said the country should be supportive of unlimited exports of oil and natural gas.
“My view is we set a lot of policy in the past based on notions of scarcity, and through technology revolutions we now find America in the position of abundance,” Fanning said. “We know that fossil fuels are probably a bridge in the nation’s current and future energy portfolio. Let’s take advantage of the bridge and the international appetite for those fuels and allow companies to sell those products where the markets are the best.”
He acknowledged that such a stance might cause “short-term perturbations,” but said that the “long-term benefits outweigh the short-term costs.”
Further, he said that it is time for industry and policymakers to start making the same tough economic decisions that lower income families served by Southern have been making every day. He noted that 46% of Southern’s customers earn less than $40,000 a year.
“The most appropriate lens to balance the right outcomes for energy policy really must take into account the issues of clean, safe, reliable and affordable delivery of” electricity to customers, he said.
This is where some environmental regulations, including the Environmental Protection Agency’s Clean Power Plan to cut greenhouse gas emissions from existing power plants, have fallen short, Fanning said.
“In setting policy focused on clean, we ignore or give short shrift to safe, reliable and affordable,” Fanning said. “What we need to do is work with Congress and the administration to create good policy with people who are accountable to the electorate to put the right stuff in place to create the best outcomes.”
— Jasmin Melvin
NextEra Energy completes acquisition of NET, owner of seven Texas pipelinesEnergy companies continue to gobble up midstream assets in Texas.
NextEra Energy Partners is the latest after its October 5 announcement that it finalized the acquisition of NET Midstream for approximately $2.1 billion. NET Midstream is the owner and operator of seven natural gas lines in Texas. The purchase allows NextEra Energy Partners the chance to take advantage of a growing gas export market to Mexico as well as supply utilities and households in south Texas.
18
OctOber 9, 2015INSIDe Ferc’S GAS MArKet rePOrt
copyright © 2015 McGraw Hill Financial
NextEra Energy Partners is a yieldco formed by NextEra Energy Resources to acquire and manage clean energy projects, mainly solar and wind. But the finalization of the acquisition of NET Midstream drastically alters the company’s portfolio. A yieldco, similar to an MLP, is a company that typically distributes earnings from owned and operated assets as dividends to investors.
“The NET Midstream acquisition establishes NextEra Energy Partners’ presence in the long-term contracted natural gas pipeline space and complements the partnership’s existing renewables portfolio by reducing the impact of resource variability on our total portfolio,” said Jim Robo, chairman and CEO of NextEra Energy. “We continue to view NextEra Energy Partners as the premier yieldco in the space.”
The NET Mexico Pipeline, the largest pipeline in the portfolio, provides transportation to export Eagle Ford Shale gas to Mexico under a 20-year ship-or-pay contract with Pemex Gas, a division of Mexico’s state-owned oil and gas company.
“Natural gas demand in Mexico has been growing substantially,” said Moray Dewhurst, NextEra Energy Resources CEO, in a recent call with. “At the same, time Mexico-based natural gas supply gas.”
Texas exports to Mexico are expected to more than double over the next five years, according to Bentek’s CellCAST. In June 2014, Texas gas exports to Mexico averaged 1.7 Bcf/d. By June 2015 it grew to 2.2 Bcf/d. Projections show the growth to continue at a rate of more than 0.5 Bcf/d per year until finally capping 5 Bcf/d in May 2020.
In addition to the line under contract to Pemex, the partnership is buying the Eagle Ford Pipeline that connects to both US and Mexican markets and the Monument Pipeline, which delivers fuel to Houston from a gas trading hub in Katy, Texas. The deal also includes four smaller lines that supply power plants and households in the region.
Currently, the seven lines are only utilizing 3 Bcf/d of the total capacity of 4 Bcf/d. With only 75% of capacity being utilized, there is an avenue for growth. Also, ongoing expansion projects to three of those pipelines (NET Mexico, Eagle Ford and Monument) could further expand total capacity to 5 Bcf/d.
This is the latest of several midstream asset sales in Texas in the last few months. In July, Enterprise Products Partners finalized a $2.15 billion purchase of EFS Midstream, a large-scale system of gas gathering, treating, compression and condensate processing facilities spread across the Eagle Ford Shale.
Last month, Matador Resources agreed to sell $143 million of Texas midstream assets in the Permian to EnLink, a spinoff of Devon Energy’s midstream assets. Last week, Sanchez Energy announced plans to sell off $345 million worth of pipelines, along with gathering and compression assets, located in the Eagle Ford Shale to an MLP.
And on Monday, SandRidge Energy announced its intent to acquire the Pinon Gathering Company, which owns and operates approximately 370 miles of gas gathering infrastructure in West Texas for $48 million in cash and $78 million of 8.75% senior secured notes due in 2020.
NextEra Energy Resources also own Florida Power and Light. The company is also involved in the proposed Sooner Trails Pipeline, a 250-mile line that could transport up to 1.16 Bcf/d of gas from Oklahoma’s Anadarko Basin to a hub in North Texas.
— Brandon Evans
Industry downturn could accelerate E&P mergers, acquisitions: analystAlthough the current low price trend for energy commodities has created rough conditions for many exploration-and-production companies, it has also opened up opportunities for some more well-positioned producers to expand their base of core assets at an attractive cost, according to a recent Nomura study.
The report, “Pressure’s On, M&A Should Accelerate: Big Winners, Big Losers,” examines the outlook for mergers and acquisitions among independent and consolidated North American E&P companies.
“What you’re seeing is: historically seller and buyers were far apart with respect to expectations and increasingly what we’ve seen in the more recent deals is that sellers and buyers are more in line with where the forward curve is,” Nomura analyst and study author Lloyd Byrnes said in a September 30 interview.
Byrnes pointed to the recent decision by Encana to sell its Haynesville Shale assets to a Geosouthern affiliate as an example of a deal in which the buyer and seller were able to execute a transaction at terms that both players considered to be favorable to their interests.
In a deal announced in August, Encana agreed to sell its gas assets in the Haynesville Shale to Geosouthern affiliate GEP Haynesville for about $850 million, thus exiting a play that Encana no longer considered as core to its growth strategy.
The transaction made sense in light of the valuation of the assets along the forward curve, Byrnes said. “We’re seeing the buyer and seller come together much more reasonably,” he commented.
He said several well-capitalized E&P companies — such as Concho Resources, EOG, Anadarko Petroleum, Devon Energy and Cimarex Energy — are well positioned to take advantage of the buyers’ market for assets to increase their core asset holdings by buying properties being put up for sale by their less financially well-off competitors.
These “companies have made the right decisions historically, hold core acreage and, generally, have the equity market’s support,” according to the report.
Another group of firms, including major integrated oil and gas companies such as ExxonMobil and large independent E&P companies such as Apache, “have the firepower to reposition themselves, because their balance sheets are in good shape, and if they wanted to they could take on debt,” to acquired additional assets, Byrnes said.
A third group of companies includes producers such as Encana or Newfield Exploration, which are in a good position to sell assets that are not core to their operations, but which might be highly attractive to other producers. “You have several companies who in my view have very good core positions that don’t need more core assets. But they can sell incremental properties to help them reinvest in those core assets,” Byrnes said.
However, other E&P companies are not likely to fare so well in the current distressed commodity price environment. “Those are the losers,” Byrnes said.
“They’re smaller, have more debt and they’re cutting dramatically on their capex in order just to survive,” he said.
“What happens in those situations is they lose their core relationships, so the best crews move away, they lose momentum to

19
OctOber 9, 2015INSIDe Ferc’S GAS MArKet rePOrt
copyright © 2015 McGraw Hill Financial
take part in any rebound, key personnel start to leave,” he said. “And — one of the most important things for an E&P company — is they lose the leverage of compounding, of continuing to reinvest and grow their production.”
For such smaller companies, in which general and administration expenses are consuming a huge percentage of their cash margins, “those companies should consider alternatives like mergers of equals,” Bynes said.
He argued that, while these types of arrangements could prove financially advantageous for both parties, they are often difficult to accomplish because of the complex social issues involved in marrying two separate corporate cultures.
“It makes a lot of sense financially and operationally, if you have two companies that are in the same basin that have that same situation, but you have a lot of barriers to completing those transactions,” Bynes commented.
— Jim Magill
REGuLATIoN
bay defends fERC environment policies as protestors end 18-day hunger strikeAt a time when the Federal Energy Regulatory Commission’s permitting process has become the locus of a raging battle over continued fossil fuel use, Chairman Norman Bay defended the commission’s stance on environmental issues, and the commitment of its employees to environmental stewardship.
Bay spoke to Platts on September 25, the day hunger strikers were completing their 18-day fast to call attention to their demand for “no new permits” of fossil fuel infrastructure. Organizers of the fast and other recent demonstrations have argued that FERC’s approval of vast amounts of natural gas infrastructure is out of sync with a shift in the global debate in favor of action now to head off climate change.
The activities at FERC’s door are part of a larger set of actions. As one activist framed, the long fight over the Keystone XL oil pipeline has emboldened activists to obstruct other projects around the country. That, most certainly, has made FERC a target.
Bay said FERC employees care about the environment and rejected the notion that FERC should be taking a more proactive stance on climate change, a shift protestors have advocated through speeches and shouts interrupting FERC commission meetings.
“At bottom, FERC is an economic regulator, not an environmental one. Under the Federal Power Act, I believe we have an obligation to be resource-neutral,” he said.
“While FERC certainly has policies in place to make markets more efficient and that enable demand response and other resources to participate in markets, all of which can have environmental benefits, at the end of the day FERC as an agency is not an environmental regulator,” Bay said.
Yet, criticism of FERC has been harsh and personal at times, for instance, when protestors created a mock carousel to poke at FERC and commissioners in particular for operating a revolving door with
industry. Wooden carousel figures displayed in front of the agency depicted each commissioner and listed their various links to industry.
Asked about the protests routinely present at FERC, and the recent hunger strikes, Bay said, “I think it’s unfortunate. FERC does not regulate the production of natural gas. That’s up to states and EPA and yet we’ve become a target for the protestors. I can only encourage them to participate in processes FERC makes available to the public.”
He rejected the notion that their extreme measures of late could be an indicator of problems with the processes afforded to the public, such as the complaints some raise about impediments to challenging agency decisions in a timely fashion.
“There is a tremendous amount of process that’s afforded to the public,” Bay said, adding “we take concerns that are raised with us seriously. Indeed under [the National Environmental Policy Act] the courts have said the agency must take a hard look at claims that are raised and we always try to do that.”
He did not see much likelihood that a sit-down with the protestors would resolve the differences.
“I always welcome dialogue if it can make a difference, and certainly I do my best to listen to other points of view even if they aren’t ones that I necessarily share, but disruptions of our open meetings are decorum of the proceedings. I understand that the former chairman met with the protestors, and that meeting apparently failed to resolve their disagreement with FERC. At this point, I’m not sure whether there’s anything to be gained meeting with them.”
Natural gas is a clean alternativeBay also made a case for the environmental benefits of gas.“One thing on gas that I’ll say that the protestors don’t seem to
appreciate is that gas burns much more cleanly than other fossil fuels, emitting half the carbon for example of coal,” he said.
It also can pair effectively with variable resources, he said, pointing to a recent Harvard study finding that there could be increased use of renewables when they are paired with gas generation.
“But these appear to be positives that the demonstrators do not wish to recognize,” he said.
In recent months, opposition to proposed projects such as the several calls from federal lawmakers and state officials for FERC to evaluate demand and environmental impacts on a regional basis.
Asked about such suggestions, Bay said the way FERC analyzes pipeline projects was set forth by a policy statement the commission issued 15 years ago that does not call for a programmatic review.
“Those are reviews that should occur when a development is the result of an affirmative government policy. There is no affirmative FERC policy to develop in some programmatic fashion pipelines ... If there were a reason to revisit the policy then I would be willing to do so, but I haven’t yet heard the case for revising the policy.”
As to FERC’s role in implementing the Clean Power Plan, Bay said FERC will be engaged on reliability issues, meeting quarterly with EPA and DOE staff to discuss any potential issues. He expected FERC to work closely with EPA, DOE, the states, the North American Electric Reliability Corp., independent system operators and industry going forward to help address any potential reliability concerns.
“Bottom line, FERC will be engaged,” he said.

20
OctOber 9, 2015INSIDe Ferc’S GAS MArKet rePOrt
copyright © 2015 McGraw Hill Financial
states and industry have time to planThe final regulation released this summer had helpful features, he
said, such as pushing back the interim target date to 2022, a reliability safety valve, the requirement for states to submit compliance plans for a reliability review, and the flexibility given to states in devising compliance plans including the use of renewable energy credits.
He agreed with the view that there may be a need for electric transmission or natural gas pipelines to meet the CPP goals. “That being said, the interim target date is 2022, so that gives states and industry time to start making plans,” he said, adding the need for infrastructure will depend on how states craft and implement their plans.
“FERC will always endeavor to do its work on infrastructure certificate applications in a timely, thorough way,” he said.
In the end, Bay defended the commission’s stance on environment in the face of criticism of its policies and at times its employees.
“Certainly, everyone on the commission cares about the environment, and we recognize the importance of environmental stewardship.” Indeed, he said, the commission’s mission statement is to help consumers obtain efficient, reliable and sustainable energy.
— Maya Weber
Moeller to leave fERC at month’s end after signaling his departure in MayCommissioner Philip Moeller will leave the US Federal Energy Regulatory Commission at the end of this month, he said October 6.
The announcement comes as no surprise, given that Moeller in May unveiled his plans to move on from FERC before the end of the year.
His second term expired June 30; he has been serving since then under a grace period that was set to expire at the end of the current session of Congress, which figures to wrap up sometime in November.
A Republican, Moeller first joined the commission in July 2006, having been nominated by President Bush, and then was re-nominated by President Obama to a second term.
A third term for a FERC commissioner is very rare, as is a re-nomination by an outgoing president of the opposing political party.
The chairman of the commission is designated by the president, and the majority of the five-person commission tends to represent the president’s political party.
On the current commission, Chairman Norman Bay and Commissioners Cheryl LaFleur and Colette Honorable are Democrats, while Moeller and Commissioner Tony Clark are Republicans. Because no more than three commissioners can be representative of the president’s party, Moeller’s replacement will be a Republican.
Early speculation on a replacement for Moeller has centered on Patrick McCormick, senior counsel for the Republican majority of the Senate Energy and Natural Resources Committee. The committee has primary jurisdiction over FERC, including vetting nominees for commission seats.
Over the years, Moeller has been a vocal and active commissioner, taking notable stands on key issues, mostly in the interest of competitive markets and grid reliability.
He brought early attention to the growing disconnect between
natural gas pipeline services and the growing demand for gas among power generators, which blossomed into the ongoing discourse over gas/electric coordination.
Moeller also consistently raised concern about the impact of increased restrictions on emissions from power plants on electric reliability, especially during periods of peak demand.
Before joining FERC, he headed the Washington office of Alliant Energy.
“FERC is an amazing agency, and I have been honored and privileged to have had the opportunity to serve our nation as a FERC commissioner,” he said on Tuesday. Thanking his colleagues and commission staff, Moeller said he would “pursue other opportunities in the energy field” after he leaves FERC.
— Chris Newkumet
MEXICo
us pipeline gas to Mexico rises 37% over year ago, replacing LNG importsUS pipeline gas is displacing LNG imports in Mexico at a faster rate than previously expected. Gas flows south across the US border in September were up 37% from levels during September 2014 to more than 3 Bcf/d, a 0.8 Bcf/d year-over-year increase, according to the latest data from Bentek Energy.
The monthly average came in about 0.4 Bcf/d higher than Bentek expected. The strong gains show that LNG imports into Mexico’s Altamira LNG terminal on the country’s Gulf Coast are being pushed out of the Mexican gas market by cheaper US pipeline gas.
Interstate pipeline flows across the US-Mexico border were unseasonably strong during the month, averaging just over 1.7 Bcf/d, a 420 MMcf/d, or 32%, year-on-year increase. Additional gas flows on the NET Mexico pipeline system in South Texas were by far the biggest contributor to, with exports averaging 320 MMcf/d over the month.
Rising exports on Tennessee Gas Pipeline in South Texas and on El Paso’s new Sierrita Lateral accounted for 30 MMcf/d and 120 MMcf/d, respectively. Toward the end of the month, even Texas Eastern flows increased back to 40 MMcf/d after falling to zero since January, suggesting that export capacity on the South Texas corridor, including NET Mexico, may have approached constraint levels, pointing to a potential high-side risk to Bentek’s export estimates.
Data from the Energy Information Administration show that NET Mexico has been flowing at very high utilization this summer. The 2.1-Bcf/d pipeline, which is technically limited to 1 Bcf/d because of capacity on the Los Ramones pipeline in Mexico — until Phase II comes online this December — flowed 960 MMcf/d in July, a 140 MMcf/d build over June, according to EIA.
This indicates that the new NET Mexico/Los Ramones corridor was running at nearly 100% utilization during the month. EIA data show that total exports to Mexico reached 3.2 Bcf/d in July, 1 Bcf/d higher than last year and about 0.1 Bcf/d higher than Bentek’s modeled estimate. During July, LNG imports by Mexico averaged just under 0.7 Bcf/d, or about 0.1 Bcf/d less than last year.

21
OctOber 9, 2015INSIDe Ferc’S GAS MArKet rePOrt
copyright © 2015 McGraw Hill Financial
Considering that Mexico’s gas production had declined by 450 MMcf/d from levels last year, Bentek estimates that Mexico’s gas demand was up by about 450 MMcf/d in July, largely because of new gas demand from power generation.
Data from the Mexico’s Comision Federal de Electricidad show that demand from power rose to 1.7 Bcf/d in July, a 450 MMcf/d increase over last year.
In August, the CFE reacted to extremely high power load by dispatching large quantities of fuel oil generation, with fuel oil consumption rising to over one billion liters during the month, a 57% increase over last year. Gas consumption remained elevated at 1.6 Bcf/d. This heavy reliance on fuel oil generation suggests that there still may be more than 1 Bcf/d potential gas demand growth in the power sector, if gas was used as a substitute for fuel-oil during peak summer months.
The primary driver of higher year-on-year gas flows across the border this September has been a displacement of LNG imports at the Altamira import terminal on Mexico’s Gulf Coast. The facility ties into the PEMEX pipeline system and primarily supplies Nuevo Leon, Mexico’s industrial heartland.
In 2014, Altamira imported just under 400 MMcf/d, the highest import year on record. This year, however, imports have fallen to less than 330 MMcf/d, the lowest level in five years. LNG imports in September were extremely low, falling to about 100 MMcf/d, or 320 MMcf/d less than last year.
LNG imports at the Manzanillo terminal on Central Mexico’s West Coast, on the other hand, remained elevated in September, rising to new highs of 625 MMcf/d, suggesting that the Mexico City area remains highly constrained during peak demand months.
Manzanillo imports have averaged about 400 MMcf/d this year, and represent potential upside for US exports into Mexico once the Los Ramones Phase II south pipeline expansion project comes in mid-2016.
Bentek expects US pipeline exports to Mexico to fall to about 2.4 Bcf/d for the remainder of this year as cooling demand declines heading into the winter. However, if LNG imports at Altamira continue to be displaced at a similar rate, US exports to Mexico might average as high as 2.7 Bcf/d through the end of the year.
— Ross Wyeno
fINANCIAL
derivitive market players mostly back ICE approach on speculative position limitsMultiple derivative market players are supporting ICE Futures US’s approach to setting speculative position limits for a heavily traded power futures contract.
In comments filed with the Commodity Futures Trading Commission, industry groups showed near-unanimous support for the IntercontinentalExchange’s method of calculating deliverable supply as generation in the zone plus power that can be imported from other areas through transmission — versus load estimates they suggested the CFTC had relied upon.
CFTC’s response to the ICE proposal is seen in the industry as an important bellwether of how the commission may come down on calculations of deliverable supply of electricity that are key to setting position limit levels for power contracts. Industry end-users have been critical of the CFTC’s previous approach to calculating deliverable supply, suggesting it was relying on old data that preceded major changes in the sector.
In May, CFTC’s Division of Market Oversight stayed ICE’s plan for position limits for eight NYISO Zone G power futures contracts, saying ICE’s proposal contained an inadequate explanation of the changes and may be inconsistent with the Commodity Exchange Act. It subsequently extended the stay, in response to ICE’s request to allow for additional comments.
Zone G ‘highway for power’The International Energy Credit Association wrote that NYISO Zone
G is “uniquely situated geographically so that it is the highway for power flowing from outside NYISO Zone G through Zone G and into the much larger electric markets of New York City in NYISO Zone J.”
“As a result of this geographic configuration, any estimate of the ‘deliverable supply’ available in NYISO Zone G needs to recognize the physical supply market in Zone G, which is much larger than merely the load physically located in NYISO Zone G,” IECA said.
“Limiting the determination of ‘deliverable supply’ to the quantity of electric energy consumed by the load physically located in NYISO Zone G ignores the characteristics of the cash market in NYISO Zone G, dramatically under-estimates the deliverable supply available in NYISO Zone G, artificially constrains the price discovery process and reduces the ability to hedge risks using futures contracts for NYISO Zone G,” the group said.
Several parties noted that the CFTC action on NYISO would set an important precedent for position limits on other power futures contracts.
The Coalition of Physical Energy Companies, whose members include Kinder Morgan, Shell Energy North America and others, said it “is concerned that the commission’s stay of ICE Futures’ NYISO Zone G request may represent a new level of invasive oversight into this well-functioning marketplace.”
Commercial end-users have become comfortable with exchange position limits as they have been structured based on each exchange’s understanding of cash markets, exchange issues, such as liquidity, and end users’ business and hedging needs, the group’s comments said.
CME Group, on the other hand, said it ultimately achieved a similar result as ICE for deliverable supplies for the zone, but it employed slightly different methods of calculation. Noting that ICE relied on nameplate capacity in calculating generation, CME used a “possibly more conservative approach,” the maximum historical generation for a three year period, it said.
Separately, discussing his agenda this fall, CFTC Chairman Timothy Massad said the commission plans to finalize a rule setting margin for uncleared swaps by the end of the year.
Rule would require more margin collectionSpeaking at the OTC Derivatives Conference, Massad
acknowledged that a large part of the swaps market is not centrally
22
OctOber 9, 2015INSIDe Ferc’S GAS MArKet rePOrt
copyright © 2015 McGraw Hill Financial
cleared, and said the rule would help reduce the risk of those trades and thus reduce the risks to end-users.
As proposed, the rule would require swap dealers to post and collect margin on uncleared swaps with one another — and with certain financial counterparties.
While the proposal would exempt end users, it is closely watched by the energy sector because of the potential for costs imposed on banks to flow to their customers, such as energy firms, and potential impact on market participation. In addition, uncertainties still linger on related definitions of swaps and end users, leaving some doubt as to which transactions or players would be covered by the requirement, said one industry representative.
Massad said he has been working closely on the margin proposal with bank regulators, who are responsible for developing such rules as well, with the goal of making the rules similar.
He said he is also working to harmonize the rule with those being developed by Japan and Europe.
“I expect our final rule will use the same overall threshold for defining material swaps exposure, and follow the same implementation schedule as Japan and Europe. We are also continuing to work with them on matters such as requirements for margin models, lists of eligible collateral, and collateral haircut,” he added.
Massad also said the CFTC will re-propose rules related to capital requirements for swap dealers and major swap participants. “As with the margin rules, we’re working with our fellow regulators — in this case the prudential regulators as well as the [Securities and Exchange Commission] — to harmonize these standards as much as possible.”
— Maya Weber
fINANCIAL bAsIs MARkETs
Northeast November basis makes some gains as Midwest dropsNovember financial basis swaps at the Northeastern city-gates have seen some increases since rolling into the prompt-month position September 29 as several pipeline projects are on track to increase takeaway capacity out of the Northeast production region beginning next month.
The basis price increases in the Northeast came as the NYMEX November natural gas futures contract fell to a settlement of $2.474/MMBtu on Wednesday from $2.586/MMBtu on September 29.
Algonquin Gas Transmission city-gates November basis was up to plus $2.805/MMBtu on Wednesday, compared with plus $2.66/MMBtu on September 29.
Algonquin winter 2015-16 basis, however, slipped 1 cent during that period to sit at plus $5.23/MMBtu on Wednesday.
The US Energy Information Administration said Thursday that US natural gas in storage rose 95 Bcf to 3.633 Tcf.
That was below consensus estimates of a build between 96 Bcf and 100 Bcf for the reporting week that ended October 2.
The injection was less than the 106-Bcf injection reported at this time in 2014 but greater than the 92-Bcf five-year average, according to EIA data.
NYMEX November futures strengthened immediately following the announcement, trading a few cents higher in the low $2.50s/MMBtu as of 10:50 am EDT Thursday.
At Transcontinental Gas Pipe Line Zone 6 New York, November basis was up to plus 15 cents/MMBtu on Wednesday, compared with plus 7 cents/MMBtu on September 29.
Bentek Energy, a unit of Platts, said a total of about 2.44 Bcf/d of incremental capacity is expected to come online through the rest of the year, and just under 2 Bcf/d of projects have already entered service ahead of schedule—Rockies Express Pipeline’s Zone 3 East-to-West and Texas Eastern Transmission’s Uniontown to Gas City.
Texas Eastern’s Ohio Pipeline Energy Network (OPEN) project began partial service on September 18, and full service is expected on November 1. The OPEN Project is set to increase north-to-south capacity along TETCO’s 30-inch diameter mainline by an incremental 550,000 Dth/d.
Additionally, Columbia Gas Pipeline’s East Side Expansion project is on target for a November 1 service date, after commencing partial service at the Milford Compressor Station on October 1, Bentek said. The East Side Expansion is designed to increase capacity on TCO’s system by roughly 313 MMcf/d.
Columbia Gas, Appalachia November basis was at minus 15 cents/MMBtu Wednesday, steady with the September 29 price. Dominion South November basis fell about 1.75 cents to minus $1.1675/MMBtu during that time frame.
Texas Eastern M-3 November basis also took a hit, falling to minus 82.5 cents/MMBtu from minus 69 cents/MMBtu.
Bentek said the projects set to enter service November 1 support its Northeast production forecast of 21.7 Bcf/d for the month of November—a roughly 1 Bcf/d increase from the month-to-date average 20.7 Bcf/d.
Forward basis prices took a hit in the Upper Midwest, with Chicago city-gates November basis sliding 6 cents to plus 13.75 cents/MMBtu between September 29 and Wednesday.
In Ontario, Dawn Hub dropped 8 cents during that time to plus 30.5 cents/MMBtu, while Michigan Consolidated declined 6.25 cents to plus 24.25 cents/MMBtu.
Northern Natural-Ventura was down 6.5 cents to plus 11.25 cents/MMBtu.
Along the Gulf Coast, Houston Ship Channel November basis was up to minus 4.5 cents/MMBtu Wednesday, compared with minus 5.75 cents/MMBtu September 29.
Transco Zone 3 November basis slipped to about minus 1.25 cents/MMBtu from minus 1 cent/MMBtu.
On the West Coast, Southern California Gas November basis moved up to plus 6 cents/MMBtu on Wednesday from plus 4.75 cents/MMBtu.
The Pacific Gas & Electric city-gate was at plus 45.5 cents/MMBtu Wednesday, compared with the September 29 prices of plus 43.5 cents/MMBtu.
Upstream, Northwest Pipeline-Rockies November basis fell 1.5 cents since September 29 to minus 9.25 cents/MMBtu on Wednesday. Northwest at the Canadian border stumbled 4 cents to minus 18 cents/MMBtu.
AECO November basis increased 2.25 cents during that time to minus 48.5 cents/MMBtu.
— Patrick Badgley
23
OctOber 9, 2015INSIDe Ferc’S GAS MArKet rePOrt
copyright © 2015 McGraw Hill Financial
FERC was hoping plans submitted this year by the New England Power Pool (NEPOOL) and ISO New England (ISO-NE) would adopt even more fuel sources for the upcoming winter, but ended up accepting a plan by NEPOOL that is similar to the one used during the previous winter.
Algonquin city-gates forward basis for the winter strip traded at more than $11/MMBtu last September. During trading this September forward basis for the winter was down around $5.60. Cash basis at Algonquin last winter ended averaging $6.04/MMBtu, nearly half of what the forward market was expecting prior to the start of the winter.
Bentek Energy, a unit of Platts, expects Algonquin city-gates cash basis to average about $4.73/MMBtu based on expected market fundamentals.
Although pipelines remained highly constrained last winter, the additional LNG cargoes that arrived proved effective in limiting price spikes and reducing basis averages.
Northeast Gateway, an offshore LNG facility that allows Floating Regasification (FSRU) for 600 MMcf/d with delivery to Algonquin Gas Transmission, received a 2.85 Bcf cargo on December 31, 2014, and helped keep Algonquin cash basis lower. Algonquin cash basis was capped at about $10 for most of the winter until LNG inventories became depleted and two additional cold snaps arrived in February and March.
LNG sendout totaled 19.43 Bcf last winter, about 9.62 Bcf higher than winter 2013-14 and LNG deliveries to interstate pipelines were about 390% higher than the previous winter, helping supply the Boston market and keeping price spikes in check.
Generation from fuel oil contributed largely during the late winter weather, hitting peak generation of 81,325 MWh/d on February 16, 2015, and averaging 7,610 MWh/d for the winter, 1,110 MWh/d higher than the prior winter of 2013-14.
The peak in fuel oil generation on February 16 coincided with Boston temperatures falling to negative 3 degrees Fahrenheit that day, about 28 degrees below the historic average low temperature.
This winter spot LNG availability could be even greater in the global marketplace because supply has increased and global LNG prices remain weak. Global LNG demand growth has risen a mere 0.7 Bcf/d, while at the same time 2.2 Bcf/d of new LNG supply capacity is expected to be added to the market by the end of 2015.
With a similar reliability program in place for the next three winter seasons, and the global LNG market facing depressed pricing, LNG supply is likely to continue supporting the New England winter market during pipeline capacity constraints on select days.
Canadian supply from offshore facilities, Sable Island and Deep Panuke in Nova Scotia, however, has diminished, as the former has been on a steady decline since 2008 while the latter has been shut-in for seasonal operations during the winter demand months. Encana stated that a large amount of water in the production stream has caused production problems over the past year. However, the production company plans to have supply back online during the winter heating season.
Total gas imports from East Canada averaged 1.1 Bcf/d last winter,
but are expected to flip to the Northeast pushing gas to Canada at an average of just over 200 MMcf/d this winter. Much of this can be attributed to declining and uncertain production in eastern Canada, as well as the TGP Niagara expansion project enhancing capabilities to send gas across the border.
The uncertainty of offshore Nova Scotia supply could be offset by a potential increase in LNG supply availability. Barring another severe winter, price spikes are likely to be similar to the previous winter market.
— John Hilfiker
New England winter outlook ...from page 1
Northeast pipe expansions...from page 1
TETCo oPENTexas Eastern’s Ohio Pipeline Energy Network (OPEN) Project began
partial service on September 18. Full service is expected November 1. The OPEN Project is 100% producer-backed and will increase north-to-south capacity along TETCO’s 30-inch mainline by an incremental 550,000 Dth/day.
When the full OPEN project enters service, TETCO will be able to receive gas from the UEO Gathering System via the Ohio Extension, a new pipeline lateral and compressor station, which will link the 1 Bcf/d processing system to the M2 mainline. When this portion of the project enters service, Bentek expects an increase in Ohio Utica gas production.
Project subscribers have reserved firm capacity from M2 receipt points to delivery points in M1 and WLA. The full start of the OPEN project will likely offer little to no basis relief at the constrained TETCO M2 trading point and should contribute downward pressure on downstream delivery hubs.
TGP broad RunTennessee Gas Pipeline’s Broad Run Expansion is set to roll out in
two phases. The first phase, which enters service this November, will increase southbound capacity from Zone 3 to Zone 1 on TGP by 590,000 Dth/day. The second, scheduled for a 2017 in-service date, will expand capacity by an additional 200,000 Dth/day. This project is fully subscribed by Antero Resources, an active and prolific producer in the Marcellus and Utica shale basins.
Given the nature of the project — that it is fully backed by a Northeast producer and expands capacity from West Virginia to the southeast — Bentek expects this project to increase production.
Antero may fill the project capacity with entirely new production or re-route gas that was previously being delivered onto Dominion or TCO. Antero has been highly active in West Virginia and the company is constructing its own gathering facilities in Doddridge, Tyler and Ritchie counties, West Virginia, according to the company website.
Should capacity be filled with 100% newly brought-online production, Bentek expects there to be little impact to prices at constrained Northeast trading hubs such as Dominion South.
On the other hand, providing Antero decides to re-route production from Dominion’s system onto TGP in order to ship it to TGP Zone 1, it