ferc’s economic methodology chapter 3 - … · 2002-07-18 · ferc’s economic methodology...
TRANSCRIPT

FERC’S ECONOMIC METHODOLOGY CHAPTER 3 ______________________________________________________________________________
FERC’s economic analysis of hydropower project relicensing involves an assessment of the costs and benefits of operating a project under various proposed modes and conditions. Relicensing proposals can range from continuing operations as allowed under the existing license (referred to as the “no-action” alternative), to operating the dam under alternative conditions, to removing the dam. FERC is responsible for evaluating the developmental and non-developmental values associated with these different alternatives to determine which option would give the greatest benefit to the public.1
This chapter is intended to provide FWS field staff with basic information on FERC’s economic methods and the rationale that FERC presents to justify its approach. We provide a non-evaluative description; discussion of refinements to FERC’s approach is reserved for Chapter 4. We begin the chapter with a discussion of the role FERC’s economic analysis plays in relicensing decisions. We then provide an overview of the basic components and key assumptions inherent in FERC’s methodology. Emphasis is placed on the benefits of power generation, costs of project operation, and costs of environmental measures -- the components that FERC most commonly incorporates into its net benefit estimates for relicensing alternatives.2
1 “Developmental” benefits of a project include power generation, water supply, flood control, irrigation, and river navigation. “Non-developmental” values of a waterway include fish and wildlife resources, recreational opportunities, and other aspects of environmental quality.
2 Throughout the report, we use the term “environmental measures” to refer to actions that would protect, mitigate damages to, and/or enhance the environment. FERC refers to environmental actions as “enhancements” because FERC assumes that the baseline for analysis is the waterway’s existing conditions. In contrast, resource agencies view a new environmental action as a “mitigation of resource losses” because they assume a “without the project” baseline (i.e., conditions that would prevail after the project is removed). We discuss baseline issues in more detail in later in this Chapter and suggest refinements to FERC’s current approach in Chapter 4.
3-1
We also describe FERC’s approach to assessing components that are not commonly included in the quantification of net benefits for relicensing alternatives. These elements include: “avoided pollution” benefits of hydropower generation (as compared to other means of generating power); services provided by project operation, such as flood control, water supply, irrigation, and river navigation benefits; and environmental benefits, such as improved recreational opportunities, improved fish and wildlife resources, and other aspects of environmental quality.
PURPOSE OF FERC’S ECONOMIC ANALYSIS
In a recent relicensing decision, FERC summarized the purpose of its economic analysis as follows:
The basic purpose of [FERC’s] economic analysis is to provide a general estimate of the potential power benefits and the costs of a project, and reasonable alternatives to project power. The analysis helps to support an informed decision concerning what is in the public interest with respect to a proposed license.3
While economic analysis plays an important role in guiding relicensing decisions, it is not the only decision criterion. FERC staff also weigh factors not captured (or quantified) in their economic analysis:
[W]hen we [FERC] decide among competing proposals, we must deal with both (1) resource effects we can quantify, often expressed in dollars, and (2) aspects we must describe qualitatively, sometimes based on expert opinion. In proceedings with qualitative aspects, we usually look at the economic value of the proposals first. Then we see whether the best qualitative proposal differs from the best economic proposal.4
This mixed quantitative and qualitative approach makes it possible for FERC to issue a license even if its economic analysis suggests the relicensing alternative will result in net negative benefits. As FERC states in its Mead Corporation relicensing decision, “while economic considerations are a significant element of the public interest balancing for both new and existing projects, they are by no means the determinative consideration, and a finding of negative economic benefits does not preclude issuance of a license.”5
FERC staff acknowledge that basing relicensing decisions on a straightforward benefit-cost analysis would be preferable to the current approach. However, this is only possible when estimates can be quantified for both developmental and non-developmental values:
3 FERC, Order Issuing New License, Mead Corporation, Project No. 2506, July 13, 1995, p. 8.
4 FERC, Deciding Competing Resource Use Issues at FERC -- From Theory to Practice, prepared by James M. Fargo, 1993, p. 2.
5 FERC, Project No. 2506, July 13, 1995, p. 8-11.
3-2

If we [FERC] assign a dollar value to each competing developmental and non-developmental use of a waterway, we can use economic principles alone to decide which proposal gives the greatest benefit to the public…. the proposal with the largest total value should give the greatest developmental and non-developmental benefits to the public.6
Assigning dollar values to non-developmental resources is often difficult because no conventional market exists for these resources. FERC staff point out three major problems with estimating the value of non-developmental resources:
• The kind of information needed to put a dollar value on a unit of a resource (dollars per recreation-day or dollars per fish) may not exist (or may be difficult to apply).
• Unlike developmental values, getting people to agree on exactly what costs they should include to derive a value for a unit of a non-developmental resource can be difficult.
• If the information needed to put a dollar value on a unit of a resource does exist, it may be difficult to estimate how a proposed environmental measure increases the number of resource units.7
Due to these problems, FERC’s economic analyses typically involve a combination of assigning dollar values to developmental resources and qualitatively appraising the value of non-developmental resources. FERC weighs quantifiable net benefits with qualitatively appraised factors to decide which relicensing alternative is most in the public’s interest.
OVERVIEW OF FERC’S ECONOMIC METHODOLOGY
To estimate the net benefits of different relicensing proposals, FERC focuses its economic analysis on six benefit and cost components associated with power generation, project operation, and environmental measures (see Exhibit 3-1). Typically, FERC quantifies three of these components (indicated by solid-line boxes) and incorporates them in its net benefit estimates. The others (indicated by dotted-line boxes) are either assessed qualitatively due to the difficulties associated with assigning dollar values to non-market amenities, or quantified but left out of the net benefit calculation.
6 FERC, Evaluating Relicense Proposals at the Federal Energy Regulatory Commission, Office of Hydropower Licensing, Paper No. DPR-2, Washington, DC, April 1991, p. 8.
7 FERC, Ibid., p. 8-9.
3-3

Exhibit 3-1
OVERVIEW OF FERC’S ECONOMIC METHODOLOGY*
* Solid-line box indicates quantified estimate. Dotted-line box indicates items either assessed qualitatively or quantified but left out of FERC’s net benefit calcultaion.
Annual Gross Power
Benefits
Annual Benefits Of
Avoided Pollution
Annual Costs of Operation
Annual Benefits of
Project Services
(e.g., flood control)
Annual Benefits of
Environmental Measures
Annual Costs of
Environmental Measures
Annual Net
Benefits
POWER GENERATION PROJECT OPERATION ENVIRONMENTAL
MEASURES
The six benefit and cost components of FERC’s economic methodology for estimating annual net benefits can be defined as follows:
1. Annual Gross Power Benefits: These benefits reflect the avoided cost of replacing a project’s power generation and dependable capacity with power and equally reliable capacity from an alternative source.8
2. Annual Benefits Of Avoided Pollution: Relative to alternative types of power generation, such as a coal-fired plant, hydropower production generates less air pollution. FERC generally discusses this avoided pollution as a benefit of hydropower projects.
3. Annual Costs of Operation: This cost reflects past investment costs owed on the project, anticipated future investment costs, and current operation and maintenance (O&M) costs.
4. Annual Benefits Of Project Services: Beyond power generation, hydroelectric projects may offer benefits such as flood control, water supply, irrigation, and river navigability.
5. Annual Costs Of Environmental Measures: Many licensing decisions introduce operating conditions designed to protect, mitigate damages to, or improve environmental quality. These changes may result in direct costs and/or reduced power values. There are direct costs associated with, for instance, purchasing and installing fish passage facilities. Likewise, changes
8 “Dependable capacity” refers to the power a project can guarantee it will produce during future hours of peak demand, such as the afternoon of a hot summer day. Capacity is constrained by the amount of water that can be run through the project to generate power.
3-4

in flows may reduce power values, either because they cause direct losses in power generation or they shift power generation from periods when energy prices are high to periods when energy prices are low.
6. Annual Benefits Of Environmental Measures: Environmental measures, such as fish screens or changes in minimum flow requirements, can improve fish and wildlife resources, recreational opportunities, and other aspects of environmental quality. Because these benefits are separate from power generation values, they are often referred to as “non-power” benefits.
To estimate annual net benefits, the costs of project operation and environmental measures are subtracted from the quantitative and qualitative benefits of gross power generation, avoided pollution, project services, and environmental measures.
KEY CONCEPTS AND ASSUMPTIONS
Before describing FERC’s approach to developing estimates for each of the six components listed above, we summarize some of the key assumptions underlying FERC’s economic analysis. These assumptions include: (1) where FERC has set its baseline for analysis; (2) how FERC treats inflation; and (3) what discount rate and time period FERC uses as a basis for developing estimates.
Baseline For Analysis
To evaluate competing uses of a waterway, FERC needs a reference point or “baseline” against which it can compare each proposal’s potential impact on developmental and non-developmental resources. FERC has established that the appropriate baseline to use for relicensing proceedings is the current operation of the project under its existing license and the current waterway environment.9 Against this baseline, referred to as the “no-action” alternative, FERC staff evaluate proposed relicensing alternatives and environmental measures.
The choice of a baseline can affect the environmental analysis of relicensing alternatives in two ways.10 First, it can affect the quantity or level of environmental impacts attributable to the project. For example, the environmental impacts of a project would be considered much greater if viewed from a baseline of “without the project” (i.e., conditions that would prevail after the project is removed) as opposed to a baseline of existing conditions with the project. Second, the baseline affects the type of environmental measures used to offset project impacts. For instance, under the current baseline, measures may be directed toward improving the existing environment (e.g., enhancing reservoir fisheries and reservoir recreation). If a “without
9 FERC, April 1991, op cit., p. 5. Also see City of Tacoma, 67 FERC � 61,152, 1994.
10 For a more detailed discussion of baseline issues, see Hydropower Reform Coalition, Environmental “Baseline” In FERC Relicensing, May 1, 1997, p. 2-3.
3-5

the project” baseline were assumed, measures might be more focused on mitigating resource losses caused by the existing project (e.g., measures to restore the ecological health of the river).
L In Chapter 4, we discuss baseline issues in more detail and suggest refinements to FERC’s current approach. We recommend that parties involved in relicensing use “without the project” conditions as a reference point for identifying potential non-power benefits associated with the river resource.
Treatment Of Inflation
In its Mead Corporation relicensing decision of 1995, FERC declared a new policy for the treatment of inflation in its economic analyses. FERC decided it will no longer assume costs escalate steadily over the term of the license. Instead, FERC will base its economic analysis on current costs.
The commission is changing its approach to evaluating the economics of both new and existing hydroelectric projects. We no longer will employ an analysis that assumes alternative fossil fuel and other costs escalate steadily over the term of the license. Instead we will use current costs to compare the costs of the project and likely alternative power…. Costs for alternative fossil fuels, operation and maintenance expenses, and the like, will remain constant. No forecasts or assumptions will be made concerning potential future inflation, escalation, or deflation beyond the license issuance date for existing projects.11
FERC defends its policy change for the treatment of inflation by noting the difficulty of predicting inflation in general, as well as the problem of forecasting inflation for specific components of power costs, such as fuel.
FERC’s “no inflation” policy does not systematically bias its economic analysis of project benefits. Rather, the impact of the “no inflation” assumption will depend on how price inflation varies for different components of FERC’s economic analysis. For example, long-term fuel price inflation could rise at a faster rate than other project-specific costs. If this scenario occurs, by ignoring inflation, FERC will understate the relative cost of replacement power, and therefore understate the value of the project’s power benefits. However, under a different scenario, fuel price inflation could rise at a slower rate than other project costs, resulting in an overstatement of the project’s power benefits.
Discount Rate And Time Period For Analysis
FERC’s economic analysis covers a 30-year time period.12 Because the costs and benefits of relicensing alternatives may occur at different times during the 30-year period, FERC
11 FERC, Project No. 2506, July 13, 1995, op cit., p. 10.
12 FERC, Ibid., p. 10
3-6

“discounts” future costs and benefits to their “present value” to make relicensing alternatives comparable. Discounting is commonly applied in financial analysis because it provides a means for converting future costs and benefits into present value dollar amounts (i.e., their worth today). The principle behind discounting is the “time value of money” -- i.e., a dollar paid today is worth more than a dollar paid a year into the future because the person holding the dollar can invest it and earn a return.
FERC typically assumes a discount rate of ten percent, though in some instances a rate as low as seven percent has been applied.13 To illustrate how discount rates work, we have applied a seven and ten percent discount rate to a project’s ten-year stream of annual benefits of $1,000,000 (see Exhibit 3-2). The purpose of this example is to show how: (1) the further into the future benefits (or costs) occur, the lower their present value; and (2) the greater the discount rate applied, the lower the present value will be for a given benefit (or cost) stream.
Through discounting, FERC develops total present value estimates of net benefits that allow for “apples to apples” comparisons of relicensing alternatives. The alternative with the highest total present value of net benefits is preferable. As an additional step, FERC applies a “levelizing” formula to the present value sums to establish equal net benefit amounts for each year of a new license.14 This allows estimates to be compared on an annual basis.
Why Discount Rates Matter
The choice of a discount rate can significantly affect the present value of future costs and benefits. For example, relicensing alternatives with net benefits that occur further into the future will be relatively more attractive when a lower discount rate is applied. To illustrate, consider two alternatives based on the present value calculations shown in Exhibit 3-2. Project A will generate $1,000,000 in net benefits in Year 2, while Project B will generate $1,000,000 in net benefits in both Year 9 and Year 10. As shown in Exhibit 3-3, the discount rate greatly affects which project is preferable. Under a lower discount rate (seven percent), Project B is more attractive; the reverse is true under a higher discount rate (ten percent).
13 FERC used a 7 percent discount rate in its analysis of the Cushman project (FERC, Draft Environment Impact Statement, Project No. 460, November 1995, p. 5-7), and 8 percent in the White Rapids project (FERC, Draft Environmental Impact Statement, Project No. 2357, November 1995, p. D-4). As cited in David Marcus, FERC’s Economic Analysis Of Hydro Projects: A Review Of Policy And Practice Since The Mead Decision, prepared for the Hydropower Reform Coalition, March 18, 1997, p. 7.
14 Levelizing is similar to creating an annuity, in that it creates a level stream of equal dollar payments that lasts for a fixed period of time. The formula for levelizing is: B = [PV * r * (1+r)t]/[(1+r)t-1] where “B” represents the levelized annual net benefits, “PV” represents the total present value of discounted net benefit flows, “r” is equal to the discount rate, and “t” represents the number of years over which the payments are to be made.
3-7

1 2 3 4 5 6 7 8 9
10
L In Chapter 4, we discuss the appropriate discount rate for analyzing relicensing alternatives in more detail. We recommend that, rather than the current ten percent discount rate, FERC apply a discount rate of two percent and seven percent. If annual net benefits differ significantly under the two rates, FERC should determine which relicensing measures are most sensitive to variation in the discount rate and evaluate their benefits to the public more thoroughly.
Exhibit 3-2
DISCOUNTING A STREAM OF BENEFITS TO PRESENT VALUE UNDER TWO DISCOUNT RATES
Year *
Power Generation Benefits
Present Value Of Benefits** (7 percent discount rate)
Present Value Of Benefits** (10 percent discount rate)
$1,000,000 $934,579 $909,091 $1,000,000 $873,438 $826,446 $1,000,000 $816,298 $751,315 $1,000,000 $762,895 $683,013 $1,000,000 $712,986 $620,921 $1,000,000 $666,342 $564,474 $1,000,000 $622,750 $513,158 $1,000,000 $582,009 $466,507 $1,000,000 $543,933 $424,097 $1,000,000 $508,349 $385,543
Total Present Value $7,023,582 $6,144,567 * Benefits are realized at the end of each year. **Present value of benefits = undiscounted value / (1 + discount rate)(Year #)
For example, at a discount rate of 7 percent, the present value of $1 million in benefits to be received in Year 5 = $1,000,000 / (1 + .07)5 = $712,986
Exhibit 3-3
COMPARISON OF PROJECT ALTERNATIVES UNDER DIFFERENT DISCOUNT RATES
Relicensing Alternatives
Present Value Of Net Benefits (7 Percent Discount Rate)
Present Value Of Net Benefits (10 Percent Discount Rate)
Project A $873,438 $826,446 Project B $1,052,283 $809,641
Why The Time Period Of Analysis Matters
In addition to the discount rate, it is worth noting that the number of years included in an economic analysis can affect the net benefits of relicensing alternatives. Although FERC has established that its economic analysis will cover a 30-year period, it is possible that some alternatives, such as dam removal, may result in long-term net benefits that continue to be
3-8

realized after 30 years. A longer period of analysis that captured these benefits would make such alternatives relatively more attractive.
FERC’S APPROACH TO ESTIMATING ANNUAL NET BENEFITS
To calculate the annual net benefits of relicensing alternatives, FERC develops quantitative estimates for three of the six cost and benefit components shown in Exhibit 3-1: (1) Annual Gross Power Benefits; (2) Annual Costs of Operation; and (3) Annual Costs Of Environmental Measures. Below, we describe FERC’s approach to estimating values for these components. FERC’s economic analysis can vary somewhat from project to project. Our description is intended to capture the approach commonly used by FERC, while noting important variations. For illustration, we draw on examples from FERC’s analysis of the North Georgia project.15 Based on our review of FERC’s economic analyses, and conversations with FERC staff, the North Georgia project appears to provide a fair representation of FERC’s economic approach.16
Annual Gross Power Benefits
Gross power benefits reflect the cost that would be incurred to replace a project’s current energy and dependable capacity values with energy and equally reliable capacity from an alternative source.17 FERC quantifies how an overall electric power system’s future costs would differ with and without the project.
FERC calculates the annual gross power benefits of a project by: (1) summing the costs of replacing its energy and capacity values; and (2) multiplying that sum by the average annual
15 FERC, Final Environmental Impact Statement, North Georgia Hydroelectric Project, FEIS-0098, June 1996. The North Georgia project is located in the Savannah River Basin on the Tallulah, Chattooga, and Tugalo rivers in northeast Georgia and northwest South Carolina. It consists of six dams that collectively generate an average of 427 gigawatt-hours (GWh) of energy annually.
16 Charles R. Hall (FERC, Office of Hydropower Licensing) agreed with IEc’s assessment that the North Georgia project provides a representative example of FERC’s economic approach. He also provided additional economic data on the North Georgia project. Personal communication, April 29, 1998.
17 Energy values are variable; they rise and fall with changes in supply and demand. In FERC’s analysis, energy values reflect the average hourly energy value of the project. Dependable capacity values (as noted previously) are based on the amount of power a project can reliably be expected to produce during future periods of peak energy demand. Through contractual agreements, projects get paid a fixed amount for their dependable capacity. Unlike energy values, capacity values do not fluctuate with hour-to-hour changes in supply and demand.
3-9
generation of the existing project. For example, FERC estimates that the energy value (average marginal energy cost avoided by power generation) of the North Georgia project is $15/megawatt-hour (MWh) and the value of the project’s dependable capacity is $27/MWh. FERC multiplies the sum of these values ($42/MWh) by the average annual generation of the project (427,000 MWh) to arrive at an estimate of $18 million in annual gross power benefits.
To develop energy and capacity value estimates, FERC uses one of two approaches: (1) the cost of replacement power from the most likely thermal alternative; or (2) simulated market prices. Each approach represents an effort to develop energy and capacity price information that can be used to estimate future power costs with and without the hydropower project.
“Most Likely Thermal Alternative” Approach
The “most likely thermal alternative” approach is the method most commonly used by FERC to estimate gross power benefits.18 Under this method, FERC decides which thermal unit (or units) would most likely replace the power currently generated by the applicant’s hydropower project. To identify this alternative source, FERC considers the specifics of the hydropower project and circumstances in the regional power market:
In proceedings where the hydro project has little or no dependable capacity, the cost of the alternative to the hydro project is often the cost of increasing the load on the regional utilities’ existing fossil-fuel generators. For hydro projects with dependable capacity, besides including fuel cost, the cost of the alternative power is likely to include all operation and maintenance expenses and fixed costs of any thermal plants the project would displace.19
In addition, industrial applicants that directly use their project’s power avoid power transmission and distribution costs. Since replacement power for these applicants would most likely be purchased from a local utility, replacement costs must include the utility’s costs of power transmission and distribution.
A Simplified Example Of The Most Likely Thermal Alternative Approach
To clarify FERC’s most likely thermal alternative approach, consider the simplified regional power system shown in Exhibit 3-4. Three generation facilities (A, B, and C) supply all of the region’s power in equal amounts. For the purpose of this example, assume that power represents energy and capacity values combined and power demands are constant. Producer A is a hydropower project that has applied to FERC for relicensing. To estimate the gross power benefits of Producer A, FERC assesses the costs of replacing Producer A’s power with the most likely least-cost alternative. In this case, construction of Producer D’s power generation facility
18 FERC, Workshop on Evaluating the Economics of Hydroelectric Projects at FERC, Office of Hydropower Licensing, February 3, 1998, p. 3.
19 FERC, Ibid.
3-10
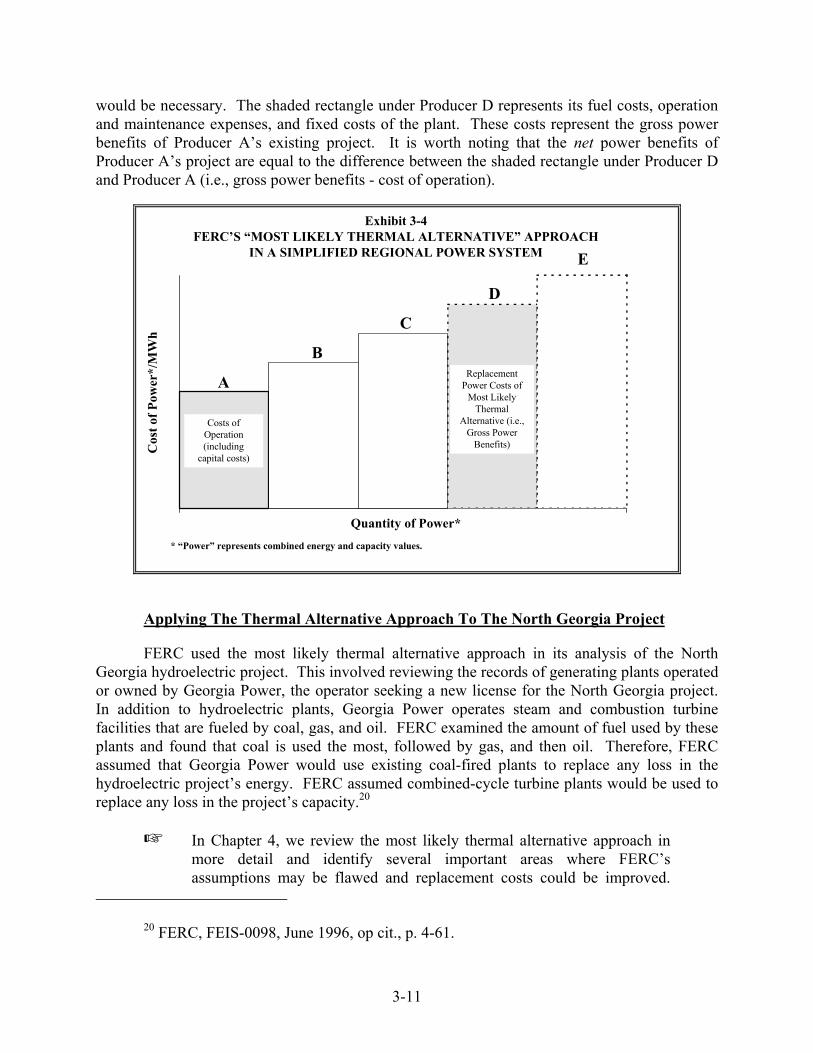
would be necessary. The shaded rectangle under Producer D represents its fuel costs, operation and maintenance expenses, and fixed costs of the plant. These costs represent the gross power benefits of Producer A’s existing project. It is worth noting that the net power benefits of Producer A’s project are equal to the difference between the shaded rectangle under Producer D and Producer A (i.e., gross power benefits - cost of operation).
Exhibit 3-4 FERC’S “MOST LIKELY THERMAL ALTERNATIVE” APPROACH
IN A SIMPLIFIED REGIONAL POWER SYSTEM
A
E
D
C
B
Quantity of Power*
Cos
t of P
ower
*/M
Wh
* “Power” represents combined energy and capacity values.
Costs of Operation (including
capital costs)
Replacement Power Costs of
Most Likely Thermal
Alternative (i.e., Gross Power
Benefits)
Applying The Thermal Alternative Approach To The North Georgia Project
FERC used the most likely thermal alternative approach in its analysis of the North Georgia hydroelectric project. This involved reviewing the records of generating plants operated or owned by Georgia Power, the operator seeking a new license for the North Georgia project. In addition to hydroelectric plants, Georgia Power operates steam and combustion turbine facilities that are fueled by coal, gas, and oil. FERC examined the amount of fuel used by these plants and found that coal is used the most, followed by gas, and then oil. Therefore, FERC assumed that Georgia Power would use existing coal-fired plants to replace any loss in the hydroelectric project’s energy. FERC assumed combined-cycle turbine plants would be used to replace any loss in the project’s capacity.20
L In Chapter 4, we review the most likely thermal alternative approach in more detail and identify several important areas where FERC’s assumptions may be flawed and replacement costs could be improved.
20 FERC, FEIS-0098, June 1996, op cit., p. 4-61.
3-11
For example, we note that in some cases energy demand and fuel costs may be overstated. We also recommend that, where possible, FERC begin using market prices to evaluate replacement energy costs rather than continue using the most likely thermal alternative approach.
Simulated Market Price Approach
Under the simulated market price approach, FERC does not attempt to pick which thermal alternative would most likely replace the power of the existing project. Instead FERC relies on energy and capacity price information developed by simulating the future operation of the regional electric power system.21 By assessing the difference in future system costs with and without the existing hydropower project, FERC can estimate the dollar amount the system can avoid by continuing to operate the hydropower project. This amount is equal to the gross power benefits of the project.
In practice, FERC usually relies on an electric utility or regional planning body to develop simulated market prices due to the complexity of modeling power price scenarios. Among other things, the model must account for the cost of producing power; how the system will retire old and add new power generation facilities; and the dependability of the power system. Because of the significant challenges involved with building a reliable model, FERC uses the simulated market price approach less frequently than the most likely thermal alternative method.22
Annual Costs Of Operation
FERC’s estimate of the annual costs of operation is based on the sum of the project’s annualized capital costs and current operation and maintenance (O&M) costs. Capital costs include past investment costs owed on the project and anticipated future investments costs, such as dam repair. FERC’s economic method for estimating the annual costs of operation typically involves three steps:
1. FERC totals the estimated unamortized capital costs of the project, including future and past investment costs, for the proposed 30-year license period.
2. Based on this total, and financial assumptions about the tax rate (typically 34 percent), interest rate, and discount rate (typically ten percent), FERC calculates a levelized annual capital cost for the 30-year period.
21 FERC, Workshop on Evaluating the Economics of Hydroelectric Projects at FERC, op cit., p. 3.
22 FERC, Ibid.
3-12

3. FERC adds current annual O&M costs to the levelized annual capital cost to arrive at an estimate of the total annual costs of operation.
For example, FERC estimates that the total unamortized capital costs for the North Georgia project are $36,627,146 in net investment costs and $25,200,000 in future dam repair. Using these estimates, FERC calculates a levelized annual capital cost of about $7,100,000, assuming a discount rate of 9.51 percent. To the annual capital costs, FERC adds current annual O&M costs (about $3,600,000) and other levelized annual costs associated with taxes and insurance (about $2,100,000) to arrive at an annual costs of operation of $12,800,000.23
The annual costs of operation can also be affected by the environmental measures that FERC ultimately recommends as part of the new license. FERC has traditionally estimated the direct cost of environmental measures and folded them into annual project operation costs. For the purpose of disaggregating and clarifying FERC’s methodology, we treat the costs of environmental measures and project operations as separate components.
L In Chapter 4, we identify several important ways in which annual operation cost estimates could be improved. In particular, we recommended that the analysis: (1) remove “sunk costs” from the analysis; (2) estimate capital costs based on the year they are incurred; and (3) include future decommissioning costs.
Annual Costs Of Environmental Measures
Environmental measures are usually targeted toward improving recreational opportunities, fish and wildlife resources, and other aspects of the river and reservoir environment. New licenses may require a range of actions, from constructing a boat ramp to installing fish passage facilities. Modification of instream flows may also be necessary for several reasons, such as the improvement of fish habitats, whitewater rafting opportunities, or aesthetics. In addition, licenses may require off-site conservation measures to compensate for habitat (e.g., wetlands) injured by the dam.
Environmental measures can affect costs in two ways. First, a measure may have direct costs, such as the costs of purchasing and installing a fish screen. Exhibit 3-5 provides examples of the direct costs of some FERC-recommended measures for the North Georgia project. Second, a measure may cause losses in power values. Most often these losses are due to required flow changes that affect “peaking” projects (see text box for more information on peaking power). Increases in minimum flows can reduce power generation directly or shift power generation from high-demand, peaking periods (e.g., daytime) to low-demand, base-load periods (e.g., nighttime). Exhibit 3-6 shows examples from the North Georgia project in which FERC-recommended flow changes affect energy values. In some instances, environmental
23 FERC, North Georgia Hydroelectric Project -- Economic Spreadsheet, Project No. 2354, provided by Charles R. Hall, Office of Hydropower Licensing, April 29, 1998.
3-13

measures may increase project operation costs and decrease energy values. For example, a requirement to increase minimum flows at the North Georgia project results in direct costs to install a new orifice in the project and a reduction in energy values due to changes in flows.
Exhibit 3-5
DIRECT COSTS OF ENVIRONMENTAL MEASURES AT THE NORTH GEORGIA PROJECT
Measures Net Annual Cost Improve public access to Lake Tugalo $49,700 Install new orifice in Mathis-Terrora project to provide minimum flows and monitor minimum flows*
$10,100
Develop and implement reservoir litter control plan for Lakes Tugalo and Yonah
$7,000
Provide habitat improvements in island area #1 below Yonah dam $2,200 * In addition to direct costs, this measure reduces energy values (see Exhibit 3-6). Source: FERC, North Georgia Hydroelectric Project, FEIS-0098, June 1996, p. 5-8.
PEAKING HYDROELECTRIC PROJECTS
Hydroelectric projects may be operated in a “peaking” or “run-of-river” mode. A run-of-river project simply allows the river to run through the project; flows are not regulated. contrast, a peaking project regulates flows in order to maximize energy values. ng project increases flows to generate more electricity during periods of peak demand (when energy prices are high), and reduces flows to store up capacity during periods of low demand (when energy prices are low). ows through a peaking project may be greater during the day than at night.
Relicensing alternatives for peaking projects frequently carry conditions requiring the project to increase its minimum flows. increases may, for instance, improve fishery resources. inimum flows can also affect a project’s revenues. onsider a simplified example where a minimum flow standard requires a project to increase its current flows at night. In turn, the project’s capacity to generate electricity during the day is reduced. ay generate the same amount of power, but because prices are lower at night, the project will earn lower revenues.
In A peaki
Thus, fl
Such However, m C
Overall, the project m
3-14

Exhibit 3-6
LOSS IN GENERATION AND ENERGY VALUES DUE TO MINIMUM FLOW RELEASE REQUIREMENTS
AT THE NORTH GEORGIA PROJECT Minimum Flow
Alternatives Hydroelectric
Developments* Loss in Power (GWh/Year)**
Loss in Energy Value ($/Year)
10 cubic feet per second Burton 0.00 $1,700 (cfs) year-round at Nacoochee 0.00 $1,100 Mathis-Terrora*** athis-Terrora 0.64 $9,900
Total 0.64 $12,700 35 cfs year-round at Burton 0.00 $6,100 Tallulah Falls Nacoochee 0.00 $3,900
Mathis-Terrora 3.3 $51,100 Tallulah Falls 3.35 $77,000 Total 6.65 $138,100
500 and 700 cfs various Burton 0.00 $10,600 weekends for Nacoochee 0.00 $7,400 whitewater boating Mathis-Terrora 0.00 $7,400
Tallulah Falls 1.84 $48,200 Total 1.84 $73,600
* The North Georgia Project consists of six hydroelectric developments. ** Although a zero indicates no reduction in total power generation, losses in energy values occur because the minimum flow causes a shift of power generation from peak- to base-load periods. *** As shown in Exhibit 3-5, this measure also involved the direct costs of installing a new orifice in the Mathis-Terrora development. Source: FERC, North Georgia Hydroelectric Project, FEIS-0098, June 1996, p. 5-5 to 5-6.
M
For the North Georgia project, FERC evaluated the cost of environmental measures for: (1) the no-action alternative; (2) the applicant’s proposal; and (3) the FERC staff’s recommended alternative. For the no-action alternative, costs are zero since it requires no changes in the existing operations of the project. Environmental measures under the applicant’s proposal would cost about $360,000 annually, whereas FERC’s recommended alternative would cost about $470,000.24 These values are used below to calculate the annual net benefits of the North Georgia project’s relicensing alternatives.
Annual Net Benefit Calculation
FERC uses its estimates of annual gross power benefits, annual costs of operation, and annual costs of environmental measures to calculate the annual net benefits of each relicensing alternative. Where environmental measures reduce power values, the costs are incorporated in the estimate of annual gross power benefits. To illustrate, Exhibit 3-7 carries through the annual
24 The costs of environmental measures listed in Exhibits 3-5 and 3-6 do not add up to $470,000 because the exhibits do not include all the measures recommended by FERC.
3-15

net benefit calculation for the three relicensing alternatives of the North Georgia project. Although FERC typically includes the direct costs of environmental measures in the annual costs of operation, we have broken direct costs out to make the calculations clearer.
Exhibit 3-7
ANNUAL NET POWER BENEFITS OF PROPOSED ALTERNATIVES FOR THE NORTH GEORGIA HYDROELECTRIC PROJECT
Proposed Operation Of Project
Annual Average Power
Generation (GWh)
Annual Gross Power
Benefits ($000)
Annual Operating Costs Of Existing
Project ($000)
Annual (Direct) Costs Of Environmental
Measures ($000)
Annual Net Power
Benefits ($000)
No-Action Alternative (baseline)
427 18,000 12,800 0 5,200
Applicant’s Proposal 417 17,761 12,800 120 4,841
FERC Staff’s Proposal
414 17,664 12,800 138 4,726
Source: FERC, North Georgia Hydroelectric Project, FEIS-0098, June 1996, p. 5-9 to 5-11.
FACTORS NOT EXPLICITLY INCORPORATED IN ANNUAL NET BENEFIT ESTIMATES
Although the benefits of avoided pollution, project services, and environmental measures are factored into FERC’s relicensing decisions, they are rarely incorporated directly into estimates of annual net benefits. We describe FERC’s current approach to evaluating these components below.
Annual Benefits Of Avoided Pollution
FERC quantifies avoided pollution benefits, but they are not included in annual net benefit calculations. To quantify the avoided air pollution values of the existing hydropower project, FERC estimates the tons of several air pollutants, such as sulfur and nitrogen oxides, that would be emitted if the project’s power were generated by an alternative source. To estimate the avoided pollution benefits of the existing project, FERC calculates the cost of preventing these emissions at the alternative source. In other words, the value of avoided pollution is equal to the cost of pollution control.
L In Chapter 4, we discuss why FERC’s “cost of control” approach is problematic. We recommend that the economic analysis estimate the avoided health and environmental impacts of pollution “externalities” --
3-16

the cost to society of the pollution not currently controlled at the replacement generation source.
As noted above, FERC determined that coal-fired plants are the most likely thermal alternative for the power generated by the existing North Georgia hydroelectric project. Therefore, a one GWh reduction in hydroelectric power will result in a one GWh increase in coal-fired plant generation.25 FERC only estimates dollar costs for controlling sulfur and nitrogen oxide emissions in its analysis of the North Georgia project. Through a separate analysis, FERC has determined that a coal-fired steam plant’s pollution control costs are about $475 per ton of sulfur oxides and $230 per ton of nitrogen oxides.26 Exhibit 3-8 shows the removal costs of these pollutants for various proposed minimum flow alternatives at the North Georgia project. These dollar estimates are not incorporated in the annual net benefits of North Georgia’s relicensing alternatives. The reason for this omission is unclear. However, as we note in Chapter 4, FERC’s current approach to valuing avoided pollution benefits is flawed. Unless the method is corrected, these benefits are best left out of the net benefit calculation.
Exhibit 3-8
REMOVAL COSTS OF SULFUR AND NITROGEN OXIDES FOR MINIMUM FLOW ALTERNATIVES AT THE NORTH GEORGIA PROJECT
Annual Replacement
Pollutants Generated (tons/year)
Annual Removal Cost ($)
Minimum Flow Alternatives
Generation Needed (GWh)
Sulfur Oxides
Nitrogen Oxides
Sulfur Oxides (95%
removed)
Nitrogen Oxides (60%
removed) Total Cost
10 cfs year-round at Mathis-Terrora
0.6 2.4 $2,500 $600 $3,100
35 cfs year-round at Tallulah Falls
6.7 25.1 $25,800 $5,800 $31,600
500 and 700 cfs various weekends for whitewater boating
1.8 6.9 $7,200 $1,600 $8,800
Source: FERC, North Georgia Hydroelectric Project, FEIS-0098, June 1996, p. 5-9.
5.2
54.4
15.1
25 FERC notes that it takes 420 tons of pulverized, one-percent sulfur bituminous coal from a coal-fired steam plant to generate one GWh of power. Generation of this power would produce about: 8.18 tons of sulfur oxides, 3.78 tons of nitrogen oxides, 0.19 tons of carbon monoxide, 965.2 tons of carbon dioxide, and 25.08 tons of particulates. FERC, FEIS-0098, June 1996, op cit., p. 4-61.
26 These estimates are based on “state-of-the-art” pollution control equipment capable of removing 95 percent of sulfur oxides and 60 percent of nitrogen oxides. The cost estimates are for plants without any current pollution removal capabilities, which FERC acknowledges may not be the case for some of Georgia Power’s existing coal-fired plants. FERC, FEIS-0098, June 1996, op cit., p. 5-8.
3-17
Annual Benefits Of Project Services
Hydroelectric projects provide services beyond power generation, such as flood control, water supply, irrigation, and river navigability. FERC does not generally undertake a formal assessment of the value of these services. In part, this analysis may not be conducted because the majority of proposed relicensing alternatives would not change a project’s services in any significant way. For instance, a small change in required minimum flows is unlikely to affect a project’s flood control services. Therefore, analysis of these services would not help FERC decide among competing alternatives.
If dam removal is evaluated, however, an assessment of project services appears necessary. Such an analysis would tend to increase the benefits of other options relative to dam removal. Nonetheless, in cases where FERC has considered dam removal, its analysis of project services has typically been qualitative. For instance, FERC notes that removal of one or more of the North Georgia project developments on the Tallulah River would result in lost flood control benefits and lost reservoir water withdrawal benefits, but no effort is made to quantify these benefits.
L In Chapter 5, we discuss methodologies relevant for valuing the benefits of project services such as water supply and flood control.
Annual Benefits Of Environmental Measures
FERC examines how different relicensing alternatives may affect the environment. Among other potential impacts, FERC considers geology and soils, water quality and quantity, fisheries resources, terrestrial resources, threatened and endangered species, aesthetic resources, cultural resources, recreation, land use, and socioeconomic effects. While FERC characterizes an alternative’s biological and physical effects, FERC rarely applies economic valuation methods to translate these effects into terms that can be incorporated into the net benefit calculation.
It appears that FERC only attempts to evaluate the benefits of environmental measures when their costs represent more than ten percent of annual power benefits. This policy was put forth in a directive to the staff of Office of Hydropower Licensing (OHL) issued in 1995 by the OHL’s Director and General Counsel.
As a rough, internal-only practical guideline, Section 10(j) conditions should be subjected to a cost-benefit analysis where the cost of the condition exceeds 10 percent of the project’s power benefits. In such instances, staff should weigh the cost of the condition (i.e., what negative impact it will have on the project) against its benefits (what positive impact it would have on the affected
3-18

natural resources)…. Like any other guideline, this one should not be slavishly applied; a rule of reason governs, and the circumstances of each case must be considered.27
Under this guidance, FERC applies a diverse set of analyses to characterize the non-power benefits of different alternatives. To illustrate, some of FERC’s more typical techniques for assessing impacts to aquatic resources, recreation, and socioeconomic resources are described below.
L In Chapter 4, we discuss why the economic analysis should quantify the value of environmental measures so that benefits can be weighed against costs. This valuation should be performed regardless of whether costs are greater than ten percent of the project’s power benefits. Otherwise, FERC may reject measures with net benefits, or include measures with net costs.
Aquatic Resources
Applicants often work with resource agencies to model the effect of different relicensing conditions on fishery habitats and populations. For example, Georgia Power and fish and wildlife agencies developed a model to analyze the benefits to fishery resources of increased streamflows at the North Georgia project’s Tallulah Falls dam.28 Their study suggested that incremental changes in streamflows in Tallulah Gorge would change the amount of usable fish habitat and the survival rates for various age classes of fish species. Based on the results of this study, and an analysis of other factors affected by the release of flows (e.g., aesthetic values of the waterfall), FERC staff decided to recommend an increase in the minimum flow to 35 cfs.
Recreation
FERC assesses the potential impacts of relicensing alternatives on a variety of recreational activities, including fishing, rafting, motorboating, picnicking, and swimming. This assessment may be based on a survey of recreational activity in the project area (e.g., number of visitors participating in different types of activity) or rely on more general observations of recreational activity. Using this information, FERC typically draws qualitative conclusions about how recreational activity might be affected under different alternatives.
To illustrate, consider the analysis of recreation undertaken for the Condit project.29 The applicant (Pacificorp) conducted a survey of recreational users of the Condit project area (see
27 Susan Tomacky (General Counsel) and Fred Springer (Director, Office of Hydropower Licensing), “Determinations Under Section 10(j) of the Federal Power Act,” Memorandum to staff of the OHL and Office of the General Counsel, Hydropower Licensing, 1995.
28 FERC, FEIS-0098, June 1996, op cit., p. 4-11.
29 FERC, Final Environmental Impact Statement, Condit Hydroelectric Project, FEIS-0103, October 1996, p. 3-49 to 3-50.
3-19

Exhibit 3-9). It is noteworthy that this study focuses on existing recreational activity rather than the change in recreational activity that might occur under different environmental improvement scenarios.
Exhibit 3-9
RECREATION PARTICIPATION IN THE CONDIT PROJECT AREA
Recreational Activity % Participation* Rafting the river 49 Fishing 33 Picnicking 24 Motorboating 11 Swimming 7 Hiking 7 Wildlife viewing 5 Nature study 3 Kayaking 3 * Numbers do not total 100 percent because individuals could participate in more than one activity. Source: S. Allen, Condit recreation use study, Pacific Power and Light Company, 1990, as cited in FERC, Condit Hydroelectric Project, October 1996, p. 3-50.
As is common in FERC’s approach to assessing recreational impacts, FERC does not use this information on Condit’s recreational activity to develop economic value estimates. Rather, FERC draws the following qualitative conclusions about how different relicensing alternatives would affect recreational activity:
The applicant’s proposal offers modest benefits to recreation resources (boating and cabins) in the area compared to the no-action alternative. The dam removal alternatives would offer significant benefits from additional whitewater recreation opportunities, but long-term adverse impacts to existing flatwater recreation use, overall. The dam retention alternatives offer the greatest variety of recreational opportunities for the next 30 to 50 years….30
Socioeconomic Resources
FERC’s analysis of socioeconomic resources usually focuses on how relicensing alternatives might affect the region’s economy and employment. For instance, an alternative might increase the cost of power, which in turn could affect the viability of local industries. To illustrate the possible socioeconomic effects of such an alternative, consider FERC’s analysis of the Ripogenus and Penobscot Mills projects in Maine.31 In relicensing proceedings, the
30 FERC, FEIS-0103, October 1996, op cit., p. 5-14.
31 FERC, Final Environmental Impact Statement, Upper Penobscot River Basin, Maine, FEIS-0075, September 1996, p. 5-12 to 5-15.
3-20
applicant (Great Northern Paper, Inc.) claimed that changes in streamflows would add incremental costs to its production of pulp and paper products that might threaten the viability of some of its mills. FERC largely agreed with the applicant’s analysis, concluding that increased power costs could have significant repercussions for the Maine economy.32
We [FERC] agree with GNP [Great Northern Paper] that the Millinocket and East Millinocket paper mills are high cost producers in a highly competitive market. We concur that environmental enhancement alternatives that would add significant replacement power costs could adversely affect the economics of the least competitive paper production processes at Millinocket and East Millinocket Mills, resulting in production cutbacks. …Environmental enhancement alternatives that cause production cutbacks at Millinocket would affect both GNP and the regional economy. GNP estimates that curtailing production at the coater complex would eliminate 238 jobs at Millinocket, reduce purchases of goods and services from Maine businesses by $20 million annually, and jeopardize the company’s plans to invest $550 million in lightweight coated paper production at Millinocket (its least profitable production units) by 1997. Because GNP’s data about corporate economic status is proprietary, we could not verify GNP’s estimates of the economic effects of production cutbacks; however, our assessment of the paper production industry confirms GNP’s contention that its present costs are high and that further cost increases could reduce the company’s competitiveness. Multiplier effects from GNP job cutbacks and reduced expenditures for goods and services could result in the total loss of as many as 621 jobs and $15.0 million in annual wages in the Maine economy. GNP’s failure to invest could represent a significant lost opportunity to the region in terms of job and income growth.33
Conclusion
Overall, FERC uses a variety of approaches to characterize the benefits of environmental improvements under different relicensing alternatives. However, the current approaches generally do not quantify the economic value of these benefits in a way that allows FERC to integrate them directly into net benefit calculations. Much of this report focuses on analytic techniques available for estimating the value that society places on improvements in environmental quality and resource uses that environmental improvements enable. Such methods may ultimately allow these values to play a greater role in net benefit calculations and thereby improve relicensing decisions.
32 See Appendix A for a discussion of regional economic modeling and its role in relicensing.
33 FERC, Final Environmental Impact Statement, Upper Penobscot River Basin, Maine, FEIS-0075, September 1996, p. 5-14.
3-21