the fiscal implications for kazakhstan of worldwide
TRANSCRIPT
The fiscal implications for Kazakhstan of worldwide transition to a greener global economy – Technical annex | 1
The fiscal implications for Kazakhstan of worldwide transition to a greener
global economy
Technical annex

The fiscal implications for Kazakhstan of worldwide transition to a greener global economy – Technical annex | 2
The fiscal implications for Kazakhstan of worldwide transition to a greener global economy – Technical annex | 3
ABSTRACT
Fulfilling the energy and climate change commitments embodied in the UN’s Sustainable Development Goals and the Paris Agreement will require a worldwide shift from fossil fuels to low-carbon energy.
With a focus on the oil and gas sectors, this paper analyses the fiscal risks that a global transition of this kind could pose for Kazakhstan, a country where oil accounts for roughly 50 per cent of exports and is a major source of government revenue.
In the period to 2040, a scenario in which there is worldwide adoption of greener energy practices in line with the SDGs and the Paris Agreement (transition to a “green” global economy) could lead to an overall drop of around 40 per cent in Kazakhstan’s fiscal revenues, relative to a “business as usual” scenario. This “green” transition could also lead to unsustainable levels of debt and potentially to depletion of the country’s national savings from oil within the next decade. This could occur despite a rapid increase in oil production through the Kashagan and Tengiz oil fields and their relatively low marginal costs of extraction. The most significant fiscal impacts of a transition to a greener global economy are projected to occur in
the 2030s, suggesting that there is a window of opportunity in which Kazakhstan could take action to address these impacts.
A number of policy responses could offset the negative fiscal impacts and all of them build on the government’s current priorities. These responses are (i) structural transformation of Kazakhstan’s economy to manage exposure to oil-price shocks, as set out in the country’s development strategies for the periods to 2025 and 2050; (ii) effective management of oil revenues, building on recent announcements about limiting transfers from the National Fund of the Republic of Kazakhstan; (iii) fiscal consolidation to reduce the non-oil fiscal deficit to sustainable levels in the medium term; and (iv) the enhancement of medium and long-term fiscal planning. These four policy responses are prudent, given that they make sense in all three scenarios modelled in this paper for future states of the global oil and gas markets. Furthermore, they would build fiscal resilience to lower oil prices even lower than those that have been modelled here – which is important as the precise evolution of future global oil and gas markets is beset with uncertainty.

The fiscal implications for Kazakhstan of worldwide transition to a greener global economy – Technical annex | 4
CONTENTS
A.1.1. Methodological overview 5
Analytical principles 5
Overview 5
A.1.2. Constructing scenarios 6
Data sources 6
Oil prices 7
Gas prices 7
A.1.3. Sector selection 8
Data sources 8
First-gate selection criteria 9
Second-gate selection criteria 10
A.1.4. Sector modelling 10
Data sources 10
Oil sector 11
Gas sector 11
A.1.5. Apportioning between consumers and producers 11
Data sources 11
Quantifying the consumer impact 12
Modelling procedure 12
A.1.6. Apportioning between government and private sector 14
Data sources 14
Process overview 14
Forecasting government revenue 15
A.1.7. Determining the impact on the national budget 16
Data sources 16
Process overview 16
Projection of real GDP in Kazakhstan 16
Projection of gross government debt (including revenue and expenditure) 17
Marginal asset accumulation 18
Effective interest rate on borrowing 18
Reissued debt and the weighted average interest rate 18
The fiscal implications for Kazakhstan of worldwide transition to a greener global economy – Technical annex | 5
A.1.1. METHODOLOGICAL OVERVIEW
Analytical principles
The development of the analytical approach adopted in this study was underpinned by the following principles.
• The approach should be sufficiently clear and simple, particularly with regard to the level of data required, that it can feasibly be implemented for any economy where the EBRD invests.
• The methodology should be tailored to the material fiscal impacts of worldwide transition to a lower-carbon global economy
• Simplicity is a key objective, but the approach should also be sufficiently detailed that it is reflects fiscal realities and can be used to generate meaningful policy recommendations.
These principles reflect the need to adopt an analytical approach that adequately accounts for the most crucial issues and is also sufficiently logical and transparent.
Overview
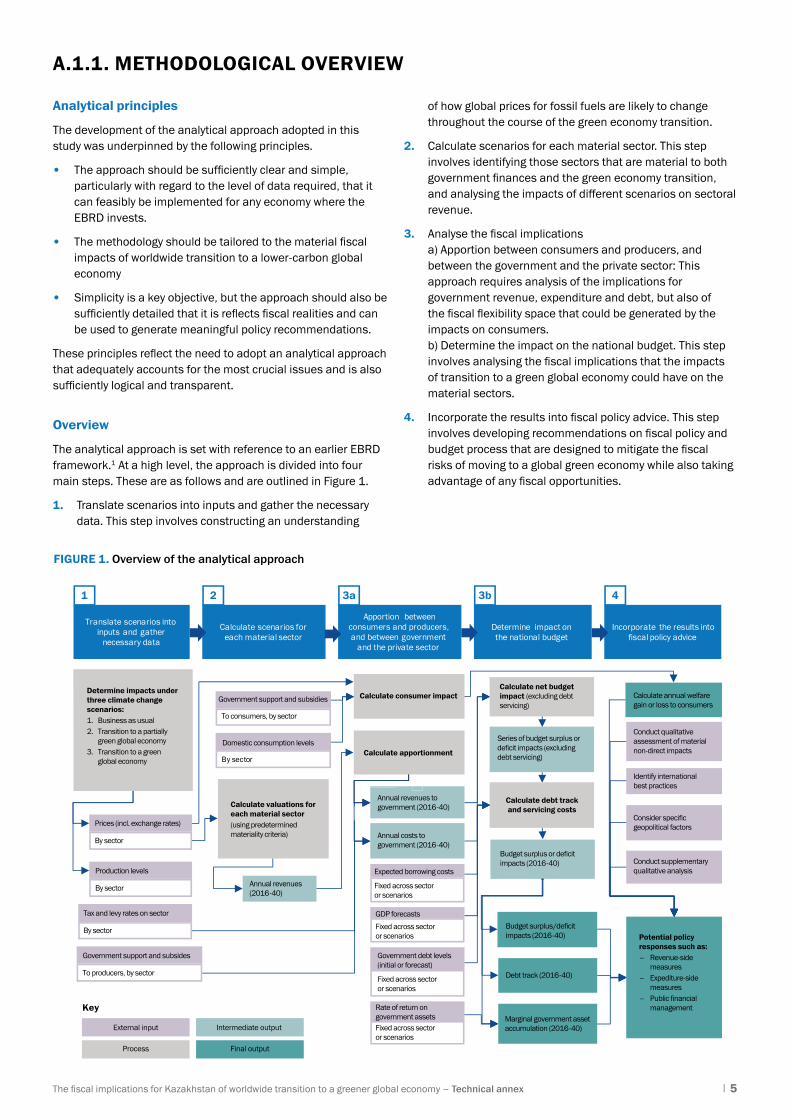
The analytical approach is set with reference to an earlier EBRD framework.1 At a high level, the approach is divided into four main steps. These are as follows and are outlined in Figure 1.
1. Translate scenarios into inputs and gather the necessary data. This step involves constructing an understanding
of how global prices for fossil fuels are likely to change throughout the course of the green economy transition.
2. Calculate scenarios for each material sector. This step involves identifying those sectors that are material to both government finances and the green economy transition, and analysing the impacts of different scenarios on sectoral revenue.
3. Analyse the fiscal implications a) Apportion between consumers and producers, and between the government and the private sector: This approach requires analysis of the implications for government revenue, expenditure and debt, but also of the fiscal flexibility space that could be generated by the impacts on consumers. b) Determine the impact on the national budget. This step involves analysing the fiscal implications that the impacts of transition to a green global economy could have on the material sectors.
4. Incorporate the results into fiscal policy advice. This step involves developing recommendations on fiscal policy and budget process that are designed to mitigate the fiscal risks of moving to a global green economy while also taking advantage of any fiscal opportunities.
FIGURE 1. Overview of the analytical approach
Determine impact on the national budget
Apportion between consumers and producers, and between government
and the private sector
Calculate scenarios for each material sector
Translate scenarios into inputs and gather
necessary data
Calculate apportionment
Incorporate the results into fiscal policy advice
Calculate consumer impact
By sector
1 2 3a 3b 4
External input
Process
Intermediate output
Final output
Key
Determine impacts under three climate change scenarios:1. Business as usual2. Transition to a partially green global economy3. Transition to a green global economy
Potential policy responses such as:– Revenue-side measures– Expediture-side measures– Public financial management
Calculate valuations foreach material sector(using predetermined materiality criteria)
Calculate net budget impact (excluding debt servicing)
Calculate debt trackand servicing costs
Government support and subsidies
Prices (incl. exchange rates)
By sector
Production levels
By sector
Expected borrowing costs
Fixed across sector or scenarios
GDP forecasts
Fixed across sector or scenarios
Government debt levels(initial or forecast)
Fixed across sector or scenarios
Rate of return ongovernment assetsFixed across sector or scenarios
Tax and levy rates on sector
By sector
Annual revenues(2016-40)
Annual revenues to government (2016-40)
Budget surplus or deficitimpacts (2016-40)
Budget surplus/deficitimpacts (2016-40)
Marginal government asset accumulation (2016-40)
Debt track (2016-40)
Series of budget surplus or deficit impacts (excluding debt servicing)
Calculate annual welfare gain or loss to consumers
Conduct qualitative assessment of material non-direct impacts
Identify international best practices
Consider specific geopolitical factors
Conduct supplementary qualitative analysis
Annual costs to government (2016-40)
Government support and subsides
To producers, by sector
Domestic consumption levels
To consumers, by sector
The fiscal implications for Kazakhstan of worldwide transition to a greener global economy – Technical annex | 6
A.1.2. CONSTRUCTING SCENARIOS
Data sources
TABLE 1. Data sources used to construct alternative scenarios
TABLE 2. Advantages and disadvantages of the scenario construction methodology
Data point Data unit Time series Sector Purpose Source(s)
Global oil price US$ 2016-40 Oil To model revenue from the oil and gas sectors over the period 2016-40
International Energy Agency’s World Energy Outlook (2017)Global gas price US$ 2016-40 Gas
Global oil price US$ 2016-22 Oil IMF World Economic Outlook DatabaseUS$ GDP deflator N/A 2016-22 N/A
Area Advantages Disadvantages
Methodology Uses short-term market expectations.
Uses long-term price expectations taken from the IEA’s price projections.
Avoids simple extrapolation of short-term market expectations over the long-term.
May not take full account of demand and supply dynamics present in the IEA’s model.
Consistency with datasets used elsewhere in the model
Achieves short-term consistency with baseline IMF projections by using IMF projections of global oil prices.
May not be consistent with baseline IMF projections in the long term.
Familiarity Long-term (from 2030 onwards) price projections are consistent with the IEA’s scenarios.
High annual growth rates in the period 2023-30 may not be considered realistic.
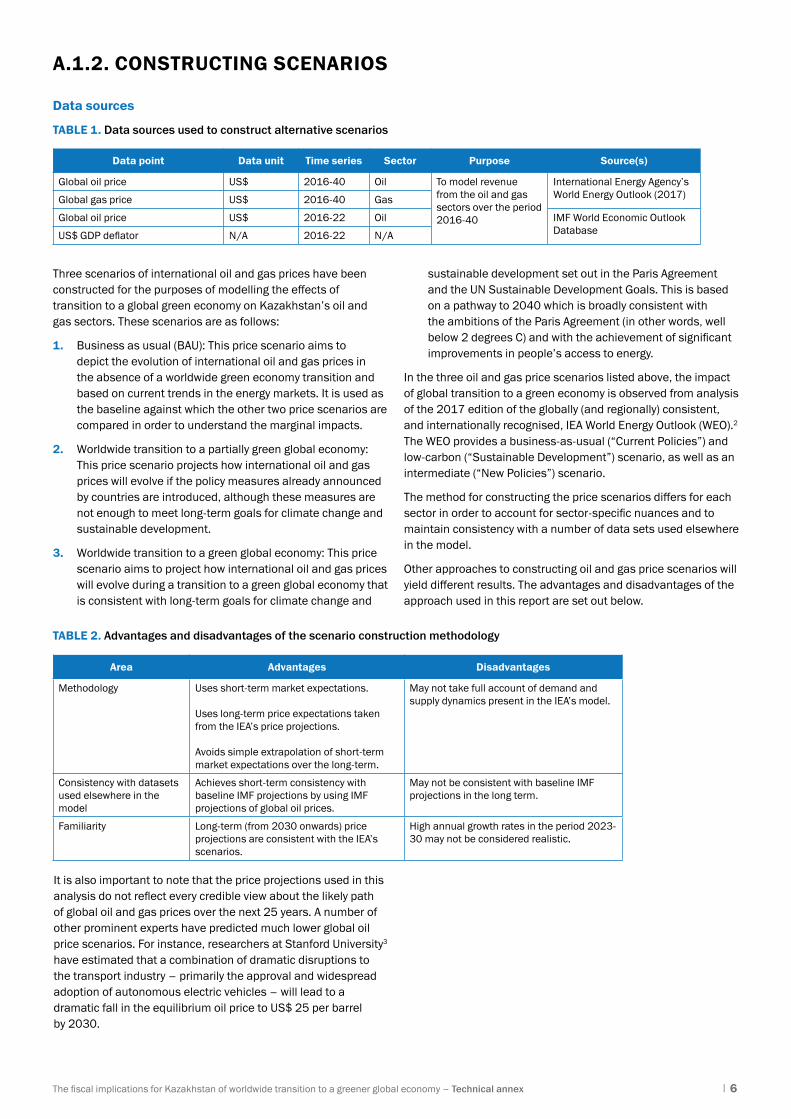
Three scenarios of international oil and gas prices have been constructed for the purposes of modelling the effects of transition to a global green economy on Kazakhstan’s oil and gas sectors. These scenarios are as follows:
1. Business as usual (BAU): This price scenario aims to depict the evolution of international oil and gas prices in the absence of a worldwide green economy transition and based on current trends in the energy markets. It is used as the baseline against which the other two price scenarios are compared in order to understand the marginal impacts.
2. Worldwide transition to a partially green global economy: This price scenario projects how international oil and gas prices will evolve if the policy measures already announced by countries are introduced, although these measures are not enough to meet long-term goals for climate change and sustainable development.
3. Worldwide transition to a green global economy: This price scenario aims to project how international oil and gas prices will evolve during a transition to a green global economy that is consistent with long-term goals for climate change and
sustainable development set out in the Paris Agreement and the UN Sustainable Development Goals. This is based on a pathway to 2040 which is broadly consistent with the ambitions of the Paris Agreement (in other words, well below 2 degrees C) and with the achievement of significant improvements in people’s access to energy.
In the three oil and gas price scenarios listed above, the impact of global transition to a green economy is observed from analysis of the 2017 edition of the globally (and regionally) consistent, and internationally recognised, IEA World Energy Outlook (WEO).2 The WEO provides a business-as-usual (“Current Policies”) and low-carbon (“Sustainable Development”) scenario, as well as an intermediate (“New Policies”) scenario.
The method for constructing the price scenarios differs for each sector in order to account for sector-specific nuances and to maintain consistency with a number of data sets used elsewhere in the model.
Other approaches to constructing oil and gas price scenarios will yield different results. The advantages and disadvantages of the approach used in this report are set out below.
It is also important to note that the price projections used in this analysis do not reflect every credible view about the likely path of global oil and gas prices over the next 25 years. A number of other prominent experts have predicted much lower global oil price scenarios. For instance, researchers at Stanford University3
have estimated that a combination of dramatic disruptions to the transport industry – primarily the approval and widespread adoption of autonomous electric vehicles – will lead to a dramatic fall in the equilibrium oil price to US$ 25 per barrel by 2030.
The fiscal implications for Kazakhstan of worldwide transition to a greener global economy – Technical annex | 7
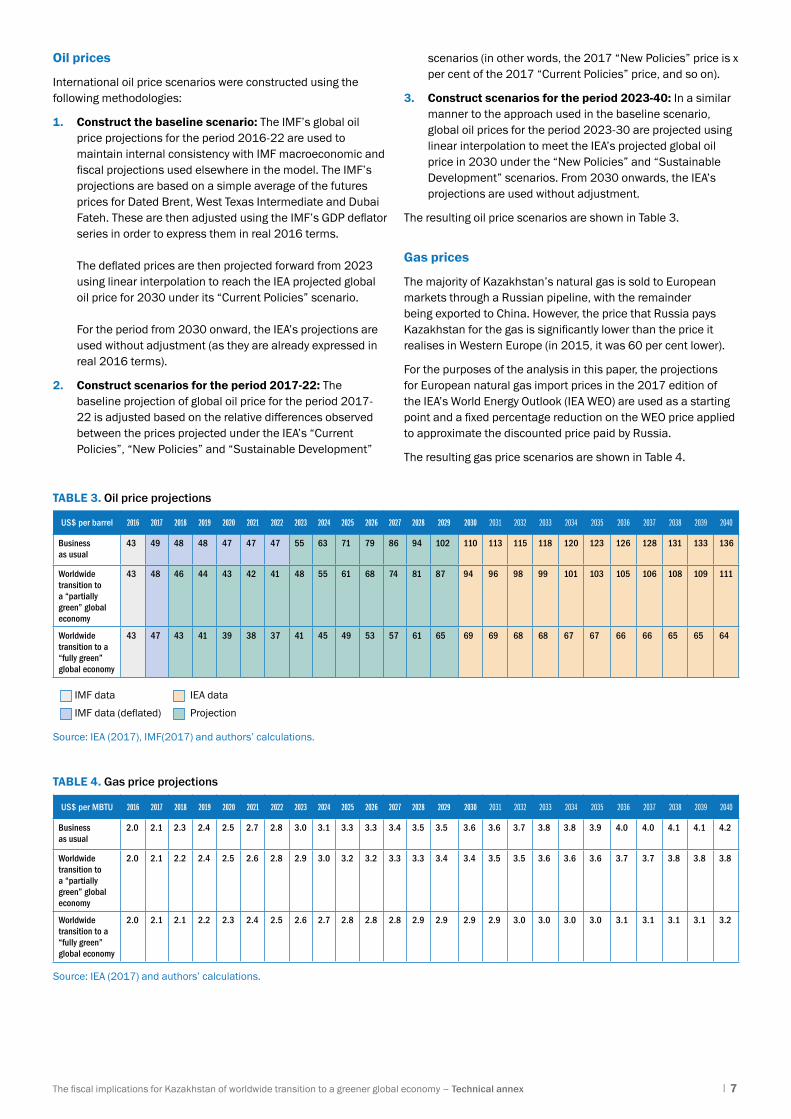
Oil prices
International oil price scenarios were constructed using the following methodologies:
1. Construct the baseline scenario: The IMF’s global oil price projections for the period 2016-22 are used to maintain internal consistency with IMF macroeconomic and fiscal projections used elsewhere in the model. The IMF’s projections are based on a simple average of the futures prices for Dated Brent, West Texas Intermediate and Dubai Fateh. These are then adjusted using the IMF’s GDP deflator series in order to express them in real 2016 terms. The deflated prices are then projected forward from 2023 using linear interpolation to reach the IEA projected global oil price for 2030 under its “Current Policies” scenario. For the period from 2030 onward, the IEA’s projections are used without adjustment (as they are already expressed in real 2016 terms).
2. Construct scenarios for the period 2017-22: The baseline projection of global oil price for the period 2017-22 is adjusted based on the relative differences observed between the prices projected under the IEA’s “Current Policies”, “New Policies” and “Sustainable Development”
scenarios (in other words, the 2017 “New Policies” price is x per cent of the 2017 “Current Policies” price, and so on).
3. Construct scenarios for the period 2023-40: In a similar manner to the approach used in the baseline scenario, global oil prices for the period 2023-30 are projected using linear interpolation to meet the IEA’s projected global oil price in 2030 under the “New Policies” and “Sustainable Development” scenarios. From 2030 onwards, the IEA’s projections are used without adjustment.
The resulting oil price scenarios are shown in Table 3.
Gas prices
The majority of Kazakhstan’s natural gas is sold to European markets through a Russian pipeline, with the remainder being exported to China. However, the price that Russia pays Kazakhstan for the gas is significantly lower than the price it realises in Western Europe (in 2015, it was 60 per cent lower).
For the purposes of the analysis in this paper, the projections for European natural gas import prices in the 2017 edition of the IEA’s World Energy Outlook (IEA WEO) are used as a starting point and a fixed percentage reduction on the WEO price applied to approximate the discounted price paid by Russia.
The resulting gas price scenarios are shown in Table 4.
US$ per barrel 2016 2017 2018 2019 2020 2021 2022 2023 2024 2025 2026 2027 2028 2029 2030 2031 2032 2033 2034 2035 2036 2037 2038 2039 2040
Business as usual
43 49 48 48 47 47 47 55 63 71 79 86 94 102 110 113 115 118 120 123 126 128 131 133 136
Worldwide transition to a “partially green” global economy
43 48 46 44 43 42 41 48 55 61 68 74 81 87 94 96 98 99 101 103 105 106 108 109 111
Worldwide transition to a “fully green” global economy
43 47 43 41 39 38 37 41 45 49 53 57 61 65 69 69 68 68 67 67 66 66 65 65 64
US$ per MBTU 2016 2017 2018 2019 2020 2021 2022 2023 2024 2025 2026 2027 2028 2029 2030 2031 2032 2033 2034 2035 2036 2037 2038 2039 2040
Business as usual
2.0 2.1 2.3 2.4 2.5 2.7 2.8 3.0 3.1 3.3 3.3 3.4 3.5 3.5 3.6 3.6 3.7 3.8 3.8 3.9 4.0 4.0 4.1 4.1 4.2
Worldwide transition to a “partially green” global economy
2.0 2.1 2.2 2.4 2.5 2.6 2.8 2.9 3.0 3.2 3.2 3.3 3.3 3.4 3.4 3.5 3.5 3.6 3.6 3.6 3.7 3.7 3.8 3.8 3.8
Worldwide transition to a “fully green” global economy
2.0 2.1 2.1 2.2 2.3 2.4 2.5 2.6 2.7 2.8 2.8 2.8 2.9 2.9 2.9 2.9 3.0 3.0 3.0 3.0 3.1 3.1 3.1 3.1 3.2
TABLE 3. Oil price projections
TABLE 4. Gas price projections
IMF data IEA data
IMF data (deflated) Projection
Source: IEA (2017) and authors’ calculations.
Source: IEA (2017), IMF(2017) and authors’ calculations.
The fiscal implications for Kazakhstan of worldwide transition to a greener global economy – Technical annex | 8
A.1.3. SECTOR SELECTION
Data sources
TABLE 5. Data sources used in sector selection
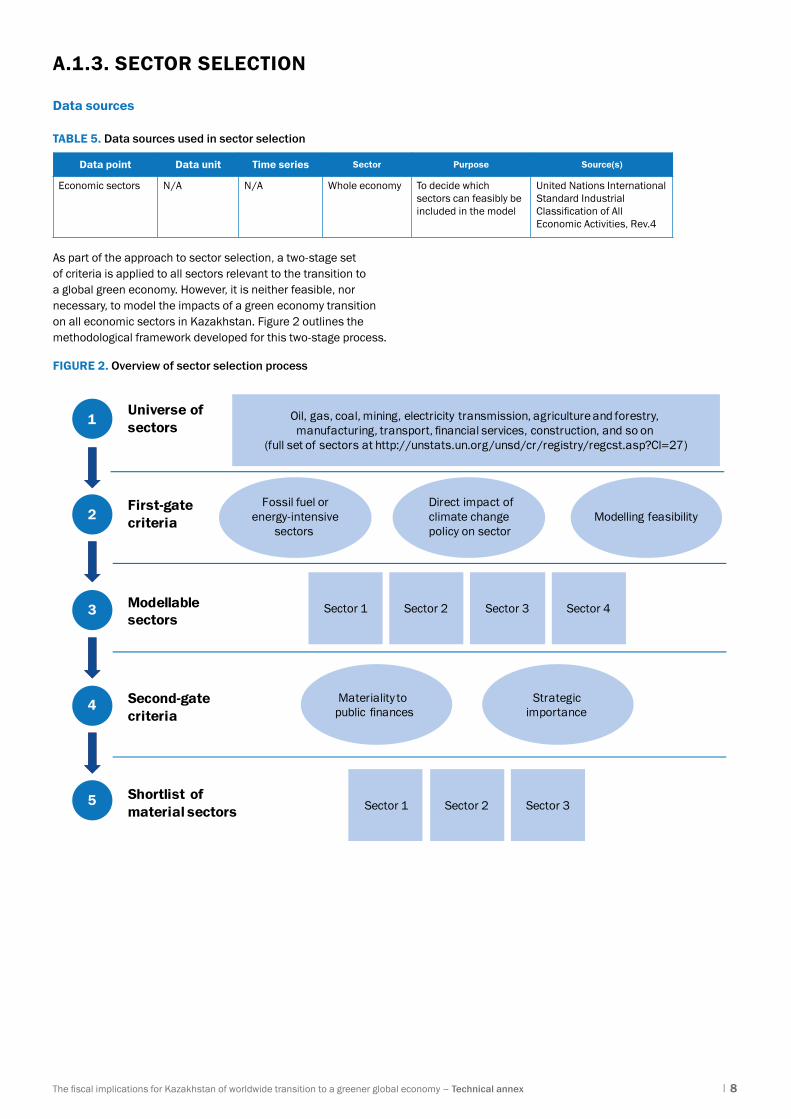
FIGURE 2. Overview of sector selection process
Data point Data unit Time series Sector Purpose Source(s)
Economic sectors N/A N/A Whole economy To decide which sectors can feasibly be included in the model
United Nations International Standard Industrial Classification of All Economic Activities, Rev.4
As part of the approach to sector selection, a two-stage set of criteria is applied to all sectors relevant to the transition to a global green economy. However, it is neither feasible, nor necessary, to model the impacts of a green economy transition on all economic sectors in Kazakhstan. Figure 2 outlines the methodological framework developed for this two-stage process.
1
3
4
5
2
Oil, gas, coal, mining, electricity transmission, agriculture and forestry, manufacturing, transport, financial services, construction, and so on
(full set of sectors at http://unstats.un.org/unsd/cr/registry/regcst.asp?Cl=27)
Fossil fuel orenergy-intensive
sectors Modelling feasibility
Direct impact ofclimate changepolicy on sector
Sector 1 Sector 2 Sector 3 Sector 4
Strategic importance
Materiality to public finances
Sector 1 Sector 2 Sector 3
Universe of sectors
First-gate criteria
Modellablesectors
Second-gate criteria
Shortlist of material sectors
The fiscal implications for Kazakhstan of worldwide transition to a greener global economy – Technical annex | 9
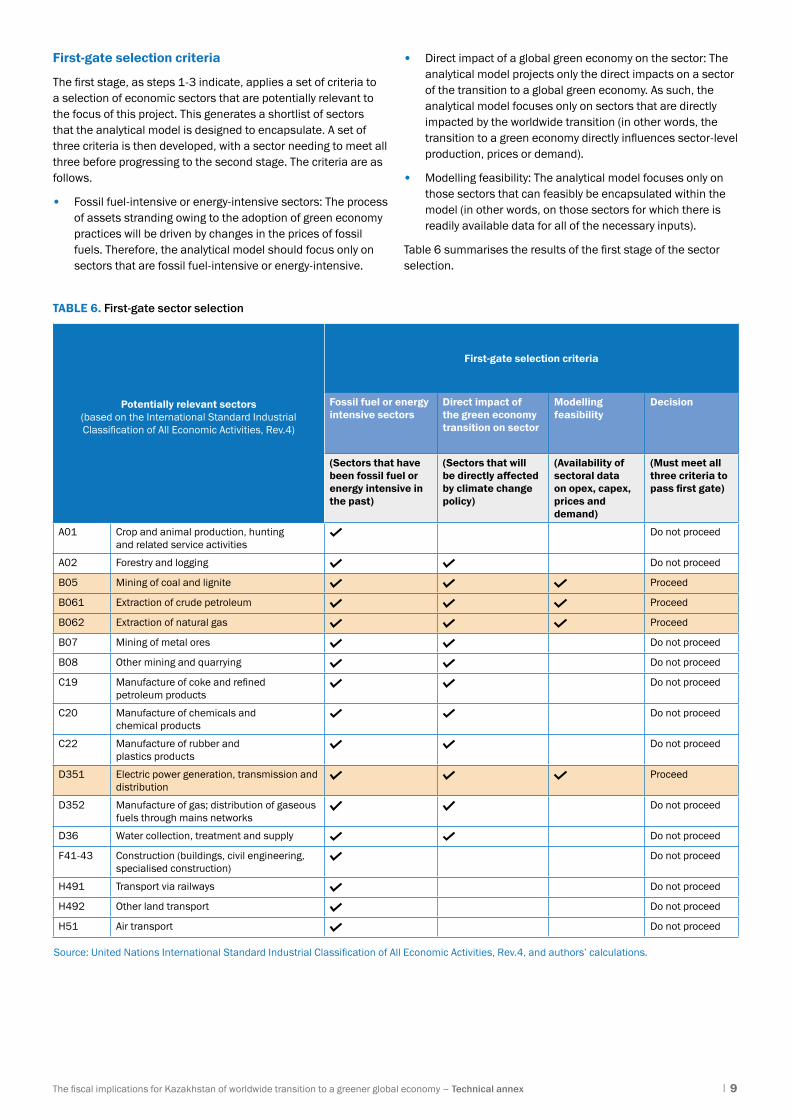
First-gate selection criteria
The first stage, as steps 1-3 indicate, applies a set of criteria to a selection of economic sectors that are potentially relevant to the focus of this project. This generates a shortlist of sectors that the analytical model is designed to encapsulate. A set of three criteria is then developed, with a sector needing to meet all three before progressing to the second stage. The criteria are as follows.
• Fossil fuel-intensive or energy-intensive sectors: The process of assets stranding owing to the adoption of green economy practices will be driven by changes in the prices of fossil fuels. Therefore, the analytical model should focus only on sectors that are fossil fuel-intensive or energy-intensive.
• Direct impact of a global green economy on the sector: The analytical model projects only the direct impacts on a sector of the transition to a global green economy. As such, the analytical model focuses only on sectors that are directly impacted by the worldwide transition (in other words, the transition to a green economy directly influences sector-level production, prices or demand).
• Modelling feasibility: The analytical model focuses only on those sectors that can feasibly be encapsulated within the model (in other words, on those sectors for which there is readily available data for all of the necessary inputs).
Table 6 summarises the results of the first stage of the sector selection.
TABLE 6. First-gate sector selection
Potentially relevant sectors(based on the International Standard Industrial Classification of All Economic Activities, Rev.4)
First-gate selection criteria
Fossil fuel or energy intensive sectors
Direct impact of the green economy transition on sector
Modelling feasibility
Decision
(Sectors that have been fossil fuel or energy intensive in the past)
(Sectors that will be directly affected by climate change policy)
(Availability of sectoral data on opex, capex, prices and demand)
(Must meet all three criteria to pass first gate)
A01 Crop and animal production, hunting and related service activities
Do not proceed
A02 Forestry and logging Do not proceed
B05 Mining of coal and lignite Proceed
B061 Extraction of crude petroleum Proceed
B062 Extraction of natural gas Proceed
B07 Mining of metal ores Do not proceed
B08 Other mining and quarrying Do not proceed
C19 Manufacture of coke and refined petroleum products
Do not proceed
C20 Manufacture of chemicals and chemical products
Do not proceed
C22 Manufacture of rubber and plastics products
Do not proceed
D351 Electric power generation, transmission and distribution
Proceed
D352 Manufacture of gas; distribution of gaseous fuels through mains networks
Do not proceed
D36 Water collection, treatment and supply Do not proceed
F41-43 Construction (buildings, civil engineering, specialised construction)
Do not proceed
H491 Transport via railways Do not proceed
H492 Other land transport Do not proceed
H51 Air transport Do not proceed
Source: United Nations International Standard Industrial Classification of All Economic Activities, Rev.4, and authors’ calculations.
The fiscal implications for Kazakhstan of worldwide transition to a greener global economy – Technical annex | 10
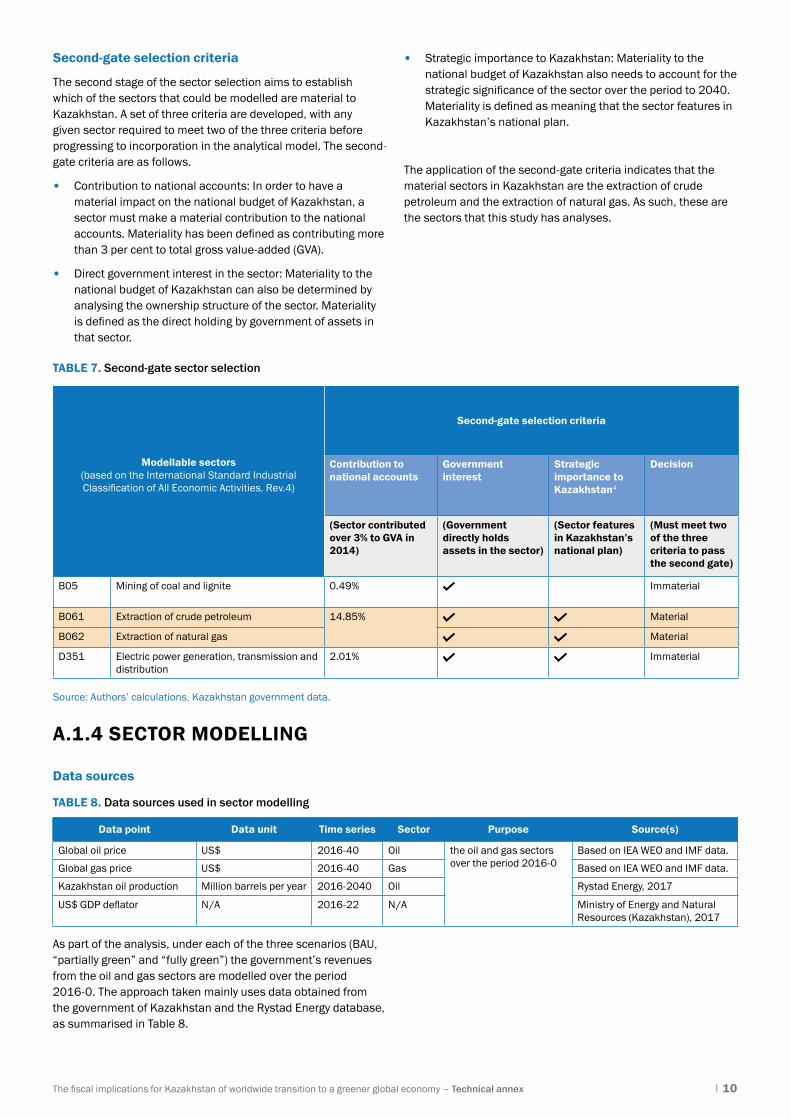
Second-gate selection criteria
The second stage of the sector selection aims to establish which of the sectors that could be modelled are material to Kazakhstan. A set of three criteria are developed, with any given sector required to meet two of the three criteria before progressing to incorporation in the analytical model. The second-gate criteria are as follows.
• Contribution to national accounts: In order to have a material impact on the national budget of Kazakhstan, a sector must make a material contribution to the national accounts. Materiality has been defined as contributing more than 3 per cent to total gross value-added (GVA).
• Direct government interest in the sector: Materiality to the national budget of Kazakhstan can also be determined by analysing the ownership structure of the sector. Materiality is defined as the direct holding by government of assets in that sector.
• Strategic importance to Kazakhstan: Materiality to the national budget of Kazakhstan also needs to account for the strategic significance of the sector over the period to 2040. Materiality is defined as meaning that the sector features in Kazakhstan’s national plan.
The application of the second-gate criteria indicates that the material sectors in Kazakhstan are the extraction of crude petroleum and the extraction of natural gas. As such, these are the sectors that this study has analyses.
Modellable sectors(based on the International Standard Industrial Classification of All Economic Activities, Rev.4)
Second-gate selection criteria
Contribution to national accounts
Government interest
Strategic importance to Kazakhstan4
Decision
(Sector contributed over 3% to GVA in 2014)
(Government directly holds assets in the sector)
(Sector features in Kazakhstan’s national plan)
(Must meet two of the three criteria to pass the second gate)
B05 Mining of coal and lignite 0.49% Immaterial
B061 Extraction of crude petroleum 14.85% Material
B062 Extraction of natural gas Material
D351 Electric power generation, transmission and distribution
2.01% Immaterial
Source: Authors’ calculations, Kazakhstan government data.
TABLE 7. Second-gate sector selection
TABLE 8. Data sources used in sector modelling
A.1.4 SECTOR MODELLING
Data sources
Data point Data unit Time series Sector Purpose Source(s)
Global oil price US$ 2016-40 Oil the oil and gas sectors over the period 2016-0
Based on IEA WEO and IMF data.
Global gas price US$ 2016-40 Gas Based on IEA WEO and IMF data.
Kazakhstan oil production Million barrels per year 2016-2040 Oil Rystad Energy, 2017
US$ GDP deflator N/A 2016-22 N/A Ministry of Energy and Natural Resources (Kazakhstan), 2017
As part of the analysis, under each of the three scenarios (BAU, “partially green” and “fully green”) the government’s revenues from the oil and gas sectors are modelled over the period 2016-0. The approach taken mainly uses data obtained from the government of Kazakhstan and the Rystad Energy database, as summarised in Table 8.

The fiscal implications for Kazakhstan of worldwide transition to a greener global economy – Technical annex | 11
Oil sector
A high-level top-down approach is adopted to estimate the Kazakhstan government’s revenue up to 2040, by estimating its share of the total revenue that the country’s oil sector generates each year. This total annual revenue is calculated by multiplying the total annual production by the international oil price for a given year. It is important to note that this approach does not take account of domestic prices. However, given that Kazakhstan exports the majority of its total production, ignoring domestic prices is a reasonable simplifying assumption. The main inputs to the model are global commodity prices and the country-specific production profile, which are used to estimate gross revenues for the sector.
The projection of the oil production profile for Kazakhstan is obtained from Rystad Energy, as the IEA WEO report only provides data at the regional level. It is important to note that this paper’s analysis maintains a constant production profile across all three scenarios, reflecting the fact that the government largely controls the level of output in the oil sector.
Gas sector
The gas production profile projection used in the analysis is obtained directly from the Kazakhstan government. Using historical Rystad data for the period 2006-15, this study determines an average breakdown in percentage terms for the volumes of gas that are sold and the volumes that are injected or flared. This ratio is applied throughout the projection period.
A.1.5. APPORTIONING BETWEEN CONSUMERS AND PRODUCERS
Data sources
TABLE 9. Data sources used in apportioning between consumers and producers
Data point Data unit Time series Sector Purpose Source(s)
Domestic gas prices US$ 2016-40 Gas To model the changes in consumer welfare in the oil and gas sectors in response to price changes.
Authors’ calculations
Domestic gas consumption MBTU 2016-40 Gas Rystad Energy (2017)
Domestic oil prices US$ 2016-40 Oil Government of Kazakhstan (2017)
Domestic oil prices US$ 2017-40 Oil EBRD calculations
Domestic oil consumption thousands of barrels per day
2015-26 Oil BMI Research (2017)
Domestic oil consumption thousands of barrels per day
2026-40 Oil Authors’ calculations
The impact on domestic consumers is isolated through the welfare implications of price changes that domestic consumers face. This section of the technical appendix outlines the economic theory behind this approach, and summarises the key modelling assumptions used to derive estimates for impacts in the oil and gas sectors.
The fiscal implications for Kazakhstan of worldwide transition to a greener global economy – Technical annex | 12
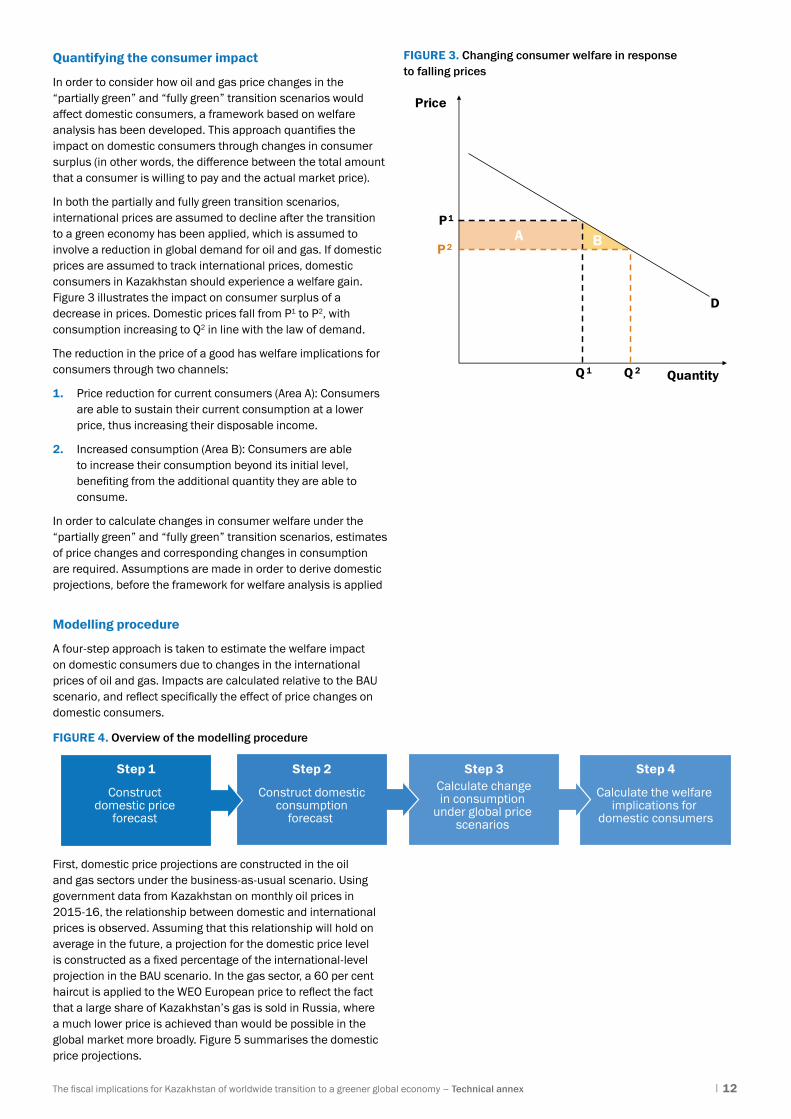
Quantifying the consumer impact
In order to consider how oil and gas price changes in the “partially green” and “fully green” transition scenarios would affect domestic consumers, a framework based on welfare analysis has been developed. This approach quantifies the impact on domestic consumers through changes in consumer surplus (in other words, the difference between the total amount that a consumer is willing to pay and the actual market price).
In both the partially and fully green transition scenarios, international prices are assumed to decline after the transition to a green economy has been applied, which is assumed to involve a reduction in global demand for oil and gas. If domestic prices are assumed to track international prices, domestic consumers in Kazakhstan should experience a welfare gain. Figure 3 illustrates the impact on consumer surplus of a decrease in prices. Domestic prices fall from P1 to P2, with consumption increasing to Q2 in line with the law of demand.
The reduction in the price of a good has welfare implications for consumers through two channels:
1. Price reduction for current consumers (Area A): Consumers are able to sustain their current consumption at a lower price, thus increasing their disposable income.
2. Increased consumption (Area B): Consumers are able to increase their consumption beyond its initial level, benefiting from the additional quantity they are able to consume.
In order to calculate changes in consumer welfare under the “partially green” and “fully green” transition scenarios, estimates of price changes and corresponding changes in consumption are required. Assumptions are made in order to derive domestic projections, before the framework for welfare analysis is applied
Modelling procedure
A four-step approach is taken to estimate the welfare impact on domestic consumers due to changes in the international prices of oil and gas. Impacts are calculated relative to the BAU scenario, and reflect specifically the effect of price changes on domestic consumers.
FIGURE 3. Changing consumer welfare in response to falling prices
FIGURE 4. Overview of the modelling procedure
BA
D
Price
Quantity
P 1
P 2
Q 2Q 1
Step 3 Step 4Calculate changein consumption
under global price scenarios
Calculate the welfare implications for
domestic consumers
Step 2
Construct domesticconsumption
forecast
Construct domestic price
forecast
Step 1
First, domestic price projections are constructed in the oil and gas sectors under the business-as-usual scenario. Using government data from Kazakhstan on monthly oil prices in 2015-16, the relationship between domestic and international prices is observed. Assuming that this relationship will hold on average in the future, a projection for the domestic price level is constructed as a fixed percentage of the international-level projection in the BAU scenario. In the gas sector, a 60 per cent haircut is applied to the WEO European price to reflect the fact that a large share of Kazakhstan’s gas is sold in Russia, where a much lower price is achieved than would be possible in the global market more broadly. Figure 5 summarises the domestic price projections.

The fiscal implications for Kazakhstan of worldwide transition to a greener global economy – Technical annex | 13
FIGURE 5. Domestic oil and gas price projections
FIGURE 6. Projections of domestic oil and gas consumption
Source: Kazakhstan government data, IEA WEO (2017) and authors’ calculations.
Source: Rystad Energy UCube, BMI (2017) and authors’ calculations .
0
20
40
60
80
100
120
140
2016
2018
2020
2022
2024
2026
2028
2030
2032
2034
2036
2038
2040
Pric
e (U
S$ p
er b
arre
l)
BAU – Oil price
BAU – Kazakhstan’s domestic oil price
0
2
4
6
8
10
12
2016
2018
2020
2022
2024
2026
2028
2030
2032
2034
2036
2038
2040
Pric
e (U
S$ p
er b
arre
l)
BAU – Gas priceBAU – Kazakhstan’s domestic oil price
200
250
300
350
400
450
2016
2018
2020
2022
2024
2026
2028
2030
2032
2034
2036
2038
2040
Oil
cons
umpt
ion
(in th
ousa
nds
of b
arre
ls p
er d
ay)
Partially green Current policies Green Partially green Current policies Green
02468
101214161820
2016
2018
2020
2022
2024
2026
2028
2030
2032
2034
2036
2038
2040
Gas
con
sum
ptio
n (b
cm)
For the scenarios of worldwide transition to a “partially green” or “fully green” global economy the domestic price level is assumed to track the international price level for oil and gas alike (in other words a 10 per cent fall in the international price is matched by a 10 per cent fall in the domestic price). In practice, this is most likely to represent the upper boundary of the reasonable range of domestic price responses. Accordingly, the impact on consumers should also be interpreted as an upper-boundary estimate. In 2040, domestic oil prices are expected to reach US$ 42 per barrel under the BAU scenario, compared to US$ 34 under the “partially green” transition scenario and US$ 20 under the “full green” transition scenario. Similarly, gas prices are expected to reach $4.20 per million British Thermal Units (MBTUs) under the BAU scenario, compared to US$ 3.84 under the “partially green” worldwide economy scenario and US$ 3.16 under the “fully green” worldwide economy scenario.
Second, in both sectors, projections of domestic consumption are constructed under the BAU scenario. In the oil sector, an external projection for the period to 2026, produced by BMI research, is extended to 2040 using a compounding average growth rate of 0.83 per cent, based on the average observed
between 2020 and 2026. In the gas sector, a direct projection of domestic consumption for the period to 2040 is provided by Rystad.
After constructing projections of domestic variables in the base case scenario, the relative change in consumption under the “partially green” and “fully green” transition scenarios is calculated using the following mechanism:
Percentage change in price x Price elasticity of demand = Percentage change in consumption
In each alternative scenario, the percentage change in price relative to the BAU price scenario is applied to the constructed projection of domestic prices in Kazakhstan. This value corresponds to P2 in Figure 3. Using the price elasticity of demand, which captures the responsiveness of demand to changes in price, the impact on final domestic consumption is calculated, corresponding to Q2 in Figure 3. Elasticity estimates for the oil and gas sector are been taken from academic literature. Figure 6 provides a summary of the resulting domestic consumption in each of the three scenarios.

The fiscal implications for Kazakhstan of worldwide transition to a greener global economy – Technical annex | 14
Lastly, having forecasted domestic consumption and prices under the various scenarios, the impact on consumer surplus is calculated for both sectors. This impact occurs through two channels, and is calculated as follows:
1. Price reduction for current consumers (Area A): Change in price x original quantity, which is equivalent to (P1-P2) x Q1
2. Increased consumption (Area B): Change in price x change in quantity, which is equivalent to (½) (P1-P2) x (Q2 - Q1).
A.1.6. APPORTIONING BETWEEN GOVERNMENT AND PRIVATE SECTOR
Data sources
TABLE 10. Data sources used in apportioning between government and private sector
Data point Data unit Time series Sector Purpose Source(s)
Average effective tax rate (AETR) for oil sector under the royalties and taxes regime
% AETR 2016-40 Oil To calculate the current total contribution of the oil sector to the national budget
Authors’ calculations using data from Rystad Energy (2017)
Average effective tax rate for oil sector under production-sharing agreement (PSA) regime
% AETR 2016-0 Oil Authors’ calculations
To calculate the current total contribution of the gas sector to the national budget
Average effective tax rate for gas sector under the royalties and taxes regime
% AETR 2016-40 Gas Authors’ calculations
Average effective tax rate for gas sector under PSA regime
% AETR 2016-40 Gas Authors’ calculations
Process overview
This is an essential intermediate step in determining how each scenario could affect the national budget. It recognises that various fiscal mechanisms will transmit sector-level impacts to national budgets. This step relies on developing an understanding of the structure of these transmission mechanisms under each of the three transition scenarios used in this analysis.
There are various complex transmission mechanisms that are specific to the extractive industry. It is therefore important to distinguish between the oil and gas sector, and alternative sectors that simply follow a straightforward tax structure. Revenues from the oil and gas sector flow through to the national budget via multiple different streams as Figure 8 illustrates. The modelling process is outlined in more detail below.
FIGURE 7. Flow of sector-level revenues to the national government
Other*
Direct subsidies
Production - sharing agreements
Royalties and taxes
National budget
Samruk - Kazyna
National Fund ofthe Republic of
Kazakhstan
Dividend distributions
Hydrocarbon revenues
Modelled Not modelled*”Other” includes proceeds of privatisation, dividends, loan repayments, finance costs and so on
Annual disbursement
The fiscal implications for Kazakhstan of worldwide transition to a greener global economy – Technical annex | 15
Forecasting government revenue
The initial step in this paper’s approach to translating sector-level outputs into budgetary impacts, involves addressing the complex nature of a production-sharing agreement (PSA). Currently, oil and gas fields in Kazakhstan either operate privately under a royalties and taxes regime, or form a PSA with the government. Those fields that run under a PSA – and among these, the main field is Kashagan – will only begin to generate significant revenue for government once third-party contractors have recouped their costs.
Oil sector
To date, the majority of producing fields in the country operate under the royalties and taxes (R&T) regime. The authors of this paper conducted an analysis of government revenues from the oil sector, estimating the government’s average share of total oil sector revenue for the period 2006-15. This figure is applied to the total estimated revenue projection from fields operating under the R&T regime, to project the Government’s R&T revenue stream.
The PSA fields operate under complex agreements with the international companies that have developed and operate the fields. Under the agreements, the government only begins to realise significant returns from the fields after the third-party operators of the fields are deemed to have recouped a certain
proportion of their capital expenditure. The main field operating under a PSA is Kashagan, which came online in 2016. Under the BAU scenario, the government’s gross revenue take from all PSA fields is projected to be minimal until 2025, at which point the operators are likely to recover the required level of their upfront costs. At this point it is assumed that the Government’s share of PSA revenue should rise, gradually increasing each year until a maximum is reached. This cost-recovery point is delayed in the “partially green” transition and “fully green” transition scenarios, due to the corresponding fall in oil prices under those two scenarios (to simulate the fact that costs will be recovered at a slower pace than in the BAU scenario).
Other revenue streams
It is important to note that the approach to simulating the government’s R&T and PSA revenue streams is a high-level, top-down approach and hence is not intended to model the specific complexities of the oil and gas tax regime or the terms of PSAs. However, the results that this approach generates have been compared with Rystad’s detailed projections during the projection period and the two projections appear to be broadly aligned.
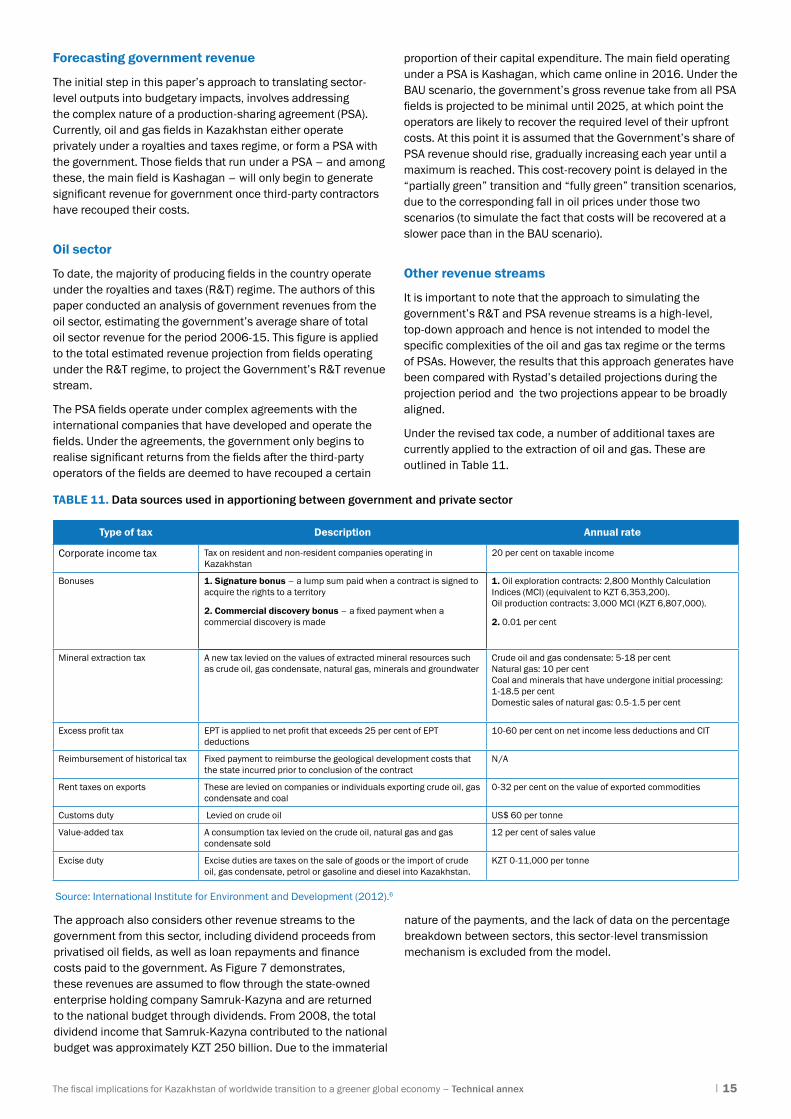
Under the revised tax code, a number of additional taxes are currently applied to the extraction of oil and gas. These are outlined in Table 11.
TABLE 11. Data sources used in apportioning between government and private sector
Type of tax Description Annual rate
Corporate income tax Tax on resident and non-resident companies operating in Kazakhstan
20 per cent on taxable income
Bonuses 1. Signature bonus – a lump sum paid when a contract is signed to acquire the rights to a territory
2. Commercial discovery bonus – a fixed payment when a commercial discovery is made
1. Oil exploration contracts: 2,800 Monthly Calculation Indices (MCI) (equivalent to KZT 6,353,200). Oil production contracts: 3,000 MCI (KZT 6,807,000).
2. 0.01 per cent
Mineral extraction tax A new tax levied on the values of extracted mineral resources such as crude oil, gas condensate, natural gas, minerals and groundwater
Crude oil and gas condensate: 5-18 per centNatural gas: 10 per centCoal and minerals that have undergone initial processing: 1-18.5 per cent Domestic sales of natural gas: 0.5-1.5 per cent
Excess profit tax EPT is applied to net profit that exceeds 25 per cent of EPT deductions
10-60 per cent on net income less deductions and CIT
Reimbursement of historical tax Fixed payment to reimburse the geological development costs that the state incurred prior to conclusion of the contract
N/A
Rent taxes on exports These are levied on companies or individuals exporting crude oil, gas condensate and coal
0-32 per cent on the value of exported commodities
Customs duty Levied on crude oil US$ 60 per tonne
Value-added tax A consumption tax levied on the crude oil, natural gas and gas condensate sold
12 per cent of sales value
Excise duty Excise duties are taxes on the sale of goods or the import of crude oil, gas condensate, petrol or gasoline and diesel into Kazakhstan.
KZT 0-11,000 per tonne
Source: International Institute for Environment and Development (2012).6
The approach also considers other revenue streams to the government from this sector, including dividend proceeds from privatised oil fields, as well as loan repayments and finance costs paid to the government. As Figure 7 demonstrates, these revenues are assumed to flow through the state-owned enterprise holding company Samruk-Kazyna and are returned to the national budget through dividends. From 2008, the total dividend income that Samruk-Kazyna contributed to the national budget was approximately KZT 250 billion. Due to the immaterial
nature of the payments, and the lack of data on the percentage breakdown between sectors, this sector-level transmission mechanism is excluded from the model.

The fiscal implications for Kazakhstan of worldwide transition to a greener global economy – Technical annex | 16
Direct subsidies
It is difficult to include direct producer subsidies in this paper’s modelling owing to the lack of information available. The OECD cited similar difficulties in their report on energy subsidies in Kazakhstan.7 Data on tax expenditure is limited and the lack of transparency with regard to the distribution of wealth to energy
producers through the NFRK has constrained the contribution of this sector-level mechanism to the model used in this paper. Given the insignificance of producer grants, they arear, therefore, assumed to be zero for the oil and gas sectors. It is important to note, however, that the use of effective tax rates on the oil and gas sectors has already captured the effect of any tax incentives that the government provides.
A.1.7. DETERMINING THE IMPACT ON THE NATIONAL BUDGET
Data sources
Data point Data unit Time series Sector Purpose Source(s)
Baseline macroeconomic indicators
Exchange rate US$ or KZT 2015, 2016 Whole economy To convert projected GDP and gross government debt from national currency to US dollars
National Bank of Kazakhstan
Annual population growth % 2016-22 Whole economy Used as an input into long-term GDP growth projections
United Nations World Population Prospects
Productivity growth % 2016-22 Whole economy Used as an input into long-term GDP growth projections
IMF World Economic Outlook (2017)
Projected GDP (nominal) KZT (millions)
2016-22 Whole economy To form the basis of projections to 2040
IMF World Economic Outlook (2017)
GDP deflator series N/A 2016-22 Whole economy To convert relevant series into real (2016) prices
IMF World Economic Outlook (2017)
Projected government expenditure (nominal)
KZT (millions)
2016-22 Whole economy Key input into the fiscal balance calculations
IMF World Economic Outlook (2017)
Debt servicing costs
Gross government debt (nominal)
KZT (millions) 2016-2022 Whole economy To calculate gross government debt in real terms, and to form the basis of projections to 2040
IMF World Economic Outlook (2017)
Effective interest rate Annual, % 2016 Whole economy To calculate the cost of servicing debt for the first debt-to-GDP bracket
IMF Article IV Consultation (2017)
Proportion of reissued debt Annual, % Fixed Whole economy To calculate the cost of new, reissued and remaining debt stock
IMF Article IV Consultation (2015)
TABLE 12. Data sources used in determining the impact on the national budge
FIGURE 8. Projected real GDP in Kazakhstan
Process overview
This paper’s approach to determining the impact of various IMF World Economic Outlook scenarios on the Kazakh national budget primarily required data obtained from the IMF WEO database, the IMF Article IV Consultation and the outputs of the sector modelling. The data points, summarised in Table 12, formed an essential aspect of this paper’s method for projecting the government’s fiscal balance through to 2040.
The general approach taken in this paper to modelling the impact on national accounts is to calculate the immediate annual impact of each scenario relative to the BAU scenario, and then to model the corresponding impact on debt, debt servicing costs and marginal asset accumulation. The BAU baseline scenario assumes that the government makes the necessary repayments required to maintain debt at projected levels, but for the two alternative scenarios the government is assumed to fund both the reduction in revenues and the marginal debt servicing costs by issuing more debt, unless sufficient assets are accumulated in order to fund the deficit.
A more detailed overview of the process is presented in the following section.
Projection of real GDP in Kazakhstan
The initial step in the approach to forecasting national budget involves projecting real GDP (in US dollars) through to 2040. Estimates from 2015 to 2022 are sourced from the IMF WEO. Real GDP was US$ 134 billion in 2016, down from US$ 204 billion in 2015 due to the currency devaluation, but projected to rise to almost US$ 261 billion by 2040.
Beyond 2022, the likely path of real GDP is projected forward on the basis of population and productivity growth, yielding an average real annual growth rate of approximately 2.8 per cent. Figure 8 shows the resulting GDP estimate.
0
50,000
100,000
150,000
200,000
250,000
300,000
2016
2017
2018
2019
2020
2021
2022
2023
2024
2025
2026
2027
2028
2029
2030
2031
2032
2033
2034
2035
2036
2037
2038
2039
2040
2016
US$
(mill
ions
)
Source: IMG, UN, National Bank of Kazakhstan and authors’ calculations.

The fiscal implications for Kazakhstan of worldwide transition to a greener global economy – Technical annex | 17
Of course, for an economy as heavily reliant on the extractives sector as Kazakhstan’s, GDP will itself be impacted significantly by a change in oil and gas prices. Despite this, because the model is not a general equilibrium model it necessarily makes the simplifying assumption that GDP follows this same profile for each price scenario. However, to the extent that the economy does not diversify away from the extractives sector GDP would be likely to be lower than this and therefore, in this regard, the debt-to-GDP ratios presented in the above analysis are conservative.
Projection of gross government debt (including revenue and expenditure)
Gross government debt includes both national and local government debt, without any offset for government financial assets. The short to medium-term projection of gross government debt in BAU scenario relies on estimates of nominal data sourced from the IMF WEO database. These nominal values are deflated using a GDP price index with a base year of 2015, ensuring that the calculations align to the IMF’s published projections for the BAU scenario.
For 2023-40 the debt projection follows a more complicated path, taking into account a number of important and interrelated elements:
• the stock of debt at the end of the previous year
• revenues for the current year
• expenditure for the current year
• assets accumulated over the period.
Current year revenues are calculated as a combination of non-oil and gas revenue, oil and gas revenue, and returns made on any additional assets generated over the period. Non-oil and gas revenue is identical in each scenario. For the period 2016-22 this is calculated as the difference between the IMF’s projected total revenue for 2016-22 and the oil and gas revenues
generated by this model for the BAU baseline scenario over the period. According to this approach, from 2023-40 non-oil revenues grow at the same average rate as projected GDP. Oil and gas revenues and asset returns change for each scenario and are calculated in line with the modelling approaches described elsewhere in this appendix.
Expenditure projections are largely fixed in each scenario, and change only with regard to additional debt servicing costs generated in each of the two green economy transition scenarios. Baseline government expenditure is based on IMF forecasts from 2016-22 and from 2023-40 grow at the same rate as real expenditure growth since 2002 (again, including IMF forecasts through to 2022). This is in line with the underlying principle of modelling the impacts of current fiscal policy, but it does mean that by 2040 government expenditure as a proportion of GDP has grown from 22.4 per cent (in 2016) to around 36 per cent. The details of how debt servicing costs are calculated are provided later in this Appendix.
The calculation for each year (and for each scenario) involves a number of steps, as outlined in Figure 10.
In effect, these calculations ensure that any additional deficit is funded by additional borrowing unless the government has accumulated additional assets over the period that are available to finance the deficit. Surpluses are used to pay down debt until the debt-to-GDP ratio reaches zero, at which point surpluses are used to accumulate financial assets (see the next section for more detail on marginal asset accumulation). The two green scenarios are not used in this particular analysis, as they allow the government to set a non-zero debt-to-GDP threshold (to maintain a healthy debt market, for example).
The resulting gross government debt, along with projected GDP, yields a debt-to-GDP ratio. This ratio determines the effective interest rate applied to newly issued, reissued and remaining debt.
FIGURE 9. Method for projecting gross government debt
Surplus or deficit?
Negative(below floor)
Negative(below floor)
Positive(above floor)
Positive(above floor)
Deficit vs. “Max”
Deficit vs. Assets
Surplus vs. “Max”1. Borrow “max”
2. Surplus + “max”into assets
1. “Max” paid into debt2. Remainder into assets
1. Run down all assets2. Add remainder to debt
1. Borrow deficit minus assets2. Zero assets
1. Borrow “Max”2. Reduce assets by “Deficit-max”
1. Deficit all added to debt2. Difference borrowed and
added to assets
Deficit all added to debt
Deficit all addedto debt
Assets
Positive assets
Positive assets
Assets vs. “Deficit-max”
No assets
No assets
Surplus ≤ “Max”
Pay deficit from assets
Deficit ≤ Assets Deficit > AssetsAssets < “Deficit-max” Assets ≥ “Deficit-max”
Deficit > “Max
Assets
Deficit ≤ “Max
Surplus > “Max”
“Max” to draw down beforereaching debt/GDP floor “Max” to draw down before
reaching debt/GDP floor
Surplus Deficit
Full surplus used to reduce debt
The fiscal implications for Kazakhstan of worldwide transition to a greener global economy – Technical annex | 18
Marginal asset accumulation
An important component of the debt projection analysis described above is the accumulation of additional assets that takes place in the BAU scenario. Due to the significant increases in prices and production that are projected, the government is expected to be in a position of zero gross government debt by 2029. Beyond this point, the assets accumulated are used to offset subsequent deficits (of which none are actually projected in the BAU scenario), and generate a return that increases the government’s expected revenues. The annual rate of return is set to 4.5 per cent to reflect historical averages for assets of this type.8
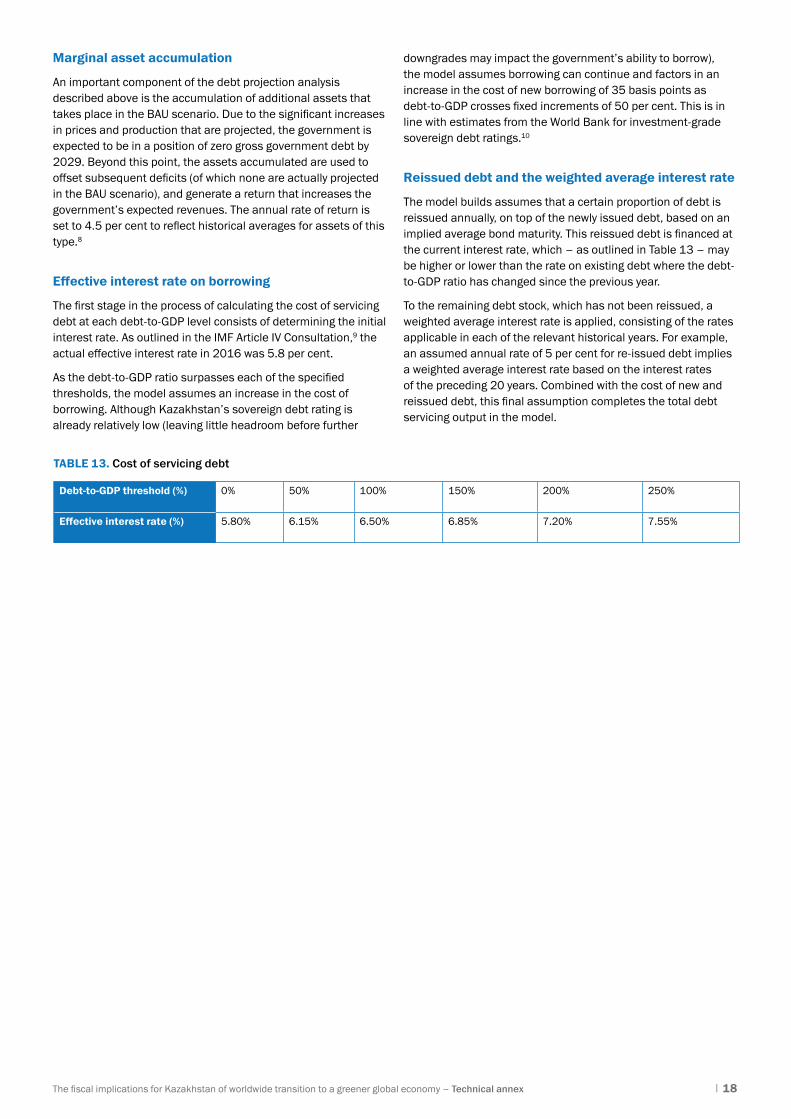
Effective interest rate on borrowing
The first stage in the process of calculating the cost of servicing debt at each debt-to-GDP level consists of determining the initial interest rate. As outlined in the IMF Article IV Consultation,9 the actual effective interest rate in 2016 was 5.8 per cent.
As the debt-to-GDP ratio surpasses each of the specified thresholds, the model assumes an increase in the cost of borrowing. Although Kazakhstan’s sovereign debt rating is already relatively low (leaving little headroom before further
downgrades may impact the government’s ability to borrow), the model assumes borrowing can continue and factors in an increase in the cost of new borrowing of 35 basis points as debt-to-GDP crosses fixed increments of 50 per cent. This is in line with estimates from the World Bank for investment-grade sovereign debt ratings.10
Reissued debt and the weighted average interest rate
The model builds assumes that a certain proportion of debt is reissued annually, on top of the newly issued debt, based on an implied average bond maturity. This reissued debt is financed at the current interest rate, which – as outlined in Table 13 – may be higher or lower than the rate on existing debt where the debt-to-GDP ratio has changed since the previous year.
To the remaining debt stock, which has not been reissued, a weighted average interest rate is applied, consisting of the rates applicable in each of the relevant historical years. For example, an assumed annual rate of 5 per cent for re-issued debt implies a weighted average interest rate based on the interest rates of the preceding 20 years. Combined with the cost of new and reissued debt, this final assumption completes the total debt servicing output in the model.
Debt-to-GDP threshold (%) 0% 50% 100% 150% 200% 250%
Effective interest rate (%) 5.80% 6.15% 6.50% 6.85% 7.20% 7.55%
TABLE 13. Cost of servicing debt

The fiscal implications for Kazakhstan of worldwide transition to a greener global economy – Technical annex | 19
ENDNOTES
1 EBRD (2015), Government Assets: Risks and Opportunities in a Changing Climate Policy Landscape. Available at: www.ebrd.com/documents/policy/pdf-government-assets-climate-policy.pdf (last accessed 27 October 2018).
2 International Energy Agency (2017), World Energy Outlook. Available at www.worldenergyoutlook.org (last accessed 27 October 2018).
3 J. Arbib and T. Seba (2017), “Rethinking Transportation 2020-2030: The Disruption of Transportation and the Collapse of the Internal-Combustion Vehicle and Oil Industries”, available at https://static1.squarespace.com/static/585c3439be65942f022bbf9b/t/591a2e4be6f2e1c13df930c5/1494888038959/RethinkX+Report_051517.pdf (last accessed 27 October 2018).
4 President of the Republic of Kazakhstan (2017). The Strategy for development of the Republic of Kazakhstan until the year 2030. Available at http://www.akorda.kz/en/official_documents/strategies_and_programs (last accessed 27 October 2018).
5 Expressed in 2015 prices.
6 IIED (2012), How to scrutinise a Production Sharing Agreement. Available at http://pubs.iied.org/pdfs/16031IIED.pdf (last accessed 27 October 2018).
7 OECD (2014), Energy subsidies and climate change in Kazakhstan, available at https://www.oecd.org/env/outreach/Energy%20subsidies%20and%20climate%20change%20in%20Kazakhstan.pdf (last accessed 27 October 2018).
8 IMF (2017), “Republic of Kazakhstan: Selected Issues”, available at http://www.imf.org/en/Publications/CR/Issues/2017/05/09/Republic-of-Kazakhstan-Selected-Issues-44885 (last accessed 27 October 2018).
9 IMF (2017), “Republic of Kazakhstan 2015 Article IV Consultation”, available at http://www.imf.org/~/media/Files/Publications/CR/2017/cr17108.ashx (last accessed 27 October 2018).
10 World Bank (2015), “Credit Ratings and Fiscal Responsibility”, available at http://documents.worldbank.org/curated/en/922521468188660334/pdf/97556-REVISED-Box391477B-PUBLIC.pdf (last accessed 27 October 2018).

This report has been prepared by the European Bank for Reconstruction and Development and PricewaterhouseCoopers LLP on the basis of analysis prepared by PricewaterhouseCoopers LLP.
PricewaterhouseCoopers LLP accepts no liability (including for negligence) to anyone else in connection with this document. Any person by reading this report accepts and agrees to the following terms:
1. 1. The reader of this report understands that the work performed by PricewaterhouseCoopers LLP was performed in accordance with instructions provided by The European Bank for Reconstruction and Development and was performed exclusively for The European Bank for Reconstruction and Development’s sole benefit and use.
2. 2. The reader of this report acknowledges that the analysis was prepared by PricewaterhouseCoopers LLP at the direction of The European Bank for Reconstruction and Development and may not include all procedures deemed necessary for the purposes of the reader.
3. 3. The reader agrees that PricewaterhouseCoopers LLP, its partners, principals, employees and agents neither owe nor accept any duty or responsibility to it, whether in contract or in tort (including without limitation, negligence and breach of statutory duty), and shall not be liable in respect of any loss, damage or expense of whatsoever nature which is caused by any use the reader may choose to make of this report, or which is otherwise consequent upon the gaining of access to the report by the reader.
© 2018 PricewaterhouseCoopers LLP and the European Bank of Reconstruction and Development. All rights reserved. In this document, ‘PwC’ refers to the UK member firm, and may sometimes refer to the PwC network. Each member firm is a separate legal entity. Please see www.pwc.com/structure for further details.
Photography: © iStock.
No part of this publication may be reproduced or transmitted in any form or by any means, including photocopying and recording, without the written permission of the copyright holder. Such written permission must also be obtained before any part of this publication is stored in a retrieval system of any nature.
Terms and names used in this report to refer to geographical or other territories, political and economic groupings and units, do not constitute and should not be construed as constituting an express or implied position, endorsement, acceptance or expression of opinion by the European Bank for Reconstruction and Development or its members concerning the status of any country, territory, grouping and unit, or delimitation of its borders, or sovereignty.

European Bank for Reconstruction and DevelopmentOne Exchange SquareLondonEC2A 2JNUnited Kingdomwww.ebrd.com