the five design-sheet (fds) approach for sketching information visualization...
TRANSCRIPT
EUROGRAPHICS 2011/ S. Maddock, J. Jorge Education Paper
The Five Design-Sheet (FdS) approach for SketchingInformation Visualization Designs
J. C. Roberts1
1School of Computer Science, Bangor University, UK
AbstractThere are many challenges for a developer when creating an information visualization tool of some data for aclient. In particular students, learners and in fact any designer trying to apply the skills of information visualiza-tion often find it difficult to understand what, how and when to do various aspects of the ideation. They need tointeract with clients, understand their requirements, design some solutions, implement and evaluate them. Thus,they need a process to follow. Taking inspiration from product design, we present the Five design-Sheet approach.The FdS methodology provides a clear set of stages and a simple approach to ideate information visualizationdesign solutions and critically analyze their worth in discussion with the client.
Categories and Subject Descriptors (according to ACM CCS): I.3.3 [Computer Graphics]: Picture/ImageGeneration—Display algorithms H.5.2 [Information Interfaces and Presentation]: User Interfaces—Theory andmethods, User-centered design
1. Introduction
Generating appropriate information visualization tools is animportant skill to obtain. In fact, these skills will becomemore and more useful in the future. There does not seemto be a slowing down in the appetite that organizations andcompanies have for data analysis and visual depiction, andthere are many challenges to visualize Terabyte or Petabytedata. Consequently, there is a growing need to create effec-tive and appropriate information visualization tools.
There are many software engineering (and other) modelsthat appropriately explain how to engineer a software prod-uct. But there are few models that describe how to ideatedesigns for the creation of an information visualization soft-ware tool. In particular, academic institutions teach muchabout how to design a software product, interact with othersoftware developers and manage the project, but little is tra-ditionally taught in a Computer Science School on how topractically engage with a client and especially how to designa creative product such as an information visualization tool.
This product-design skill is useful for software engineersat several stages of their education and practice. From under-graduate students interacting with clients for their individualor group projects, to PhD students discussing potential solu-
tions with clients who have novel data, to academics consult-ing over data analysis methods and research project ideas.
Furthermore, at the early design-stage the focus of the de-veloper should be to think about novel and unusual tech-niques – to push the boundary of possible ideas – and topresent initial ideas, even if these ideas may change at alater stage. Also, it is necessary that the developer concen-trates on the ideas and not on the technology that is gener-ating them. This should be particularly true for students andlearners who may not be familiar with a particular designtool. Consequently, we propose a sketch-based methodologywhere the user creates the designs on paper.
This article describes in detail the Five design-Sheet ap-proach. The FdS methodology creates five design sheets,and involves the client at critical stages of the design andideation. In particular, we define what information shoThuldbe included in each sheet. The goal of using the FdS is tocreate novel, client-driven design solutions, and especiallyinformation visualization designs, that are appropriate forthe client and their tasks. Learners can follow a methodolog-ical approach, and can be taught a particular process, whilepractitioners can interact with clients in a determined wayand easily describe their methodology to the clients. We be-
c� The Eurographics Association 2011.
J. C. Roberts / The Five Design-Sheet Approach
lieve this methodology could be usefully applied in variouscomputational visual computing fields.
We have used this approach in several instances, includ-ing students’ projects, visualization workshops and for re-search client interaction, and we discuss some case studies.Throughout this work, we use the term ‘developer’ as a gen-eral term to mean the person who is creating, developing andwill eventually implement the tool. This could be a team ofdevelopers, but we chose to use the singular here to simplifythe explanations. We use the term ‘Client’ to denote the do-main scientist, customer or user who is requiring the tool.They probably have some data to visualize, and they haveunanswered questions to make of their data. In an educationsituation – and as such for (say) a computer graphics or vi-sualization project – the project supervisor could readily bethe client. Finally, we use sketches of faces to represent theactors, with the client wearing a hat.
The remainder of the paper is divided into three parts.First we discuss the overarching process (section 2), ex-plain how the FdS was inspired from other work (section 3),describe related work (section 4) and present the learningoutcomes of the FdS methodology (section 5). Second, wecover in detail each design sheet (explained in sections 6 and7) and describe how to interact with the client (section 8), be-fore making the realization design sheet (section 9). Finally,we explain some instances of how we have used the FdSmethodology (section 10) and conclude.
2. The FdS methodology in brief
The FdS is the five design-sheet methodology. The developercreates five design-sheets through ongoing interaction withthe client. I.e., by the end of the process the developer willhave produced five sheets of paper with various designs andassociated information.
The aim of the FdS is to provide a structured process forthe developer to follow, such that they can create an appro-priate client-led information visualization solution. The end-result will be a computer program that will enable the client(the user) to interact with and thus perceive information con-tained within their data.
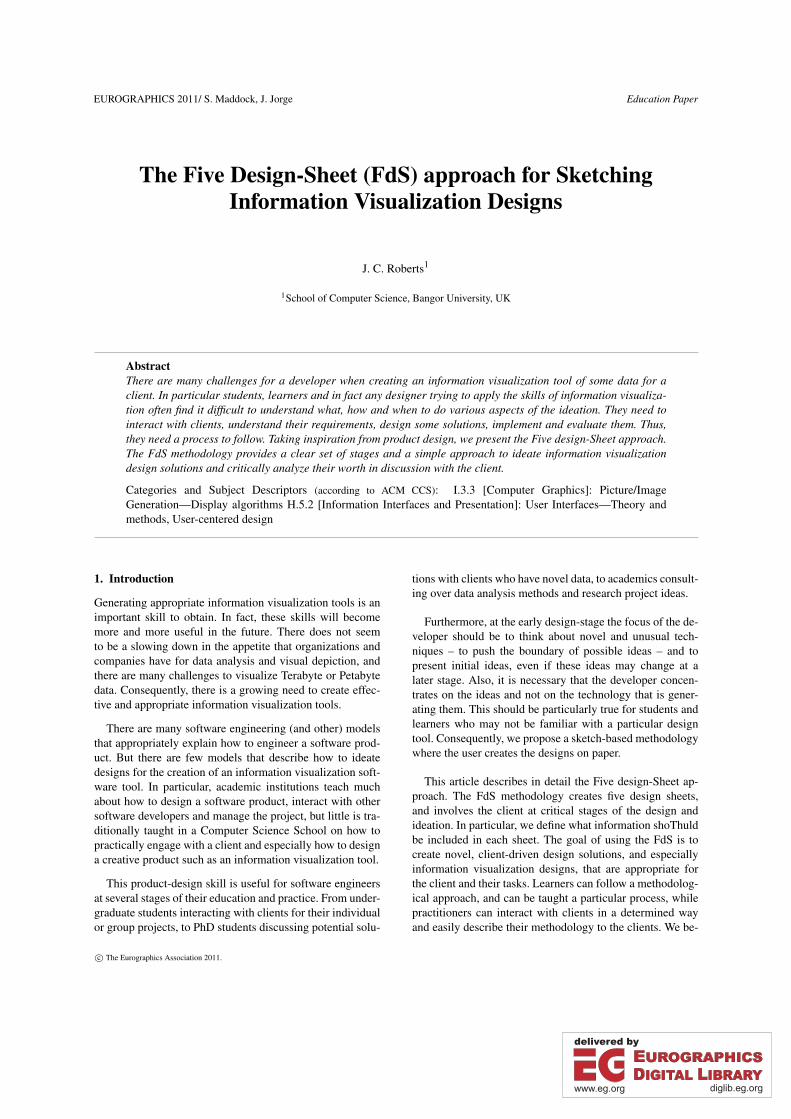
The developer sketches several designs to ideate novelinformation visualization solutions. This Agile process en-ables the developer to develop new ideas that are suitablefor the client’s needs. Figure 1 demonstrates this process.The developer meets the client (top), afterwards brainstormssome designs, ideates three different tools (solutions), dis-cusses these with the client, creates a realization designwhich is then implemented (with traditional design tech-niques). Further interactions can occur, and the designs canbe iterated and refined such to create a spiral. (Such a spi-ral fits in with Agile methodologies such as Scrum [Sch95]).Consequently, the FdS occurs before the traditional softwareengineering development.
Figure 1: The FdS methodology enables the developer to cre-ate and sketch ideas, discuss them with the clients and refinethe ideas into a workable solution. The client is involved inthe ideation and creation process.
This ideation process needs to be achieved ‘in context’.If the FdS is being used to create Information Visualizationdesigns then the developer needs to clearly understand thedata and what parts of the data are important to the client.The developer will naturally understand more about the dataand the client the further the project develops which thusaffords better visualization tools.
The FdS methodology contains several parts, which areexplained in detail in the following sections. But, in sum-mary there are:
• Five sheets: 1 brainstorm sheet, 3 design sheets and 1 re-alization sheet. As shown in Figure 2.
• Five stages: (as shown in Figure 1). The developer andclient meet, the developer brainstorms some ideas, createthree design-sheets, that are discussed with client and arealization design is generated. It is this realization de-sign that is then implemented using traditional softwaredevelopment techniques. Depending on the situation andthe availability of the client the coding-development canbe incremental, and the client can be more involved andthe development of the ideas are more incremental.
• Five parts to brainstorm: ideate, filter, categorize, com-bine and refine, question
• Five parts to each sheet (LIFOD): Layout, meta-Information, Focus, Operations, Discussion or Detail.
3. Background & Inspiration for the FdS
Part of the inspiration for the FdS comes from architecturedesign plans and mechanical design plans. In particular threekey concepts are inspired from design plans: Sketching, in-cremental designing, and the theme or parti of the design.
c� The Eurographics Association 2011.
30
J. C. Roberts / The Five Design-Sheet Approach
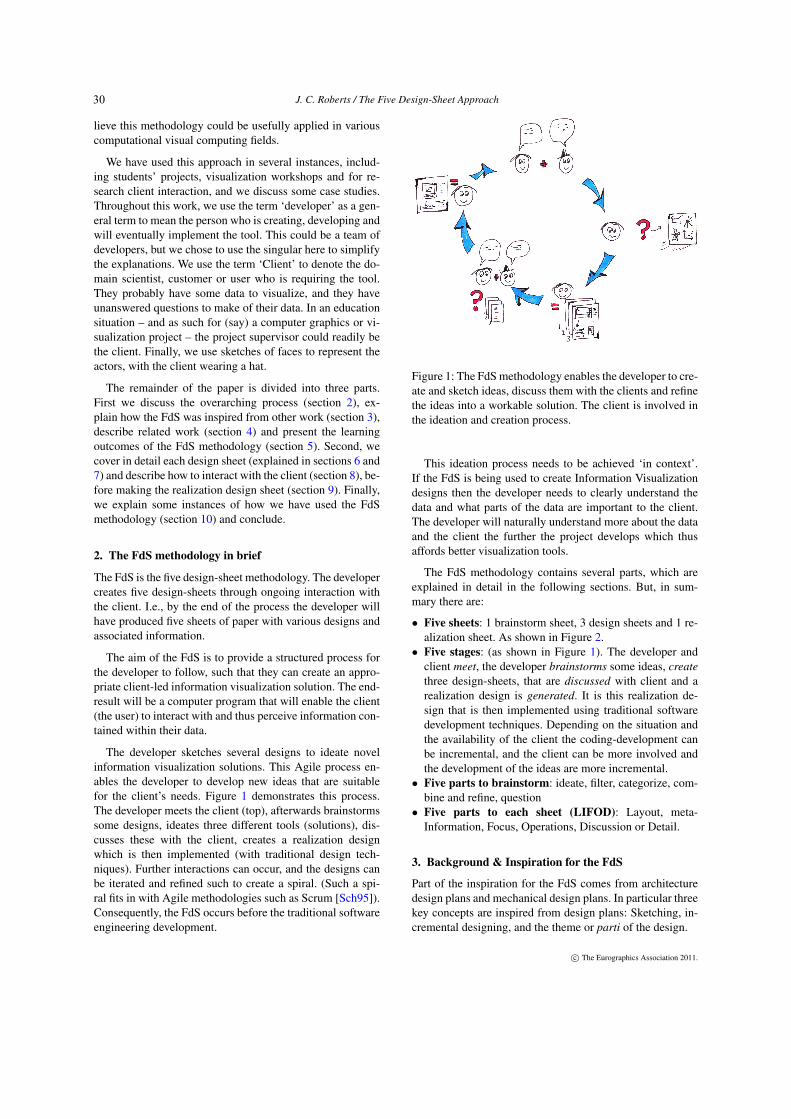
Figure 2: (Left) An overview of the Five Data Sheet (FdS) approach. Sheet 1 shows ‘ideas’, it is generated through brainstormingand sketching rough-ideas. (Center) Sheets 2,3 and 4 demonstrate three alternative (potential) design solutions. Each of thesethree design-sheets contain the same structure. (Right) Sheet 5 is the realization sheet, that provides the solution that will beimplemented and some discussion of other requirements for that particular realization.
Aspects such as sketching are commonly used when mak-ing design plans. In particular, designers often use sketchesto “generate concepts, to externalize and visualize problems,to facilitate problem solving and creative effort, revising andrefining ideas” [TPN03]. We define what information shouldbe placed on each sheet. Similarly, common practices arefollowed when designers create design sheets or other blue-print sheets. In addition, the process of sketching on a pieceof paper, using a pencil or a pen, forces the developer to thinkabout the solution. It is too easy to get distracted by the inter-face of a modern drawing tool, where users get bogged downin how to create a specific effect. ‘Creative juices’ flow morereadily with pen and paper.
Designers who draft architectural plans often take a hi-erarchical and incremental approach. In their case the ideasare sketched and further refined. In fact sketching can helpto maintain a fluid and ephemeral process that can providea visual map of different solutions, which tell the story ofthe ideas evolving [BN06]. In our case we acknowledge thatthis incremental approach is ensued collaboratively and withresearchers from several disciplines, and jointly with usersor clients with expert knowledge.
The central concept in architectural terms is sometimesreferred to as the parti [Fre07]. This is the overarching con-cept that the design is portraying. It is the key part that makesthe design work. In the FdS this is represented by the fo-cus/zoom part of sheets 2,3 and 4.
The created designs enable a focus for the discussionswith the client. The sketchy nature of the ideas gives theclient the perception that nothing is pre-determined and thatconcepts and designs can change. It is good that these con-cepts do change because the developer’s interaction with theclient is important. Not only to gain an understanding of theclient’s challenges but to share with them their knowledgeof design in visualization, understanding of perception andexperience of information visualization.
The design-sheets are also persistent artifacts. These ar-tifacts can be kept, put on a wall and discussed as a group,filed, scanned into a computer, shared remotely and marked.
4. Related Work
Our FdS approach fits in well with other methodologies. Itdoes not replace the computer implementation and devel-opment models, rather the FdS provides a structure to theearly design stages that are traditionally less structured. Itenables developers to think about the design and articulatetheir ideas. Our novelty is to pull these individual conceptstogether – the concepts of client engagement, sketching anddesign-sheets – and put them in a clear framework.
The FdS provides a useful Interaction Design methodol-ogy [RSP07] that involves the client at each stage of thedevelopment to create a useful design. The initial questionsenable the developer to ask questions of the client and findthe users’ needs. The separate design-sheets provide alter-native solutions that potentially meet these needs and act asdiscussion points and there is constant interaction and eval-uation of the developed work. Successful client interactions“don’t make money-back guarantees and don’t promise suc-cess; instead, they facilitate, enable, or coach a client towardsuccess” [Arn07]. Thus client engagement is important.
For visualization design, in particular, Munzner et al.[MJM⇤06] discuss how visualization research can beachieved. Munzner [Mun09] also describes a nested modelfor visualization design. She splits the task into four parts:domain problem characterization, data/operation abstractiondesign, encoding/interaction technique design and algorithmdesign. The FdS focuses on the first three tasks in Mun-zner’s nested model; the problem characterization is coveredin design-sheet one; with her middle two design parts in-cluded in the remaining design sheets.
While the FdS methodology is readily an ‘applied design
c� The Eurographics Association 2011.
31
J. C. Roberts / The Five Design-Sheet Approach
technique’, where the client is the domain expert and pro-vides the driving problem [MJM⇤06], the developer couldalso be the client, and as such the methodology provides astructure to perform an appropriate design whatever the re-search type or problem domain.
The aim of the FdS is to create appropriate and effectivevisualizations. Consequently, developers should understandthe visualization design space. E.g., it would be useful to ap-ply Bertin’s [Ber83] Component Analysis, know Rules andPrinciples of visualization [SI94] and to understand gooddesign principles [War04]. In particular the use of Bertin’scomponent analysis could be used at the beginning of theprocess in the FdS sheet 1. For example the size of the com-ponents are analyzed (those of short length, medium or longcomponents) their order and whether they are quantitative orqualitative.
The focus to sketching reflects well with otherresearchers’ work. Researchers such as Craft andCairns [CC09] encourage storyboarding and sketchingprototypes for rapid visualization interface development, es-pecially in the collaborative design process. While Johnsonet al. [JGHYLD08] express that sketching encourages thedeveloper to provide different views of the model to allowthem to perceive the problem in new ways. Roam [Roa08]presents a series of visual sketching methods as a way tosolve problems in business and help developers crystallizeideas.
5. The FdS in teaching
Should readers be interested in using this method in theirteaching, most institutions require pedagogic aims of the stu-dent and learning outcomes to be written. For our work wehave used the following aims and learning outcomes.
Aims:• To start to understand how to interact with a client• To carry out an individual or group based brain-storm• To carry out creative sketching – develop new design-
ideas around a scenario• To assess the validity and usefulness of the designs under
competing factors
Learning Outcomes:• Intellectual Skills: Demonstrate capability for innovation
and disciplined creativity, identify and analyze require-ments and form a technical specification. Assess the im-pact of uncertainty, such as technical risk and develop-ment time-scales, and trade-off competing factors such ascosts and benefits.
• Practical Skills: Use sketches as a method of planningand communication
• Transferable Skills: Communicate effectively – usingsketches, graphical and oral.
The next sections detail the content of each of the designsheet.
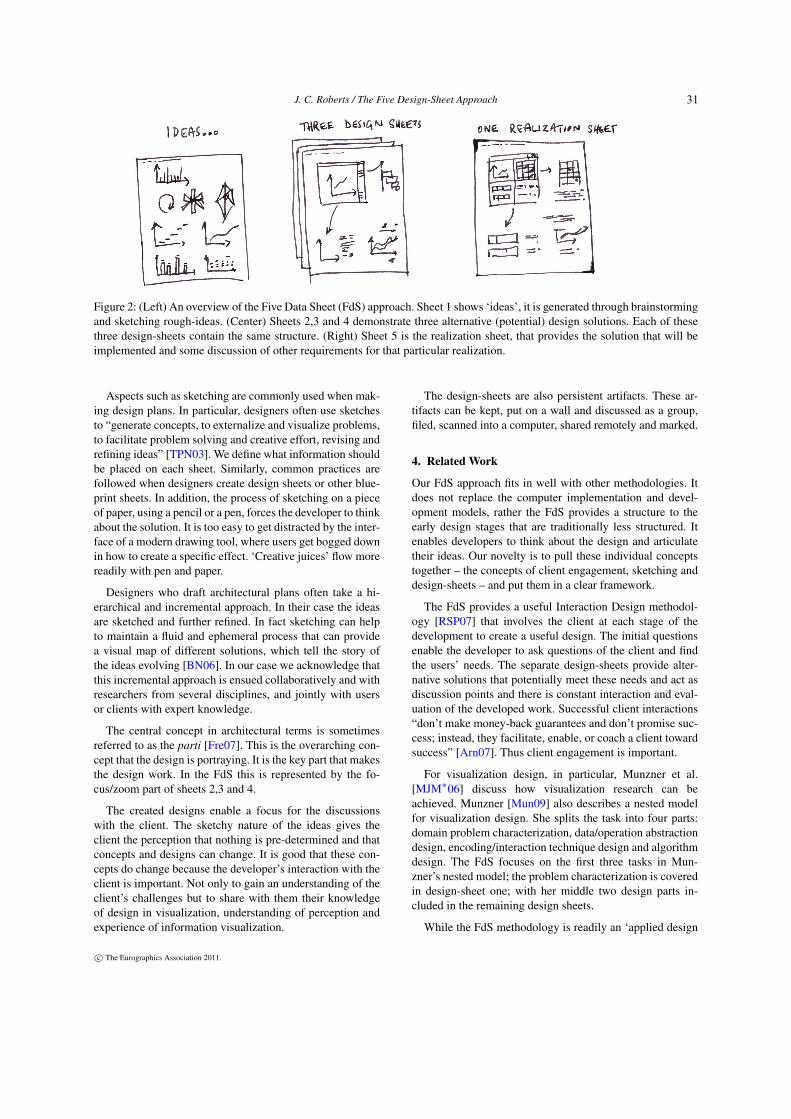
Figure 3: A depiction of the first design sheet. The developeris encouraged to brainstorm different ideas, then to filter, cat-egorize, combine and refine. Finally they should question theideas ready for the second, third and fourth design sheets.
6. Sheet 1 – brainstorm
The idea of sheet 1 is to consider the data and compose initialdesign ideas. We name this stage ‘brainstorming’ becausethe process enlarges the design space of possibilities. Ini-tially here should be a focus on quantity – to generate all pos-sible ideas (see Figure 3). Not only potential designs shouldbe considered, but how the data is formed. The process thenmoves to consider the effectiveness and appropriateness ofdesigns and the needs and requirements of the client.
We encourage the developer to be creative and imagina-tive in this process. This may, or may not, be a group activity.Following this process on one’s own can be likewise reward-ing. Also, software can be used to help in the process suchmind-mapping software, which can help users organize theirthoughts and ideas around a topic. Furthermore, new toolsare being developed to take sketches directly and translatethem into interfaces directly [OSSJ09]. But in this work weadvocate sketching as the principle design tool.
There are five stages in this task.
1. Generate Ideas. Developers should articulate and sketchas many ideas as they can. In reality these are mini-ideas.They are short concepts that could be part of a whole.E.g., use a scatter plot or line graph, or need some Dy-namic query task to filter the results. These may be com-prehensive and complete ideas or half-baked ideas, sim-ple concepts or merely wacky suggestions.
c� The Eurographics Association 2011.
32
J. C. Roberts / The Five Design-Sheet Approach
2. Filter the ideas. Take the ideas and start to remove anyduplication. Remove any ideas that seem too similar toanother. Application of correct visualization mappingsfrom (say) a Bertin component analysis or from Rulesand Principles of Visualization should be applied at thisstage.
3. Categorize the sketches. Start to order and categorizethe sketches, the mini-ideas. Concepts that are similarshould be located together. If you are using sticky-notesthen these can be easily moved and categorized on a wall,for instance. There may be different and alternative cat-egorizations; just choose one and move on. The catego-rization and the ideas will probably change and developanyhow.
4. Combine & Refine. Start to organize the mini-ideas intobigger solutions. Perhaps have multiple views: this couldbe two visualizations that demonstrate different aspectsof the same information.
5. Question. The final stage is to question what has beengenerated. Does this provide a solution that the clientwants? Is it fit for purpose? Is it an effective design. Doesit answer the original research questions?
This process can be run as a group activity. It is impor-tant to consider that participants must not initially criticize orevaluate the worth of particular designs. Keep the ideas flow-ing by getting participants to sketch their individual ideasdown on their own sheets of paper (sticky notes are usefulin this exercise). Invite and record any ideas that the partic-ipants create. Try to make sure that the whole design spaceof possible designs is covered. Unusual, non-traditional andideas that push the boundaries should be tabled.
The process as a group participation exercise: All partici-pants listen to the challenge/task from the domain scientist,then:
1 Individually write down on sticky-notes their own thoughts
(Ideas)
2 Collate all sticky-notes (the ideas) inthe group
3 Stack the sticky-notes of similarideas on top of each other
(Filter)
4 In the group organize the sticky-notes
(Categorize)
5 Categorize the idea space by mov-ing the stick-notes into groups oflike-ideas
6 Combine and refine the ideas. Usesketching and start to prepare thethree main design-sheets
(Combine, refine)
7 Start to discuss the ben-efits/challenges or advan-tages/disadvantages of the cate-gorized ideas
(Question)
Generating designs that are creative and effective and en-
able the client’s questions to be answered are obviously thegoal of this process.
7. Sheets 2,3,4 – Initial Designs
The three individual design sheets are to record three ideasfrom the initial brainstorming exercise. The use of the num-ber three is for guidance only. But, it is recommended that atleast three design sheets are created. Too few designs meanthat it is difficult to have a discussion with the client. Toomany and it would waste the client’s time. It may be thatthere are only two sensible designs, but it would be better tocreate a third design, however unusual or unfeasible it seems.This is because the client may be able to see or extend theideas through discussion. The client may be able to see anapplication of the idea further than the developer can.
Three completely different designs should be placed oneach sheet. Consider a hyperspace of all possible designs;the three that are proposed should cover this design spacewell. When making the designs the developer should con-sider the appropriateness of the designs, data and user char-acteristics and the task that the user wishes to perform.
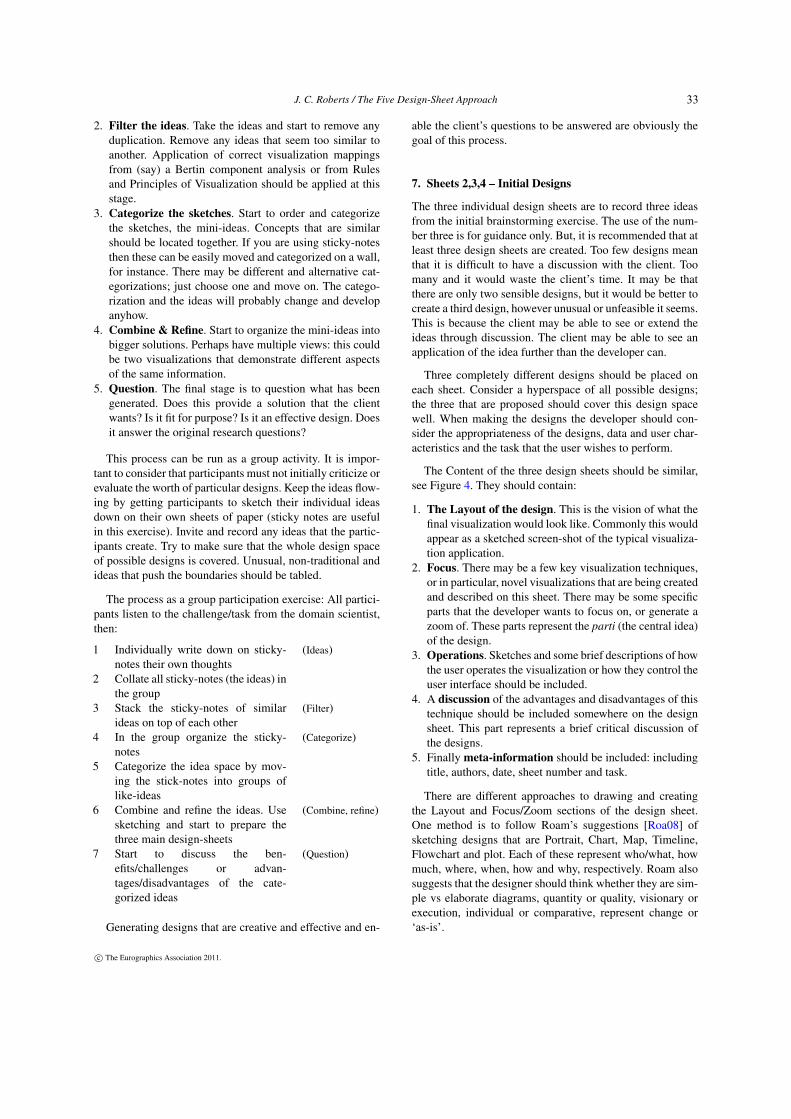
The Content of the three design sheets should be similar,see Figure 4. They should contain:
1. The Layout of the design. This is the vision of what thefinal visualization would look like. Commonly this wouldappear as a sketched screen-shot of the typical visualiza-tion application.
2. Focus. There may be a few key visualization techniques,or in particular, novel visualizations that are being createdand described on this sheet. There may be some specificparts that the developer wants to focus on, or generate azoom of. These parts represent the parti (the central idea)of the design.
3. Operations. Sketches and some brief descriptions of howthe user operates the visualization or how they control theuser interface should be included.
4. A discussion of the advantages and disadvantages of thistechnique should be included somewhere on the designsheet. This part represents a brief critical discussion ofthe designs.
5. Finally meta-information should be included: includingtitle, authors, date, sheet number and task.
There are different approaches to drawing and creatingthe Layout and Focus/Zoom sections of the design sheet.One method is to follow Roam’s suggestions [Roa08] ofsketching designs that are Portrait, Chart, Map, Timeline,Flowchart and plot. Each of these represent who/what, howmuch, where, when, how and why, respectively. Roam alsosuggests that the designer should think whether they are sim-ple vs elaborate diagrams, quantity or quality, visionary orexecution, individual or comparative, represent change or‘as-is’.
c� The Eurographics Association 2011.
33
J. C. Roberts / The Five Design-Sheet Approach
Figure 4: Sheets 2,3 and 4 hold five parts of informa-tion: Layout, Focus, Sketches, Discussion and the meta-information.
8. Client meeting to discuss the designs
The three design sheets aid the discussion with the client.The sketches give the appearance that the ideas couldchange. Also, the designs give the client an understandingof the breadth of possible outcomes.
When discussing the designs with the client it is prefer-able to explain the process you are following. Consequently,developers should briefly describe the FdS methodology andexplain that the design sheets expose three principle ideas(within the the possible design space). The major discov-eries of the work should be explained, i.e., explain the Fo-cus/Zoom (the parti). Also, the meeting should provide theopportunity to discuss the critical-analysis of each design.
9. Sheet 5 – Realization
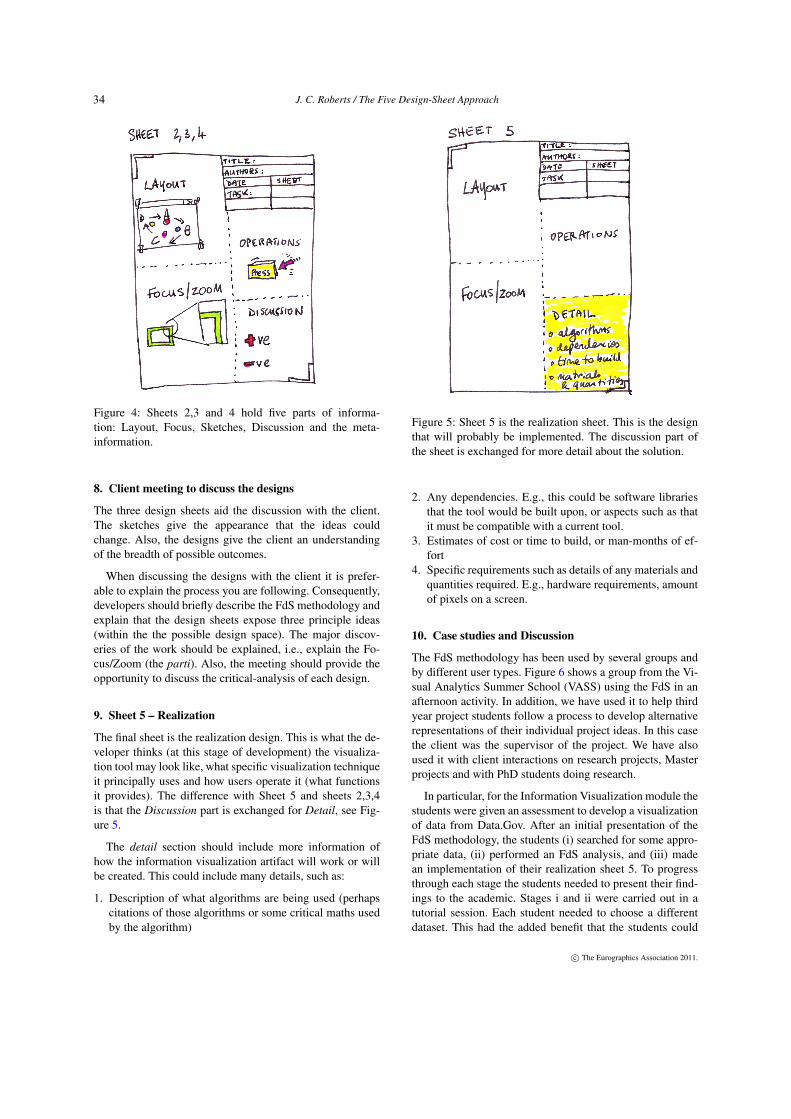
The final sheet is the realization design. This is what the de-veloper thinks (at this stage of development) the visualiza-tion tool may look like, what specific visualization techniqueit principally uses and how users operate it (what functionsit provides). The difference with Sheet 5 and sheets 2,3,4is that the Discussion part is exchanged for Detail, see Fig-ure 5.
The detail section should include more information ofhow the information visualization artifact will work or willbe created. This could include many details, such as:
1. Description of what algorithms are being used (perhapscitations of those algorithms or some critical maths usedby the algorithm)
Figure 5: Sheet 5 is the realization sheet. This is the designthat will probably be implemented. The discussion part ofthe sheet is exchanged for more detail about the solution.
2. Any dependencies. E.g., this could be software librariesthat the tool would be built upon, or aspects such as thatit must be compatible with a current tool.
3. Estimates of cost or time to build, or man-months of ef-fort
4. Specific requirements such as details of any materials andquantities required. E.g., hardware requirements, amountof pixels on a screen.
10. Case studies and Discussion
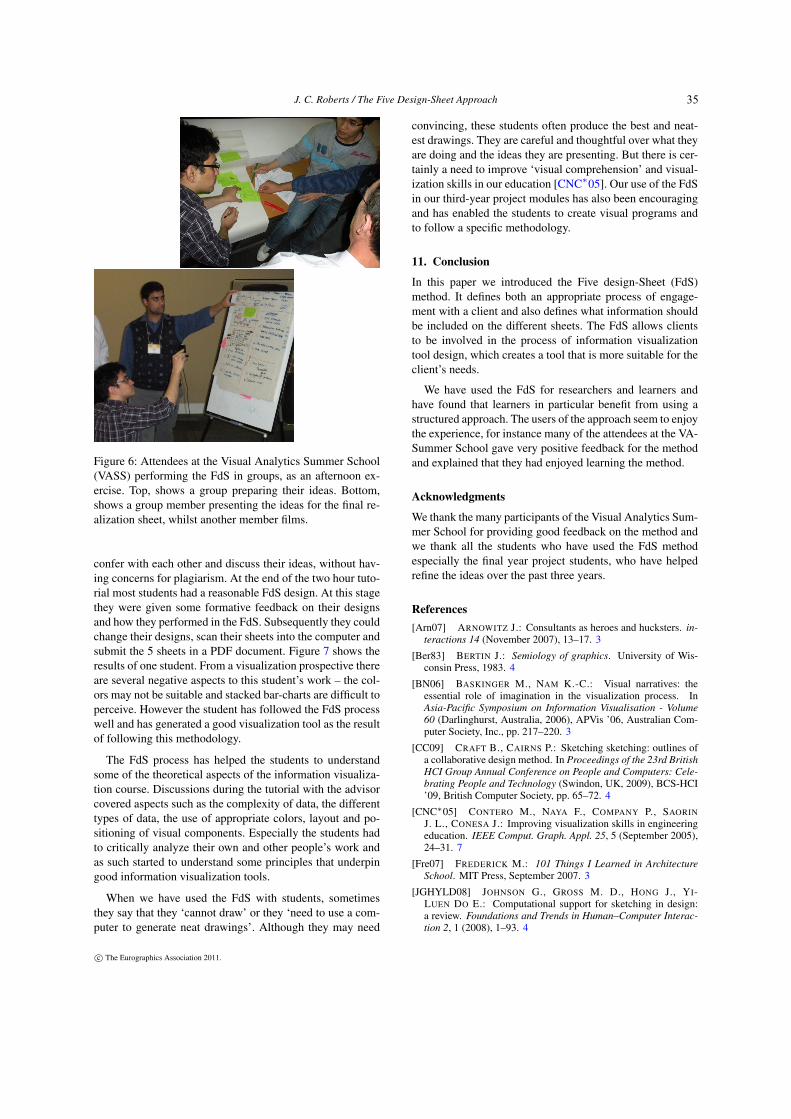
The FdS methodology has been used by several groups andby different user types. Figure 6 shows a group from the Vi-sual Analytics Summer School (VASS) using the FdS in anafternoon activity. In addition, we have used it to help thirdyear project students follow a process to develop alternativerepresentations of their individual project ideas. In this casethe client was the supervisor of the project. We have alsoused it with client interactions on research projects, Masterprojects and with PhD students doing research.
In particular, for the Information Visualization module thestudents were given an assessment to develop a visualizationof data from Data.Gov. After an initial presentation of theFdS methodology, the students (i) searched for some appro-priate data, (ii) performed an FdS analysis, and (iii) madean implementation of their realization sheet 5. To progressthrough each stage the students needed to present their find-ings to the academic. Stages i and ii were carried out in atutorial session. Each student needed to choose a differentdataset. This had the added benefit that the students could
c� The Eurographics Association 2011.
34
J. C. Roberts / The Five Design-Sheet Approach
Figure 6: Attendees at the Visual Analytics Summer School(VASS) performing the FdS in groups, as an afternoon ex-ercise. Top, shows a group preparing their ideas. Bottom,shows a group member presenting the ideas for the final re-alization sheet, whilst another member films.
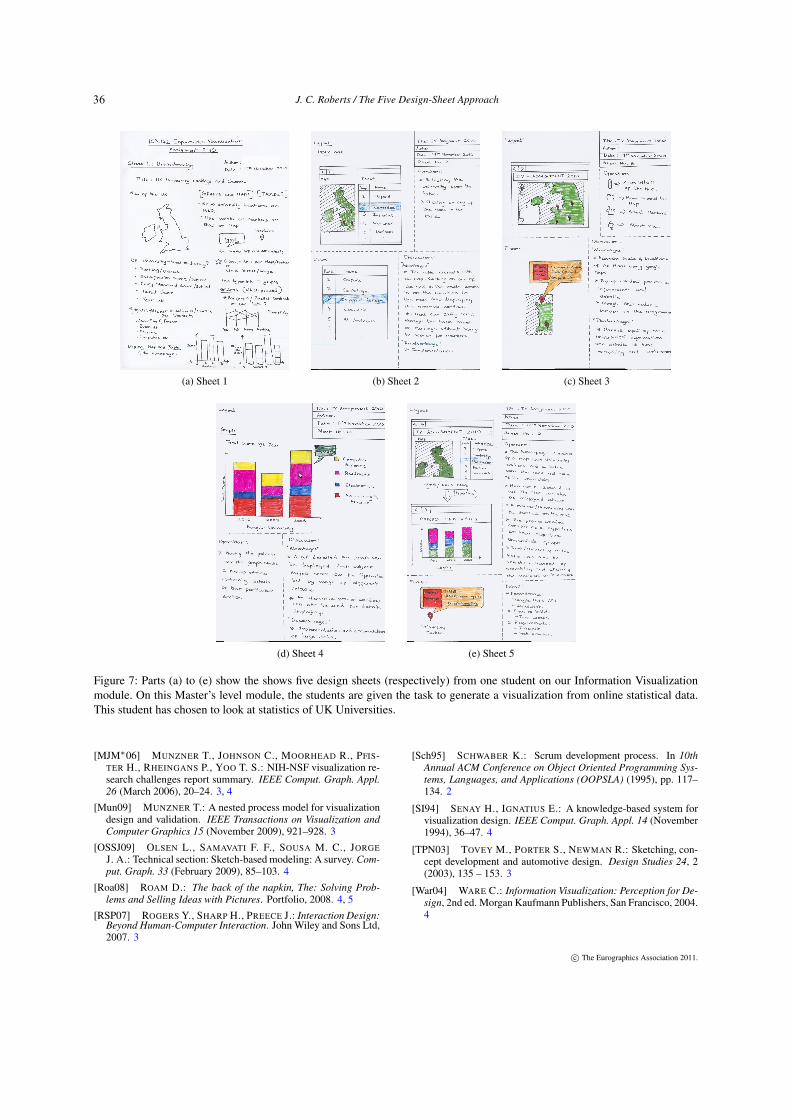
confer with each other and discuss their ideas, without hav-ing concerns for plagiarism. At the end of the two hour tuto-rial most students had a reasonable FdS design. At this stagethey were given some formative feedback on their designsand how they performed in the FdS. Subsequently they couldchange their designs, scan their sheets into the computer andsubmit the 5 sheets in a PDF document. Figure 7 shows theresults of one student. From a visualization prospective thereare several negative aspects to this student’s work – the col-ors may not be suitable and stacked bar-charts are difficult toperceive. However the student has followed the FdS processwell and has generated a good visualization tool as the resultof following this methodology.
The FdS process has helped the students to understandsome of the theoretical aspects of the information visualiza-tion course. Discussions during the tutorial with the advisorcovered aspects such as the complexity of data, the differenttypes of data, the use of appropriate colors, layout and po-sitioning of visual components. Especially the students hadto critically analyze their own and other people’s work andas such started to understand some principles that underpingood information visualization tools.
When we have used the FdS with students, sometimesthey say that they ‘cannot draw’ or they ‘need to use a com-puter to generate neat drawings’. Although they may need
convincing, these students often produce the best and neat-est drawings. They are careful and thoughtful over what theyare doing and the ideas they are presenting. But there is cer-tainly a need to improve ‘visual comprehension’ and visual-ization skills in our education [CNC⇤05]. Our use of the FdSin our third-year project modules has also been encouragingand has enabled the students to create visual programs andto follow a specific methodology.
11. Conclusion
In this paper we introduced the Five design-Sheet (FdS)method. It defines both an appropriate process of engage-ment with a client and also defines what information shouldbe included on the different sheets. The FdS allows clientsto be involved in the process of information visualizationtool design, which creates a tool that is more suitable for theclient’s needs.
We have used the FdS for researchers and learners andhave found that learners in particular benefit from using astructured approach. The users of the approach seem to enjoythe experience, for instance many of the attendees at the VA-Summer School gave very positive feedback for the methodand explained that they had enjoyed learning the method.
Acknowledgments
We thank the many participants of the Visual Analytics Sum-mer School for providing good feedback on the method andwe thank all the students who have used the FdS methodespecially the final year project students, who have helpedrefine the ideas over the past three years.
References[Arn07] ARNOWITZ J.: Consultants as heroes and hucksters. in-
teractions 14 (November 2007), 13–17. 3[Ber83] BERTIN J.: Semiology of graphics. University of Wis-
consin Press, 1983. 4[BN06] BASKINGER M., NAM K.-C.: Visual narratives: the
essential role of imagination in the visualization process. InAsia-Pacific Symposium on Information Visualisation - Volume60 (Darlinghurst, Australia, 2006), APVis ’06, Australian Com-puter Society, Inc., pp. 217–220. 3
[CC09] CRAFT B., CAIRNS P.: Sketching sketching: outlines ofa collaborative design method. In Proceedings of the 23rd BritishHCI Group Annual Conference on People and Computers: Cele-brating People and Technology (Swindon, UK, 2009), BCS-HCI’09, British Computer Society, pp. 65–72. 4
[CNC⇤05] CONTERO M., NAYA F., COMPANY P., SAORINJ. L., CONESA J.: Improving visualization skills in engineeringeducation. IEEE Comput. Graph. Appl. 25, 5 (September 2005),24–31. 7
[Fre07] FREDERICK M.: 101 Things I Learned in ArchitectureSchool. MIT Press, September 2007. 3
[JGHYLD08] JOHNSON G., GROSS M. D., HONG J., YI-LUEN DO E.: Computational support for sketching in design:a review. Foundations and Trends in Human–Computer Interac-tion 2, 1 (2008), 1–93. 4
c� The Eurographics Association 2011.
35
J. C. Roberts / The Five Design-Sheet Approach
(a) Sheet 1 (b) Sheet 2 (c) Sheet 3
(d) Sheet 4 (e) Sheet 5
Figure 7: Parts (a) to (e) show the shows five design sheets (respectively) from one student on our Information Visualizationmodule. On this Master’s level module, the students are given the task to generate a visualization from online statistical data.This student has chosen to look at statistics of UK Universities.
[MJM⇤06] MUNZNER T., JOHNSON C., MOORHEAD R., PFIS-TER H., RHEINGANS P., YOO T. S.: NIH-NSF visualization re-search challenges report summary. IEEE Comput. Graph. Appl.26 (March 2006), 20–24. 3, 4
[Mun09] MUNZNER T.: A nested process model for visualizationdesign and validation. IEEE Transactions on Visualization andComputer Graphics 15 (November 2009), 921–928. 3
[OSSJ09] OLSEN L., SAMAVATI F. F., SOUSA M. C., JORGEJ. A.: Technical section: Sketch-based modeling: A survey. Com-put. Graph. 33 (February 2009), 85–103. 4
[Roa08] ROAM D.: The back of the napkin, The: Solving Prob-lems and Selling Ideas with Pictures. Portfolio, 2008. 4, 5
[RSP07] ROGERS Y., SHARP H., PREECE J.: Interaction Design:Beyond Human-Computer Interaction. John Wiley and Sons Ltd,2007. 3
[Sch95] SCHWABER K.: Scrum development process. In 10thAnnual ACM Conference on Object Oriented Programming Sys-tems, Languages, and Applications (OOPSLA) (1995), pp. 117–134. 2
[SI94] SENAY H., IGNATIUS E.: A knowledge-based system forvisualization design. IEEE Comput. Graph. Appl. 14 (November1994), 36–47. 4
[TPN03] TOVEY M., PORTER S., NEWMAN R.: Sketching, con-cept development and automotive design. Design Studies 24, 2(2003), 135 – 153. 3
[War04] WARE C.: Information Visualization: Perception for De-sign, 2nd ed. Morgan Kaufmann Publishers, San Francisco, 2004.4
c� The Eurographics Association 2011.
36