the foresee experience index: e-gov
TRANSCRIPT
T H E F O R E S E E E X P E R I E N C E I N D E X : E - G O V
C O M M E N T A R Y A N D A N A LY S I S
Dave Lewan Vice President, ForeSee
With an introduction from Eric Keller, Partnership for Public Service
R E S E A R C H A S S I S T A N T
Anna Salomonsson
Q3 2 0 1 7 U P D A T E
© November 2017 ForeSee

TABLE OFCONTENTS
Executive Summary
Introduction
Websites
Mobile Sites and Apps
About the Index
3
4
6
15
19
The ForeSee Experience Index: E-Gov (formerly the ForeSee E-Government Satisfaction Index) is a quarterly
reflection of citizens’ experience with federal government websites. We publish also publish a yearly report
(download the 2016 report here).
F O R E S E E E X P E R I E N C E I N D E X : E - G O V E R N M E N T Q 3 2 0 1 7
2 E X E C U T I V E S U M M A R Y »
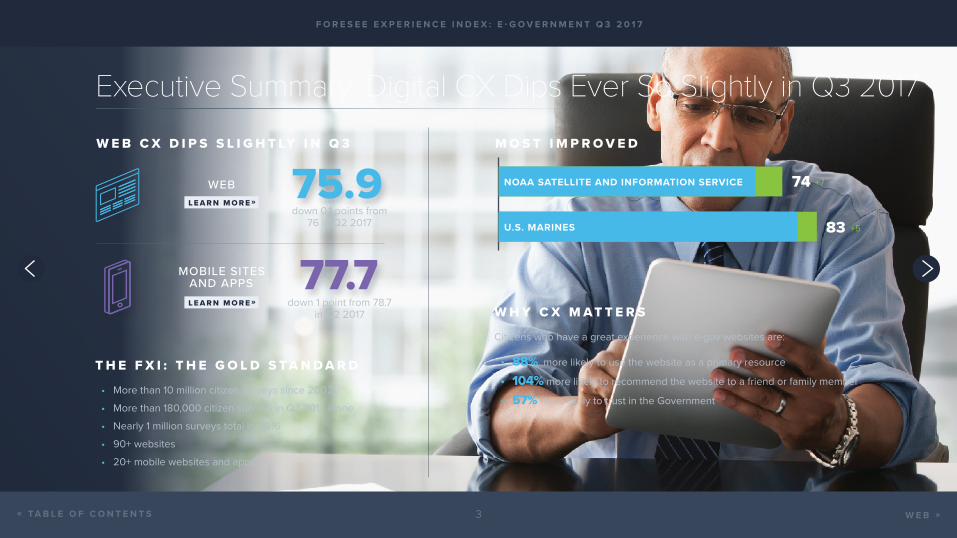
Executive Summary: Digital CX Dips Ever So Slightly in Q3 2017
M O S T I M P R O V E D
W H Y C X M A T T E R S
Citizens who have a great experience with e-gov websites are:
• 88% more likely to use the website as a primary resource
• 104% more likely to recommend the website to a friend or family member
• 57% more likely to trust in the Government
T H E F X I : T H E G O L D S T A N D A R D
• More than 10 million citizen surveys since 2002
• More than 180,000 citizen surveys in Q3 2017 alone
• Nearly 1 million surveys total in 2016
• 90+ websites
• 20+ mobile websites and apps
+774NOAA SATELLITE AND INFORMATION SERVICE
+583U.S. MARINES
F O R E S E E E X P E R I E N C E I N D E X : E - G O V E R N M E N T Q 3 2 0 1 7
3 W E B »
W E B C X D I P S S L I G H T LY I N Q 3
WEB
MOBILE SITES AND APPS
75.9down 0.1 points from
76 in Q2 2017
77.7down 1 point from 78.7
in Q2 2017
L E A R N M O R E »
L E A R N M O R E »
« T A B L E O F C O N T E N T S
Federal agencies often do not have direct competitors for the
services they provide. When it comes to government information,
however, many sources compete for citizens’ attention, whether
on issues of food safety, the environment or other topics.
In these cases, citizens may opt to interact with government, or they
may not. They may choose to trust agencies as reputable sources of
information or they may go elsewhere. Citizens also have a choice
whether or not to volunteer information that could be vital to federal
agencies, such as cases of food poisoning or identify theft.
The choices citizens make can affect the ability of federal agencies to
achieve their missions, and how much it will cost. It is vital, therefore,
for government agencies to focus on the citizens they serve and
provide the best possible customer experience.
Agencies that collect and use citizen feedback are ahead of the game
when it comes to creating a good customer experience and engaging
citizens in ways that help agencies accomplish their goals.
Eric Keller is a senior program manager for research at the Partnership for
Public Service, a non-profit, non-partisan organization that strives for a more
effective government for the American people.
INTRODUCTION
Citizen Choice: Why Creating a Great Customer Experience in Government MattersBY ERIC KELLER , PARTNERSHIP FOR PUBLIC SERVICE
F O R E S E E E X P E R I E N C E I N D E X : E - G O V E R N M E N T Q 3 2 0 1 7
4 W E B »« T A B L E O F C O N T E N T S

During the third quarter of 2017, we saw
major natural disasters, as well as a
live science lesson in the form of the
total solar eclipse. While there was no shortage
of information flowing from many sources, the
significant uptick in satisfaction to the most
improved site confirms that citizens turned
to the government for quality and accurate
information. The NOAA Satellite and Information
Service saw a 7-point increase to 74. Coming in
a close runner up is the digital experience of U.S.
Marines (marines.mll) with a 5-point increase
and an 83 FXI score that stands as a testament to
the investment made in the site in the areas of
content and usability.
The state of digital government experience
remained strong in Q3 2017 with an overall
FXI score of 75.9 and 77.6 for mobile, despite
a slight dip compared to the previous quarter.
The two top drivers of satisfaction for digital
government experience for the quarter were
Site Information at 45% (the extent to which
information is thorough and provides answers
to questions) and Information Browsing at 40%
(the ability to sort information, narrow choices,
and the usefulness of site features). Clear and
easy-to-understand content goes a long way,
and the Social Security Administration's “Extra
Help with Medicare Prescription Drug Plan
Costs” site took the top spot for most satisfied at
91 points.
When E-Government shines, so does the rest of
government, with 88% of citizens more likely
to use these websites as a primary resource and
55% more likely to return to those sites. And,
delivering a great digital experience directly
impacts the cost to serve. For example, one
federal agency ForeSee partners with saw a
5% decrease in calls to its contact center after
making improvements to its website that
answered citizen questions more efficiently.
The lowered call volume saved nearly $6
million annually. A focus on measuring citizen
experience and identifying the changes that will
have the biggest impact has the potential to
deliver millions in cost savings.
When Expert and Real-time Content Matters, People Turn to E-Government
F O R E S E E E X P E R I E N C E I N D E X : E - G O V E R N M E N T Q 3 2 0 1 7
5 W E B »« T A B L E O F C O N T E N T S

WEB UPDATEF O R E S E E E X P E R I E N C E I N D E X E - G O V E R N M E N T Q 3 2 0 1 7
66 M O B I L E »« I N T R O D U C T I O N
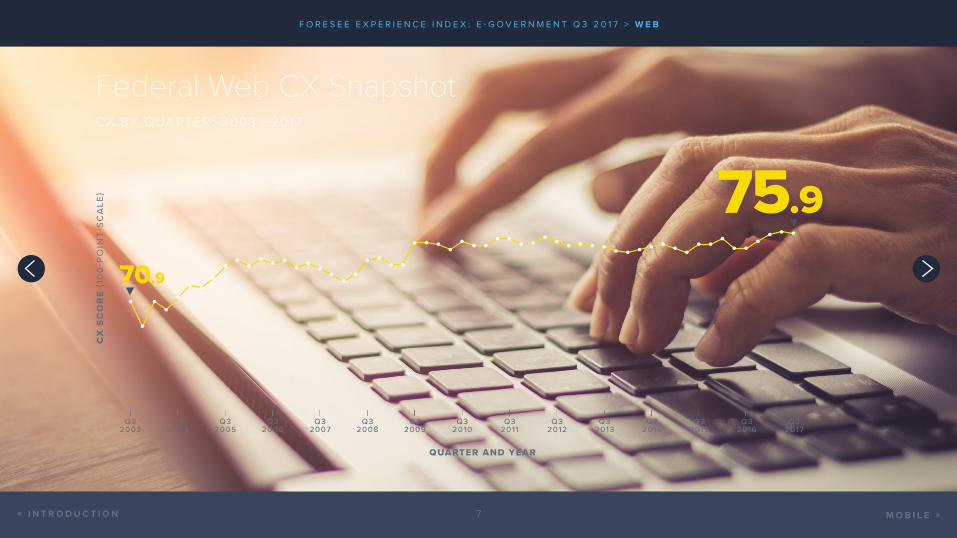
75.9
Federal Web CX SnapshotCX BY QUARTER: 2003 –2017
Q3 2007
Q3 2006
Q3 2005
Q3 2004
Q3 2003
Q3 2008
Q3 2009
Q3 2010
Q3 2011
Q3 2012
Q3 2013
Q3 2014
Q3 2015
Q3 2016
Q3 2017
CX
SC
OR
E (
100
-PO
INT
SC
ALE
)
QUARTER AND YEAR
70.9
F O R E S E E E X P E R I E N C E I N D E X : E - G O V E R N M E N T Q 3 2 0 1 7 > W E B
7« I N T R O D U C T I O N M O B I L E »
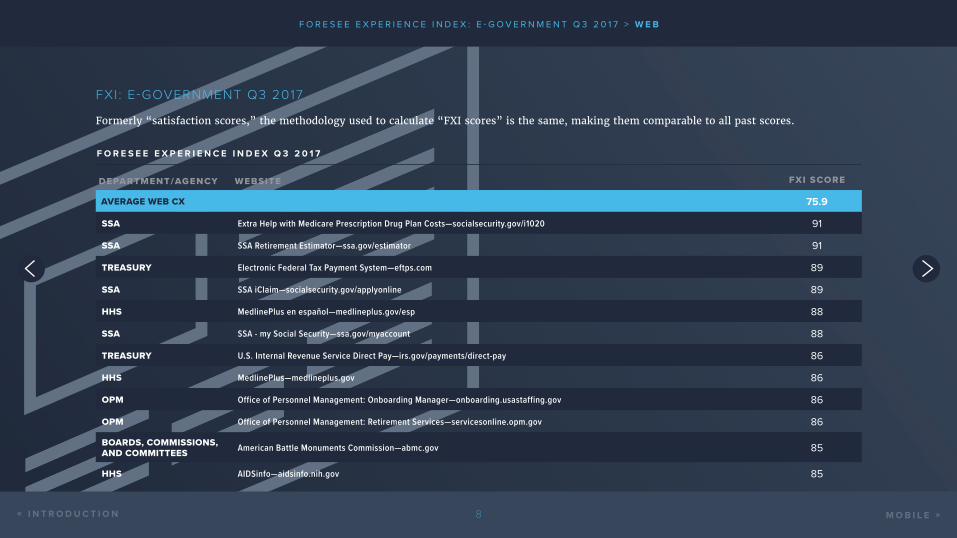
DEPARTMENT/AGENCY WEBSITE FXI SCORE
AVERAGE WEB CX 75.9
SSA Extra Help with Medicare Prescription Drug Plan Costs—socialsecurity.gov/i1020 91
SSA SSA Retirement Estimator—ssa.gov/estimator 91
TREASURY Electronic Federal Tax Payment System—eftps.com 89
SSA SSA iClaim—socialsecurity.gov/applyonline 89
HHS MedlinePlus en español—medlineplus.gov/esp 88
SSA SSA - my Social Security—ssa.gov/myaccount 88
TREASURY U.S. Internal Revenue Service Direct Pay—irs.gov/payments/direct-pay 86
HHS MedlinePlus—medlineplus.gov 86
OPM Office of Personnel Management: Onboarding Manager—onboarding.usastaffing.gov 86
OPM Office of Personnel Management: Retirement Services—servicesonline.opm.gov 86
BOARDS, COMMISSIONS, AND COMMITTEES American Battle Monuments Commission—abmc.gov 85
HHS AIDSinfo—aidsinfo.nih.gov 85
F O R E S E E E X P E R I E N C E I N D E X Q 3 2 0 1 7
FXI : E-GOVERNMENT Q3 2017
Formerly “satisfaction scores,” the methodology used to calculate “FXI scores” is the same, making them comparable to all past scores.
F O R E S E E E X P E R I E N C E I N D E X : E - G O V E R N M E N T Q 3 2 0 1 7 > W E B
8« I N T R O D U C T I O N M O B I L E »

DEPARTMENT/AGENCY WEBSITE FXI SCORE
DHS U.S. Citizenship and Immigration Services Resource Center—uscis.gov/portal/site/uscis/citizenship 85
SSA Social Security Business Services Online—ssa.gov/bso 85
HHS National Women's Health Information Center (NWHIC)—womenshealth.gov 85
DOD U.S. Navy—navy.mil 84
DOD Arlington National Cemetery—arlingtoncemetery.mil 83
DOD U.S. Air Force—af.mil 83
DOD U.S. Marines—marines.mil 83
DHS U.S. Citizenship and Immigration Services—uscis.gov/casestatus/landing.do 83
HHS National Institute of Diabetes and Digestive and Kidney Diseases—niddk.nih.gov 83
HHS National Library of Medicine Genetics Home Reference website—ghr.nlm.nih.gov 83
SSA SSA iClaim - Disability—ssa.gov/applyfordisability 83
DHS U.S. Citizenship and Immigration Services Español—uscis.gov/portal/site/uscis-es 83
HHS Centers for Disease Control and Prevention—cdc.gov 82
SEC U.S. Securities and Exchange Commission—investor.gov 82
OPM Office of Personnel Management—applicationmanager.gov 81
DOS U.S. Department of State Careers—careers.state.gov 81
CIA Central Intelligence Agency Careers—cia.gov/careers 81
Q 3 2 0 1 7 E - G O V E R N M E N T S A T I S F A C T I O N I N D E X ( C O N T I N U E D F R O M PA G E 8 )
F O R E S E E E X P E R I E N C E I N D E X : E - G O V E R N M E N T Q 3 2 0 1 7 > W E B
9« I N T R O D U C T I O N M O B I L E »

DEPARTMENT/AGENCY WEBSITE FXI SCORE
HHS National Institute of Arthritis and Musculoskeletal and Skin Diseases—niams.nih.gov 81
HHS National Institute of Child Health and Human Development—nichd.nih.gov 81
PBGC MyPBA—egov.pbgc.gov/mypba 80
NASA NASA main website—nasa.gov 80
HHS National Institute of Dental and Craniofacial Research—nidcr.nih.gov 80
DOC National Geodetic Survey, National Oceanic and Atmospheric Administration website—ngs.noaa.gov 80
HHS Substance Abuse and Mental Health Services Administration Publications Ordering—store.samhsa.gov 80
DOC NOAA National Weather Service—weather.gov 80
HHS Agency for Healthcare Research and Quality—ahrq.gov 79
FTC FTC Complaint Assistant website—ftccomplaintassistant.gov 79
HHS National Library of Medicine main website—nlm.nih.gov 79
DOC NOAA Tides and Currents—tidesandcurrents.noaa.gov 79
SSA SSA iAppeals - Disability Appeal—ssa.gov/disabilityssi/appeal.html 79
TREASURY U.S. Mint Online—usmint.gov 79
DHS U.S. Citizenship and Immigration Services—uscis.gov/e-verify 78
HHS InfoSida—infosida.nih.gov 78
Q 3 2 0 1 7 E - G O V E R N M E N T S A T I S F A C T I O N I N D E X ( C O N T I N U E D F R O M PA G E 9 )
F O R E S E E E X P E R I E N C E I N D E X : E - G O V E R N M E N T Q 3 2 0 1 7 > W E B
1 0« I N T R O D U C T I O N M O B I L E »

DEPARTMENT/AGENCY WEBSITE FXI SCORE
SSA Social Security Online—socialsecurity.gov 78
VA MyHealtheVet—myhealth.va.gov 78
DOI National Park Service—nps.gov 77
DOS Bureau of Consular Affairs—travel.state.gov 77
FTC Federal Trade Commission—ftc.gov 76
GAO Government Accountability Office—gao.gov 76
NRC U.S. Nuclear Regulatory Commission website—nrc.gov 76
DOL Bureau of Labor Statistics—bls.gov 75
DOD U.S. Department of Defense—defense.gov 75
DOJ Federal Bureau of Investigation—fbi.gov 75
DOJ National Institute of Justice—nij.gov 75
SBA Small Business Administration—sba.gov 75
DOC NOAA Satellite and Information Service—nesdis.noaa.gov 74
SEC U.S. Securities and Exchange Commission—sec.gov 74
DHS U.S. Citizenship and Immigration Services—uscis.gov/portal/site/uscis 74
VA U.S. Department of Veterans Affairs—blogs.va.gov 74
Q 3 2 0 1 7 E - G O V E R N M E N T S A T I S F A C T I O N I N D E X ( C O N T I N U E D F R O M PA G E 1 0 )
F O R E S E E E X P E R I E N C E I N D E X : E - G O V E R N M E N T Q 3 2 0 1 7 > W E B
1 1« I N T R O D U C T I O N M O B I L E »

DEPARTMENT/AGENCY WEBSITE FXI SCORE
DOT U.S. Department of Transportation—fhwa.dot.gov 73
USDA Economic Research Service—ers.usda.gov 73
DOT Federal Aviation Administration—faa.gov 73
USDA Food Safety and Inspection Service—fsis.usda.gov 73
PBGC U.S. Pension Benefit Guaranty Corp—pbgc.gov 73
HHS Office for Civil Rights—hhs.gov/ocr 72
USDA Recreation One-Stop—recreation.gov 72
DOJ Office for Victims of Crime—ovc.gov 72
DOC Bureau of Economic Analysis—bea.gov 71
HHS Substance Abuse and Mental Health Services Administration—samhsa.gov 71
OPM Recruitment website—usajobs.gov 71
ITC U.S. International Trade Commission—usitc.gov 71
HHS U.S. Food and Drug Administration—fda.gov 70
DOS U.S. Department of State—state.gov 69
USDA Natural Resources Conservation Service—nrcs.usda.gov 69
HHS ClinicalTrials.gov—clinicaltrials.gov 68
Q 3 2 0 1 7 E - G O V E R N M E N T S A T I S F A C T I O N I N D E X ( C O N T I N U E D F R O M PA G E 1 1 )
F O R E S E E E X P E R I E N C E I N D E X : E - G O V E R N M E N T Q 3 2 0 1 7 > W E B
1 2« I N T R O D U C T I O N M O B I L E »

Q 3 2 0 1 7 E - G O V E R N M E N T S A T I S F A C T I O N I N D E X ( C O N T I N U E D F R O M PA G E 1 2 )
DEPARTMENT/AGENCY WEBSITE FXI SCORE
DOC U.S. Patent and Trademark Office—uspto.gov 67
TREASURY U.S. Alcohol and Tobacco Tax and Trade Bureau—ttb.gov 67
DOD U.S. Defense Health Agency—health.mil 66
DOC U.S. Census Bureau—census.gov 65
TREASURY U.S. Department of the Treasury—treasury.gov 65
USDA U.S. Forest Service—fs.usda.gov 64
NARA National Archives and Records Administration—archives.gov 64
DOJ Bureau of Justice Statistics—bjs.gov 63
HHS Health Resources and Services Administration—hrsa.gov 63
TREASURY U.S. Department of the Treasury Office of Financial Stability—treasury.gov/initiatives/financial-stability 62
HHS U.S. Health and Human Services E-Grant—grants.gov 62
DOD TRICARE—tricare.mil 60
VA U.S. Department of Veterans Affairs—va.gov 60
TREASURY U.S. Internal Revenue Service—irs.gov 59
DOE U.S. Department of Education—ed.gov 59
DOD Center for Development of Security Excellence 56
DOD U.S. Defense Logistics Agency—dla.mil 51
F O R E S E E E X P E R I E N C E I N D E X : E - G O V E R N M E N T Q 3 2 0 1 7 > W E B
1 3« I N T R O D U C T I O N M O B I L E »
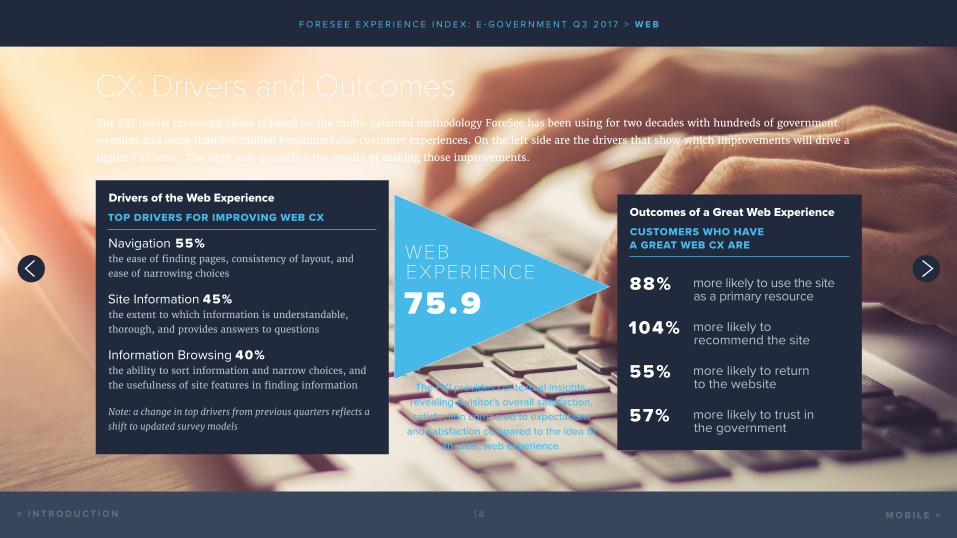
Drivers of the Web Experience TOP DRIVERS FOR IMPROVING WEB CX
Navigation 55% the ease of finding pages, consistency of layout, and ease of narrowing choices
Site Information 45% the extent to which information is understandable, thorough, and provides answers to questions
Information Browsing 40% the ability to sort information and narrow choices, and the usefulness of site features in finding information
Note: a change in top drivers from previous quarters reflects a
shift to updated survey models
Outcomes of a Great Web Experience CUSTOMERS WHO HAVE A GREAT WEB CX ARE
88% more likely to use the site as a primary resource
104% more likely to recommend the site
55% more likely to return to the website
57% more likely to trust in the government
WEB EXPERIENCE
75.9 F X I S C O R E
The FXI model presented below is based on the multi-patented methodology ForeSee has been using for two decades with hundreds of government
websites and more than 100 million benchmarkable customer experiences. On the left side are the drivers that show which improvements will drive a
higher FXI score. The right side quantifies the results of making those improvements.
CX: Drivers and Outcomes
Numbers represent the % of federal sites that register this driver as a first or second priority for improvement.
The FXI provides contextual insights, revealing a visitor's overall satisfaction, satisfaction compared to expectations
and satisfaction compared to the idea of an ideal, web experience.
F O R E S E E E X P E R I E N C E I N D E X : E - G O V E R N M E N T Q 3 2 0 1 7 > W E B
1 4« I N T R O D U C T I O N M O B I L E »

MOBILE UPDATEF O R E S E E E X P E R I E N C E I N D E X E - G O V E R N M E N T Q 3 2 0 1 7
1 51 5« W E B A B O U T T H E F X I »

SATISFACTION WITH MOBILE SITES AND APPS
With citizens increasingly using mobile
devices to access the Government’s digital
channels, ForeSee initiated the Mobile Federal
Government Benchmark in Q4 2013, making
this our 17th consecutive report on Federal
mobile satisfaction.
According to Pew, 77% of Americans now own
smartphones, more than double the 35% in 2011.
Accordingly, Federal agencies, departments
and programs are quickly gaining mobile
sophistication. Mobile gov (mgov) outperforms
mobile retail (77.7 vs. 77). However, as
citizens’ expectations rise, so will the need to
improve further.
The following table shows the average
aggregate CX score for the Government’s
mobile websites and apps for Q3 2017, as well
as how the scores from this relatively new
index compare with scores from other indexes.
Q3 2017
Number of Mobile Websites Measured 23
Number of Responses Collected 134,062
Average E-Government Mobile FXI Score 77.7
Highest Mobile FXI Score 88
Lowest Mobile FXI Score 61
Number of E-Government Mobile Websites With Excellent Rating (80 or higher) 11
Number of E-Government Mobile Websites With Lowest Satisfaction (70 or lower) 4
M O B I L E S I T E S A N D A P P S
1 6
F O R E S E E E X P E R I E N C E I N D E X : E - G O V E R N M E N T Q 3 2 0 1 7 > M O B I L E & A P P S
« W E B A B O U T T H E I N D E X »
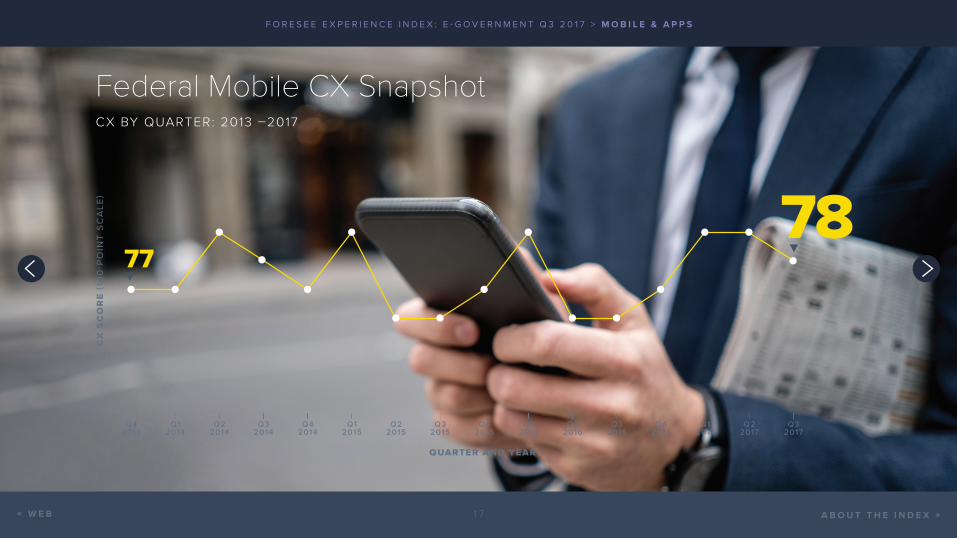
Federal Mobile CX SnapshotCX BY QUARTER: 2013 –2017
CX
SC
OR
E (
100
-PO
INT
SC
ALE
) 7877
Q42013
Q22014
Q1 2014
Q42014
Q32014
Q22015
Q1 2015
Q3 2015
Q42015
Q1 2016
Q22016
Q32016
Q4 2016
Q1 2017
Q2 2017
Q32017
QUARTER AND YEAR
1 7
F O R E S E E E X P E R I E N C E I N D E X : E - G O V E R N M E N T Q 3 2 0 1 7 > M O B I L E & A P P S
« W E B A B O U T T H E I N D E X »

Drivers of the Mobile Experience TOP DRIVERS FOR IMPROVING MOBILE CX
Navigation 74% : the ease of finding pages, consistency of layout, and ease of narrowing choices
Site Information 43% : the extent to which information is understandable, thorough, and provides answers to questions
Information Browsing 39% : the ability to sort information and narrow choices, and the usefulness of site features in finding information
Look and Feel 22% : the visual appeal of the website and its consistency throughout the website
Note: a change in top drivers from previous quarters reflects
a shift to updated survey models.
Outcomes of a Great Mobile ExperienceCUSTOMERS WHO HAVE A GREAT MOBILE CX ARE
80% more likely to use the site or app as a primary resource
138% more likely to recommend the site or app
93% more likely to return to the site or app
MOBILE EXPERIENCE
77.7F X I S C O R E
The FXI model presented below is based on the multi-patented methodology ForeSee has been using for two decades with hundreds of government
websites and more than 100 million benchmarkable customer experiences. On the left side are the drivers that show which improvements will drive a
higher FXI score. The right side quantifies the results of making those improvements.
Mobile E-Gov CX: Drivers and Outcomes
1 8
F O R E S E E E X P E R I E N C E I N D E X : E - G O V E R N M E N T Q 3 2 0 1 7 > M O B I L E & A P P S
Numbers represent the % of federal sites that register this driver as a first or second priority for improvement.« W E B A B O U T T H E I N D E X »
ABOUT THIS REPORT
The ForeSee Experience Index: E-Gov Q3 2017 Update (formerly called the
ForeSee E-Government Satisfaction Index) is a comprehensive reflection
of the citizen experience with Federal Government websites. It is a critical
measure for evaluating the success and performance of the Federal
Government’s online initiatives. ForeSee collected and measured more than
180,000 responses across the Federal Government websites in this Index
during Q3 2017. These high numbers demonstrate citizens’ willingness to
share their experiences to help agencies and departments improve. The use
of the ForeSee methodology and technology then enables agency leaders
to determine which website and app improvements will have the greatest
impact on usage.
F O R E S E E E X P E R I E N C E I N D E X : E - G O V E R N M E N T Q 3 2 0 1 7
1 9« M O B I L E

ABOUT THE AUTHORS
Dave Lewan
Dave Lewan manages ForeSee’s public sector business,
including its relationships with Federal and state
government departments and agencies, nonprofit
organizations, and higher education institutions.
In 2017, Dave is serving as ForeSee’s liaison with the Partnership for
Public Service for the Center for Presidential Transition to educate 4,000
appointees from the private sector entering employment with the Federal
Government as part of the new administration. Prior to joining ForeSee in
2009, he led in key strategic areas at ADP, SalesLogix, Ultimate Software
and Ceridian. Dave graduated from the University of Minnesota with a
Bachelor of Arts in Speech Communications.
Eric Keller
Eric Keller joined the Partnership for Public Service
in October 2013 as a research manager. He manages
a portfolio of high-visibility research activities and
products, including project conceptualization and design,
budgeting, staffing, data collection and analysis, and report writing.
He also leads the Partnership’s work to improve customer experience
with Federal services.
Before joining the Partnership, Eric worked at the U.S. Department
of Health and Human Services (HHS) as a presidential management
fellow and grants policy analyst. Eric holds a Master of Public Policy
from George Mason University and a Bachelor of Arts in Political
Science from Wake Forest University.
F O R E S E E E X P E R I E N C E I N D E X : E - G O V E R N M E N T Q 3 2 0 1 7
2 0« M O B I L E
ABOUT THE RESEARCH ASSISTANT
Anna Salomonsson
Anna Salomonsson manages benchmark processes and related thought
leadership projects at ForeSee, including seasonal consumer insight
studies. She has expanded benchmark offerings to provide better context
to clients’ performance scores.
Before joining ForeSee in 2015, Anna held various positions at a breast
cancer research lab at the University of Michigan and in market research
at The Mars Agency. Anna graduated from the University of Michigan
with a Bachelor of Arts in Communications.
2 1
F O R E S E E E X P E R I E N C E I N D E X : E - G O V E R N M E N T Q 3 2 0 1 7
« M O B I L E

ABOUT FORESEE
ForeSee helps government departments, agencies,
and programs prioritize enhancements to the citizen
experience with certainty. The ForeSee® CX Suite allows
public-sector organizations to manage all their customer
experience needs from one place, capturing the entire
customer journey and prioritizing their most critical
CX issues. ForeSee clients include hundreds of federal,
state and local organizations using VOC programs to
measure performance and prioritize changes to enhance
the citizen experience and lower costs. Founded in 2001,
ForeSee is headquartered in Ann Arbor, MI and has
offices in Washington D.C., New York, San Francisco,
St. Louis, Cleveland, Vancouver and London. For more
information, visit www.foresee.com.
Visit www.foresee.com/gov to learn more about ForeSee’s government solutions.
F O R E S E E E X P E R I E N C E I N D E X : E - G O V E R N M E N T Q 3 2 0 1 7
F S 1 6 2 7 - 0 5 1 7« T A B L E O F C O N T E N T S