foresee experience index net promoter report · 2018-07-12 · foresee experience index net...
TRANSCRIPT

© 2018 ForeSee
F O R E S E E® E X P E R I E N C E I N D E X
N E T P R O M O T E R S C O R E † R E P O R T
†Net Promoter, Net Promoter System, Net Promoter Score, NPS and the NPS-related emoticons are registered trademarks of Bain & Company, Inc., Fred Reichheld and Satmetrix Systems, Inc.

F O R E S E E E X P E R I E N C E I N D E X : N E T P R O M O T E R S C O R E ℠ R E P O R T
2
The State of NPS
In the 15 years since Net Promoter Score℠ (NPS®)† was introduced, tracking and
improving it has become a top initiative and a closely watched KPI for executives.
It’s easy to understand why: NPS offers a simple, one-question formula for better
understanding customers.
Because so much is riding on NPS, access to real customer data and expert
analysis is vital. This report is based on our annual survey of more than 40,000
retail consumer experiences with brands in the U.S., U.K., and Canada. With that
input, we show you who's winning and who's coming up short — in store, web,
and mobile channels (pages 4-5). And we dive deeper, adding insight into what
customers want from retailers and data on how NPS differs across geographies,
gender, and other segmentations (page 9).
We’ve been collecting and publishing retail benchmarks for 16 years. The data and
insights that follow will help you understand consumer sentiment about your brand
and NPS in the retail industry. It will also help you develop strategies to improve NPS
and, by extension, the broader customer experience.
ForeSee can complement and extend NPS measurements with a proven methodology
that delivers actionable intelligence to drive business results. To learn about NPS with
predictive drivers, see page 10.
% PROMOTERS – % DETRACTORS = NET PROMOTER SCORE
†Net Promoter, Net Promoter System, Net Promoter Score, NPS and the NPS-related emoticons are registered trademarks of Bain & Company, Inc., Fred Reichheld and Satmetrix Systems, Inc.

F O R E S E E E X P E R I E N C E I N D E X : N E T P R O M O T E R S C O R E ℠ R E P O R T
3
Retail NPS RankingsHow 40,000 shoppers rate 50 leading brands
42 40 36 35 34 33 33 33 33 32
30 30 29 27 27 26 25 24 24 23
23 22 22 22 22 21 21 18 18 17
17 16 16 16 15 13 11 11 11 11
8 8 5 3 1 -2 -3 -4 -4 -8
F O R E S E E E X P E R I E N C E I N D E X : N E T P R O M O T E R S C O R E ℠ R E P O R T
4
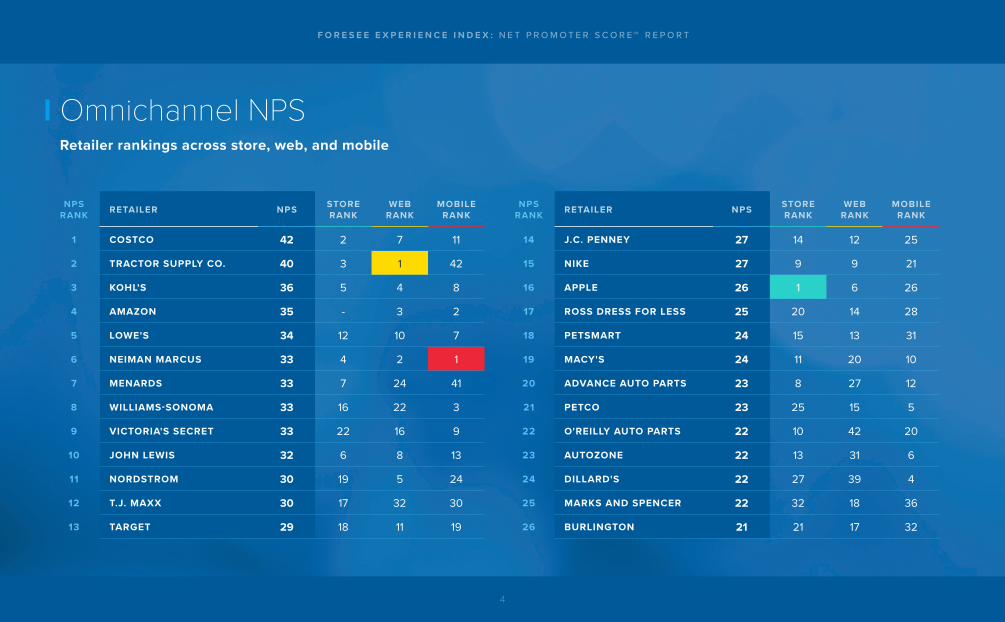
Omnichannel NPSRetailer rankings across store, web, and mobile
NPS RANK RETAILER NPS STORE
RANKWEB
RANKMOBILE
RANK
1 COSTCO 42 2 7 11
2 TRACTOR SUPPLY CO. 40 3 1 42
3 KOHL'S 36 5 4 8
4 AMAZON 35 - 3 2
5 LOWE'S 34 12 10 7
6 NEIMAN MARCUS 33 4 2 1
7 MENARDS 33 7 24 41
8 WILLIAMS-SONOMA 33 16 22 3
9 VICTORIA'S SECRET 33 22 16 9
10 JOHN LEWIS 32 6 8 13
11 NORDSTROM 30 19 5 24
12 T.J. MAXX 30 17 32 30
13 TARGET 29 18 11 19
NPS RANK RETAILER NPS STORE
RANKWEB
RANKMOBILE
RANK
14 J.C. PENNEY 27 14 12 25
15 NIKE 27 9 9 21
16 APPLE 26 1 6 26
17 ROSS DRESS FOR LESS 25 20 14 28
18 PETSMART 24 15 13 31
19 MACY'S 24 11 20 10
20 ADVANCE AUTO PARTS 23 8 27 12
21 PETCO 23 25 15 5
22 O'REILLY AUTO PARTS 22 10 42 20
23 AUTOZONE 22 13 31 6
24 DILLARD'S 22 27 39 4
25 MARKS AND SPENCER 22 32 18 36
26 BURLINGTON 21 21 17 32

F O R E S E E E X P E R I E N C E I N D E X : N E T P R O M O T E R S C O R E ℠ R E P O R T
5
Omnichannel NPSRetailer rankings across store, web, and mobile
NPS RANK RETAILER NPS STORE
RANKWEB
RANKMOBILE
RANK
27 WALGREEN CO. 21 26 23 29
28 GAMESTOP 18 23 21 16
29 CVS CAREMARK 18 40 40 14
30 BED BATH & BEYOND 17 24 33 22
31 WALMART 17 28 28 33
32 BOOTS 16 36 26 18
33 NEXT 16 33 19 23
34 HOME DEPOT 16 34 30 34
35 RITE AID 15 45 43 17
36 OFFICE DEPOT 13 37 25 15
37 BEST BUY 11 30 35 27
38 FOOT LOCKER 11 31 29 35
NPS RANK RETAILER NPS STORE
RANKWEB
RANKMOBILE
RANK
39 H&M 11 42 34 37
40 DICK'S SPORTING GOODS 11 35 38 39
41 ZARA 8 29 50 49
42 GAP 8 38 36 44
43 CANADIAN TIRE 5 39 48 46
44 STAPLES 3 41 44 47
45 TOYS R US 1 43 45 43
46 FOREVER 21 -2 48 37 38
47 B&Q -3 44 49 50
48 TESCO -4 47 41 48
49 CARPHONE WAREHOUSE -4 46 46 40
50 SEARS -8 49 47 45
F O R E S E E E X P E R I E N C E I N D E X : N E T P R O M O T E R S C O R E ℠ R E P O R T
6
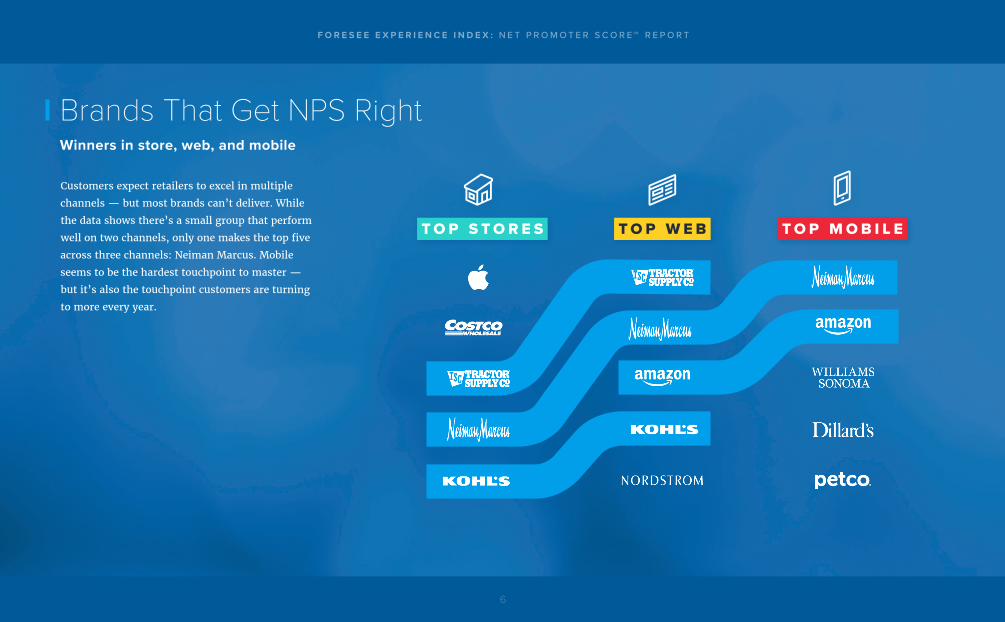
T O P S T O R E S T O P W E B T O P M O B I L E
Brands That Get NPS Right Winners in store, web, and mobile
Customers expect retailers to excel in multiple
channels — but most brands can’t deliver. While
the data shows there’s a small group that perform
well on two channels, only one makes the top five
across three channels: Neiman Marcus. Mobile
seems to be the hardest touchpoint to master —
but it’s also the touchpoint customers are turning
to more every year.
F O R E S E E E X P E R I E N C E I N D E X : N E T P R O M O T E R S C O R E ℠ R E P O R T
7
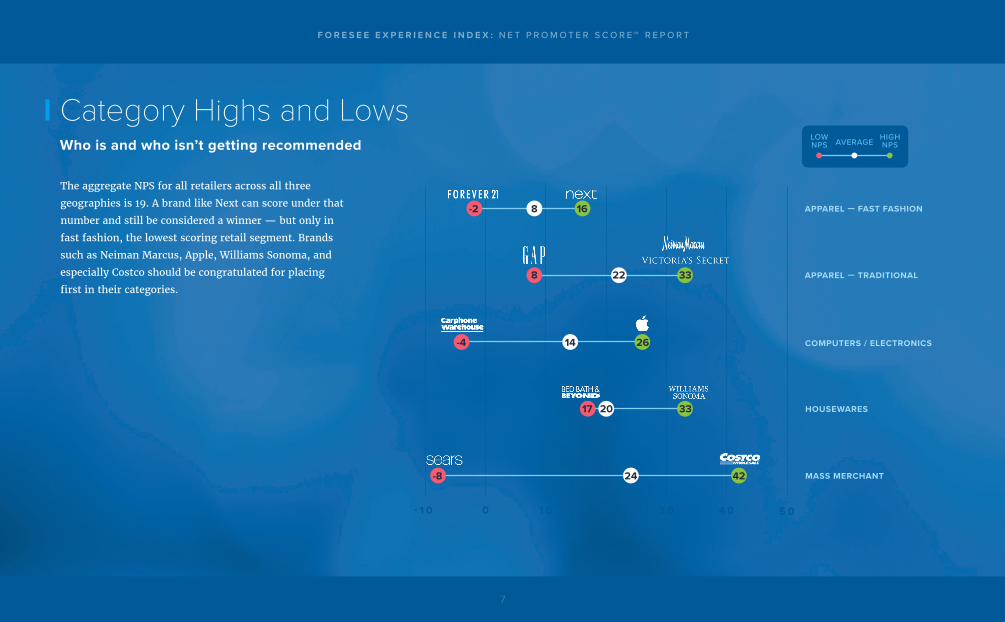
Category Highs and Lows Who is and who isn’t getting recommended
The aggregate NPS for all retailers across all three
geographies is 19. A brand like Next can score under that
number and still be considered a winner — but only in
fast fashion, the lowest scoring retail segment. Brands
such as Neiman Marcus, Apple, Williams Sonoma, and
especially Costco should be congratulated for placing
first in their categories.
- 1 0 0 1 0 2 0 3 0 4 0 5 0
APPAREL — FAST FASHION
APPAREL — TRADITIONAL
COMPUTERS / ELECTRONICS
HOUSEWARES
MASS MERCHANT
LOWNPS AVERAGE
HIGHNPS
-2 8 16
8
-4
-8
17
22
14
24
20
33
26
42
33

F O R E S E E E X P E R I E N C E I N D E X : N E T P R O M O T E R S C O R E ℠ R E P O R T
8
Category NPS RankingsHow industry subsets are meeting customer needs
Pet and auto shoppers come to those categories with a built-in
emotional connection, giving retailers an opportunity to provide
memorable experiences. Conversely, fast fashion and tech are
more volatile markets, and sell to customers who are more
interested in great deals on new models and less loyal to brands.
PET SUPPLIES PETSMART, PETCO 2424% of shoppers have a separate holiday gift budget for pets
AUTO PARTS & ACCESSORIESADVANCE AUTO PARTS, AUTOZONE, O’REILLY AUTO PARTS 23Purchasers who start in desktop are just as likely to stay in desktop as they are to go to a store
APPAREL — TRADITIONALNORDSTROM, MACY’S, NEIMAN MARCUS, ETC. 2239% said brand familiarity draws them to these retailers
HOUSEWARESWILLIAMS SONOMA, BED BATH & BEYOND 2054% said a loyalty program is very important in their purchase decision
18Nearly 80% of all purchases are made in store
COMPUTERS & ELECTRONICSAPPLE, GAMESTOP, BEST BUY, CARPHONE WAREHOUSE 14More than 25% use ratings and reviews websites to help with purchase decisions
APPAREL – FAST FASHION H&M, ZARA, FOREVER 21, ETC. 816% visit fast fashion stores based on word-of-mouth recommendations
NPS
HOME IMPROVEMENTLOWE’S, MENARDS, HOME DEPOT, B&Q

F O R E S E E E X P E R I E N C E I N D E X : N E T P R O M O T E R S C O R E ℠ R E P O R T
9
Segmenting NPS A deeper look reveals weak spots — and opportunities
G E N D E R
Men are far less likely to recommend, while women
are a bit above the retail average of 19. Delving into
open ends and complementing NPS with deeper data
can help retailers boost their standing with guys.
G E O G R A P H Y
U.S. shoppers give the highest marks, while Canadian
numbers plunge into the single digits — a reflection of
each country’s level of commitment to improving the
customer experience.
G E N E R A T I O N
The younger the shopper, the less impressed they are
with retail experiences. It’s a wake-up call for all brands:
Tomorrow’s buyers have new expectations, and earning
their loyalty will require rethinking the retail experience.
U . S . U . K .
C A N A D A
27 10
6
F E M A L E M A L E
22 12 22B A B Y B O O M E R S
8G E N E R A T I O N Z
17M I L L E N N I A L S
19G E N E R A T I O N X

F O R E S E E E X P E R I E N C E I N D E X : N E T P R O M O T E R S C O R E ℠ R E P O R T
1 0
NPS with Predictive Drivers Know the benefits before you act
NPS with predictive drivers from ForeSee allows you to focus
on the drivers of experience to improve outcomes. Built right
into the ForeSee® CX Suite℠, this prescriptive capability uses
ForeSee's proven cause-and-effect model to allow you to:
• Know with certainty what to do next and why
• Quantify NPS at the touchpoint level for
CX improvements across the journey
• Benchmark NPS and drivers against competitors,
and by channel, device, or touchpoint
• Deliver NPS insights to every stakeholder
in the organization
D I G I T A L
S T O R E
MERCHANDISE
PRICE
PRODUCT DESCRIPTIONS
PRODUCT FINDING
ENVIRONMENT
MERCHANDISE
PRICE
SERVICE
1922%
37%41%
NPS
DETRACTORS PASSIVES PROMOTERS

F O R E S E E E X P E R I E N C E I N D E X : N E T P R O M O T E R S C O R E ℠ R E P O R T
1 1
NPS and CX Insights for Every Industry See how businesses compete and win on customer experience
NPS is important across industries. ForeSee has published complementary
customer experience reports in Retail, Banking, Energy and Utilities, and Public
Sector. Click on the report icons below to download those reports and extend your
customer experience insights.
P U B L I C S E C T O R B A N K I N G R E T A I L E N E R G Y & U T I L I T I E S
To go deeper into the data, schedule a customized briefing: foresee.com/npsbriefing
About the ForeSee Experience IndexThe ForeSee Experience Index (FXI) is based on survey data collected from over
40,000 shoppers about their store, web, and mobile experiences. The study was
completed using a consumer panel representative of the general population fielded
in the fourth quarter of 2017. The retailers were chosen using the 2017 Deloitte
Global Powers of Retailing study, which ranks global omnichannel retailers by
revenue. ForeSee selected the top 50 non-grocery brands with operations in
the U.S., U.K., or Canada for the FXI. Net Promoter Score and NPS are registered
trademarks of Bain & Company, Inc.
ForeSee is the pioneer of voice of customer (VOC) solutions that measure and
improve the customer experience. ForeSee CX Suite is powered by the only proven
causal model that accurately connects CX improvements to business outcomes,
empowering business leaders with strategic and tactical CX decisioning. Thousands
of leading organizations in retail, energy and utilities, financial services, and the
public sector rely on ForeSee to give certainty to their CX initiatives.
ForeSee® is a registered trademark of ForeSee Results, Inc.