net promoter score - pure · net promoter score is a new customer metric that links word of mouth...
TRANSCRIPT
Eindhoven University of Technology
MASTER
Factors which influence net promoter score in a multichannel service context
Hoogendorp, O.
Award date:2010
Link to publication
DisclaimerThis document contains a student thesis (bachelor's or master's), as authored by a student at Eindhoven University of Technology. Studenttheses are made available in the TU/e repository upon obtaining the required degree. The grade received is not published on the documentas presented in the repository. The required complexity or quality of research of student theses may vary by program, and the requiredminimum study period may vary in duration.
General rightsCopyright and moral rights for the publications made accessible in the public portal are retained by the authors and/or other copyright ownersand it is a condition of accessing publications that users recognise and abide by the legal requirements associated with these rights.
• Users may download and print one copy of any publication from the public portal for the purpose of private study or research. • You may not further distribute the material or use it for any profit-making activity or commercial gain

Eindhoven, August 2010
“Factors which influence Net Promoter Score in a
Multichannel Service Context”
by
O.Hoogendorp
BSc Industrial Engineering & Management Science
Student identity number 0550072
In fulfillment of the requirements for the degree of:
Master of Science
In Innovation Management
Eindhoven University of Technology (TU/e)
First Supervisor: Dr. A. De Jong
Second Supervisor: Dr. K.H. van Donselaar
KPN ZM KS&O CSO Customer Experience Center
First Supervisor: Michel Degeling

ii
I Abstract
Purpose – Current methods available measure service quality on individual channels. This study aims
to combine these different measures into one model and extent it with the service quality across
different channels. The resulting model enables companies to pin-point exactly where improvements
in the multichannel system should be made in order to enhance Net Promoter Score.
Design/methodology/approach – A conceptual model was developed based on the service marketing
literature. This conceptual model was then transformed into a measurement model, specifically for
KPN customers within the SME segment. This model was empirically validated with the use of
structural equation modeling.
Findings – The results indicate that a model which integrates the service quality constructs of separate
channels with the service quality across channels can be used to explain the variance in Net Promoter
Score. The customer‟s perception of the service quality across channels is an important driver of Net
Promoter Score. The experience on individual channels was found to be less important, only an
encounter with the customer contact center directly impact Net Promoter Score. For the experience
with the other two channels: website and store no direct relationship with Net Promoter Score was
found.
Practical implications – Companies like KPN who are competing within a multichannel service
context should focus on integrating different channels into one multichannel system. Because a
positive customer experience across channel is an important driver of Net Promoter Score.
Theoretical implications – This study contributes to the service marketing literature in two ways.
First by determining what factors drive Net Promoter Score. Secondly, by providing empirical
evidence that service quality should be measured on and across channels. Since service quality across
channels as perceived by the customer plays a significant role in the formation of overall customer
evaluations represented by Net Promoter Score.

iii
II Preface
This master thesis is the result of my graduation project conducted at KPN. The project is the
conclusion of the master program Innovation Management at the Eindhoven University of Technology
(TU/e). The project was supervised by the department of Industrial Engineering & Innovation
Sciences (IE&IS).
For me, this journey has come to an end. I look back with great excitement on my master thesis project
and, in particular, the period spent at KPN. It has been a period of great personal development both
academically and professionally. All of this would not have been possible without the help of so many
people.
First of all, I would like to thank my university supervisors Dr. Ad de Jong and Dr. Karel van
Donselaar for their support and critiques. Combining theory with practice was a challenging endeavor
which I could not have finished without your guidance.
Also I would like to say thanks to Michel Degeling, my KPN supervisor. His unrelenting enthusiasm
in support of the project, professional experience, critical mind and relaxed approach all contributed to
my thesis. The people from customer satisfaction, especially Michiel van Rossum for his helpfulness
in developing and deploying the measurement tool.
Finally, I´m grateful to everybody that supported me – intellectually, financially, mentally – during my
graduation project and the rest of my study. These people include my family, who had so much
patience with me, and my great friends, who were always there for distraction and memorable
moments.
iv
III Management summary
Introduction
Net Promoter Score is a new customer metric that links word of mouth both positive and negative
to company growth. Current research on Net Promoter Score is limited but has produced promising
results on the link with company growth. The need for research that determines the drivers of Net
Promoter Score has initiated this study. The existing literature on service quality provides the
conceptual framework. Traditionally service quality is measured in the face-to-face channel, however
recently many companies have increased the number of channels they use to serve clients and as a
result, the customer experience is increasingly multichannel. Therefore this study combines the
experience on and across channels into one model to evaluate where improvements in performance of
the multichannel service system, have the largest effect on Net Promoter Score and ultimately
company growth.
Research methodology
The research methodology is divided into two parts, the exploratory phase and the confirmatory
phase. In the first step a conceptual model was developed based on a literature review. This
conceptual model integrates the new concept of Integration Quality proposed by Sousa and Voss
(2004) with the extensive research on Service Quality in order to determine the impact on the
dependent variable Net Promoter Score (Figure 1). The confirmatory phase of this study is performed
at the customer experience department of KPN and focuses on customers of small and medium
enterprises (SME). In the confirmatory phase the conceptual model is quantitative validated through
an online survey.
v
Results
The results of the analysis in SmartPLS indicate that there is a relationship between Net Promoter
Score and the multichannel constructs Channel service configuration and Multi-channel consistency.
For the service quality on individual channels only a relationship between customer contact center
service quality and Net Promoter Score could be found. The individual experience of customers with
the KPN business center and the website both do not influence the customers´ willingness to
recommend KPN as a company to others.
For the online-survey 619 useable responses were received, which constitutes a response rate of
6.61%. A substantial share of the respondents that has been in contact with the company can be
described as being multichannel. 43.6 percent of the population and 57 percent of the customers that
have been in contact with KPN in past six months can be described as being multichannel.
The data analysis showed that considerable amounts of data were missing, which can partly be
attributed to the inclusion of the option “not applicable” to each scale question. To deal with this, three
separate scenario´s were formulated to perform the data analysis. This has the advantage of giving an
indication of the robustness of the analysis by examining the results of the different combination of
imputation techniques. After constructing three separate datasets, the missing data were imputed using
EM-imputation. It should be noted that a complete case scenario was not possible due to the limited
amount of complete cases.
The hypotheses were tested with use of SmartPLS because this technique makes no assumptions
about the underlying data distributions and it is well applicable for smaller data sets. After item
validity, construct validity and discriminant validity were confirmed, hypotheses could be tested.
Conclusions
This study shows that the overall evaluations of customers represented by Net Promoter Score are
only partially influenced by the individual experience on separate channels. Whereas Payne and Frow
(2004) assert that the service encounter where the customer interacts with the supplier presents the
most crucial opportunities to leverage advantage. In this research the only service encounter for which
this holds is the customer contact center. This means that meeting or exceeding customer´s

vi
expectations on this channel is more important than for the other service encounters where no direct
relationship with Net Promoter Score was found.
The importance of the multichannel experience is clearly demonstrated in this study. For both
channel service configuration and Multi-channel consistency have a strong and statistically significant
effect on Net Promoter Score. Thereby, providing evidence that customer´s value a seamless and
consistent customer experience at every channel. Furthermore, this study shows that the customer
experience needs to be considered across all channels instead of measuring the experience on separate
channels.
Recommendations
The results and conclusions of this study also call for managerial recommendations to KPN. The
results indicate that for companies - like KPN - that are competing within a multichannel service
context the positioning of channels and the consistency in the customer experience across channels is
crucially important. On these two dimensions it is suggested that KPN should closely monitor the
introduction of a CRM system by including the multichannel questions of this study into the current
customer research. This can provide insights into whether the investments in this system are paying
off, and how the results can be enhanced. Also investments aimed at improving the customer
experience with the customer contact center should be prioritized over improvements in the other
channels. Especially since the service quality of the customer contact center is lower than service
quality at the other channels. Also KPN should look for ways to increase the adoption of the self
service technology it deploys on the website.

vii
IV Table of content
I Abstract ........................................................................................................... ii
II Preface ........................................................................................................... iii
III Management summary .................................................................................. iv
IV Table of content ............................................................................................ vii
1 Introduction .................................................................................................... 1
1.1 Statement of the Research Question ...................................................... 2
1.2 Document Outline.................................................................................. 4
2 Theoretical framework ................................................................................... 5
2.1 Net Promoter Score ............................................................................... 5
2.2 Service quality ....................................................................................... 9
2.3 Conclusion ........................................................................................... 19
3 Conceptual model ........................................................................................ 21
3.1 Introduction ......................................................................................... 21
3.2 Hypotheses ........................................................................................... 23
4 Research Methodology ................................................................................. 29
4.1 Context of the study ............................................................................. 29
4.2 Research objective ............................................................................... 31
4.3 Research Approach .............................................................................. 32
4.4 The Online Questionnaire .................................................................... 36
5 Research results ............................................................................................ 40
5.1 Sample size characteristics .................................................................. 40
5.2 Data analysis ........................................................................................ 44
5.3 Validation of measurement model ...................................................... 46
5.4 Hypotheses testing .............................................................................. 49
5.5 Alternative model ................................................................................ 51
6 Conclusions .................................................................................................. 53
6.1 Theoretical conclusions ....................................................................... 53
6.2 Practical conclusion and managerial recommendations...................... 55
6.2 Practical conclusion and managerial recommendations...................... 55
6.3 Answering the Research Questions ..................................................... 56
References ........................................................................................................... 60
Appendix A: Results ........................................................................................... 66
Appendix B: The Measurement Model ............................................................... 77
Appendix C: Model of Gustafsson ...................................................................... 81
Appendix D: Controlling for Net Promoter Score groups .................................. 85
1
1 Introduction
Net Promoter Score
In recent years companies in many industries have seen profitability come under increased pressure
as a result of trends like: market saturation intense competition and the threat of commoditization. As
a result many companies are shifting their focus to customer loyalty to provide profitable growth
(Keiningham et al., 2007). The method increasingly adopted by companies to capture and improve
loyalty on all different levels within the organization is the new customer metric Net Promoter Score.
Unlike other customer metrics it doesn‟t focus on quality, satisfaction or value; it‟s a metric that links
word of mouth both positive and negative to company growth. This metric is obtained by asking
customer the following likelihood recommendation question: “How likely is it that you would
recommend [company X] to a friend or colleague on an 11-point scale”. The Net Promoter Score
(NPS) is then calculated as follows: the proportion of respondents rating the company a 6 or less
called “Detractors” is subtracted from the proportion of respondents rating the company a 9 or 10
called “Promoters”; this difference represents a company´s NPS; Net Promoter Score = % promoters –
% detractors (Reichheld, 2003) . The rapid adoption of this metric can be attributed for a large part on
the claim that it‟s the only customer metric that‟s an accurate predictor of company growth reflected in
the title of the article in the Harvard business review “The One Number You Need to Grow”. Research
on net promoter to date has focused on this claim (Keiningham et al., 2007). While other attitudinal
customer metrics like customer loyalty, satisfaction, and service quality have received abundant
attention from researchers (Zeithaml, 2000).
Research on Net Promoter Score has produced promising results on the link with company growth.
Thereby, fuelling the enthusiasm of practitioners to implement Net Promoter Score alongside or as a
substitute of customer satisfaction. The goal of this implementation is of course to improve Net
Promoter Score and thereby business outcomes. Therefore it´s important to know what the drivers are
that affect Net Promoter Score and how can these be leveraged. The simple suggestion that companies
2
should turn detractors into promoters isn‟t enough; the factors should be within the influence sphere of
managers.
Service Quality as a Driver of Net Promoter Score
Traditionally service quality is measured in the face-to-face channel, however recently many
companies have increased the number of channels they use to serve clients as a result the customer
experience is increasingly multichannel. The channels that have been added to the choice-set of
customers can be classified as partly technology-mediated (call centers), and fully technology-
mediated (web-based) channels. This influx of technology has reduced the cost of serving customers
but with negative effects on loyalty stemming from negative experiences (Bitner et al., 2000), the
decrease of human contact (Neslin et al., 2006), and lack of multichannel integration (Payne and Frow,
2006). This has resulted in research on multichannel issues that affect customer loyalty and
satisfaction across different channels (Cassab and Maclachlan, 2008; Neslin et al., 2006).
Measuring the performance of a service which is increasingly multichannel is a challenge that has
not been fully addressed by researchers. To begin with the number of studies that have adopted a
multichannel perspective instead of a single-channel perspective is small. Most of the studies
described have focused on the retailer-consumer relationship, and have looked into a subset of
channels, focusing mainly on websites being complementary to retail stores. Finally the literature
dealing with multichannel integration is primarily conceptual in nature, so there is a need for more
empirical research into this area.
1.1 Statement of the Research Question
The previous section indicates that increasing Net Promoter Score is of eminent importance to
companies and that this is increasingly difficult to achieve. Partly because of the multitude of channels
that companies deploy in today´s world and the challenges associated with this development. In the
next chapter, this gap in literature will be further elaborated. The purpose of this research is to
develop a model that captures the experience on and across channels to evaluate where improvements

3
in performance, have the largest effect on Net Promoter Score and ultimately company growth. Based
on this the main research question of this master thesis becomes:
Which factors influence Net Promoter Score in a Multi-channel Service Environment?
With supporting sub-questions:
1. What is Net Promoter Score and how does this relate to other customer metrics?
2. What is Multichannel Customer Management and its related theories?
3. What drives the customer experience expressed in Net Promoter Score on individual
channels?
4. What drives the customer experience expressed in Net Promoter Score across
different channels?
5. How can these two views of the customer experience be integrated into one model to
evaluate the importance of different channels and channel integration?
This research aims to improve the knowledge on both Net Promoter Score and multichannel
customer management in several ways. Firstly, it provides insights into which factors drive Net
Promoter Score on and across different channels. Secondly, it addresses the need for more empirical
research into multichannel management. Thirdly, by integrating the evaluations of customers on and
across channels can create new insights into the relative importance of channel integration vis-à-vis
the experience on individual channels. Fourthly, it addresses the need for research into more complex
multichannel system that goes beyond the store and website configuration.

4
1.2 Document Outline
Chapter 2 will provide the theoretical framework by reviewing the current literature on both Net
Promoter Score and Service Quality. Chapter 3 proposes the conceptual framework and hypotheses,
by integrating the concepts of introduced in chapter 2. Chapter 4 contains the research approach that
was deployed, a description of the research context, and the development of the measurement
instrument. Chapter 5 describes in detail the results of the data analysis. Chapter 6 contains the
conclusions, recommendations that have been made and also explains the limitations of this study.

5
2 Theoretical framework
This chapter describes the theoretical framework that forms the basis for the development of the
conceptual model in chapter 3. In paragraph 2.1 the current literature on Net Promoter Score is
reviewed. And the relation between this new metric and other customer metrics is described. Then in
paragraph 2.2 the Service Quality literature is reviewed.
2.1 Net Promoter Score
This section starts with a description of the original research that has established Net Promoter
Score as a new customer metric. In this study Net Promoter Score is defined as a new word-of-mouth
customer loyalty metric that doesn´t focus on quality satisfaction or value; instead it links positive and
negative word of mouth to company growth. Therefore this literature review describes the links
between Net Promoter Score, customer loyalty and word of mouth.
2.1.1 Introduction
Net Promoter Score was introduced by Reichheld (2003) in a Harvard business review article “the
one number you need to grow” which was the result of a joint collaboration between Reichheld, Bain
& Company, and Satmetrix. The first step was to determine which of the attitudinal customer metrics
(survey responses) had the strongest statistical correlation with actual consumer behavior represented
by: repeat purchases and referrals. The research claims that there is one question which is best for
most industries; the likelihood recommendation question that asks respondents “How likely is it that
you would recommend [company X] to a friend or colleague on an 11-point scale. While also claiming
that traditional questions measuring customer satisfaction have no strong correlation with actual
customer behavior. Further research into the characteristics of customer responses revealed that
customers tend to cluster in three different groups.
The first group is that of the promoters, those are the customers that rate the company a nine or a
ten. These customers report the highest repurchase rates, account for 80% of the referrals and are the
source of most of the company‟s word-of-mouth. The second segment can be described as the

6
“passively satisfied” or passives. It has been shown that their repurchase and referral rates are
considerably lower, for some industries this can be more than 50%. The last segment consists of those
customers who rate a company between zero and six and are called the “detractors”. This group is
least likely to repurchase or refer and accounts for more that 80% of negative word-of-mouth.
Based on these observations Reichheld derives the Net Promoter Score (NPS) which is calculated
as follows: the proportion of respondents rating the company a 6 or less (called “Detractors”) is
subtracted from the proportion of respondents rating the company a 9 or 10 (called “Promoters”); this
difference represents a company‟s Net Promoter Score (i.e., net promoter = % promoters – %
detractors).
In the second step of the research the Net Promoter Score measure is computed for 400+ companies
across 14 different industries. These Net Promoter Score´s are then correlated to the relative growth
rate of a company (compared to industry average). The results of these calculations indicate that there
is a strong correlation between Net Promoter Score and a company‟s relative growth rate. Having the
highest NPS in an industry results in a growth rate that is on average two and a half times higher than
average. Furthermore each 12-point increase in NPS corresponds on average to a doubling of a
company‟s rate of growth. Using additional metrics alongside NPS offers insignificant predictive
advantage.
2.1.2 Net Promoter Score as a new Word of Mouth Customer Loyalty Metric
Net promoter is a new customer metric; it‟s different than other metrics because it combines the
concepts of word of mouth and loyalty into one metric. Since Net Promoter Score is measured by an
attitudinal word of mouth metric that´s linked to behavioral loyalty through the observation that
customers who are willing to talk positively about a company are also the ones that display higher
customer loyalty (Reichheld, 2003). Evidence that word of mouth has a powerful influence on
customer behavior has been provided by various researchers; it has been shown to affect customers in
several ways. For example in the formation of attitudes (Bone, 1995), the purchase decision-making
context, reduction of perceived risk when making buying decisions (Murray, 1991), and the adoption
of new categories and the choice of brands in mature categories (East et al., 2008). It plays an

7
important part in the service industry where it accounts for 50 % of service provider replacements
(Keaveney, 1995). The impact of WOM is further supported by research that found that dissatisfied
customers have shown to have a high negative impact on the ability of company to grow, research
shows that dissatisfied customers with negative experience told nine people about this (Anderson,
1998). Furthermore it was shown that dissatisfied customers are more likely to speak to others about
their experiences than satisfied customers (Wilson et al., 1989). The general consensus is that WOM
can have a significant impact on actual customer behavior, while limited research has attempted to
quantify this link because it‟s hard to measure (Helm, 2006). By using intent to recommend as a
metric to capture customer perceptions, Kamakura (2002) found strong proof that a positive
relationship between likelihood to recommend and customer behavior indeed exists.
The link between word of mouth and customer loyalty does also explain why Net Promoter Score
has such a strong correlation with company growth. Because customer loyalty is defined as “a deeply
held commitment to re-buy or repatronize a preferred product or service consistently in the future,
despite situational influences and marketing efforts having the potential to cause switching behavior”.
Researchers have found that customer loyalty not only indicates higher repurchase intent, but it also
gives rise to stronger and more stable relationships, resistance to counter-persuasion, resistance to
adverse expert opinion, willingness to pay a price premium, and willingness to recommend the service
provider to others (Kumar et al., 2005). Therefore customer loyalty is a good predictor retention which
is one of the key drivers of profitability. According to Reichheld and Sasser (1990) a 5% improvement
in customer retention for a variety of service companies could improve their overall profitability from
25% to 85%. Gupta et al. (2004) examine five companies and find that a 1% improvement in retention
can improve profitability by about 5%. This means that a higher Net Promoter Score leads to more
loyal customer and thus higher retention rate and increased profitability.
2.1.3 Drivers of Net Promoter Score
In order to make Net Promoter Score an actionable construct it is necessary to determine the
drivers. Because the literature on Net Promoter Score is scarce stemming from the fact that it‟s a
relatively new concept and the fact that Net Promoter Score is linked to customer loyalty, the

8
framework of Gustafsson et al. (2005) is chosen as a starting point. Gustafsson differentiate four
drivers of customer loyalty: calculative commitment, affective commitment, overall customer
satisfaction and service quality.
Where calculative commitment represents the rational and economic decision making: reviewing
costs and benefits which can be altered through a lack of choice for similar products/services or high-
switching cost (Anderson and Sullivan, 1993). In a study by Malendo et al. (2007) this calculative
component is measured as payment equity; the perception that the price paid for the company‟s
products or services is fair. The customers‟ perceptions of the fairness of a given supplier‟s prices are
“formed relative to both the level of prices charged by competitors and the modus operandi of the
pricing mechanisms used by these alternative suppliers” (Bolton et al., 2000)
Affective commitment is a warmer and more emotional factor, based on trust and commitment.
This is in line with Muthuraman et al. (2006) who describe the need for customer trust in building
sustainable and loyal relationships with a brand or service. The last determinant is customer
satisfaction which is conceptually different from commitment dimensions because it‟s “backward
looking,” whereas the commitment dimensions are more “forward looking.” Satisfaction is a function
of performance to date, whereas affective and calculative commitment capture the strength of the
relationship and the resultant commitment to proceed forward (Gustafsson et al., 2005).
The link between customer loyalty and customer satisfaction has been examined by a number of
researchers. in the telecom industry (Bolton, 1998) based on information obtained by tracking 650
customers over a two year period a positive relation between satisfaction and length of the relationship
was found. In a study within the banking sector (Loveman, 1998) an investigation of 450 different
branches with a combined total of 45,000 customers showed that customer satisfaction is positively
correlated to retention, number of services used (cross-sell) and share of wallet. For the number of
services used it was found that as the relationship length increases, the effect of satisfaction on cross-
selling increases as well, this effect is also found by other researchers (Verhoef, 2002).
The relationship between satisfaction and actual behavior typically exhibits increasing returns
(Mittal and Kamakura, 2001); a linear model would underestimate the impact of a change in
satisfaction score (on a five point scale) from four to five by 64%. This effect of non-linearity is also

9
illustrated by a study performed within Toyota which found that the intent to repurchase a Toyota
automobile increases from a base of 37% to 45% with a positive sales experience, from 37% to 79%
with a positive service experience, and from 37% to 91% with both positive sales and positive service
experiences (McLaughlin 1993).
Service quality is a concept developed originally to measure the quality of the service encounter
(Parasuraman et al., 1985). The service encounter is of eminent importance because it‟s where
customers form indelible impressions of a company (Bitner, 2001). The relationship between
perceived service quality and service loyalty is found to be strong across a number of industries
(Zeithaml, 1996). Companies that offer superior service achieve higher-than-normal growth in market
share and increased profits through higher market share and being able to offer premium prices
(Philips et al., 1983).
From these four drivers, service quality is chosen to examine in detail, because unlike the other
metrics it has proven to play an integrating role between internal organizational policies/practices and
the customer experience (Cronin et al, 1992) which makes it an actionable construct for management.
Secondly, because service quality has been successfully applied in many different industries and
companies.
2.2 Service quality
To measure the quality of the service encounter originally the SERVQUAL instrument was
developed, though as the nature of the service encounter changed through the influx of technology and
the proliferation of channels through which customer can interact with companies, the instrument had
to be adjusted to represent this new reality. In the following part, the literature on service quality is
reviewed with the objective to find what factors influence the customer experience both on and across
channels. Starting with a description of the way in which the service encounter has evolved. Followed
by the development of the original instrument, which captures the service quality of a traditional face-
to-face encounter. The adoptions that have been put forward to capture the influx of technology: partly
technology-mediated (voice-to-voice) and fully technology-mediated (virtual). This part is concluded
with the conceptualization of service quality in a multichannel environment.

10
2.2.1 The Service Encounter
Traditionally a service encounter is the moment of interaction between a customer and a company.
This encounter is critically important for companies; it‟s the moment of truth at which customers
develop indelible impressions of a company because it‟s the moment where promises to customers are
kept or broken (Bitner, 2000). Each encounter presents an opportunity for a company to increase
satisfaction by providing an excellent customer experience, furthermore it also presents an opportunity
for cross and up sell. The importance of service encounters has been thoroughly assessed by
researchers; service encounters have been related to customer satisfaction, intention to repurchase,
word-of-mouth communications and loyalty. The cost of negative experiences during a service
encounter are significant as a result of performing the service again, negative word of mouth and most
costly; the eventual loss of customers (Wilson, et al., 2008).
However in recent years, many organizations have become multichannel service providers by
increasing the number of service channels available to their customers. Making products and services
available to business markets via a wide range of different channels which include among others, the
store, the Web, sales force, third party agencies, and call centers. This increase in available channels
can provide increased levels of customer choice and service, while on the other hand it can be a source
of dissatisfaction. It also means that the interactions of customers with companies have become
increasingly technology mediated (Bitner, 2000). The introduction of technology has changed service
encounter in several ways. First, technology can be used to help the service employee in his service
encounter with a customer (for instance a computer system that contains information on customers), to
provide the connection between an employee and a customer (e.g. telephone connection between
employee and customer) or by replacing the service employee with self service technology.
2.2.2 Service quality on the face-to-face channel
Measuring the service quality of traditional service encounters has focused primarily on the
SERQUAL instrument introduced by Parasuraman (1988). Over the years this instrument has been

11
adapted to over 30 specific industries. The general idea underlying the instrument is the notion that
service quality is the difference between customer expectations and perceptions of service users; in
other words does the service delivers what is expected. Originally the SERVQUAL instrument
consisted of 10 dimensions which were later reduced to five dimensions encompassing 22 items.
These five dimensions are:
Tangibles: the appearance of physical facilities, equipment and personnel;
Reliability: the ability to perform the promised service dependably and accurately;
Responsiveness: the willingness to help customers and provide prompt service;
Empathy: the provision of individual care and attention to customers;
Assurance: the knowledge and courtesy of employees and their ability to inspire trust and
confidence.
Many researchers have used the SERVQUAL instrument as a starting point: some have questioned
its applicability and validity and some have tailored it towards a particular situation, service or
industry. In a review of the service quality research field, Ladhari (2008) reviews 30 articles that have
used and tailored SERVQUAL to measure industry specific service quality. It‟s shown that different
measures and data gathering and analysis methods are used in different settings. Many researchers
have questioned SERVQUAL. The main concerns and critiques since the original development of the
instrument are: the concept of the gap score, the fundamental model underlying, the concept of the
validity of the items and dimensions (Gounaris, 2005).
Although the original SERVQUAL instrument has received widespread criticism it remains the
most useful model for measuring the quality of the customer experience. Especially the five
dimensions represented by SERVQUAL are found to be valid across different industries. Furthermore,
the instrument has been used as a starting point to develop new instruments that include the infusion of
technology in the service encounter. These extensions include the service encounters that can‟t be
characterized as “traditional” face-to-face channel such as telephone-based service encounter and the
quality of the online service environment.

12
2.2.3 Technologically mediated channels
Partly technology mediated channel
Research taking a customer perspective on service quality in telephone-based service environment
is limited; to a large extent the research has an operational point of view. Some have related
operational factors to customer satisfaction for example the percentage of calls closed on first contact,
response time, total service time and waiting times. The main reason is that the focus of companies is
on the budgetary side instead of on service priorities. Although there is a trend away from the
production line approach to a situation in which there is more focus on staff empowerment and
discretion (Gilmore, 2001). To serve the customer right and effectively, contact employees need to
know what customers desire. In the case of face-to-face encounters, people can create quality
perceptions relating to physical characteristics of the contact employee and the environment where the
service takes place. Interaction by telephone restricts the evaluation of the service delivery to such an
extent that consumers will have to base their perceptions solely on the interpersonal traits of the
contact employee. Call centers often have a crucial role in customer service recovery , based on this
eight attributes have been suggested by Boshoff (1999) to form the instrument (RECOVSAT) are:
time, communication style, empathy, reliability, perceptions of commitment to service quality and
customer satisfaction, empowerment, staff attitude, explanation.
Burgers et al. (2000) conducted a study within the Netherlands into the expectations customers
have about voice-to-voice service quality. This study combines the SERVQUAL and RECOVSAT
instruments to accommodate the unique characteristics of the call-center environment. The results of
this study indicate that the service quality construct of a voice-to-voice encounter can be divided into
four separate dimensions, namely: adaptiveness, assurance, empathy, and authority.
The first scale, labeled ``adaptiveness'', incorporates different items such as accessibility,
competence, commitment and empowerment. The customers clearly expects the call center agents to
be competent and skilful and, therefore, able to help the customer by handling interpersonal situations,
and adapting to various situations. Furthermore, they should not be afraid to deal with various

13
situations during an encounter and must be capable of assessing the customer's constitution and the
language to the level of sophistication of the customer accordingly.
The scale ``assurance'' is related to both security and explanation. Call center agents need to
provide clear information to the customer about the procedures will comfort the customer and take
away uncertainty. Furthermore, the customer does not only expect that the company he/she calls will
handle his/her customer information discreetly, but also that the CCR assures him/her that the
information will be handled confidentially.
The scale ``empathy'' is a characteristic that can be defined as the ability to provide the customer
with “caring, individualized attention” (Parasuraman et al., 1988). It‟s the ability of the CCR to show
customers a level of personal involvement. A call center agent must be able to empathize with the
customer's emotions and/or situation and to give the customer the feeling of being more than just a
number to the company.
The label of the last scale item, “authority”, refers to having the desire, skills, tools, and authority
as a frontline employee to service the customer'' (Zeithaml & Bitner, 2000). From the viewpoint of the
customer they expect call center agents to have the authority to deal with their various problems and
questions. The items loading on this scale indicate that customers find it disturbing if a call center
agent doesn‟t have the proper problem solving authority to deal with the customer's question or
problem.
Fully technologically mediated channels
The fully technologically mediated channels are often described as self-service technologies
(SSTs). The use of SSTs enables customers to produce a service independent of direct service
employee involvement (Bitner, 2000). The Implementation of SST´s reduces human support cost for
companies and provides customers more personalized real-time services (Rust and Lemon, 2001).
Academic research on electronic service quality builds on the early work of Zeithaml, et al. (2000). In
their paper, they provide the first formal definition of Web site service quality, or e-SQ, it is defined as
“the extent to which a Web site facilitates efficient and effective shopping, purchasing, and delivery of
products and services”. In a review of the existing Web site service quality literature (Parasuraman,

14
Zeithaml, and Malhotra, 2005; Yoo and Donthu, 2001; Zeithaml, et al., 2002) Chu et al. (2008)
identify six factors that influence the service quality of websites.
This first item “Information availability and content” concerns the availability and depth of
information are frequently mentioned as an important reason for shopping online (Wolfinbarger and
Gilly, 2001) The reduction in search costs for products and product-related information has been
identified as one of the key benefits of online shopping (Lynch and Ariely 2000). In terms of
information content, the ability to search price and quality information increases satisfaction with both
the experience and product purchased and improves intentions to revisit and repurchase from a web
site (Lynch and Ariely 2000). Furthermore, when users can control the content, order, and duration
(the amount of time the information is present) of product-relevant information, their ability to
integrate, remember, and thereby use information is improved (Ariely 2000).
The item “Ease of use” represents the customers‟ assessment of websites‟ effectiveness in helping
customers accomplish their tasks. This concept has been studied extensively in the context of
technological adoption within workplace environments where it has been related to potential adopters‟
attitudes, behavioral intentions, and actual behavior. In the online context ease of use has often been
labeled as usability (Venkatesh et al. 2000). A site‟s search functions, download speed, overall design,
and organization are among the key elements that affect usability (Montoya-Weiss et al. 2000). Ease
of use and perceived channel advantage have been shown to predict adoption of Internet financial
services.
The items “Privacy & Security” are key evaluative criteria in the online services (Montoya-Weiss
et al. 2000). These two related criteria have been distinguished from each other. Privacy involves the
protection of personal information, protecting anonymity, and providing informed consent (Friedman,
Kahn, and Howe 2000). Security, on the other hand, involves protecting users from the risk of fraud
and financial loss from the use of their credit card or other financial information. Security risk
perceptions have been shown to have a strong impact on attitude toward use of online financial
services (Montoya- Weiss et al., 2000).
The item “Graphic style” captures the customers‟ perception on such issues as color, layout, print
size and type, number of photographs and graphics, and animation. Researchers that have studied the

15
impact of graphic style have found that these influence the customer perceptions of online shopping
environment (Ariely, 2000; Lynch and Ariely, 2000)
The item “Fulfillment / reliability” originally represented the “ability to perform the promised
service dependably and accurately” (Parasuraman et al., 1988). For the websites this translates to on-
time and accurate delivery, accurate product representation, and other fulfillment issues. It has been
shown that reliability/fulfillment ratings are the strongest predictor of customer satisfaction and quality
and the second strongest predictor of loyalty intentions to repurchase at a site (Wolfinbarger and Gilly,
2002).
The last item “Responsiveness” is related to the function that many websites offer next to providing
information namely providing customers with faster service or assistance. For example, these sites that
offer live online customer support through e-mail or live chat to answer or solve customer problems
(Li, et al., 2002). Some Web sites also set up a discussion area where customers can talk with other
customers or to the company directly (Yang, et al., 2005). The ability of a website to deal with
customer problems or requirements within an acceptable time is an important factor when it comes to
consumers‟ assessment of Web site service quality.
2.2.4 Service Quality across channels
Research in the area of service quality has for long deployed a single-channel orientation,
measuring the service quality of individual channels and relating these separate service encounters to
customer loyalty and satisfaction as reviewed above. However several researchers have suggested that
the overall service quality in today‟s business environment is likely to be result of several service
encounters across different channels (Sousa and Voss, 2003; Payne and Frow, 2004). The theoretical
rationale for this assumption is that within a multichannel context customers are likely to have
experience´s with multiple channels and rotate their channel use based on the relative assessment of
channel advantages and disadvantages (Patricio et al., 2003). For example, the physical branch is
positively associated with individualized attention, professional competence of employees, and
responsiveness in non-routine situations. While negatively aspects are: lack of convenience, lack of
accessibility, and time loss. Call centers have the advantage of providing both convenience,

16
accessibility, and an intermediate level of personal service. However it lacks mutual knowledge,
relationship continuity, and personalization. Finally, the e-channel is associated with efficient
interaction, higher accessibility, convenience, and time savings.
Empirical evidence supporting the claim that perceptions of customers are formed through multiple
encounters with the service provider is offered by researchers that have examined cross-channel
interaction effects. For example Montoya-Weiss et al. (2003) have examined in what way the
evaluation of both the online and offline channel effect customers‟ overall satisfaction and channel
choice. The results indicate that online and traditional channels have complementary effects in
determining customers‟ overall satisfaction with the service provider. These results have been
confirmed by other researchers, for example Birgelen et al. (2006) found a similar interaction effect;
within a multichannel service context (retail banking) interaction effects were found between
employee satisfaction within the traditional channel and satisfaction with technology-mediated
channels.
Researchers who have examined the impact of multichannel behavior on customer satisfaction have
produced mixed results. Some researchers (Wallace, et al., 2004) find that multichannel usage is
associated with higher perceptions of the company‟s channel offerings, which in turn are associated
with higher customer satisfaction and greater loyalty. Others have argued that the lack of human
contact in modern channels and the extensive search that is encouraged by the existence of an online
channel actually erodes loyalty. This is confirmed by Wright (2002) who showed that new channel
technologies have “loosened the banker-consumer relationship” and Ansari et al. (2005) who found a
negative association between internet usage and loyalty.
These mixed results indicate that rather than concentrating efforts on improvements to each
channel in isolation, a company should try to provide multiple integrated channels as a way of
retaining customers and minimizing the consequences of service failures on alternative channels. This
has resulted in research on how customers evaluate the multichannel interface and whether the
multichannel interface impacts the relationship with the customer. Given that multi-channel services
involves different modes of customer contact in relation to technology (Froehle, Rothe, 2004),
customers are expected to evaluate the functional quality of service providers and technology across

17
channels. Different conceptualizations have been put forward by scholars to capture the customer
experience across channels. There´s the holistic approach of Cassab and MacLachlan, who have
developed a framework that consists of four constructs (handling, accuracy, usability, and scalability);
these constructs capture the customer experience within and across channels simultaneously. This in
stark contrast to the approach taken by Sousa and Voss which have isolated the cross channel
experience from the service encounter (experience with individual channels). The advantage of the
approach of Sousa and Voss over that of Cassab and MacLachlan (2008) which uses an integrated
model of the multichannel experience is that the resulting model is actionable for companies. Because
it pin-points weak spots in the multichannel chain instead of assessing overall evaluations of
customers. Therefore the choice is made to use this conceptualization, in the following paragraph their
approach is described in more detail.
2.2.5 Integration Quality
Sousa and Voss (2006) have expanded on the service quality literature by putting forward a new
quality dimension next to the existing dimensions of physical and virtual quality. This dimension
which they dubbed integration quality is defined as: “the ability to provide customers with a seamless
service experience across multiple channels”. To measure the extent to which an integrated experience
is provided two constructs are introduced: channel-service configuration and integrated interactions.
Channel-service configuration captures the perceived quality of the available combination of
services or service components and the associated service delivery channels. Research within the area
of self-service technologies has provided some evidence that channel choice is a potential source of
customer satisfaction, it provides customers with the freedom to use whichever channel they prefer
(Wright, 2002). While inconclusive, the opposite channel configuration which “forces” customers to
use particular channels for particular needs has been shown to reduce customer satisfaction (Bitner et
al., 2000). To measure the extent to which customers perceive freedom of channel choice a number of
indicators are suggested. These include the degree to which customers can choose alternative channels
for a given service (parallel-channels mode) and the degree to which customers can accomplish
preferred tasks through individual channels (complementary channels mode).

18
Many multichannel service providers have developed channel service configurations that are
aligned with customer needs and channel strengths. In order to “right” channel customers to the most
cost efficient channels, companies may decide to differentiate important service attributes (e.g., price,
response and delivery times, product/service variety, etc) depending on the chosen channel. Bitner et
al. (2000) have shown that many customers are unaware of the existing delivery channels associated
with a service. This lack of knowledge about the channel service configuration can lead to negative
experiences, for example the customer may experience to be forced to use a certain channel for a
particular task while this is not the case. To capture this dimension Sousa and Voss (2006) suggest that
the transparency of the existing channel-service configuration will contribute to the quality of channel-
service configuration. Potential indicators of this dimension include the degree to which customers are
aware of the existence of all available channels and of differences between service attributes across
different channels.
Consistency across interactions with a service provider is generally recognized as an important
customer need in services with a single-channel mind-set (Johnston and Clark, 2001). This concept has
been extended to the multichannel setting by Payne and Frow (2004) who argue that consistency
across channels is essential for companies aiming to build long-term relationships with customers;
“Any incoherence or conflict in the messages in different channels will confuse the customer, who
may then misinterpret or „draw a blank‟ about what the company stands for and what it is offering.
This confusion across channels can seriously diminish the customer‟s view of the company, and
possibly instigate negative word of mouth”. The definition for integrated interactions that Sousa and
Voss put forward is: “the consistency of interactions across channels, resulting in a uniform service
experience”. To measure this concept they draw upon the traditional service quality concepts of
technical (content) and functional (process) quality (Grönroos 2000), and propose that within a
multichannel setting, the integrated interactions quality can be represented by two constructs named
content and process consistency.
Content consistency refers to the consistency in the content that is exchanged with the customer
through different channels. This not only means that the information provided by a company needs to
be consistent across channels but also that companies have to store the information they receive from
19
customers at different channels. Potential indicators suggested by the researchers include a customer
receiving the same response to a query posed through different channels (outgoing information) and a
service interaction occurring through one channel taking into account eventual past interactions
through other channels (incoming information).
Process consistency refers to the consistency between the relevant and similar process attributes
(relative to expectations) of the front offices associated with the different channels. Potential indicators
of process consistency include cross-channel consistency of the service‟s feel, image, waiting times,
and employee discretion levels (in the case of a human interface).
2.3 Conclusion
Net Promoter Score is a promising new customer metric which provides a strong link with actual
customer behavior and financial performance. This has spurred practitioners to implement Net
Promoter Score alongside or as a substitute of customer satisfaction. The goal of this implementation
is of course to improve Net Promoter Score and thereby business outcomes. The simple suggestion
that companies should turn detractors into promoters isn‟t enough; knowledge on the factors that drive
Net Promoter Score is needed. However, currently there has been no research into the drivers of Net
Promoter Score. This study is will fill a part of this gap by examining the role of service quality in
driving Net Promoter Score.
The research on service quality to date has established that within a multichannel context the
customer experience is formed through multiple interactions with the company and that there are
interaction effects between different channels, suggesting that customers evaluate channels not in
isolation. The literature dealing with multichannel integration is limited in volume and scope and is
primarily conceptual in nature, so there is a need for more empirical research into this area. This study
acknowledges the changing nature of the service encounter and integrates the customer evaluations
about separate channels and integration quality, in order to establish the relative importance of channel
integration.

20
The Theoretical framework that has been presented in this chapter will be used in the following
chapter to construct a conceptual model and to derive hypothesis. This conceptual model will then be
further developed and tested at KPN.

21
3 Conceptual model
This chapter will present the conceptual model which is based on the literature review of net
promoter and service quality on and across channels described in the previous chapters. First, a
general explanation of the model is put forward in paragraph 3.1, followed by a detailed overview of
the different hypotheses in paragraph 3.2, which are postulated to verify quantitatively the validity of
the conceptual model and answer the research questions.
3.1 Introduction
Reichheld´s one number question can reveal something about the company‟s overall health,
however it cannot provide all the information needed to guide targeted strategic improvement action
(Grisaffe, 2007). Therefore this research focuses on determining what the underlying causal factors are
that truly drive Net Promoter Score in a multichannel service environment. In this section, the factors
that have been proposed to capture the customer experience on and across channels are integrated into
one model in order to determine the impact on Net Promoter Score. The following description will
first introduce the conceptual model and the constructs that have been included. Next a detailed
description of the hypotheses is provided to explicate the causality of the conceptual model.
As can be seen in the visualization (Figure 1), the conceptual model integrates the new concept of
Integration Quality proposed by Sousa and Voss (2004) with the extensive research on Service Quality
in order to determine the impact on the dependent variable Net Promoter Score. The resulting
integrated model of the multichannel experience is actionable for companies, because it pin-points
weak spots in the multichannel chain.
The left side of the model focuses on the quality of the service encounter on individual channels is
measured. Because it´s on those service encounters that customers form indelible impressions of a
company (Bitner, 2001). To measure the customer experience on different channels the service quality
concept originally introduced by Parasuraman et al. (1988) is used. The primary reason is that service
quality has proven to play an integrating role between the internal organizational policies/practices and

22
the customer experience (Cronin et al, 1992). Secondly, the service quality concept has been
successfully applied in many different industries and companies. Three different types of service
encounters are distinguished based on the amount of technology that´s infused. Using the
conceptualization of Bitner (2000) this model distinguishes the following service encounters: face-to-
face, voice-to-voice and the virtual encounter.
Figure 1 the conceptual model
The right-hand side of the model captures the multichannel experience that customers perceive.
Customers are likely to be unaware of the internal structure of the company but essentially perceive
that they can obtain service at any channel with little redundancy (Payne and Frow, 2004).
Organizations are therefore challenged to deliver consistent service while reducing the amount of
customer effort involved (Womack and Jones, 2005). To measure this, two constructs are used:
channel-service configuration and multi-channel consistency. The dimensions channel-service
configuration and Multi-channel consistency put forward by Sousa and Voss (2004) are used to

23
capture the customer experience across channels. The concept channel-service configuration captures
the perceived quality of the available combination of services or service components and the
associated service delivery channels. Whereas Multi-channel consistency captures the consistency of
interactions across channels, which measures the uniformity of the service experience.
The constructs that have been included in this conceptual model have all been empirically validated
to affect customer metrics such as customer loyalty and customer satisfaction. New in this model are
the use of Net Promoter Score as a dependent variable in the analysis and the integration of the
customer experience on separate channels and the multichannel factors that capture the customer
experience.
3.2 Hypotheses
3.2.1 Net Promoter Score
In this research Net Promoter Score is used as the dependent variable and is conceptualized as a
measure that links word of mouth to company growth through customer loyalty. Customers who are
more willing to recommend are also the more loyal customers. This link can also be explained by the
logic that recommendation is a form of sacrifice, since the recommendator´s personal reputation is at
stake. Which in turn fit´s the definition of customer loyalty “the willingness of someone, a customer,
an employee, a friend, to make an investment or personal sacrifice in order to strengthen a
relationship. Because these constructs have been linked conceptually the model of Gustafsson (2005)
is used to determine what drives Net Promoter Score. This model distinguishes three components:
experience, rational and affection. The experience component which is the quality of the service is
hypothesized to have the largest effect on Net Promoter Score. The reason for this is that in a service
environment the customer experience is formed during the service encounter and is a direct result of
how a customer is treated. Whereas the other components are more rigid and formed over time, and
are not the result of a direct positive or negative customer experience with the company. A detailed
description of the other two components and their effect on Net Promoter Score can be found in
appendix C.

24
3.2.2 Service quality
It‟s widely accepted that delivering quality service is an essential strategy for success in today‟s
competitive environment (Parasuraman et al., 1985; Caceres et al., 2007). More specific, direct and
significant paths have been demonstrated between service quality, service encounter satisfaction and
customer loyalty (Zeithaml et al., 1996). Furthermore service quality perceptions have been positively
related to purchasing intention (Boulding et al., 1993). In fact, quality has positive consequences for
purchasing intentions, word-of-mouth recommendations and the willingness to pay a higher price for
the service. The existence of a relationship between service quality and the retention of customers at a
higher level indicates that service quality has an impact on individual consumer behavior (Zeithaml et
al., 1996). Service quality is widely recognized in literature as affecting customer loyalty both direct as
indirect through customer satisfaction in both online (e.g. Lee et al., 2005; Collier et al. 2006; Yang et
al., 2005) and offline settings (e.g. Winsted 2000; Jayawardhena et al. 2007). Given the
comprehensive literature that supports a link between service quality and the concepts of customer
loyalty and word of mouth, the concept of service quality is linked to Net Promoter Score.
The literature on service quality with a single-channel mindset has been reviewed extensively in
chapter 2. Three different types of channels were distinguished based on the amount of technology
mediation namely, the traditional service encounter, partly technology mediated, and fully technology
mediated service encounter. The hypotheses associated with the different channels are introduced and
discussed now.
Service Quality face-to-face
Physical customer support is considered to be very important for the overall perception of service
quality (e.g., Wolfinbarger and Gilly 2001). The service quality construct as it was originally
designed by Parasuraman (1985) to capture the customer experience in a face-to-face encounter is
used. Customers judge the ability of employees to deliver the service right the first time, and by their
capacity to deal with special requests. Customers also judge employees on their involuntary actions
and attitude (Bitner et al., 1990, 1994; Goodwin and Ross, 1992). As the service encounter meets or

25
exceeds expectations, the customer will perceive that they have been treated fairly and reasonably
(Berry et al., 1994; Bitner, 1995; Bitner et al., 1994; Zahorik and Rust, 1992). That is, the greater the
reliability, responsiveness, assurance and empathy of the service delivery process, the more reason
there is for customer to engage in positive recommendations about a company.
As noted in the previous paragraph, the relationship between original service quality concept and
customer loyalty has been found many times by previous researchers (Parasuraman and Grewal, 2000;
Zeithaml et al., 1996), therefore the following hypothesis is proposed:
Hypothesis 1: Service Quality face-to-face will positively affect Net Promoter Score.
Service Quality voice-to-voice
It has been shown that customers receive and interpret messages about the organization based on
what happens during the voice-to-voice encounter in a customer contact center. This interaction by
telephone restricts the evaluation of the service delivery to such an extent that consumers will have to
base their perceptions for a large part on the interpersonal traits of the contact employee just as in the
face-to-face encounter and is formed through evaluations on reliability, responsiveness, assurance and
empathy. The extra dimension introduced to capture the quality of the voice-to-voice experience is
authority. Because the customer contact center plays an important role in service recovery, customers
who experience that their problem or need is solved in one phone call will have a more positive
experience as those who are not. For example, a customer calls to the customer contact center and the
employee does not have the authority to deal with their problems, instead the call is rewired to another
agent, and a customer has to explain his or her problem again. This will lead to frustration on the side
of the customer and decrease the chance of recommendation. Furthermore, perceived service quality
of the voice-to-voice encounter has been related to customer loyalty (Dean, 2002). Therefore the
service quality on the technologically mediated channel is hypothesized to affect Net Promoter Score.
In line with this the following hypothesis is proposed:
Hypothesis 2: Service Quality voice-to-voice will positively affect Net Promoter Score.

26
Service Quality virtual
In the context of websites and other forms of technology-based self self-service it´s well-known
that customers are more satisfied and more likely to remain loyal when the SST solves an intensified
need, saves time, and delivers the service (Meuter et al., 2000). For example positive experiences can
be created by providing high quality information so customers can use the website for orientation and
price comparison before the go to the store. On the other hand, problems occurring in online service
encounters can result in a failure of service (Zhang and Prybutok, 2005) and may lead to the loss of
valuable opportunities to build loyalty (Watcher, 2002). For example in the case of live online
customer support through e-mail or chat to answer or solve customer problems it´s important that
answers are provided timely to ensure a positive experience (Li, et al., 2002). The possibility of online
ordering, which saves customers a trip to the store is becoming ever more common. The delivery of
incorrect items and long delivery times can destroy the positive aspects of online ordering and result in
a lower willingness to recommend the website to others. In sum this channel offers a lot of
possibilities to enhance the customer experience. However the downside is also high, resulting in
negative experiences and extra cost for recovery. It‟s expected that a positive experience on the fully
technologically mediated channel will result in a higher Net Promoter Score, resulting in the following
hypothesis:
Hypothesis 3: Service Quality Virtual will positively affect Net Promoter Score.
3.2.3 Channel-service configuration
The first aspect of multi-channel integration that is hypothesized to affect customer evaluations is
the channel service configuration. This concept refers to the quality of the available combination of
services or service components and the associated service delivery channels. The question is whether
the current channel service configuration is in line with customer needs and wants. Several authors
argue that customers wish to exercise choice over alternative channels offered by a given supplier
(Friedman & Furey, 1999; Myers et al., 2004). Other empirical research (Wallace et al., 2004) has
found that consumers believe that retailers offering multiple channels were better able to satisfy their

27
needs and thereby increase customer loyalty. Their study concluded that customers using three or
more channels of communication with a company feel 66% more committed than those using only a
single channel. Moreover, these customers believe the service delivered is 34% better. Therefore, it is
argued that the breadth of channel choice will contribute to the quality of channel-service
configuration. Indicators that are used to capture this dimension are the degree to which customers can
chose alternative channels for a given service (parallel-channels mode) and the degree to which
customers can accomplish preferred tasks through each available channel (complementary channels
mode). Research in the use of self-service technologies and channel management has shown that
customers value choice in the channels through which they communicate with a service provider and
are displeased when “forced” to use a particular channel (e.g., Bitner, Brown, and Meuter 2000;
Bitner, Ostrom, and Meuter 2002; Rackham 2000). For example, a company that allows customers to
place orders both online and by phone may exhibit superior channel-service configuration than one
that only allows orders to be placed online.
In sum, the channel-service configuration captures the extent to which the customer percieves that
the channels in the multichannel system have the right service components. And allow the customer to
choose whichever channel they want. A higher score on this construct will lead to more positive
multichannel experience, therefore the following hypothesis is proposed:
Hypothesis 4: Channel- service configuration will positively affect Net Promoter Score.
3.2.4 Multi-channel consistency
The second aspect of multi-channel integration that is hypothesized to affect customer evaluations
is cross-channel consistency. Consistency across interactions with a service provider is commonly
recognized as a significant customer need in traditional services deploying a single-channel (Johnston
and Clark 2001). Payne and Frow (2004) have extended this concept by arguing that giving customers
a positive and consistent service experience across channels is essential to the quality of the customer
relationship. Such consistency has been considered key to customer satisfaction in multichannel
settings (e.g., Ganesh 2004; Montoya-Weiss, Voss, and Grewal 2003). Multi-channel consistency is

28
described as the information exchanged with the customer through different channels, including both
outgoing and incoming information. The consistency of incoming information requires the
development of a “single view of the customer” (e.g., Pan and Lee 2003) taking into account the
interactions occurring through all channels. In other words, incoming consistency requires a good
functioning CRM system to be in place that disperses customer knowledge across all channels
(Drucker 2000). This is all the more important because it has been shown that multi-channel customers
expect the company to know more about them and give them individual service (Rosenbloom, 2007).
The consistency of outgoing information is ensured by all outgoing communications drawing on
common information, regardless of the channel of service provision, indicators that are commonly
used to measure this include the service‟s feel, image, and employee discretion levels (in the case of a
human interface).
Empirical research to verify this argument is provided by a recent contribution by Wilson et al.
(2008) which showed that consistency of information, impression, and customer knowledge across
different channels is critical. In their research multi-channel consistency is found to be a key driver of
customer satisfaction, trust and intention to repurchase. Based on this the following hypothesis is
proposed:
Hypothesis 5: Multi-channel consistency will positively affect Net Promoter Score.

29
4 Research Methodology
This section will introduce the research methodology that will be used to answer the research
questions as described in the chapter 1. First, the context of the study is described in paragraph 4.1.
Secondly, in paragraph 4.2 the research objective described. Thirdly, in paragraph 5.3 the research
approach is described by assessing the validity of the used methodology. Fourth, the online
questionnaire is described.
4.1 Context of the study
4.1.1 Company description
KPN is the leading telecommunications and ICT service provider in The Netherlands, offering
wire-line and wireless telephony, internet and TV to consumers, end-to-end telecommunications and
ICT services to business customers. KPN‟s subsidiary Getronics operates a global ICT services
company with a market leading position in the Benelux, offering end-to-end solutions in infrastructure
and network-related IT. In Germany and Belgium, KPN pursues a multi-brand strategy in its mobile
operations and holds number three market positions through E-Plus and BASE. KPN provides
wholesale network services to third parties and operates an efficient IP-based infrastructure with
global scale in international wholesale through iBasic.
Figure 2 Factsheet KPN

30
KPN is operating in an open market, which can be described as competitive and saturated. Today,
the company faces several challenges: the convergence with other industries, where providers of
telephony, internet and television (triple play) are competing on the same market. Regulation, the
telecom market is facing increased regulation to enhance competition (OPTA 2009), with the regulator
(Onafhankelijke Post en Telecommunicatie Autoriteit) actively lowering tariffs for competitors
operating in the business market, through the wholesale network of KPN. Strong technological
development, KPN has decided to provide all her services on the same network, the All IP network.
Instead of the traditional voice and data services, new IP-based services will be introduced. The
current services will be phased out or migrated to new services.
4.1.2 Customer Experience Center
The year 2008 marked a change in KPN's strategy, away from 'Attack, defend, exploit' to 'Back to
growth'. However, in light of the economic downturn, KPN's strategy has been revised once again,
with a focus on cutting costs and increasing customer value. Part of the strategy formulated by KPN to
increase customer value is to transform itself into a best-in-class service company. Within the business
division a new department was created called the Customer Experience Center. This was set up with
the objective to improve the customer experience across all products for both customer service and
sales within the business market. The most notable change realized is the introduction of Net Promoter
Score across all channels. This metric is a central target in improving the customer experience. It is
used on several levels within the organization; it‟s used as a benchmark to assess the relative
performance against the competition. Internally it is used to measure performance and indentify
improvement areas. Furthermore it should facilitate the process of becoming a customer centric
organization.
4.1.3 Research setting
KPN uses different channel configurations to serve different customer segments. Within the
business market that segmentation is based on company size; resulting in three segments: corporate
31
clients, large clients and the small and medium enterprises (SME) segment. The channel service
configuration of the SME segment is different from that of corporate and large clients because it isn´t
served by account managers. So current customers of this segment do not have a fixed contact point
with the company, instead customer can choose from a variety of channels. Channels that are in the
scope of this research are the KPN owned channels such as the business centers the Customer Contact
Center and the website.
From the perspective of KPN there are a number of challenges in this segment, a low overall Net
Promoter Score compared to the competition. A strong negative Net Promoter Score for the online
channel. So therefore there is a need to better understand the drivers of Net Promoter Score in this
specific context. What´s also lacking is an understanding of the importance of multichannel integration
and the performance of individual channels.
4.2 Research objective
The scientific objective of this study is to further elaborate on the concept of Net Promoter Score,
by performing a deep dive into the drivers that affect this new metric. It aims to provide a complete
picture of the service experience of customers on individual channels and across different channels.
This will be done by verifying empirically the conceptual framework introduced in chapter 4.
The practical objective of this study is to develop a method that can be used to evaluate where
improvements in the multichannel service system will have the largest effect positive effect on Net
Promoter Score. And thereby provide insight into whether the some channels are more important in
driving Net Promoter Score. And secondly, by distinguishing the single channel customer experience
from the multichannel customer experience, the importance of an integrated customer experience
versus improvements of individual channels can be determined.

32
4.3 Research Approach
The research approach applied to answer the research questions is described in this paragraph.
Often the research methodology distinguishes between a qualitative and quantitative approach
(Onwuegbuzie and Leech, 2005). The goal of this research isn´t only to build theory, it must also be
tested in the context of KPN. The proposed approach is visually presented in figure 3. This approach
means that theory, hypotheses or a conceptual model are used to connect the exploratory and
confirmatory phase of the research (Newman and Benz, 1998). The phases of this research will be
described and explained in this paragraph.
Figure 3 Research Methodology
4.3.1 Exploratory Research Phase
The aim of explanatory research is to describe, explain and possibly predict observable phenomena
within its field (Aken, 2004). The typical research product of explanatory science is a causal model;
one or more dependent variables are explained in terms of one or more independent variables.
Knowledge about the values of these variables can be used to predict the behavior of the dependent
variables. Sometimes exploratory research is described as research into the unknown and involves
developing hypothesis. The primary goal of the exploratory phase in this research is to develop a
conceptual model and derive hypotheses that can be tested in the confirmatory phase. The

33
development of the conceptual model was supported by three sources of information namely
interviews, a literature review and desk research. These sources are now described in detail.
Interviews
The first data collection method used in this research is part of the exploratory phase and is done in
a qualitative way. This step involves the interviewing of the involved managers at KPN. This type of
interviewing is commonly called “Elite interviewing” This terminology is commonly used to indicate
that this type of interviewing concerns managers as opposed to customers (Alam, 2005). The goal of
this data collection method is to capture the voice of the interviewee. In total 4 managers have been
interviewed using a semi-structured interview approach, these interviews lasted for approximately an
hour and an hour-an-half. The outcomes of these interviews have lead to the problem definition and
also gave good insight in terminology, organizational structure, and provided the ability to get in touch
with the right sources for upcoming research.
Literature review
The literature review part has been described in chapters 2 and 3. The goal of the literature review
is to provide the necessary theoretical framework to conduct the rest of the research. Most of the
theory is derived from double-blind reviewed journals through important academic publishing
databases (e.g., ABI/Inform, Elsevier Science Direct, Emerald Insight, and Google Scholar). Also
marketing and organizational textbooks have been used to gain a broader perspective on some topics.
Desk research
Desk research is concerned with determining what establishing what is already known and what
data is available. This data has often been collected by other institutions and companies. The main
advantage of desk research is that it‟s relatively ease and fast. The disadvantages of this data collection
approach are: data doesn´t actually suit the purpose of the research and it can be relatively old.
In this research, desk research can be described as qualitative research; next the data collections
methods that have been used are described. First, internal sources were reviewed: the intranet of KPN

34
(Agora website), market information, (confidential) reports produced by external consultancy
companies, earlier research performed in the past by professional research agencies.
Second, other external sources have been consulted such as: websites of the competition, annual
reports, and industry reports by independent professional marketing agencies.
4.3.2 Confirmatory Research Phase
Confirmatory research or theory testing is a type of research that is performed to confirm a certain
assumption or theory. In this research the conceptual model that has been developed to capture the
multichannel customer experience described in chapter 3 will be tested. To test theory both a
qualitative and quantitative method is possible. In this research however a quantitative approach has
been chosen because a quantitative, empirical approach is most appropriate for theory testing (Shah
and Corley, 2006). In the following paragraphs the methods for data collection and data analysis are
described.
Customer survey
The quantitative data is collected through the use of a customer survey, which is a systematic
method of collecting data through the use of a structured and standardized questionnaire. The choice
for an online-survey was based on a number of considerations, first Internet surveys have the benefits
of being able to target unique populations, being timesaving – allowing for fast turnaround times – and
they are cheap (Wright, 2005). Also lower respondent errors through less unanswered questions are an
advantage (McDonald & Adam, 2003). Next to that the aim of this research is to look into the
evaluations of customers that use multiple channels. Targeting customers for which KPN has the e-
mail addresses can increase the response rate because these customers are more likely to multichannel.
The development of the questionnaire is described in paragraph 5.4.

35
Figure 4: Screenshot of the Online Questionnaire
Method of analysis
This research will deploy a structural modeling approach to evaluate both errors in construct
measurement and the hypothesized relations. The choice for this approach is based on the advantages
that have been associated with this approach. It requires only that the basic assumptions of least-
squares estimation are satisfied. The estimation is distribution-free, can be used with small samples,
and permits the same freedom with respect to measurement scales as ordinary regression (Cool et al.,
1989). Two stages analysis will be performed which is consistent with the approach of other
researchers (Hulland, 1999), first the validity of the measurement model will be evaluated followed by
an assessment of the structural model and testing the hypotheses.
36
4.3.3 Reflection Phase
The reflection part of the confirmatory approach is presented as the arrow that links the results back
to the conceptual model. This final step may lead to improvements in the method, to alterations in how
we diagnose the class of situations, or to changes in the way the problem is defined (Aken, 2004); this
step will cover the contribution to the existing theory and can be found in Chapter 7.
4.4 The Online Questionnaire
This paragraph describes what sampling method has been used to select the target group for the
online-questionnaire. It also delineates what actions have been taken during the development of the
questionnaire to guarantee validity and reliability. This paragraph ends with a description of the
measures that have been included in the final questionnaire.
4.4.1 Population and sampling
The population of this study can be defined as all current customers of KPN within the small and
medium enterprise segment, which consists of over 800.000 customers. According to Hair et al. the
absolute minimum sample size should be 50 observations; preferably the sample size should be 100 or
larger. Second, the minimum number of observations needs to be at least five times the number of
constructs, where a more acceptable sample size would have a 10:1 ratio. For SEM models, models
containing five or fewer construct, each with more than three items (observed variables) and with high
communalities can be adequately estimated with samples as small as 100-150. Therefore this study
targets to get 150 respondents.
As the choice was made to conduct an online survey, and KPN is still very much a product
centered organization the following customers were selected for this survey. Customers within the
SME segment who have a known e-mail-address. This sample consists of 40.000 customers, to
accommodate internal policy within KPN aimed at limiting the communication with customers for
research purposes a subset of 10.000 customers was randomly selected. If the response rate isn´t
satisfactory this number can be increased.
37
4.4.2 Validity
Validity refers to “the extent to which differences found with a measuring tool reflects true
differences among respondents being tested” (Cooper & Schindler, 2003, p. 231). There are no
statistical tests to measure validity. All assessments of validity are subjective opinions based on the
judgment of the researcher. In this research four forms of validity are considered: data, face, content,
and construct validity.
Data validity
It is concerned with to the lack of representation caused by the sampling method. The used sampling
method in this study is the convenience sampling approach. This approach only samples those who are
available and willing to participate in the survey. The use of this approach allows for convenience for
the researcher while possibly losing data validity due to the lack of representation. To overcome
possible problems, a number of control variables have been added to the survey. These variables
measure characteristics of individuals and companies to ensure that the sample is representative for the
whole population, the included variables can be found in the paragraph 5.5.
Face validity
This refers to the likelihood that a question will be misunderstood or misinterpreted. To ensure that
respondents understand the questions of the survey a pre-test of the questionnaire will be sent to a
group of colleagues who have not participated in any way in the construction of the questionnaire. The
feedback of this session together with an analysis of the filled in questionnaires reduces the risk of
misunderstanding the question and is therefore a good way to increase the likelihood of face validity.
Content validity
This refers to whether an instrument provides adequate coverage of a topic. This is rather judgmental;
however a number of steps were taken to ensure content validity of the questionnaire. Before the
questionnaire was designed an extensive literature study was performed to establish what measures
have been used by other researchers. Next to that the questionnaire was designed in close collaboration
with customer satisfaction department who have extensive experience in surveying KPN customers.
38
Construct validity
This refers to the theoretical foundations underlying a particular scale or measurement. In this research
several survey items measure a more global construct. To ensure construct validity all constructs have
been adapted from relevant literature and as far as possible existing items have been adapted from
previous research.
4.4.3 Reliability
Reliability is synonymous with repeatability or stability. A measurement that yields consistent
results over time is said to be reliable. When a measurement is prone to random error, it lacks
reliability. Reliability can be described as the accuracy and precision of a measurement procedure
(Cooper & Schindler, 2003). If multiple measurements are taken, the reliable measures will all be
consistent in their values. It focuses on how the constructs are measured instead of what is measured
(Hair et al., 2006). In this research Cronbach‟s alpha reliability test is used to determine how reliable
the multi-item scales are that have been used to measure the service quality constructs.
4.4.4 Measures
As far as possible, existing scales were used to ensure construct validity. However, given the
specific context and the fact that the survey had to be held in Dutch, the scales had to be adapted and
translated. Through several iterations, questions were checked by KPN personnel and adoptions were
made to better suit the context and ensure that responders would understand the questions. All
constructs Service quality face-to-face, Service quality voice-to-voice, Service quality Virtual,
Channel-Service Configuration, and Multi-channel consistency were tested by multi-item likert-scales
except for Net Promoter Score.
Net Promoter Score is measured by a single item, with a scale from 0-to-10. In this research the
numeric Net Promoter Score is used to as the dependent variable in the analysis. Because the grouping
of the scores into the three separate groups proposed by Reicheld (2001) would greatly reduce the
variation in Net Promoter Score. The analysis with Net Promoter Score grouped can be found in
Appendix D.
39
The Service Quality constructs are measured by service perceptions only in this study because it‟s
generally excepted in the services literature that customers use expectations when they evaluate
Service Quality, and it‟s also agreed that the most psychometrically rigorous means of measuring
service quality is to use scores for perceptions of quality only (Cronin et al, 2000; Dabholkar et al.,
2001). The scales used to measure the service quality on different channels were adopted from the
existing literature, in some cases the number of items was reduced to keep the questionnaire at a
reasonable length. An overview of the questionnaire can be found in Appendix B.
Service Quality face-to-face is measured by 6 items adopted from a study by Jong et al. (2004).
Service Quality voice-to-voice is measured by 6 items that were derived from on a study of Burger et
al. (2000) and a study from Dean (2002) into the relationship of voice-to-voice service quality and
customer loyalty. These are used in preference to the SERVQUAL instrument because they are
specifically designed to capture the customer perception of a voice-to-voice encounter with Customer
Contact Center representatives. Service Quality Virtual is measured by six items that are based on the
E-S-QUAL instrument by Zeithaml et al., (2002) and a study into customer perceptions of website
quality of Yoo and Donthu (2001). Eight items to measure multichannel integration are adopted from
Wilson et al. (2008) and Madaleno et al. (2007); the other three are based on the conceptualization of
Sousa and Voss and are validated in the results section of this report.
The control variables that were included to check for data validity are: sex, age, level of
education, functional level, frequency of interaction with different channels, and preferred channel of
interaction. Because the research is performed in a b2b environment a number of variables are
included that could affect the way in which decisions are made within a company, these are: company
size, share of wallet and function role of the respondents.7

40
5 Research results
In this chapter the results of the quantitative research explained in chapter 5 will be presented. First,
sample size characteristics are discussed in paragraph 5.1. Next, the method applied to handle missing
data is explained in paragraph 5.2. Then, the measurement model is validated in paragraph 5.3and
hypotheses are tested in paragraph 5.4. Finally, an alternative model is analyzed using hypotheses that
were not part of the original model in paragraph 5.5.
5.1 Sample size characteristics
The total number of responses obtained from the online survey was 619. This response is the
combined response from the original invitation and the reminder for which the response was
respectively 360 and 259. Considering that the original sample size was set at 9363, the response rate
becomes 6, 61 %. In the following paragraphs the characteristics of research sample are described in
detail.
5.1.1 Missing data
The missing value analysis in SPSS (Figure 22, 23 in Appendix A) showed that only 32 cases can
be described as complete cases, it´s obvious that there are considerable amounts of data missing. This
can be explained partly by the option “not applicable” that was added to each question. A further
examination of the missing and the methods applied to overcome this problem are described in
paragraph 6.2.
5.1.2 Demographics
Out of the total response 65% of the respondents were Male and 35% were female (Appendix A,
figure 12), a split that can be explained by the distribution between age groups. The respondents are
relatively old; 80 percent is over 40 and 40 percent of this group is over 55 (see Appendix A, figure
13). Considering that workforce participation tends to be lower among older women (Statline, 2009),
this explains the relative large percentage of men in the population. Next the education level of the

41
respondents was also controlled for, over half of the respondents have achieved HBO or WO level,
and 25 percent come from MBO (Appendix A, figure 14).
5.1.3 Company characteristics
To examine whether the respondents come from the sample selected at the outset of the study we
examine the following characteristics: company size, self reported share of wallet, role within the
company. For almost 80 percent of the respondents belong to the SOHO-segment, the rest of the
respondents represent companies in the small and medium company segment (Appendix A, figure 15).
This contains companies that have more than 5 employees. It‟s also useful to know whether
respondents are indeed the decision makers within the company or can influence them, because
otherwise they don‟t affect behavioral loyalty and are therefore irrelevant. For the sample under
investigation this represents over 95 percent (Appendix A, figure 16) which is good. The self reported
share of wallet has been converted into a percentage of the total product portfolio. A considerable
number of customers (over 90 percent) procure more than one products from the total portfolio
(Appendix A, figure 17).
5.1.4 Channel use
This research is focused on multichannel behavior of customers therefore a question was included
to control for channel use. A substantial share of the respondents that has been in contact with the
company can be described as being multichannel. As can be seen in figure 5 the 43.6 percent of the
population and 57 percent of the customers that have been in contact with KPN in the past six months
can be described as being multichannel. As for the subdivision between types of multichannel
customers, figures 11 (Appendix A) clearly displays that customer use all channels or bypass the
business center.
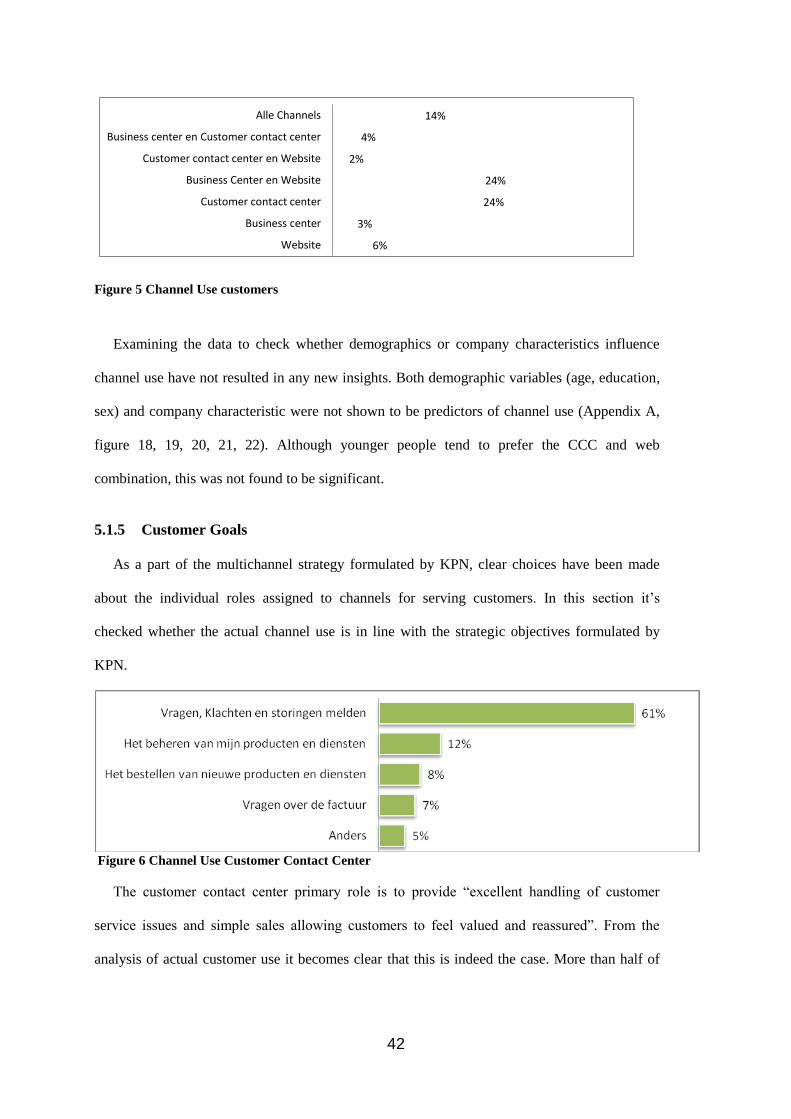
42
14%
4%
2%
24%
24%
3%
6%
Alle Channels
Business center en Customer contact center
Customer contact center en Website
Business Center en Website
Customer contact center
Business center
Website
Figure 5 Channel Use customers
Examining the data to check whether demographics or company characteristics influence
channel use have not resulted in any new insights. Both demographic variables (age, education,
sex) and company characteristic were not shown to be predictors of channel use (Appendix A,
figure 18, 19, 20, 21, 22). Although younger people tend to prefer the CCC and web
combination, this was not found to be significant.
5.1.5 Customer Goals
As a part of the multichannel strategy formulated by KPN, clear choices have been made
about the individual roles assigned to channels for serving customers. In this section it‟s
checked whether the actual channel use is in line with the strategic objectives formulated by
KPN.
Figure 6 Channel Use Customer Contact Center
The customer contact center primary role is to provide “excellent handling of customer
service issues and simple sales allowing customers to feel valued and reassured”. From the
analysis of actual customer use it becomes clear that this is indeed the case. More than half of

43
the interactions with the customer contact center can be assigned to questions, complaints and
report disruptions, this is as expected.
Figure 7 Channel Use Website
The website is positioned in such a way that it should mainly be used for: “orientation for all
products and self service portal for simple & transactional sales and services”. Website is used mainly
for orientation purposes and to some extend for questions, complaints and disruptions.
Figure 8 Channel Use Business Center
The business center of KPN is positioned as a local physical sales and service point with focus on
mobile portfolio where customers value 'touch and feel' experience. Over 50 percent of channel use
can be assigned to personal advice and ordering of new products. Strangely this channel is also still
being used to complain and ask questions.

44
5.2 Data analysis
As stated before, the answers were entered into a SPSS-file and an Excel-file (open questions).
Since SPSS is not able to test a complete model, but only relationships between independent and
dependent variables, the program SmartPLS was used to test the conceptual model.
5.2.1 Missing data
The description of the sample characteristics has shown that there are too few complete cases (32)
to start the data analysis right away. Considering that the objective of this research is to test the
conceptual model, the deployment of multivariate analysis needs some form of imputation because the
use of list and pair-wise deletion results in diminishing statistical power. Furthermore these techniques
are not available in SmartPLS, only mean substitution is, and this is probably the worst solution to
missing values because it decreases variance and provides poor imputed values. Based on these
considerations, the decision was made to deal with the missing data before importing the data into
SmartPLS. The approach taken to deal with the missing data can be categorized in three separate steps.
First, the missing values per item of each construct were analyzed to check whether these items did
indeed measure the proposed construct. The results of this analysis showed that items from the web
construct that were not concerned with basic functions such as information search have 20 percent
more missing data (Figure 23, Appendix A). This is in line with channel use; fewer customers use the
added functionality of the website than expected. Based on this the decision was made to omit a
number of variables that were originally intended to measure this construct namely: WEB_5, WEB_6,
WEB_7.
Second, the randomness of the missing data process was determined, using the little‟s MCAR test.
This test assesses whether the cases with missing values are indistinguishable from the cases with
complete data (Hair et al., 2006) The results of this test (Chi-Square = 3371,616, DF = 3203, Sig.
=0,19) is not significant which classifies the missing data as being MCAR thereby allowing the
widest range of potential remedies, form case-wise deletion to EM-imputation.
Third, considering the fact that there´s no simple decision rule that states under which conditions a
researcher should apply one of the following methods: leave data as they are, drop cases with missing

45
values, or impute values to replace missing values. Three separate scenario´s were formulated to
perform the data analysis. This approach has the advantage of giving an indication of the robustness of
the analysis by examining the results of the different combination of imputation techniques. It should
be noted that a complete case scenario was not possible due to the limited amount of complete cases
(32).
Figure 9: The specification of three different scenarios for the SmartPLS analysis
After constructing three separate datasets, the missing data were imputed using EM-imputation.
This is a maximum likelihood approach that creates a new data set in which all missing values are
imputed with maximum likelihood values. This approach is based on the observed relationships
among all the variables and injects a degree of random error to reflect uncertainty of imputation
(Dempster, Laird, and Rubin ,1977). Guidelines formulated by other researchers (King et al., Meng,
1995; Rubin, 1996) were applied, first all variables were included (both predictors and outcomes) in
the model at the imputation stage. Second, variables that potentially explained missingness were
included even if these were not part of the conceptual model under investigation.
46
5.3 Validation of measurement model
Since SPSS is not able to test a complete model, but only relationships between dependent and
independent variables, the program SmartPLS was used to test the conceptual model. Partial Least
Squares (abbreviation: PLS) was chosen because it has a number of advantages over other methods of
analysis. First, it makes no assumptions on the underlying data distributions and is well applicable for
smaller data sets. Stan & Saporta (2005) and Chin & Newsted (1999) report that minimal
recommendations for sample sizes for PLS analysis range from 30 to 100. Also, a rule of thumb often
used to determine the minimal sample size required for PLS is to take the larger of two possibilities: 1)
the block with the largest number of formative indicators, or 2) the dependent latent variable with the
largest number of independent variables impacting it. Then the largest number of these options should
be multiplied by ten to calculate the minimum sample size requirement. Using this heuristic, the
minimal sample for this model size would be 60 (explanation: the largest construct used in the
conceptual model exists of 6 measurement-items). Therefore, the smallest sample size of 100 for
scenario 1, used in this research, is sufficient for PLS analysis.
Another advantage of PLS is the simultaneous estimation of the measurement model and the
structural model. Also it´s methodologically advantageous to CBSEM whenever improper or
nonconvergent results are likely to occur. With more complex models, the number of latent and
manifest variables may be high in relation to the number of observations. Finally, PLS path modeling
can be used when distributions are highly skewed (Bagozzi, 1994), or the independence of
observations is not assured, because, as Fornell (1982, p. 443) has argued, “There are no distributional
requirements” “(Henseler et al., 2009).
5.3.1 Reliability and Validity of the measurement model
First the adequacy of the measurement model was reviewed. Basic item correlation analysis in
SPSS showed that CC6, which was intended as a “Multi-channel consistency measure” didn´t load on
this construct. It also didn‟t load on the other multichannel construct; channel service configuration.
On the contrary it created an unwanted third factor and was therefore dropped from the analysis.

47
The analysis of the model´s LV index values shows (table 1) that customers perceive service
quality to be the best at the Business center, than website service quality and finally service quality of
the customer contact center. Also -overall- the values are consistent between scenario´s. With the
exception of NPS in scenario 3 which is significantly smaller than in other scenario´s. A possible
explanation for this is that scenario 3 contains a smaller amount of multichannel customers and that
the experience with the customer contact center has a negative impact on overall Net Promoter Score.
scenario 1 scenario 2 scenario 3 NPS_Overall 6,4242 6,4354 6,1798
SQ Business Center 3,6233 3,7372 3,6811
SQ Customer contact center 2,79 2,8701 2,8096
SQ Website 3,0181 3,0825 3,0494
Multi-channel consistency 2,9181 2,9796 2,942
Channel Service Configuration 3,129 3,2239 3,1722
Table 1: Latent variable Index values for the three different scenario´s.
Individual item reliability in PLS was assessed by inspecting the loadings of the items on their
respective constructs. The guideline recommended by Hulland (1999) was followed therefore items
with loadings below 0.70 were deleted. As a result in all three different scenario´s BC1 was deleted as
a result and WEB 3 was deleted in scenario 2 and 3.
Next, for the remaining items, the convergent validity was checked. Just as in So & Bolloju (2005),
this was done using the internal consistency measure (Fornell & Larcker, 1981). In PLS, internal
consistency can be assessed by the composite reliability measure, which is similar to Cronbachs alpha.
For convergent reliability a minimum 0.80 guideline was followed, based on So & Bolloju (2005). As
can be seen in table 3 (see Appendix A) the composite reliability of all constructs well exceeded
0.80, which means that items load on their constructs very well. The average variance explained was
checked as well. According to So & Bolloju (2005), the average variance explained (AVE) for each
construct has to be at least 0.50. Table 2 (see appendix A) shows that all constructs have an AVE of
more than 0.50.

48
Figure 10: Visualization of the measurement model in SmartPLS
The next step was to assess the discriminant validity. The method used to do so was adapted from
Wuyts and Geyskens (2005). The square root of the average ( AVE ) variance explained by the
construct was compared with the correlations of that construct with other constructs. The average
variance shared between a construct and its measures should exceed the variance between the
construct and other constructs in the model (So & Bolloju, 2005). Table 4 (see appendix A) displays
the latent variable correlations, with on the diagonal the square root of the AVE. The diagonal
elements in table 4 should be greater than the other values in their corresponding columns and rows.
As the results show, all values of AVE are larger than the covariance of that construct with other
constructs, thereby demonstrating good discriminant validity.
Another measure to assess the discriminant validity is by comparing the root AVE values to the
path coefficients they are trying to explain (Hulland, 1999), as can be seen from table 2 and table 5
(see appendix A), all AVE values are larger than the path coefficients related to their respective
constructs. These results provide a second confirmation of discriminant validity
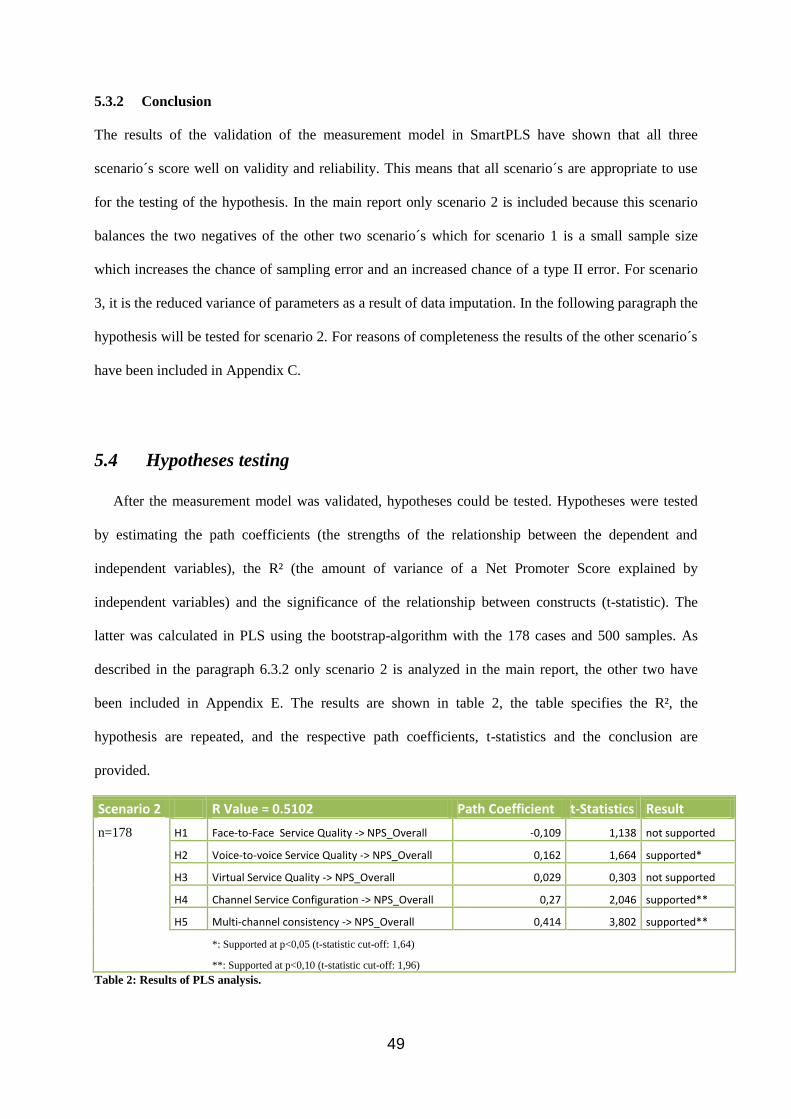
49
5.3.2 Conclusion
The results of the validation of the measurement model in SmartPLS have shown that all three
scenario´s score well on validity and reliability. This means that all scenario´s are appropriate to use
for the testing of the hypothesis. In the main report only scenario 2 is included because this scenario
balances the two negatives of the other two scenario´s which for scenario 1 is a small sample size
which increases the chance of sampling error and an increased chance of a type II error. For scenario
3, it is the reduced variance of parameters as a result of data imputation. In the following paragraph the
hypothesis will be tested for scenario 2. For reasons of completeness the results of the other scenario´s
have been included in Appendix C.
5.4 Hypotheses testing
After the measurement model was validated, hypotheses could be tested. Hypotheses were tested
by estimating the path coefficients (the strengths of the relationship between the dependent and
independent variables), the R² (the amount of variance of a Net Promoter Score explained by
independent variables) and the significance of the relationship between constructs (t-statistic). The
latter was calculated in PLS using the bootstrap-algorithm with the 178 cases and 500 samples. As
described in the paragraph 6.3.2 only scenario 2 is analyzed in the main report, the other two have
been included in Appendix E. The results are shown in table 2, the table specifies the R², the
hypothesis are repeated, and the respective path coefficients, t-statistics and the conclusion are
provided.
Scenario 2 R Value = 0.5102 Path Coefficient t-Statistics Result
n=178 H1 Face-to-Face Service Quality -> NPS_Overall -0,109 1,138 not supported
H2 Voice-to-voice Service Quality -> NPS_Overall 0,162 1,664 supported*
H3 Virtual Service Quality -> NPS_Overall 0,029 0,303 not supported
H4 Channel Service Configuration -> NPS_Overall 0,27 2,046 supported**
H5 Multi-channel consistency -> NPS_Overall 0,414 3,802 supported**
*: Supported at p<0,05 (t-statistic cut-off: 1,64)
**: Supported at p<0,10 (t-statistic cut-off: 1,96)
Table 2: Results of PLS analysis.

50
The customer experience modeled as the service quality on and across channels explains around
0,5102 percent of the variance in Net Promoter Scores as the R² shows. This suggests that the quality
of the service provided by KPN plays a large role in the likelihood that a customer will recommend
KPN to others and become more loyal to KPN.
5.4.1 Net Promoter Score and the single channel experience
The investigation of a relationship between service quality on individual channels and Net
Promoter Score as is hypothesized by H1 to H3 has produced mixed results. Only the relationship
between voice-to-voice service quality and Net Promoter Score has been established. This means that
voice-to-voice service quality plays a significant role in the customers overall evaluation of KPN. This
means that the manner in which the customer‟s questions and complaints are handled play an
important role in driving Net Promoter Score. An explanation for this can be that this is the point
where promises made to the customer are met or broken (service marketing triangle). The promise of a
premium brand like KPN is excellent customer service. Meeting or exceeding these expectations
increases Net Promoter Score.
The individual experience of customers with the KPN business center and the website both do not
influence the customers´ willingness to recommend KPN as a company to others. This means that
although the customer experience expressed by service quality on these two channels can be good.
This does not affect overall Net Promoter Score, which could mean that the expectations of customers
are met; thereby limiting the impact the experience has on Net Promoter Score. The virtual service
quality construct in the final analysis was formed by only three measurement items. This was largely a
result of the way customers use the website; for orientation purposes and information search. It could
be that if more customers used the added functionality of the website this could increase the role of
website service quality in driving Net Promoter Score.

51
5.4.2 Net Promoter Score and multichannel experience
The relationship between Net Promoter Score and the multichannel construct channel service
configuration as hypothesized in H4 is confirmed. This confirms that customer‟s value a channel
service configuration that provides multiple channels that are tailored to their needs. While also
providing the freedom to choose their channel of interaction.
The relationship between Net Promoter Score and the multichannel constructs Multi-channel
consistency as hypothesized in H5 is confirmed. This means that customers value companies that are
able to provide them with consistent information across channels while also taking into account the
interactions that have taken place through other channels. And that customers value a consistent
experience in the look and feel of the company across channels.
This means that the evaluation of the service quality across channels plays an important part in the
consideration of customers whether or not to recommend KPN to friends, relatives and business
relations.
5.5 Alternative model
One of the goals of this research was to determine the importance of providing an integrated customer
experience. The analysis of the original model seems to point to the fact that Net Promoter Score is
influenced most heavily by the evaluations of the multichannel system as a whole. To gain more
knowledge about this process an alternative model is proposed in this paragraph.
The model which is proposed and analyzed hypothesizes that the service quality constructs of
individual channels have an indirect effect on Net Promoter Score through the two multi-channel
constructs. The rationale behind this is that the quality of the experience on different touch-points
leads to an overall assessment of the multichannel system which in turn influences NPS.
The results of running the PLS analysis (table 7) show that this model has no additional explanatory
power over the originally proposed conceptual model, as the R-Square 0,4680. However the
pathcoeficients of this model are all supported (table 8) which leads to the conclusion that the customer

52
experience on all individual channels influences the evaluations of customers about the multichannel
system. Thereby providing further evidence of the importance of an integrated multichannel system in
driving Net Promoter Score. The results should not be interpreted as providing a better model of the
multichannel service system. Because testing a Structural Equation model and analyzing it´s results
cannot establish causality (Hair et al., 2006) . Theoretical support is essential in establishing causality
and the theoretical foundation underlying this model is very slim.
53
6 Conclusions
This chapter first presents the main conclusions of the performed study in paragraph 6.1. Secondly,
the recommendations for KPN management are presented in paragraph 6.2 which are the logical
consequence of theoretical conclusions. In paragraph 6.3, the research questions are revisited and
answered. Finally, the limitations of this research are addressed and suggestions are made for future
research in paragraph 6.4.
6.1 Theoretical conclusions
This study set to determine the drivers of Net Promoter Score in a multichannel service
environment, by integrating the customer experience on and across channels into one model. The
conceptual model is based on the existing service quality literature. It combines the multichannel
constructs put forward by Sousa and Voss (2004) with service quality constructs that assess the
customer experience from a single channel perspective. The results of this study have shown that not
all the hypothesized relationships were supported.
The relationships between service quality on individual channels and Net Promoter Score were not
all supported. Only for the service quality voice-to-voice a relationship was established with Net
Promoter Score. Although subsequent analysis of an alternative model has showed that the service
quality constructs of the website and business center do affect Net Promoter Score indirectly through
the multichannel constructs. It seems that the overall evaluations of customers represented by Net
Promoter Score are only partially influenced by the single channel experience. Whereas Payne and
Frow (2004) assert that “the „touch points‟ where the customer interacts with the supplier in multiple
channels represent the most crucial opportunities to leverage advantage”. In this research the only
touch point for which this hold is the customer contact center. This means that meeting or exceeding
customer´s expectations on this channel is more important than for the other touch points where no
direct relationship with Net Promoter Score was found.

54
In this study both channel service configuration as well as Multi-channel consistency have a strong
and statistically significant effect on Net Promoter Score, which stresses the importance of an
integrated customer experience. This result is in line with previous research (Wright, 2002) which
indicated that multichannel integration plays an important role in the formation of overall customer
evaluations represented by customer satisfaction, loyalty and trust. This additional evidence is
important because empirical evidence on the relationship between these constructs and overall
customer evaluations in the service quality literature is limited. For customers both the positioning of
the different channels and the consistency of the experience across channels provided by a company
are central in the formation of overall evaluations about a company.
The complete model including both the experience on individual channels as the cross-channel
experience clearly demonstrates the importance of the multichannel experience over the single channel
experience. Thereby, providing evidence that customer´s value a seamless and consistent customer
experience across channels. Furthermore, this study shows that the customer experience needs to be
considered across all channels instead of measuring the experience on separate channels. Additional
evidence for this was provided by the testing of an alternative model where the service quality on
individual channels affected Net Promoter Score through the multichannel constructs. Service quality
constructs of individual channels were all found to a have a positive relationship with the multichannel
constructs. This means that the single channel experience plays a role in the formation of overall
perceptions about the multichannel service system which in turn affects Net Promoter Score.
The customer experience on and across channels is an important component of Net Promoter
Score. Around 50 percent of the variance is explained by it. Thus to increase and drive Net Promoter
Score, companies need to provide an integrated multichannel service system which can deliver a
positive customer experience. Because these encounters are key in the formation of the overall
evaluations represented by Net Promoter Score that customers have of a company.

55
6.2 Practical conclusion and managerial recommendations
The results and conclusions of this study also call for managerial recommendations to KPN. The
results indicate that for companies like KPN who are competing within a multichannel service context
the positioning of channels and the consistency of the customer experience across channels is
important. This section suggests a number of recommendations to enhance the multichannel service
system of KPN. It‟s important to note that this research had the SME customers as it scope. This
limitation should be kept in mind when interpreting the recommendations.
6.2.1 Multi-channel consistency
Multi-channel consistency is acknowledged to be important, but how can KPN deliver a consistent
customer experience across channels. The Introduction of a CRM system should be useful in
improving the performance of the multichannel system. This software is necessary and can be used to
create a single view of the customer. However the software in its own right isn´t sufficient, it may
deliver a single view of the customer, it doesn´t avoid the need for employees to be adequately trained,
equipped and motivated to deliver an appropriate level of service across channels. Therefore the
inclusion of the multichannel questions into the current customer survey‟s deployed by KPN is
recommended to investigate whether investments in CRM are increasing Multi-channel consistency
and thereby Net Promoter Score. In other words check whether these investments are really paying
off.
6.2.2 Channel service configuration
KPN should look for ways to increase the adoption of the self service technology it deploys on the
website. The added functionality of the website is used by merely 10 percent of the customers.
Considering this is the channel with lowest cost, and given the fact that 30 percent of the customers
either prefer the website or indicate no channel preference there is much room for improvement.
However from this research it´s not clear how this can be achieved, is it that customers are unaware of
the added functionality or is the quality of the self service technology causing the lack of adoption
56
6.2.3 Individual channels
Investments to improve the customer experience within the customer contact center should be
prioritized over improvements at the other channels. The service quality of the customer contact center
is worse than the service quality at the other channels. Furthermore it has been shown that the service
encounter with the customer contact center is the only encounter that directly affects Net Promoter
Score. Therefore KPN should focus resources on improving the quality of the staff by emphasizing a
service-orientation when recruiting and training service employees.
6.3 Answering the Research Questions
In the first chapter the main Research Question and five sub-research questions were defined. During
this study these questions have all been dealt with and will be answered in this paragraph. First, the
sub-research questions will be answered; using the answers to the sub-research questions, the main
Research Question can then be answered.
RQ1: What is Net Promoter Score and how does this relate to other customer metrics?
Net Promoter Score is a new customer metric that has proven to be superior in predicting customer
behavior and financial performance. Conceptually it combines the concepts of two customer metrics -
word of mouth and loyalty- into one metric. The evidence for this combination is provided through the
observation that customers who are willing to talk positively about a company are also the ones that
display higher customer loyalty (Reichheld, 2003).
RQ2: What is Multichannel Customer Management and its related theories?
Multichannel customer management deals with the challenges of providing service through multiple
service channels. While this increase in available channels and the infusion of technology can provide
increased levels of customer choice and service, it can also be a source of dissatisfaction. Theories that
have been reviewed and used in this research include:
The concept of technology mediation of Bitner (2001).

57
The adoptions that have been made to the service quality instrument to capture the changing
nature of the service encounter (Burger et al.,2000; Dean, 2002; Zeithaml et al., 2002; Yoo
and Donthu 2001).
The conceptualization of an integrated multichannel experience by Sousa and Voss (2006)
RQ3: What drives the customer experience expressed in Net Promoter Score on individual
channels?
The driver of customer experience on individual channels was hypothesized to Service Quality. The
results of the research on indicate that the relationship between service quality on individual channels
and Net Promoter Score were not all supported. Only for the service quality voice-to-voice a
relationship was established with Net Promoter Score. Although subsequent analysis of an alternative
model has showed that the service quality constructs of the website and business center may affect Net
Promoter Score indirectly through the multichannel constructs. Therefore it´s concluded that the
overall evaluations of customers represented by Net Promoter Score are only partially influenced by
the single channel experience.
RQ4: What drives the customer experience expressed in Net Promoter Score across different
channels?
In this study both constructs proposed to capture the experience across channels: channel service
configuration as well as Multi-channel consistency are found to have a significant positive effect on
Net Promoter Score. Which means that customer value an integrated multichannel service experience.
RQ5: How can these two views of the customer experience be integrated into one model to evaluate
the importance of individual channels versus channel integration?
The conceptual model presented in chapter 3, integrated these two views of the customer experience
by linking them separately to the concept of Net Promoter Score. This approach has the advantage that
it allows companies to pin-point exactly where improvements in the multichannel system should be
made.

58
Main Research Question: Which factors influence Net Promoter Score in a Multi-channel
Service Environment?
The complete model including both the experience on individual channels as the cross-channel
experience clearly demonstrates the importance of the multichannel experience over the single channel
experience. Thereby, providing evidence that customers value a seamless and consistent customer
experience across channels. The factors that directly influence Net Promoter Score are Service Quality
voice-to-voice and the multichannel constructs Channel service configuration and Multi-channel
consistency.
6.4 Limitations
As with any study, the findings must be interpreted in light of their limitations, which also point to
potential directions for future research. Firstly, while the service quality literature is quite extensive,
the literature on service quality across multiple channels is limited. Therefore, the theoretical basis of
this research is predominantly derived from the conceptualization of the field provided by Sousa and
Voss (2004). Also it should be noted that this study makes a contribution towards the building of a
model that explains the variance in Net Promoter Score within a multichannel environment based on a
review of the literature. The used set of constructs (Net Promoter Score, service quality, customer
satisfaction, trust, brand equity, payment equity) isn´t complete and future research could provide the
inclusion of a more exhaustive number of constructs and could thereby improve the R-value of the
model. Also additional research could replicate this study in other settings (e.g. companies, industries,
and countries) using the similar channels to further validate the model.
Other limitations relate to methodology and sample. Firstly, refined instrument to measure the
customer experience were not available from the literature, therefore the instruments used in this study
require extension and further psychometric testing. Secondly, the questionnaire was designed to be
answered by the person responsible for the purchase of communications products. However, in a B2B
context, the organizational decision making process is complex, involving a group of decision makers.

59
Therefore, it might be difficult for a single person to give fully representative answers on such
subjects. Thirdly, data were collected using an e-mail survey which was considered to be feasible for
multichannel customers. However it has limitations in terms of a low response rate and common
method variance (Mitchell. 1985). And although the sample appears to be representative, non-response
error may have caused some bias in the results. Fourthly, the large amount of missing data resulted in
a reduced sample size, and the data could not be analyzed without some form of data imputation.
While carefully applied it is a limitation to the generalisability of the research results.
Finally, with the expected future adoption of new virtual channels for service delivery (e.g. Mobile
devices), future research will need to address the impact of these new channels on the multichannel
experience and reflect on new integration challenges.

60
References
Aaker, David A, (1991), ”Managing brand equity”, New York: The free press, ISBN 0-02-900101-3
Allison, P. D. (2001). Missing data. Thousand Oaks, CA: Sage Publications.
Anderson, E.W., Fornell, C. & Rust, R.T., (1997). Customer satisfaction, productivity, and
profitability: differences between goods and services, Marketing Science, 16, 2, 129–145.
Anderson, E.W & Sullivan, M.W., (1993). The Antecedents and Consequences of Customer
Satisfaction for Companies, Marketing Science, 12, 2, 125–143.
Ariely, D., (2000). Controlling the information flow: Effects on consumers‟ decision making and
preferences, Journal of Consumer Research, 27(2), 233-248.
Bansal, H. S., & Voyer, P. A., (2000). Word-of-mouth processes within a services purchase decision
context. Journal of Service Research, 2(3), 166−177.
Bamert, T.; Wehrli, H.P., (2005), “Service quality as an important dimension of brand equity in Swiss
services industries”, Managing Service Quality; 15, 2;pg. 132
Bei, L.T., Chaio, Y-C., (2007). The determinants of customer loyalty an analysis of intangible factors
in three service industries. International Journal International Journal of Conflict Management
Vol.16, pp. 162 -176.
Birgelen van, M. V., De Jong A., De Ruyter K., 2006, Multi- channel service retailing: the effects of
channel performance satisfaction on behavioural intentions, Journal of Retailing, Vol. 82, n 4, pp.
367- 377.
Bitner, M.J., S.W. Brown and M.L. Meuter (2000). Technology infusion in service encounters,
Journal of the Academy of Marketing Science, 28 (Winter), 138–149.
Bolton, R.N., Kannan, P.K. & Bramlett, M.D., (2000). Implications of Loyalty Program Membership
and Service Experiences for Customer Retention and Value, Journal of the Academy of Marketing
Science, 28, 1, 95–108.
Bolton, R. N., & Lemon, K. N., (1998). A dynamic model of customers‟ usage of services: Usage as
an antecedent and consequence of satisfaction. Journal of Marketing Research, 36(May),
171-186.
Bosshof, C., (1999), Recovsat An Instrument to Measure Satisfaction with Transaction-Specific
Service Recovery, Journal of Service Research, Vol. 1, No. 3, 236-249.
Brandt, D. Randall, A.D, (2007). On the one number you need to grow, one size doesn't fit all.
Marketing Management, Vol 16, No. 01, pp. 20-25.
Burgers A, De Ruyter K, Keen C, Streukens S. Customer expectation dimensions of voice-to-voice
service encounters: a scale-development study. International Journal of Service Industry Management
2000;11(2):142– 61.
Caceres, R. C. and N. G. Paparoidamis (2007). "Service quality, relationship satisfaction, trust,
commitment and business-to-business loyalty." European journal of marketing 41(7/8): 836.

61
Cassab, H. and MacLachlan, D.L., (2009). A consumer-based view of multi-channel service, Journal
of Service Management, Vol. 20 No. 1, pp. 52-75.
CBS StatLine, Arbeidsdeelname 15 jaar of ouder.
http://statline.cbs.nl/StatWeb/publication/?VW=T&DM=SLNL&PA=71958NED&D1=8-9&D2=1-
2&D3=8-10&D4=0-6,11,16,21,26,31,36,41&HD=091012-1001&HDR=T&STB=G1,G2,G3
Cronin, J.J. Jr., Taylor, S.A., (1992). Measuring Service Quality: A re-examination and extension.
Journal of Marketing, Vol. 56, No. 3, pp. 34-58.
Dean, A.M. (2002), “Service quality in call centres: implications for customer loyalty”, Managing
Service Quality, Vol. 12 No. 6, pp. 414-23.
Dick, A.S. & Basu, K., (1994), Customer loyalty: toward an integrated conceptual framework, Journal
of the Academy of Marketing Science, 22, 2, 99–113.
East, R., Hammond, K., Lomax, W., & Robinson, H. (2005). What is the effect of a recommendation?
The Marketing Review, 5(2), 145−157.
East, R., Hammond, K. A., & Wright, M. (2007). The relative incidence of positive and negative word
of mouth: A multi-category study. International Journal of Research in Marketing, 24(2), 175−184.
Feinberg, R.A., Kim, I-S., Hokama, L., de Ruyter, K. And Keen, C. (2000). Operational determinants
of caller satisfaction in the call center”, International Journal of Service Research, Vol 11 No. 2, pp.
131-141.
Fitzsimmons, J.A. and Fitzsimmons, M.J., (2004), Service Management: Operations, Strategy, and
Information Technology, McGraw-Hill, New York, NY.
Friedman, L. G. and T. R. Furey (1999), The Channel Advantage: Going to Market with Multiple
Sales Channels to Reach More Customers, Sell More Products, Make More Profit, Boston:
Butterworth Heinemann.
Froehle, C.M. and Roth, A.V., (2004). New measurement scales for evaluating perceptions of the
technology-mediated customer service experience. Journal of Operations Management, Vol. 22 No. 1,
pp. 1-21.
Gilmore, A. (2001). Call centre management: Is service quality a priority? Managing Service Quality,
Vol. 11, No.3, 152-159.
Gounaris, S., (2005). Measuring service quality in b2b services: an evaluation of the SERVQUAL
scale vis-à-vis the INDSERV scale. Journal of Services Marketing, Vol. 19, No. 6, pp. 421 – 435.
Grönroos, C., (2000). Creating a Relationship Dialogue: Communication, Interaction and Value.
The Marketing Review, Vol. 1, 5-14.
Griffith, D.A. and Krampf, R.F., (1998). An examination of the web-based strategies of the top 100
US retailers . Journal of Marketing Theory and Practice, Vol. 6 No. 3, pp. 12-23.
Gupta, P., Donald R. Lehmann, Stuart, J.A., (2004), Valuing customers , Journal of Marketing
Research, 41(1), 7–18.

62
Gustafsson, A., Johnson, M.D., Roos, I., (2005). The Effects of Customer Satisfaction, Relationship
Commitment Dimensions, and Triggers on Customer Retention , Journal of Marketing, 69(4), 210-218
Shah, S. K., & Corley, K. G. (2006). Building Better Theory by Bridging the Quantitative-Qualitative
Divide. Journal of Management Studies , 43 (8), 1821-1835.
Jones, Thomas, Earl Sasser., (1995). Why satisfied customers defect, Harvard Business. Review
73(Nov.–Dec.) 88–99.
Kamakura, Wagner, Mela, (2006). Choice models and customer relationship management. Marketing
Lett.16(4) 279–291.
Keaveney, S. M. (1995). Customer switching behavior in service industries: An exploratory study.
Journal of Marketing, 59(2), 71−82.
Keiningham, T. L., Cooil, B., Andreasson, T. W., & Aksoy, L., (2008). Linking Customer Loyalty to
Growth . MITSloan Management Review, Vo. 49, No.4.
Keiningham, T. L., Cooil, B., Andreasson, T. W., & Aksoy, L., (2007). A longitudinal examination of
„net promoter‟ and company revenue growth . Journal of Marketing, 71(3), 39−51.
Keiningham, T. L., Cooil, B., Aksoy, L., Andreassen, T.W., &Weiner, J., (2007). The value of
different customer satisfaction and loyalty metrics in predicting customer retention, recommendation,
and share-of-wallet . Managing Service Quality, 17(4), 361−384.
Keller, K.L. (1993), “Conceptualizing, measuring, and managing customer-based brand equity”,
Journal of Marketing, Vol. 57, January, pp. 1-22.
Kumar, V. & Reinartz, W.J., (2004). The Impact of Customer Relationship Characteristics on
Profitable Lifetime Duration , Journal of Marketing, 67, 77-99.
Kumar, V. and Venkatesan, R., (2005). Who are multi-channel shoppers and how do they perform?
Correlates of multi-channel shopping behavior , Journal of Interactive Marketing, Vol. 19, pp. 44-61.
Ladhari, R., (2008). Alternative measures of service quality: a review. Managing Service Quality, Vol.
18, No.1, pp. 65-86.
Lam, S.Y., Shankar, V., Erramilli, M.K., Murthy, B. (2004). Customer value, satisfaction, loyalty, and
switching costs: an illustration from a business-to-business service context. Journal of the academy of
marketing science, 32
Little, R. J. A. and D. B. Rubin (1987). Statistical analysis with missing data. John Wiley & Sons,
New York.
Liu, Chang and Kirk P. Arnett. (2000). Exploring the Factors Associated With Web Site Success in
the Context of Electronic Commerce. Information and Management, 38 (1): 23-34.
Lynch, J.G.. and Ariely, D., (2000). Wine online: Search costs affect competition on price, quality,
and distribution, Marketing Science 19(1), 83-103.
McDonald, H., Adam, S. (2003). A comparison of online and postal data collection methods in
marketing research. Marketing intelligence & planning, 21 (2) 85-95.

63
Mackay, M.M., and Rundle-Thiele, S. (2001), “Assessing the performance of brand loyalty measures”,
Journal of Services Management, Vol. 7, pp. 529-46.
McIlroy, A. & Barnett, S., (2000). Building customer relationships: do discount cards work?,
Managing Service Quality, 10, 347-355.
Meuter, M. L.; Ostrom, A.L.; Roundtree, R.I.; and Bitner, M.J., (2000). Self-service technologies:
Understanding customer satisfaction with technology-based service encounters. Journal of Marketing
64(3), 50-64.
Mittal, Vikas, Wagner Kamakura., (2001). Satisfaction, repurchase intent, and repurchase behavior:
Investigating the moderating effect of customer characteristics. Journal of Marketing Research 38(1)
131–142.
Montoya-Weiss, M.M., Voss, G.B., and Grewal, D., (2003). Determinants of online channel use and
overall satisfaction with a relational multichannel service provider, Journal of the Academy of
Marketing Science, 31 (4), 448–458.
Morgan, N. A., & Rego, L. L. (2006). The value of different customer satisfaction and loyalty metrics
in predicting business performance . Marketing Science, 25(5), 426−439.
Muthuraman, B., Sen, A., Gupta, P., Seshadri, D. and Narus, J. (2006), Understanding the process of
transitioning to customer value management , Vikalpa, Vol. 31 No. 2, pp. 1-27.
Neslin, S.A., Grewal, D., Leghorn, R., Shankar, V., Teerling, M.L., Thomas, J.S. and Verhoef, P,
(2006). Challenges and opportunities in multi-channel customer management . Journal of Service
Research, Vol. 9 No. 2, pp. 95-112.
Newman, I., and C.R. Benz (1998), Qualitative research methodology: exploring the interactive
continuum, Thousand Oaks, CA: Sage Publictions
O‟Cass, A., & Grace (2004), D. Exploring consumer experiences with a service brand, Journal of
Product & Brand Management ,Vol. 13, No. 4, pp. 257-268
Oliver, R., (1997), Satisfaction: A Behavioral Perspective on the Consumer, McGraw-Hill, New
York.
Onkvisit, S. and Shaw, J.J. (1989), “The international dimension of branding: strategic consideration
and decisions”, International Marketing Review, Vol. 6 No. 3, pp. 22-34.
Onwuegbuzie, Anthony J., Leech., N.I. (2005), “Taking the “Q” Out of research: Teachin research
methodlogy cources without the divide between quantitative and qualitative paradigms. Quality and
Quantity, 39, 267-296
Padgett, D., & Allen, D. (1997). Communicating Experiences: A Narrative Approach to Creating
Service Brand Image. Journal of Advertising, 26 (4), 49–62.
Parasuraman, A., V.A. Zeithaml, and A. Malhotra (2005), E-S-QUAL: A Multiple-Item Scale for
Assessing Electronic Service Quality, Journal of Service Research, 7(3), 213-33.
Parasuraman, A., V.A. Zeithaml and L.L. Berry (1988). SERVQUAL: A multiple-item scale for
measuring consumer perceptions of service quality, Journal of Retailing, 64 (Spring), 12–40.
Patricio, L., R.P. Fisk and J. Falcao e Cunha (2003). Improving satisfaction with bank service
offerings: Measuring the contribution of each delivery channel, Managing Service Quality, 13 (6),
471–482.

64
Payne, A., & P. Frow (2004), The role of multichannel integration in customer relationship
management, Industrial Marketing Management 33 (2004) 527–538
Philips, L.W., Chang, D.R., Buzzell, R.D. (1983), "Product quality, cost position and business
performance: a test of some key hypotheses", Journal of Marketing, Vol. 47 No.2, pp.26-43.
Reichheld, F. F. (2006). The microeconomics of customer relationships, MIT Sloan Management
Review. Vol. 47. No.2.
Reichheld, F. F. (2003), The one number you need to grow, Harvard Business Review, 81(12), 46−54.
Rosenbloom, B. (2007). Multi-channel strategy in business-to-business markets: Prospects and
problems. Industrial Marketing Management, 36 (1), 4-9
Rubin, D.B. (1987). Multiple imputation for nonresponse in surveys. John Wiley & Sons, New York.
Rubin, D.B. (1996). Multiple imputation after 18+ years. Journal of the American Statistical
Association 91: 473-489.
Schafer, J.L. (1997) Analysis of incomplete multivariate data. Chapman & Hall, London. Book No.
72, Chapman & Hall series Monographs on Statistics and Applied Probability.
Schafer, J.L. (1999). Multiple imputation: A primer. Statistical Methods in Medical Research. 8: 3-15.
Schafer, J.L. and M. K. Olsen (1998). Multiple imputation for multivariate missing-data problems: A
data analyst's perspective. Multivariate Behavioral Research. 33: 545-571
Shankar, V., Smith, A.K. and Rangaswamy, A. (2003). Customer satisfaction and loyalty in online
and offline environments , International Journal of Research in Marketing, Vol. 20, pp. 153-75.
Terblanche, N.S. Boshoff, C. (2006), The relationship between a satisfactory in-store shopping
experience and retailer loyalty South African Journal of Business Management, 37 (2) 33-43
Van Aken, J. (2004) “Management Research Based on the Paradigm of the Design Sciences: The
Quest for Field-tested and Grounded Technological Rules,” Journal of Management Studies, (41)2, pp.
219-246.
Van Aken, J. (2005) “Management Research as a Design Science: Articulating the Research Products
of Mode 2 Knowledge Production in Management,” British Journal of Management, (16)1, pp. 19-36.
Varuki, Sajeev and Mark Colgate (2001), “The Role of Price Perceptions in an Integrated Model of
Behavioral Intentions,” Journal of Service Research, 3 (3), 232–40.
Venkatesh, V., (2000), Determinants of perceived Ease of Use: Integrating Control, Intrinsic
motivation, and Emotion into the Technology Acceptance Model, Information Systems Research,
11(4), pp. 342-365.
Verhoef, P., Franses, P.H. and Hoekstra, J.C. (2002), “The effect of relational constructs on customer
referrals and number of services purchased from a multiservice provider: does age of relationship
matter?”, Journal of the Academy of Marketing Science, Vol. 30 No. 3, pp. 202-16.
Wallace, D.W., Giese, J.L., Johnson, J.L., (2004). Customer retailer loyalty in the context of multiple
channel strategies, Journal of Retailing, 80, 249–263.

65
Wolfinbarger, M.; and Gilly, M.C., (2003). eTailQ: dimensionalizing, measuring and predicting etail
quality, Journal of Retailing, 79(3), 183-198.
Womack, James P. and Daniel T. Jones (2005), “Lean Consumption,” Harvard Business Review, 83
(3), 58-68.
Wilson, H., Street., R., Bruce, L. (2008), The Multichannel Challenge, integrating Customer
Experiences for Profit, Butterworth Heinemann ISBN-13: 9780750687119
Wilson, W. R., & Peterson, R. A., (1989). Some limits on the potency of word-of-mouth information.,
Advances in Consumer Research, 16, 23−29.
Wright, K. B. (2005). Researching Internet-based populations: Advantages and disadvantages of
online survey research, online questionnaire authoring software packages, and web survey services.
Journal of Computer-Mediated Communication, 10 (3), article 11
Yoo, B.; and Donthu, N. 2001. Developing a scale to measure the perceived quality of an Internet
shopping site (SITEQUAL), Quarterly Journal of Electronic Commerce 2(1), 31-45.
Yoo, B. and Donthu, N. (2001), “Developing and validating a multidimensional consumer-based
brand equity scale”, Journal of Business Research, Vol. 52 No. 1, pp. 1-14.
Zeithaml, V.A., (2000). Service quality, profitability, and the economic worth of customers: what we
know and what we need to learn , Journal of the Academy of Marketing Science, Vol. 28 No. 1, pp.
67-85.
Zeithaml, V.A., Berry, L. and Parasuraman, A., (1996). The behavioral consequences of service
quality, Journal of Marketing, Vol. 60, pp. 31-46.
Zeithaml, V.A., Parasuraman, A. and Malhotra, N., (2005). E-S-qual: a multiple-item scale for
assessing electronic service quality , Journal of Service Research, Vol. 7 No. 3, pp. 213-33.
Zeithaml, V.A., Parasuraman, A. and Malhotra, N., (2002). Service quality delivery through web sites:
a critical review of extant knowledge , Journal of the Academy of Marketing Science, Vol. 30 No. 4,
pp. 362-75.
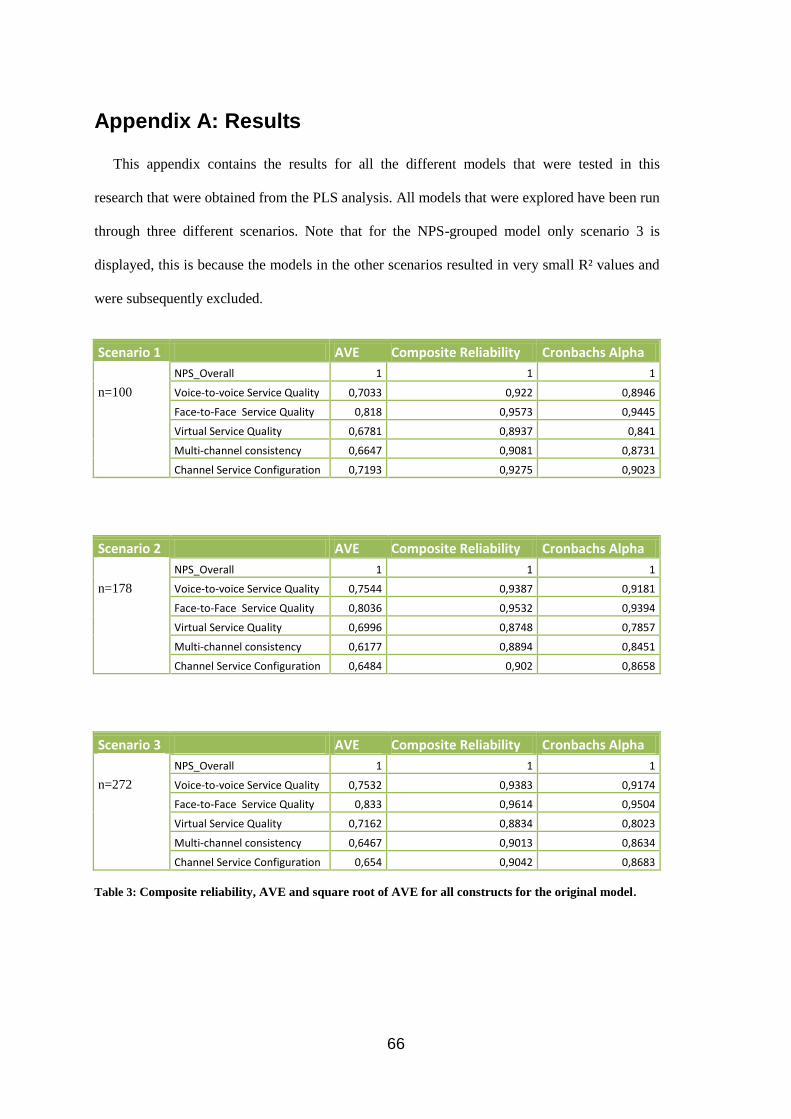
66
Appendix A: Results
This appendix contains the results for all the different models that were tested in this
research that were obtained from the PLS analysis. All models that were explored have been run
through three different scenarios. Note that for the NPS-grouped model only scenario 3 is
displayed, this is because the models in the other scenarios resulted in very small R² values and
were subsequently excluded.
Scenario 1 AVE Composite Reliability Cronbachs Alpha
NPS_Overall 1 1 1
n=100 Voice-to-voice Service Quality 0,7033 0,922 0,8946
Face-to-Face Service Quality 0,818 0,9573 0,9445
Virtual Service Quality 0,6781 0,8937 0,841
Multi-channel consistency 0,6647 0,9081 0,8731
Channel Service Configuration 0,7193 0,9275 0,9023
Scenario 2 AVE Composite Reliability Cronbachs Alpha
NPS_Overall 1 1 1
n=178 Voice-to-voice Service Quality 0,7544 0,9387 0,9181
Face-to-Face Service Quality 0,8036 0,9532 0,9394
Virtual Service Quality 0,6996 0,8748 0,7857
Multi-channel consistency 0,6177 0,8894 0,8451
Channel Service Configuration 0,6484 0,902 0,8658
Scenario 3 AVE Composite Reliability Cronbachs Alpha
NPS_Overall 1 1 1
n=272 Voice-to-voice Service Quality 0,7532 0,9383 0,9174
Face-to-Face Service Quality 0,833 0,9614 0,9504
Virtual Service Quality 0,7162 0,8834 0,8023
Multi-channel consistency 0,6467 0,9013 0,8634
Channel Service Configuration 0,654 0,9042 0,8683
Table 3: Composite reliability, AVE and square root of AVE for all constructs for the original model.

67
Scenario 1 (n=100)
BC Service Quality
CCC Service Quality
Multi-channel consistency
Channel Service Configuration NPS_Overall
WEB Service Quality
Face-to-Face Service Quality 0,904 0 0 0 0 0
Voice-to-voice Service Quality 0,505 0,823 0 0 0 0
Multi-channel consistency 0,599 0,688 0,815 0 0 0
Channel Service Configuration 0,605 0,759 0,691 0,848 0 0
NPS_Overall 0,49 0,641 0,707 0,698 1 0
Virtual Service Quality 0,505 0,471 0,559 0,596 0,5 0,823
Scenario 2 (n=178)
BC Service Quality
CCC Service Quality
Multi-channel consistency
Channel Service Configuration NPS_Overall
WEB Service Quality
Face-to-Face Service Quality 0,896 0 0 0 0 0
Voice-to-voice Service Quality 0,466 0,869 0 0 0 0
Multi-channel consistency 0,612 0,664 0,786 0 0 0
Channel Service Configuration 0,613 0,735 0,711 0,805 0 0
NPS_Overall 0,399 0,597 0,662 0,632 1 0
Virtual Service Quality 0,462 0,435 0,527 0,538 0,413 0,836
Scenario 3 (n=272)
BC Service Quality
CCC Service Quality
Multi-channel consistency
Channel Service Configuration NPS_Overall
WEB Service Quality
Face-to-Face Service Quality 0,913 0 0 0 0 0
Voice-to-voice Service Quality 0,558 0,868 0 0 0 0
Multi-channel consistency 0,581 0,691 0,804 0 0 0
Channel Service Configuration 0,673 0,739 0,686 0,809 0 0
NPS_Overall 0,486 0,605 0,619 0,617 1 0
Virtual Service Quality 0,487 0,454 0,561 0,554 0,38 0,846
Table 4: Latent variable correlations and square root AVE (underlined on diagonal) for the original model.

68
Scenario 1 R Value = 0.5894 Path Coefficient t-Statistics Result
n=100 H1 BC Service Quality -> NPS_Overall -0,024 0,334 not supported
H2 CCC Service Quality -> NPS_Overall 0,107 1,502 not supported
H3 WEB Service Quality -> NPS_Overall 0,05 0,959 not supported
H4 Channel Service Configuration -> NPS_Overall 0,333 3,556 supported**
H5 Multi-channel consistency -> NPS_Overall 0,392 5,135 supported**
*: Supported at p<0,05 (t-statistic cut-off: 1,64)
**: Supported at p<0,10 (t-statistic cut-off: 1,96)
Scenario 2 R Value = 0.5102 Path Coefficient t-Statistics Result
n=178 H1 BC Service Quality -> NPS_Overall -0,109 1,138 not supported
H2 CCC Service Quality -> NPS_Overall 0,162 1,664 supported*
H3 WEB Service Quality -> NPS_Overall 0,029 0,303 not supported
H4 Channel Service Configuration -> NPS_Overall 0,27 2,046 supported**
H5 Multi-channel consistency -> NPS_Overall 0,414 3,802 supported**
*: Supported at p<0,05 (t-statistic cut-off: 1,64)
**: Supported at p<0,10 (t-statistic cut-off: 1,96)
Scenario 3 R Value = 0,4721 Path Coefficient t-Statistics Result
n=272 H1 BC Service Quality -> NPS_Overall 0,047 0,699 not supported
H2 CCC Service Quality -> NPS_Overall 0,205 3,368 supported**
H3 WEB Service Quality -> NPS_Overall -0,053 0,884 not supported
H4 Channel Service Configuration -> NPS_Overall 0,255 3,003 supported**
H5 Multi-channel consistency -> NPS_Overall 0,306 4,372 supported**
*: Supported at p<0,05 (t-statistic cut-off: 1,64)
**: Supported at p<0,10 (t-statistic cut-off: 1,96)
Table 5: R², Path Coeffient, t-statistic and results for the original Model.

69
scenario 1 R=0,6934 Path coefficient t-statistic Result
FF -> NPS_Overall -0,133 1,598 not supported
CC -> NPS_Overall 0,213 1,801 supported*
VV -> NPS_Overall -0,078 0,728 not supported
CSC -> NPS_Overall 0,337 3,252 supported**
OBE -> NPS_Overall 0,329 2,948 supported**
PE -> NPS_Overall -0,097 1,2427 not supported
SA -> NPS_Overall 0,113 0,9 not supported
TR -> NPS_Overall 0,133 1,036 not supported
VIR-> NPS_Overall 0,113 1,246 not supported
*: Supported at p<0,05 (t-statistic cut-off: 1,64)
**: Supported at p<0,10 (t-statistic cut-off: 1,96)
scenario 2 R=0.6749 Path coefficient t-statistic Result
FF -> NPS_Overall -0,19 3,286 supported**
CC -> NPS_Overall 0,165 1,502 not supported
VV -> NPS_Overall -0,069 1,041 not supported
CSC -> NPS_Overall 0,249 3,302 supported**
OBE -> NPS_Overall 0,212 2,566 supported**
PE -> NPS_Overall -0,0442 0,8023 not supported
SA -> NPS_Overall 0,362 3,672 supported**
TR -> NPS_Overall 0,142 1,49 not supported
VIR-> NPS_Overall 0,06 0,848 not supported
*: Supported at p<0,05 (t-statistic cut-off: 1,64)
**: Supported at p<0,10 (t-statistic cut-off: 1,96)
scenario 3 R=0.6594 Path coefficient t-statistic Result
F-F -> NPS_Overall -0,107 1,951 supported*
CC -> NPS_Overall 0,126 1,758 supported*
V-V -> NPS_Overall -0,003 0,048 not supported
CSC -> NPS_Overall 0,217 3,582 supported**
OBE -> NPS_Overall 0,203 3,439 supported**
PE -> NPS_Overall -0,0228 0,4795 not supported
SA -> NPS_Overall 0,448 6,031 supported**
TR -> NPS_Overall 0,057 0,709 not supported
VIR-> NPS_Overall -0,028 0,563 not supported
*: Supported at p<0,05 (t-statistic cut-off: 1,64)
**: Supported at p<0,10 (t-statistic cut-off: 1,96)
Table 6: Path coefficient, t-statistic and Result for the model including other known customer metrics

70
Scenario 1 Construct AVE Composite Reliability R Square Cronbachs Alpha
n=100 F-F 0,8188 0,9576 0 0,9445
CC 0,6642 0,908 0,3662 0,8731
V-V 0,7259 0,9297 0 0,9058
CSC 0,7456 0,9214 0,6336 0,8862
NPS_Overall 1 1 0,581 1
VIR 0,6778 0,8935 0 0,841
Scenario 2 Construct AVE Composite Reliability R Square Cronbachs Alpha
n=178 F-F 0,8062 0,954 0 0,9394
CC 0,6179 0,8895 0,3873 0,8451
V-V 0,7656 0,9422 0 0,9234
CSC 0,6981 0,9023 0,5885 0,8559
NPS_Overall 1 1 0,468 1
VIR 0,6015 0,857 0 0,7756
Scenario 3 Construct AVE Composite Reliability R Square Cronbachs Alpha
n=272 F-F 0,8347 0,9619 0 0,9504
CC 0,6469 0,9014 0,3457 0,8634
V-V 0,7735 0,9446 0 0,9267
CSC 0,6987 0,9026 0,6002 0,8565
NPS_Overall 1 1 0,4311 1
VIR 0,6234 0,8682 0 0,7964
Table 7: Ave, Composite reliability, R square Cronbachs Alpha for alternative multichannel model

71
scenario 1 Path coefficient t-statistic Result
BC -> CC 0,6051 8,8444 supported**
BC -> NPS_Overall 0,2588 3,7255 supported**
CC -> NPS_Overall 0,4277 4,3586 supported**
CCC -> CSC 0,5899 9,2197 supported**
CCC -> NPS_Overall 0,2363 3,3792 supported**
CSC -> NPS_Overall 0,4005 4,0412 supported**
WEB -> CSC 0,3208 4,5668 supported**
WEB -> NPS_Overall 0,1285 3,2377 supported**
*: Supported at p<0,05 (t-statistic cut-off: 1,64)
**: Supported at p<0,10 (t-statistic cut-off: 1,96)
scenario 2 Path coefficient t-statistic Result
BC -> CC 0,6051 8,8444 supported**
BC -> NPS_Overall 0,2588 3,7255 supported**
CC -> NPS_Overall 0,4277 4,3586 supported**
CCC -> CSC 0,5899 9,2197 supported**
CCC -> NPS_Overall 0,2363 3,3792 supported**
CSC -> NPS_Overall 0,4005 4,0412 supported**
WEB -> CSC 0,3208 4,5668 supported**
WEB -> NPS_Overall 0,1285 3,2377 supported**
*: Supported at p<0,05 (t-statistic cut-off: 1,64)
**: Supported at p<0,10 (t-statistic cut-off: 1,96)
scenario 3 Path coefficient t-statistic Result
BC -> CC 0,6224 12,398 supported**
BC -> NPS_Overall 0,2953 5,2095 supported**
CC -> NPS_Overall 0,4745 6,255 supported**
CCC -> CSC 0,5516 11,8881 supported**
CCC -> NPS_Overall 0,1443 3,0553 supported**
CSC -> NPS_Overall 0,2616 3,3466 supported**
WEB -> CSC 0,3285 5,6979 supported**
WEB -> NPS_Overall 0,0859 2,9719 supported**
*: Supported at p<0,05 (t-statistic cut-off: 1,64)
**: Supported at p<0,10 (t-statistic cut-off: 1,96)
Table 8: Path coefficient, t-statistic and Result for alternative multichannel model

72
Figure 11, Channel use specified for multichannel users
Figure 12, Gender Figure 13, Age
Figure 14, Level of education Figure 15, company size

73
Figure 16, Role within company Figure 17, Self reported share of wallet.
Figure 18, Channel use and Age Figure 19, Channel use and Level of Education

74
Figure 20, Channel use Size of Company Figure 21, Channel use and Self reported SOW
Figure 22, Channel use and channel preference

75
Univariate Statistics
N Mean Std. Deviation
Missing No. of Extremesb
Count Percent Low High
NPS_OVERALL 619 4,55 2,445 0 ,0 0 76
CCC_1 423 2,80 1,098 196 31,7 0 0
CCC_2 429 2,69 1,186 190 30,7 0 0
CCC_3 432 2,98 1,227 187 30,2 0 0
CCC_4 430 2,81 1,138 189 30,5 0 0
CCC_5 423 2,99 1,101 196 31,7 0 0
CCC_6 419 2,87 1,077 200 32,3 0 0
WEB_1 439 3,22 ,858 180 29,1 10 0
WEB_2 447 3,15 ,976 172 27,8 0 0
WEB_3 442 3,34 ,779 177 28,6 10 0
WEB_4 392 2,81 ,872 227 36,7 0 6
WEB_5 301 2,94 1,025 318 51,4 0 0
WEB_6 281 3,36 ,808 338 54,6 8 0
WEB_7 267 3,26 ,853 352 56,9 15 0
BC_1 153 3,01 1,085 466 75,3 0 0
BC_2 151 3,60 1,008 468 75,6 7 0
BC_3 151 3,67 1,031 468 75,6 8 0
BC_4 151 3,82 ,967 468 75,6 . .
BC_5 147 3,47 1,075 472 76,3 12 0
BC_6 151 3,91 ,982 468 75,6 14 0
CSC_1 256 3,57 ,909 363 58,6 9 0
CSC_2 251 3,14 1,045 368 59,5 0 0
CSC_3 215 3,23 1,023 404 65,3 18 0
CSC_4 212 3,24 ,893 407 65,8 13 0
CSC_5 242 3,29 ,920 377 60,9 13 0
CC_1 228 2,83 ,956 391 63,2 0 0
CC_2 219 3,14 ,977 400 64,6 19 0
CC_3 231 2,97 ,922 388 62,7 0 0
CC_4 233 3,06 1,101 386 62,4 0 0
CC_5 231 2,80 1,025 388 62,7 0 0
CC_6 248 3,35 ,974 371 59,9 14 0
a. . indicates that the inter-quartile range (IQR) is zero.
b. Number of cases outside the range (Q1 - 1.5*IQR, Q3 + 1.5*IQR).
Figure 23 Missing data for all the measured constructs

76
Figure 24 Missing Values

77
Appendix B: The Measurement Model
In the following table an offline version of the survey that was sent out by e-mail to KPN
customers can be found. The construct to which an item belongs has been specified as accurately as
possible. For the service quality constructs also the dimensions which the questions should reflect
have been included. these dimensions weren‟t part of the final analysis because it would create an
unreasonable lengthy questionnaire.
Dimension Item (dutch) Scale
Item
code
Net Promoter Score
Overall Net Promoter Score
(NPS)
Hoe waarschijnlijk is het, dat u KPN zou aanbevelen bij uw
collega‟s en/of zakenrelaties?
Based on Reicheld,
(2001) NPS_1
NPS Customer Contact
Center
Hoe waarschijnlijk is het, dat u de telefonische dienstverlening
van KPN zou aanbevelen bij uw collega‟s en/of zakenrelaties?
Based on Reicheld,
(2001) NPS_2
NPS Website
Hoe waarschijnlijk is het, dat u de zakelijke website van KPN
zou aanbevelen bij uw collega‟s en/of zakenrelaties?
Based on Reicheld,
(2001) NPS_3
NPS Store
Hoe waarschijnlijk is het, dat u het KPN Business Center zou
aanbevelen bij uw collega‟s en/of zakenrelaties?
Based on Reicheld,
(2001) NPS_4
Control variables
Satisfaction KPN voldoet aan mijn verwachtingen.
Lin et al. (2007) and
Lam et al. (2004) SA_1
Satisfaction Over het geheel gezien ben ik tevreden over KPN.
Lin et al. (2007) and
Lam et al. (2004) SA_2
Trust KPN heeft altijd het beste met mij voor.
Hwang et al. (2007). TR_1
Trust KPN komt gemaakte afspraken na.
Hwang et al. (2007). TR_2
Price Equity Ik ben tevreden over de prijzen van KPN.
Verhoef (2003) and
Bolton & Lemon
(1999). PE_1
Price Equity Ik vind de prijzen van KPN redelijk.
Verhoef (2003) and
Bolton & Lemon
(1999). PE_2
Overall brand equity
Het is verstandig om producten van KPN te kopen in plaats van
een ander merk, ook al zijn deze hetzelfde.
Yoo and Donthu
(2001) OBE_1
Overall brand equity
Als een ander merk net zo goed is als KPN, dan geef ik de
voorkeur aan KPN
Yoo and Donthu
(2001)
OBE_2

78
Channel use
Channel use Customer
Contact Center
Hoe vaak heeft u in het afgelopen half jaar telefonisch contact
gehad met KPN?
CF_1
Channel use Website
Wanneer heeft u voor het laatst een bezoek gebracht aan de
website van KPN?
CF_2
Channel use Store
Wanneer heeft u voor het laatst een bezoek gebracht aan een
KPN Business Center?
CF_3
Channel use Customer
Contact Center
Kunt u aangeven voor welke zaken u telefonisch contact zoekt
met KPN?
CU_1
Channel use Website Kunt u aangeven voor welke zaken u de websitebezoekt?
CU_2
Channel use Store
Kunt u aangeven voor welke zaken u het business center
bezoekt?
CU_3
CCC Service quality
perceptions
Responsivensess De tijd die ik in de wachtrij sta is acceptabel.
Burger et al. (2000) ,
Dean (2002) CCC_1
Reliability
Mijn probleem of vraag wordt in één telefoongesprek
afgehandeld.
Burger et al. (2000) ,
Dean (2002) CCC_2
Reliability
Medewerkers van KPN beschikken over de benodigde kennis
om mijn vragen te beantwoorden.
Burger et al. (2000) ,
Dean (2002) CCC_3
Assurance Ik krijg snel de juiste medewerker aan de lijn.
Burger et al. (2000) ,
Dean (2002) CCC_4
Empathy Medewerkers verplaatsen zich in mijn situatie.
Burger et al. (2000) ,
Dean (2002) CCC_5
Authority
KPN medewerkers hebben de beslissingsbevoegdheid om
problemen op te lossen.
Burger et al. (2000) ,
Dean (2002) CCC_6
Website quality
perceptions
Information quality Op de KPN website staat alle informatie die ik nodig heb.
Zeithaml et al., (2002),
Yoo and Donthu
(2001) WEB_1
Ease of use De KPN website is gebruiksvriendelijk.
Zeithaml et al., (2002),
Yoo and Donthu
(2001) WEB_2
Graphic style De website van KPN ziet er aantrekkelijk uit.
Zeithaml et al., (2002),
Yoo and Donthu
(2001) WEB_3
Responsiveness
De veelgestelde vragen webpagina (FAQ) beantwoord mijn
vragen.
Zeithaml et al., (2002),
Yoo and Donthu
(2001) WEB_4
Responsiveness Vragen die ik stel via e-mail worden snel beantwoord.
Zeithaml et al., (2002),
Yoo and Donthu
(2001) WEB_5
Privacy and security Online bestellen via de KPN website is veilig.
Zeithaml et al., (2002), WEB_6
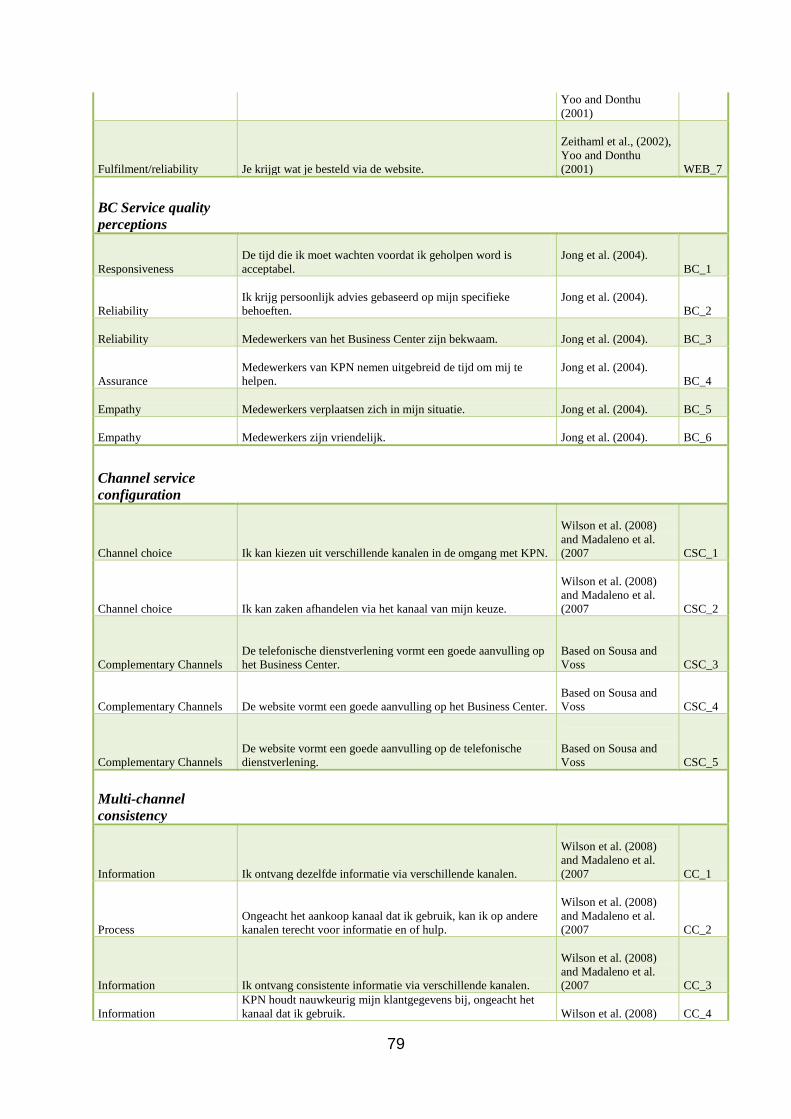
79
Yoo and Donthu
(2001)
Fulfilment/reliability Je krijgt wat je besteld via de website.
Zeithaml et al., (2002),
Yoo and Donthu
(2001) WEB_7
BC Service quality
perceptions
Responsiveness
De tijd die ik moet wachten voordat ik geholpen word is
acceptabel.
Jong et al. (2004).
BC_1
Reliability
Ik krijg persoonlijk advies gebaseerd op mijn specifieke
behoeften.
Jong et al. (2004).
BC_2
Reliability Medewerkers van het Business Center zijn bekwaam.
Jong et al. (2004). BC_3
Assurance
Medewerkers van KPN nemen uitgebreid de tijd om mij te
helpen.
Jong et al. (2004).
BC_4
Empathy Medewerkers verplaatsen zich in mijn situatie.
Jong et al. (2004). BC_5
Empathy Medewerkers zijn vriendelijk.
Jong et al. (2004). BC_6
Channel service
configuration
Channel choice Ik kan kiezen uit verschillende kanalen in de omgang met KPN.
Wilson et al. (2008)
and Madaleno et al.
(2007 CSC_1
Channel choice Ik kan zaken afhandelen via het kanaal van mijn keuze.
Wilson et al. (2008)
and Madaleno et al.
(2007 CSC_2
Complementary Channels
De telefonische dienstverlening vormt een goede aanvulling op
het Business Center.
Based on Sousa and
Voss CSC_3
Complementary Channels De website vormt een goede aanvulling op het Business Center.
Based on Sousa and
Voss CSC_4
Complementary Channels
De website vormt een goede aanvulling op de telefonische
dienstverlening.
Based on Sousa and
Voss CSC_5
Multi-channel
consistency
Information Ik ontvang dezelfde informatie via verschillende kanalen.
Wilson et al. (2008)
and Madaleno et al.
(2007 CC_1
Process
Ongeacht het aankoop kanaal dat ik gebruik, kan ik op andere
kanalen terecht voor informatie en of hulp.
Wilson et al. (2008)
and Madaleno et al.
(2007 CC_2
Information Ik ontvang consistente informatie via verschillende kanalen.
Wilson et al. (2008)
and Madaleno et al.
(2007 CC_3
Information
KPN houdt nauwkeurig mijn klantgegevens bij, ongeacht het
kanaal dat ik gebruik.
Wilson et al. (2008) CC_4

80
and Madaleno et al.
(2007
Information
Ongeacht het kanaal dat ik gebruik, medewerkers zijn
geïnformeerd over mijn vorige contact met KPN.
Wilson et al. (2008)
and Madaleno et al.
(2007 CC_5
Process
Ongeacht het kanaal dat ik gebruik, de indruk die ik van KPN
heb is hetzelfde.
Wilson et al. (2008)
and Madaleno et al.
(2007 CC_6
Moderators
Preffered channel
Via welke wijze neemt u bij voorkeur contact op met KPN?
pre-coded MOD_1
Sales channel
Waar koopt uw organisatie haar telecom
abonnementen/apparatuur?
pre-coded MOD_2
Bedrijfsgroote Hoeveel medewerkers werken er bij uw organisatie?
pre-coded MOD_3
Share of wallet, self-
reported? Welke producten neemt uw bedrijf af bij KPN?
Pre-coded MOD_4
Functional role
Wat is uw rol binnen uw bedrijf als het gaat om aanschaf van
telecomproducten?
Pre-coded MOD_5
Sex Wat is uw geslacht?
pre-coded MOD_6
Age Wat is uw leeftijd?
pre-coded MOD_7
Level of education Wat is uw hoogst genoten opleiding?
pre-coded MOD_8
Table 9, Survey questions, Scales used and Item-code.

81
Appendix C: Model of Gustafsson
In this research the framework of Gustafsson(2005), was used to determine the drivers of Net
Promoter Score. However the decision was made to focus on service quality. In this appendix the other
two dimensions of the model: affective and calculative commitment are included to check whether the
customer experience is indeed the most important factor driving Net Promoter Score. This is done
through the inclusion of a number of control variables. Which are for the calculative part: Brand
equity and Payment equity and for the affection part Trust, and Customer Satisfaction. This appendix
starts with a description of the constructs. Followed by the analysis of the results using SmartPLS and
a discussion of the results.
1.1 Description of the used constructs
Trust
Trust has been shown to be a vital construct in forming loyalty in both offline and online contexts
for exchange settings (e.g. Harris & Goode, 2004). In this thesis trust is used as an affective
component of loyalty. And it represents “„The willingness of a party to be vulnerable to the actions of
another party based on the expectation that the other will perform a particular action important to the
trustor, irrespective of the ability to monitor or control that other party‟ (Olivier, 1997). In the
literature trust – or trustworthiness (Mayer et al, 1995) is build up by three separate dimensions:
ability, integrity and benevolence (Gefen, 2002; Mayer et al., 1995; Hwang et al., 2007). Ability
relates to skills, competencies and characteristics that enable a party to have influence within some
specific domain (Mayer et al., 1995). Integrity is the perception that the trusted part adheres to
accepted rules of conduct, such as honesty and keeping promises (Hwang et al., 2007). Benevolence is
the believe that the trusted party wants to do good to the customer, aside from wanting to make a
legitimate profit (Gefen, 2002). Overall trust is the product of a set of these trust/trustworthiness
beliefs (Gefen, 2002). Customers receive different signals in their dealings with a company which they
interpret and evaluate. These evaluations have an impact on the trust that customers have in their

82
service provider. Trust is build up over time and is therefore likely to be more stable than the
service quality constructs.
Customer Satisfaction
Companies strive to satisfy customers. Over the last decades, being concentrated on what
customers want has become a major company point of focus. The chance of having customers re-
purchase is increased when customers are satisfied with what they have bought and the service they
have been provided with (Oliver, 1999). In marketing literature, customer satisfaction is generally
accepted to be an essential construct in building lasting customer relationships. Satisfaction is used
here as overall satisfaction and reflects the customers‟ collective impressions of performance
(Parasuraman et al. 1994). Satisfaction is a result of the comparison of perceived performance with
expectations. High satisfaction creates an emotional bond with the service provider, exceeding just a
rational preference (Kotler, 2000). Therefore satisfaction is seen as an affective response in Oliver‟s
(1997, 1999) loyalty framework. Satisfied customers are likely to stay longer with a company and do
additional purchases. According to Grönroos (2000) only highly satisfied customers will repurchase
and will engage in word-of-mouth;
Payment equity
In industrial markets, buyers‟ evaluations are typically more rational than in consumer markets
because professionals are making decisions on behalf of the company to help accomplish specified
organizational goals which more often than not involve costs and profitability. To capture this
rationalization researchers have introduced payment equity (Bolton and Lemon, 1999), which is the
customer‟s perceived fairness of the price paid for the company‟s products or services and is closely
related to the customer‟s price perceptions. Payment equity is mainly affected by the company‟s
pricing policy. As a result of its grounding in fairness, a company‟s payment equity also depends on
competitors‟ pricing policies and the relative quality of the offered services or products. Higher
payment equity (i.e., price perceptions) leads to greater perceived utility of the purchased products or
services (Bolton and Lemon 1999). As a result of this greater perceived utility, customers should be
83
more likely to remain with the company. This has been validated by empirical studies which show
that payment equity positively affects customer retention (Bolton et al., 2000; Varuki and Colgate
2001).
Brand equity
Collectively, brand equity consists of four dimensions: brand loyalty, brand awareness, perceived
quality of brand, and brand associations (Aaker., 1991; Keller et al., 1993). Brand equity provides
value to the company by enhancing the efficiency and effectiveness of marketing programs, prices and
profits, brand extensions, trade leverage, and competitive advantage. From the perspective of the
customer strong brands enhance the interpretation and processing of information, confidence in the
purchase decision, and satisfaction (Onkvisit and Shaw, 1989). The consumer-related method of
measuring brand equity can be divided into two groups: those involving consumer perceptions
(perceptual dimension) such as brand awareness, brand associations or perceived quality; and that
involving consumer behavior (behavioral dimension) such as brand loyalty.
While the original research into brand equity was performed in the consumer markets, where
the core offering is quite different from compared to services. Where the core service offering is more
complex, and depends on processes, people and physical facilities. Service marketing Researchers
have argued it´s also applicable in the service context, “Because an extrinsic cue like a brand is a way
to increase the tangible nature of a service” (Mackay and Rundle-Thiele, 2001). Furthermore, Padgett
and Allen (1997) have pointed out that the experience with a company is key determinant of service
brand evaluations. Empirical research on brand equity focusing on service brands is limited; Bamert
and Wehrli (2005) have found that service quality is an important driver of brand equity in a service
context. Another study (O´Cass and Debra Grace, 2004) into the dimensions of service brands
confirms this by showing the importance of the core service and interpersonal service.
Since Net Promoter Score focuses on the overall likelihood that a customer will recommend the
company to others. It is contended that the perceptions of the brand in the mind of the customer play
an important role in this overall assessment.

84
1.2 Measures
The control variables that have been included are measured with the following items. Brand
Equity is measured by two items that are adopted from Yoo and Donthu (2001), who have specifically
designed this instrument to asses overall brand equity. Payment Equity is measured by two items from
Verhoef (2003) and Bolton & Lemon (1999). Trust is measured by two items that were adapted from
Hwang et al. (2007). The measures for satisfaction were adopted from Lin et al. (2007) and Lam et al.
(2004), which asks for general satisfaction and the level of expectation fulfillment
1.3 Results and discussion
Part of the research was to control for other known factors that have been linked in previous
research to loyalty. To do this the other known factors were added to the model, these are: trust,
satisfaction, overall brand equity and payment equity. After that the model was run in PLS for the
three different scenarios, after validation of the measurement model, the added hypotheses were tested.
The results of this analysis indicate that the inclusion of these factors increases the explanatory
power of the model represented by R² for scenario 1,2 and 3 of respectively 0,6934 0,6749 and 0,6594.
The analysis of the pathcoeficients presented in table 7 show that overall brand equity and customer
satisfaction influence Net Promoter Score, whereas payment equity and trust don‟t.
The addition of these extra constructs has a peculiar effect on the original model, the service
quality of the customer contact center is no longer significant instead business center service quality
becomes significant and shows a negative path coefficient. This suggests that a positive experience in
the business center leads to an overall lower Net Promoter Score. An explanation for this effect might
be that a positive experience raises the expectations of customers which aren‟t fulfilled on other
channels, thereby leading to negative overall experience.

85
Appendix D: Controlling for Net Promoter Score groups
A distinct feature of Net Promoter Score is the way it´s calculated, the response on a likelihood
recommendation question is divided into three separate groups; 10-9 promoters, 8-7 Neutral, 6-0
Detractors. Therefore it was decided to recode the Net Promoter Score into three different groups and
re-run the analysis. Thereby assessing whether reducing the number of detractors or increasing the
number of detractors require different improvements to the multichannel service environment as
opposed to just increasing Net Promoter Score. In other words are there specific relationships that
explain why people belong to a certain category suggested by Net Promoter Score.
Table 10: Path coefficient, t-statistic and Result for NPS grouped model, running scenario 3.
The results of this model (Table 10) show that the explanatory power of the model is greatly
reduced by the formation of three separate groups. However the results of the path-analysis (table 8)
show that the same relationships that were established by the original model were validated. This
means that there is no evidence to suggest that different strategies have to be pursued by KPN to get
customers to change groups other than increasing the individual Net Promoter Score of every
customer.
R Value = 0.34 Path Coefficient t-Statistics Result
H1 BC -> NPS_Overall 0,057 0,926 not supported
H2 CC -> NPS_Overall 0,239 2,936 supported**
H3 CCC -> NPS_Overall 0,22 2,759 supported**
H4 CSC -> NPS_Overall 0,186 2,217 supported**
H5 WEB -> NPS_Overall -0,062 0,974 not supported
*: Supported at p<0,05 (t-statistic cut-off: 1,64)
**: Supported at p<0,10 (t-statistic cut-off: 1,96)