the forest for the trees visualizing adverse events andreas brueckner bayer healthcare
TRANSCRIPT

The Forest for the Trees
Visualizing Adverse Events
Andreas BruecknerBayer Healthcare
Disclaimer
• The views and opinions expressed in the following PowerPoint slides are those of the individual presenter and should not be attributed to Drug Information Association, Inc. (“DIA”), its directors, officers, employees, volunteers, members, chapters, councils, Special Interest Area Communities or affiliates, or any organization with which the presenter is employed or affiliated.
• These PowerPoint slides are the intellectual property of the individual presenter and are protected under the copyright laws of the United States of America and other countries. Used by permission. All rights reserved. Drug Information Association, Drug Information Association Inc., DIA and DIA logo are registered trademarks. All other trademarks are the property of their respective owners.
2

Statistical Disclaimer
3

• Motivation• Guidance from Above• Developing Standard Views of Safety Data• Concluding Remarks• References
Outline
4

Motivating Graphic
5

Motivation - Safety
• Safety assessment and risk management is crucial in drug development.
• Recent trends highlight the need for prospectively planned analysis strategies to assess safety.
• Develop standardized tools to summarize and analyze safety data for typical safety issues.
6

More Motivation – Safety Graphics
• Ability to highlight key safety signals and depict key characteristics from both small and large databases.
• The choice of graph and its detailed design should allow a quick decode of the information.
• Improves retention of information displayed.
7
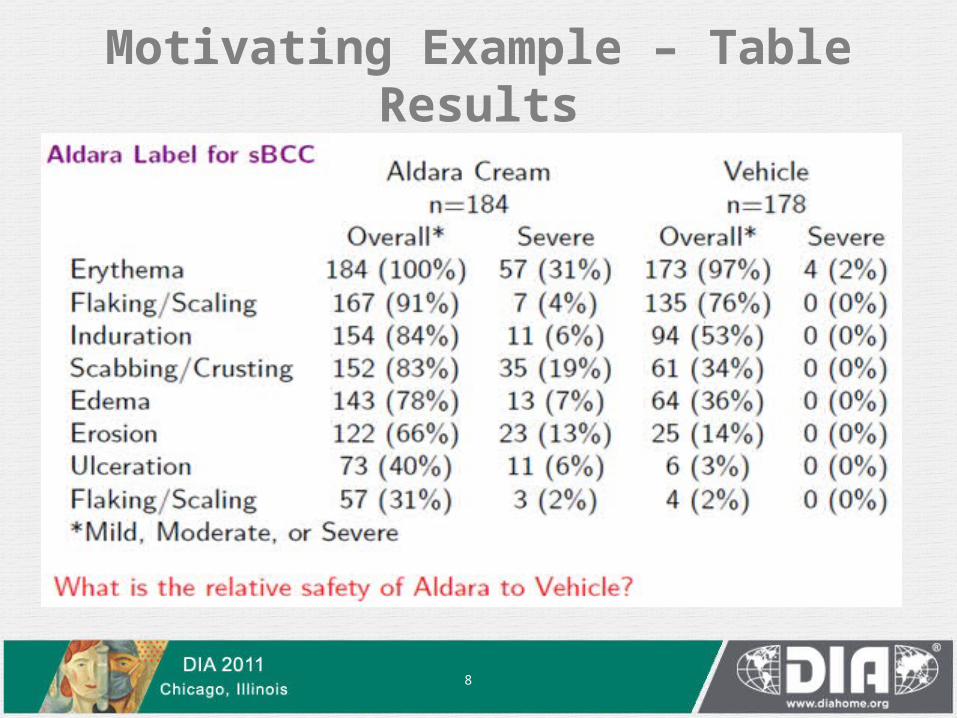
Motivating Example – Table Results
8

Motivating Example – Results Graph
9
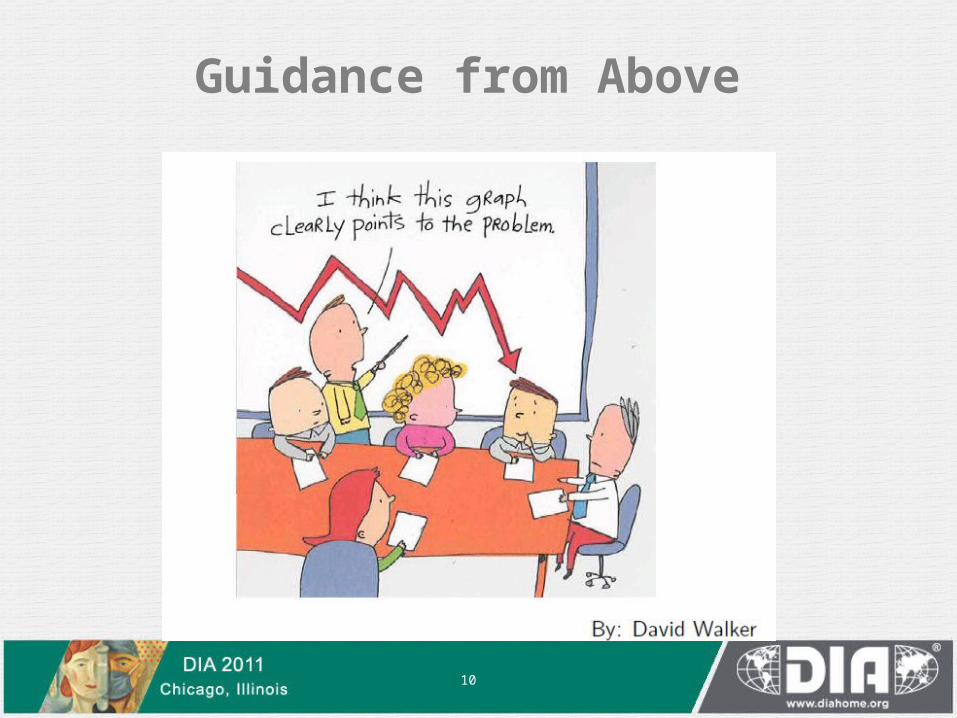
Guidance from Above
10
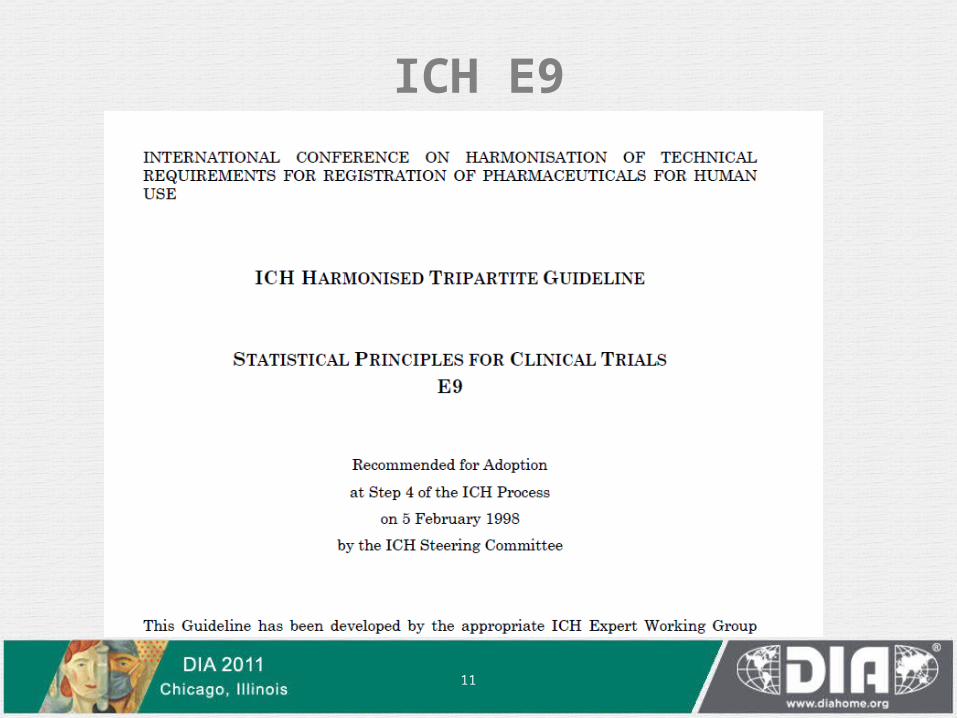
ICH E9
11
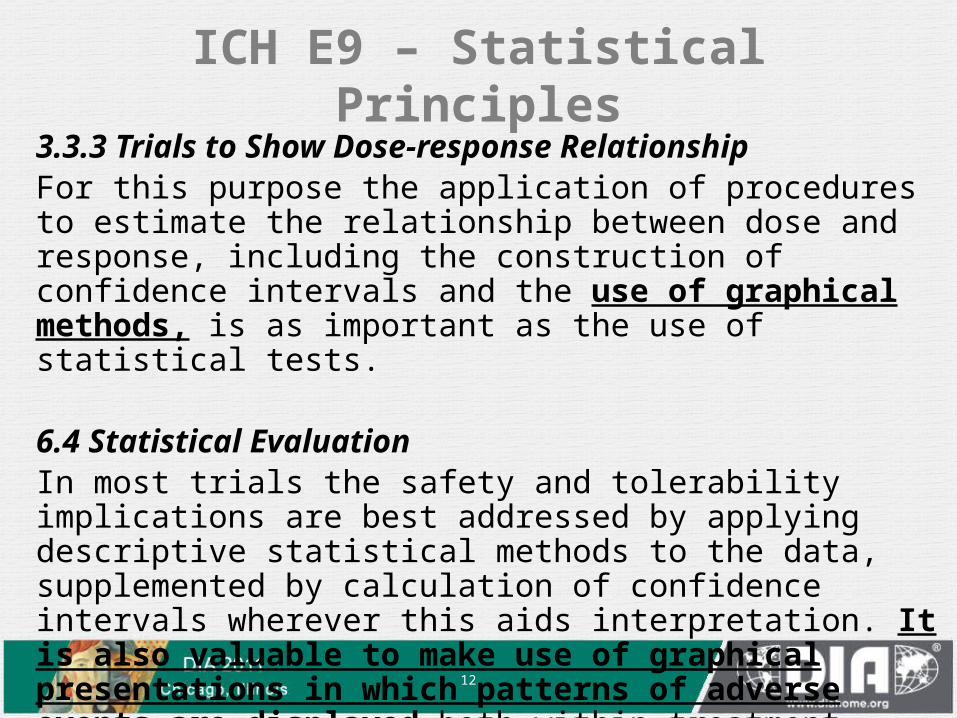
3.3.3 Trials to Show Dose-response RelationshipFor this purpose the application of procedures to estimate the relationship between dose and response, including the construction of confidence intervals and the use of graphical methods, is as important as the use of statistical tests.
6.4 Statistical EvaluationIn most trials the safety and tolerability implications are best addressed by applying descriptive statistical methods to the data, supplemented by calculation of confidence intervals wherever this aids interpretation. It is also valuable to make use of graphical presentations in which patterns of adverse events are displayed both within treatment groups and within subjects.
ICH E9 – Statistical Principles
12

CIOMS VI
13

From the perspective of illustrating the course of an adverse event, it is very much preferred to present the cumulative hazard.
CIOMS VI – Management of Safety Information from Clinical Trials
14

FDA Reviewer Guidance
15

7.4.2.2 Explorations of Time-Dependency for Adverse Findings The reviewer should explore time dependency of adverse reactions:
For important adverse reactions that occur later in treatment, there should be explorations of the time dependency of the reaction. Possible methods include:
• A life table (Kaplan-Meier graph) describing risk as a function of duration of exposure (i.e., cumulative incidence)
• Plotting risk for discrete time intervals over the observationperiod (i.e., a hazard rate curve) reveals how risk changes over time.
FDA Reviewer Guidance – Adverse Findings
16

FDA Labeling Guidance
17

FDA Labeling Guidance
18

FDA Labeling Guidance - Effectiveness Graphs
19

FDA Labeling Guidance - Graphical Principles
20

• Motivation• Guidance from Above• Developing Standard Views of Safety Data• Concluding Remarks• References
21

FDA/Industry/Academia Working Group
22

(a) Identify areas particularly applicable or useful to regulatory review in which graphics can enhance understanding of safety information.– List major safety questions. – What is the critical information needed to answer these
questions? (b) Develop a palette of statistical graphics for specialized
reporting of clinical trials data. – Develop an inventory– Recommend graphics for clinical data based on good
graphical principles Draw up what would be effective to address (a).
(c) Create a publicly-available repository of sample graphics including data sets and sample code.
Project Objectives
23

Clinical Questions
24

CTSPEDIA - Clinical Questions
25
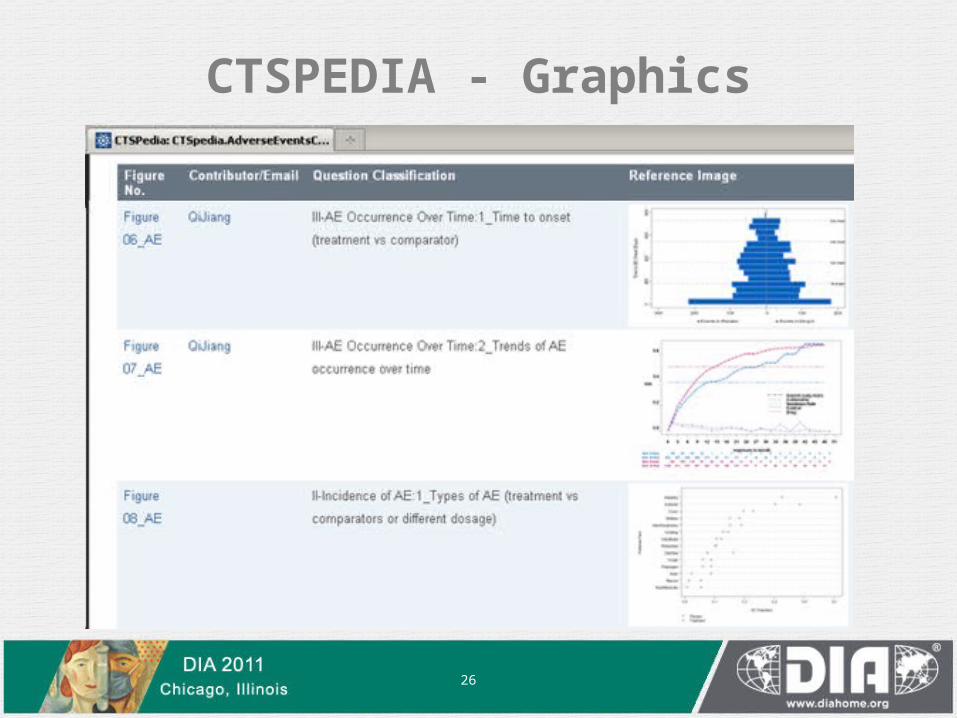
CTSPEDIA - Graphics
26

Example 1 - Incidence of AEWhich AEs1 are elevated in treatment vs. control?

Example 2 - Incidence of AEWhich AEs1 are elevated in treatment vs. control?

Example 3 – What is the safety profile of the drug?Which AEs1 are elevated in treatment vs. control?
*It shows the relative risk or ratio of the adverse event rates on the x-axis and the p-value comparing treatment and control on the y-axis. The additional information on the p-value of the treatment effect is important since it incorporates the number of observed events and confidence in the treatment effect.

Source: Xia A, 2011
Example 4 - AE Occurrence over time Is there a difference in the time to event?
30

Example 6 - AE Occurrence over time Event History Plot

Source: Qi Jiang, Amgen
Example 5 - AE Occurrence over time Incidence Prevalence Plot

• Motivation• Guidance from Above• Developing Standard Views of Safety Data• Concluding Remarks• References
33

• Complex statistical concepts and data structures can be conveyed at a level which is within reach to those with little statistical training.
• Ability to highlight key safety signals and describe efficacy characteristics from large databases.
• Paradigm is to actively assess the data in a manner that is visual, intuitive, and geometric.
Reasons to Include Graphic Summaries
34

• Clinical trial results are more transparent (hard to hide the data if it is all shown).
• Increases the likelihood of detecting safety signals and understanding patients characteristics.
• Improves the ability to make clinical decisions• Improves communication to the public.
Potential Results Using Effective Graphics
35

Special thanks to the Members of the FDA/Industry/Academia Safety Graphics
Working Group• Regulatory: Mat Soukup, George Rochester, Antonio Paredes,
Chuck Cooper, Eric Frimpong, Hao Zhu, Janelle Charles, Jeff Summers, Joyce Korvick, Leslie Kenna, Mark Walderhaug, Pravin Jadjav, Richard Forshee, Robert Fiorentino, Suzanne Demko, Ted Guo, Yaning Wang,
• Industry: Ken Koury, Brenda Crowe, Andreas Brueckner, Stephine Keeton, Andreas Krause, Fabrice Bancken, Larry Gould, Liping Huang, Mac Gordon, Matthew Gribbin, Navdeep Boparai, Qi Jiang, Rich Anziano, Susan Duke, Sylvia Engelen,
• Academia: Frank Harrell, Mary Banach
36

http://thisisindexed.com/
Thank You for Your Attention
37

References and Useful LinksAmit O, Heiberger R and Lane P (2007). Graphical approaches to the analysis of safety data in clinical
trials. Pharmaceut. Stat. 7(1):20-35. Cooper AJP, Lettis S, Chapman CL, Evans SJW, Waller PC, Shakir S, Payvandi N and Murray AB
(2008), Developing tools for the safety specification in risk management plans: lessons learned from a pilot project. Pharmacoepidemiology and Drug Safety, 17: 445–454.
Lewis S, Clarke M (2001): Forest plots: trying to see the wood and the trees. BMJ, 322, 1479-1480. Dubin JA, Mueller HG and Wang JL (2001), Event history graphs for censored survival data. Statistics
in Medicine, 20: 2951–2964. Xia HA, Crowe BJ, Schriver RC, Oster M, Hall DB. Planning and core analyses for periodic aggregate
safety data reviews. Clin Trials April 2011 vol. 8 no. 2 175-182.Heiberger R and Holland B, Statistical Analysis and Data Display. Springer, New York, NY, 2004.Cleveland WS. Visualizing Data. Hobart Press, Summit, NJ, 1993.Cleveland WS. Elements of Graphing Data. Hobart Press, Summit, NJ, 1993.Robbins NB, Creating More Effective Graphs. Wiley-Interscience, 2004.Tufte ER, The Visual Display of Qualitative Information. Graphics Press, Chesire, CT, 1983.Tufte EB, Envisioning Information. Graphics Press, Chesire, CT, 1990.Tufte ER, Visual Explanations. Graphics Press, Chesire, CT, 1997.Michael Friendly's Gallery of Data Visualization - The Best and Worst of Statistical Graphics
http://www.math.yorku.ca/SCS/Gallery/Robert Allison's SAS/Graph Examples - http://robslink.com/SAS/Home.htmFrank Harell's Tutorial: Statistical Presentation Graphicshttp://biostat.mc.vanderbilt.edu/twiki/pub/Main/StatGraphCourse/graphscourse.pdfJSM 2010 Session, "Use of Graphics in Clinical Trials“ http://stat-computing.org/events/2010-jsm/
38