the form and taper of forest-tree stems - bodleian · pdf filethe form and taper of...
TRANSCRIPT

INS"TITUTE PAPER No. 32
THE FORM AND TAPER� OF FOREST-TREE�
STEMS� BY
H. R. GRAY M.A., DIP. FOR. (OXON.). M.SC. (MELBOURNE)
IMPERIAL FORESTRY INSTITUTE�
UNIVERSITY OF OXFORD�
195 6�
Price I2S. 6d.

INSTITUTE PAPER No. 32
THE FORM AND TAPER OF
FOREST-TREE STEMS
BY
H. R. GRAY M.A., DIP.FOR. (OXON.), M.SC. (MELBOURNE)
OXFORD U IVE lTV LIBRARY SERVICES
IMPERIAL FORESTRY INSTITUTE
UNIVERSITY OF OXFORD
195 6

PRINTE9 I:"or GREAT BRITAIN

PREFACE
THE background experience behind this thesis was acquired while the writer was, for a lengthy period, lecturer in Forest Management and allied subjects at the Australian Forestry School, Canberra.
For the relatively simple measurement requirements of indigenous forest management, conventional procedures aiming at giving approximate estimates were generally all that could be usefully applied, and 'stem form' received little attention.
Later, the maturing of fast-growing exotic coniferous plantations gave rise to more detailed procedures, and in connexion with the preparation of yield tables some fifteen years ago, the writer introduced to Australian practice the old established 'Volume Line' method of measuring the volume of forest crops. Considerable controversy arose as to the theoretical soundness or otherwise of the volume line, and in the course of intensive study on the question the writer became convinced that the solution of this and other mensuration problems lay in the study of 'stem form'.
Owing to a change of duties, there was no possibility of following up two preliminary papers until 1954 when a long service visit to the United Kingdom provided the opportunity. The writer's indebtedness to the School of Forestry, Oxford, where under Schlich and Troup he received his undergraduate forestry training, has been, near the end of his career, greatly added to by the help and encouragement of Professor H. G. Champion, in the presentation of this contribution to Forestry knowledge, which is believed to offer a more scientific approach to measurement problems.
At various times, over many years, the writer has been indebted for advice on mathematical problems connected with the subject of this and earlier papers, to Professor V. A. Bailey of Sydney University; the late Mrs. P. Calvert, formerly Biometrician of the C.S.I.R.O., Canberra; G. McIntyre, Biometrician of the C.S.I.R.O., Canberra; and G. Odgers while on the staff of the Commonwealth Solar Observatory, Stromlo, A.C.T. The very considerable assistance given by the last two calls for special mention. Over a considerable period the critical faculty and literary acumen of F. N. Ratcliffe, Biologist of the C.S.I.R.O., Canberra, was very helpful.
Data have been generally provided by many, especially by G. J. Rodger, Director-General of the Forestry and Timber Bureau, while he held the position of Conservator of Forests, South Australia; V. Grenning, Director of Forests, Queensland; C. R. Cole, while Forester of the Australian Capital Territory; and B. U. Byles, of the New South Wales Forestry Commission. Students of the Australian Forestry have from time to time given enthusiastic help in obtaining and working up data. Especial acknowledgement is due to the British Forestry Commission for making available comprehensive sample tree data from their records.

4 PREFACE
Salutory but helpful criticism to a preliminary draft of this paper was offered by Dr. D. J. Finney of the Department of Design and Analysis of Scientific Experiment, Oxford University, and Dr. Mark Anderson, now Professor of the Edinburgh School of Forestry, as a result of which a more convincing presentation has, it is believed, been made.
H. R. GRAY

CONTENTS PREFACE 3 LIST OF FIGURES 7
PART I. BACKGROUND I. GENERAL 9 2. CLARIFICATION OF THE SUBJECT OF DISCUSSION 10
(a) Generalized use of the term 'form' 10
(b) 'Form' and 'Taper' defined I I
(c) 'Conical' and 'Cylindrical' stems 12
(i) Visual impressions 12
(ii) Inferences from measurements 13
3. INVALIDITY OF TOR JONSON'S TEST OF STEM FORM IS
4. SYSTEMATIC DEVIATIONS OF OBSERVED VAL UES FROM
FORM CLASS CURVES 18
(a) General 18 (b) High form quotients 21
(c) Low form quotients 23 (d) Form quotients affected by 'subnormal' diameters 23
5. ALTERNATIVE THEORIES OF STEM FORM 26
(a) M echam'cal theories 26
(i) Metzger's girder theory 26
(ii) Tor Jonson's theory of the relation to wind forces 27
(b) A physiological theory 28 Jaccard's conduction theory 28
(c) Summary 29
6. THE CROWN OR 'TOP' REGION OF THE CENTRAL STEM 29
7. THE 'BUTT' REGION OF THE STEM 30
8. LINEAR RELATIONSHIP BETWEEN SECTIONAL AREA AND
HEIGHT FOR THE 'MAIN STEM' OF FOREST-GROWN TREES 30
(a) Range of the data investigated. 30
(b) Comparison of the fit of observed values to graphs of d2/h and d3/h 38
PART II. NEW THEORY 9. INTRODUCTION 43
10. GENERAL THEORY 43 II. RELATION OF HORIZONTAL WIND-PRESSURES ON THE
C ROW N TO ST E M TAP E R 44 (a) General deduction 44

6 CONTENTS
(b) Variation of taper as between different trees at a given time 46
(c) Variation with time of the taper of a given tree 47
12. WEIGHT AND DOWNWARD THRUST OF CROWN IN RELA
TION TO TAPER 50 (a) Effect on butt swell and taper of the stem 50 (b) Effect on relation of parabolic height to total height 5I
13. RELATION OF PRESSURES ON THE CROWN TO SHAPE OF
SECTION 52 (a) Preferential pressures and eccentric sections 52 (b) Eccentricity of section and 'subnormal' dimensions 52 (c) Examples 52
14- THE CROWN OR 'TOP' REGION OF THE CENTRAL STEM 57
IS. THE BUTT REGION OF THE STEM 58
SUMMARY OF PARTS I AND II 59
PART III. APPLICATIONS OF THEORY
1. INTRODUCTION 62
2. ADVANTAGES OF THE TAPER-LINE METHOD FOR ACCURATE
RECORDING OF STEM DIMENSIONS 63
3. DETECTION OF FAULTY DIMENSIONS RECORDED BY OTHER
METHODS 64
4. A QUICK AND RELIABLE METHOD OF VOLUME COMPUTA
TION 65 (a) Parabolic volume 65
(b) Total stem volume 65
(c) Merchantable volume 66
(d) Estimation of volume by 'assortments' 67
(e) Estimate of the value of the stem 68
5. MEASUREMENT OF STANDING TREES 69 (a) The problem 69
(b) The taper-line method 70
6. SYNTHESIS OF STEM DEVELOPMENT 73
7. ANALYSIS OF STEM DEVELOPMENT 73
APPENDIX 75
BIBLIOGRAPHY 79

LIST OF FIGURES
1. Sectional area/height curve illustrating the elements of parabolic volume 10
2. (a) Basic geometrical forms showing diameter/height relationships 12
(b) Stem form diagram showing sectional area/height relationships 13
3. Effect on form factor of inclusion of bark 14
4. Form data of a typical Pinus radiata D. Don. tree: 17
(a) Diameter/height relationship; (b) Sectional area/height relationship
5. Sectional area/height diagrams: 19
(a) Showing that when d; and Dn fall on the main stem curve, the
value of d5 increases with the ratio between parabolic height (hp)Dn
and total height (h); (b) Typical case of low form quotient 0'50;
(c) Typical case of medium form quotient 0'707; (d) Typical case of high form quotient 0·80
6. Sectional area/height diagrams showing that when d; falls on the crown stem curve, the general relation shown in Fig. 5 does not hold 20
7. Showing deviation of high form-quotient curve from observed values along the main stem 22
8. Showing deviation of high form-quotient curve from observed values along the main stem 22
9. Showing deviation of low form-quotient curve from observed values along the main stem 22
10. (a) Height curves for Eucalyptus grandis Hill showing that subnormal diameters which are not evident on a diameter/height curve (a) are manifest on a sectional area/height curve 24
(b) and that the curve appropriate to form quotient 0'75 derived from (a) deviates from observed values along the whole length of the stem 25
11. Sectional area/height curves from successive measurements of the same trees revealing abnormality of certain of the recorded values 36
12. (a) Relation between height and the square or cube of the diameter 39
(b) Comparison of fit of observations to graphs of d2/h and d3/h: Alpine Ash (Eucalyptus gigantea Hook f.) 41
(c) Comparison of fit of observations to graphs of d 2/h and d3/h: Flooded Gum (Eucalyptus grandis Hill) 41
13. Diagram illustrating the effect on taper of lateral pressures on the crown when these are dominant 45
14. Variation of taper with crown class. (Trees from unthinned 19 year old stand of Pinus radiata.) 46
15. Sectional area/height curves showing variation with time of the taper of individual trees:
(a) Taper-line slope becoming more gentle with increasing age 47 (b) Taper-line slope remaining substantially constant with age 48 (c) Taper-line slope becoming steeper with increasing age 49
8 LIST OF FIGURES
16. Diagram illustrating the effect on taper of pressures in addition to lateral ones SO
17. Sectional area/height curves illustrating the appearance and extension of a concavity at the lower end of the stem and its disappearance through the development of butt swell 54
18. Taper curves showing an increase of eccentricity and subnormality of stem sections. Dominant specimen of Eucalyptus gigantea in a dense stand on a sheltered valley slope 55
19. Taper curves showing the absence of eccentricity and subnormality of stem sections. Symmetrically crowned specimen of EucalYPtlis gigantea open grown from youth on a relatively exposed site near the top of the s~pe 56
20. Taper curves showing the absence of subnormal stem sections. Symmetrically crowned specimen of Eucalyptus grandis open grown on a relatively exposed site near the top of a ridge 57
21. Sectional area/height curves for calculation of merchantable volume 67
22. Sectional area/height diagram illustrating the basis of calculation ofvolume by assortments and value 68
23. Sectional area/height curve showing successive standing-tree measurements of Pinus radiata D. Don. 72
PART 1. BACKGROUND
1. GENERAL
I N an earlier paper [I] extensive literature dealing with the form of foresttree stems was reviewed, the writer's own investigations were described and a hypothesis was advanced that for the 'main stem't the observed diameters agreed as well if not better with a straight-line relationship between the square of the diameter and the height above ground of the point of measurement, than with the best fitting form-quotient curve, even though variation of form quotient is considerable.
This hypothesis received statistical support from G. A. McIntyre. For the material tested, the 'main stem' was arbitrarily taken as 10 to 70 per cent. of the length above ground. Actually the linear relation does not hold in all cases for such a long percentage length, but on the other hand it often does so for greater lengths.
Since sectional area is TTd 2/4, the linear relation described holds equally between sectional area and height above ground at which observations are made. The sectional area/height curve for the main stem can be projected to intercept the vertical axis at 'parabolic height', symbolized hp and the horizontal axis at 'parabolic base', symbolized sp- This linear curve has been termed the 'taper line'.
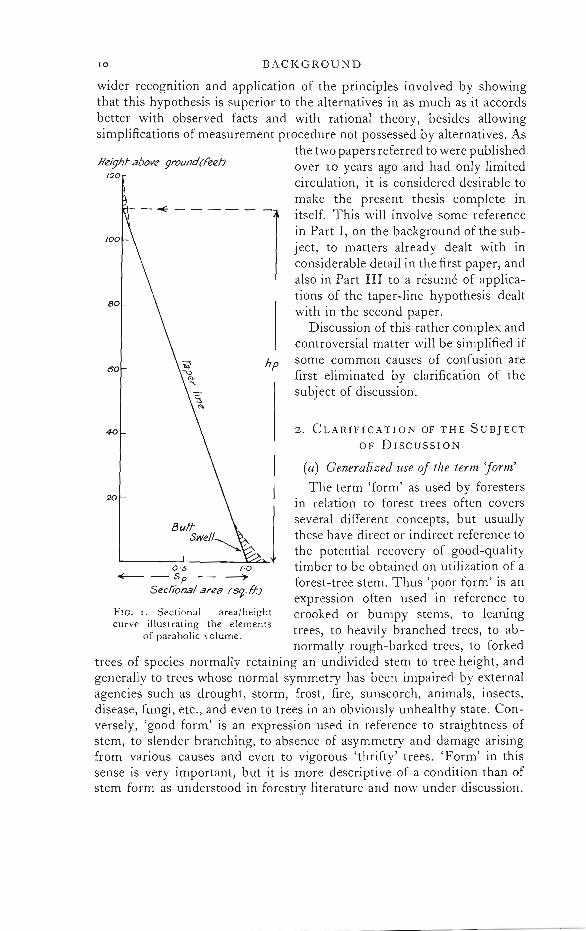
In order that the practical significance of the hypothesis can be readily envisaged a sectional area/height curve is shovVl1 in Fig. 1. As will be shown later, the case is not always as simple as indicated in Fig. I, which, however, illustrates the commonly occurring one for species which maintain an undivided central stem to tree height, i.e. many coniferous species as well as pole crops in general. Now, in the triangular figure defined by the taper line, parabolic height, and parabolic base, the last two elements are direct functions of volume (in this paper units are given in feet and square feet respectively), so that 'parabolic volume', symbolized v"' is readily obtained by reading values at the intercepts and applying the formula:
~')) = ~hjJsJ" In Fig. I the value is:
vp = 110- X 2
1'0 = b' f55 cu IC eet.
Some of the practical applications of the 'taper line' hypothesis were given in a second paper [2] and within a limited sphere they have been used with advantage and satisfaction. The purpose of the present paper is to obtain
t By 'main stem' is meant the middle length of a tree stem which can be described by a single simple curve, that is the length between 'butt swell' at the lower end of the stem, and a variable length, herein temled the 'top', within the crown. The diameter/height curves of the 'top' and of the 'burr' are very variable and differ from that of the main stem.
10 BACKGROUND
wider recognition and application of the principles involved by showing that this hypothesis is superior to the alternatives in as much as it accords better with observed facts and with rational theory, besides allowing simplifications of measurement procedure not possessed by alternatives. As
the two papers referred to were published /leight above ground(teef.J over 10 years ago and had only limited
120 circulation, it is considered desirable to make the present thesis complete in itself. This will involve some reference in Part I, on the background of the subject, to matters already dealt with in considerable detail in the first paper, and also in Part III to a resume of applications of the taper-line hypothesis dealt
80 with in the second paper.
Discussion of this rather complex and controversial matter will be simplified if
hp some common causes of confusion are (50
first eliminated by clarification of the subject of discussion.
2. CLARIFICATION OF THE SUBJECT
OF DISCUSSION
(a) Generalized use of the term 'form'
The term 'form' as used by foresters
~l20 in relation to forest trees often covers
several different concepts, but usually these have direct or indirect reference to the potential recovery of good-quality
o·s 1·0 timber to be obtained on utilization of a ~ - Sp - ---'» forest-tree stem. Thus 'poor form' is an
Sectional area (StJ-.ff.J expression often used in reference to
FlC. 1. Sectional area/height crooked or bumpy stems, to leaningCurve illustrating the elements trees, to heavily branched trees, to abof parabolic volume.
normally rough-barked trees, to forked trees of species normally retaining an undivided stem to tree height, and generally to trees whose normal symmetry has been impaired by external agencies such as drought, storm, frost, fire, sunscorch, animals, insects, disease, fungi, etc., and even to trees in an obviously unhealthy state. Conversely, 'good form' is an expression used in reference to straightness of stem, to slender branching, to absence of asymmetry and damage arising from various causes and even to vigorous 'thrifty' trees. 'Form' in this sense is very important, but it is more descriptive of a condition than of stem form as understood in forestry literature and now under discussion.

BACKGROUND I I
This study does not pretend to cover the case of trees which, owing to old age, decay, or unrestricted branch development, are quite irregular in shape, but deals with forest-grown specimens, the stems of which are normally branchless for an appreciable proportion of their total length or at least are reasonably symmetrical.
(b) 'Form' and 'Taper' defined
Within this narrower field of discussion, the terms 'form' and 'taper' are frequently used indiscriminately to express the same idea. This has been a major cause of confusion, and for the purposes of this paper these two terms will be separately defined with reference to three of the geometrical solids which narrow in diameter from the base upwards in a regular fashion, to which it has become customary to compare the main stem of a tree.
(i) 'Form'
The particular fashion in which such a solid narrows in diameter so as to produce a characteristic shape depends on the power index of d in the formulae for the various curves defining the diameter/height profile of such solids, thus:
for a cone h = hi d for a (quadratic) paraboloidt h = h2 d2
for a cubic paraboloid h = k3 d3
where d is diameter at distance h from the vertex of the curve, and h represents a value which can vary from case to case.
By 'form' in this paper is meant the shape of a solid, the diameter/height curve of which is determined by the power index of d.
(ii) 'Taper'
Depending on whether the rate of narrowing in diameter with respect to increase in height is slow or rapid, any solid of the above types is relatively tall and slender or short and stout. A high value indicates a slow rate of narrowing and a low value indicates a rapid rate of narrowing in all cases. By 'taper' in this paper is meant the rate of narrowing in diameter in relation to increase in height of a given 'shape' or 'form'.
(iii) Diagrammatic distinction between 'form' and 'taper'
Full appreciation of this distinction is so important to a proper understanding of the subject of stem form that the text above is amplified by simple diagrams. Fig. 2 (a) portrays conical, paraboloid, and cubical paraboloid forms. Each of these bodies is shown with slow, intermediate, and rapid taper.
t Unless qualified by a prefix, e.g. 'cubic', the term paraboloid in this paper has the usual mathematical meaning, that is a paraboloid of revolution generated by a parabola and often referred to as a quadratic paraboloid.

12 BACKGROUND
Subsequent stem-form cliagrams in this paper will generally be in terms of sectional area (corresponding to observed diameters), and height. Diagrams in these terms, appropriate to the solids in Fig. 2 (a), are shown in Fig. 2 (b).
Cone ParaboloId Cubic ParaboloId
----d----'"
FIG. 2 (a). Basic geometrical forms showing diHmeter/height relationships.
(c) 'Conical' and 'cylindTical' stems
In practice, the shape of forest-tree stems is often referred to as varying from a conical to a cylindrical shape. This may be attributed to visual impressions or to inferences from measurement data.
(i) Visual impressions
The length of a forest-tree stem is generally so great compared with its diameter that, to the eye, curvature of the main stem is imperceptible, and its sides appear to be straight. If the stem narrows comparatively rapidly and uniformly to the tip, it appears to be approximately conical. On the other hand, if the stem is long and slender there is a visual impression of more or less parallel sides, at least for a considerable proportion of the bole

13 BACKGROUND
and such a stem is commonly called cylindrical. This visual impression is not, however, confined to long and slender stems and perhaps a more common case of seemingly parallel-sided stems occurs \vith many big tree specimens having large spreading crowns. Classical examples of so-called cylindrical boles may be found among the very large New Zealand kauri
Colle
FIG. 2 (b). Stem form diagram showing sectional area/height relationships.
(Agathis australis saliab) trees, \vhich Hutchins [3] called 'taperless stems'. As the central stem within the crown of such trees tapers very rapidly this latter visual impression of parallel sides obviously can be only in respect of the bole below the crown.
(ii) Inferences from measurements
Form factors. The numerical values of so-called form factors can vary widely according to definition. The most commonly used 'artificial' form factor is given by the formulaf = vjsh wheref = form factor, v = underbark volume of stem, s = sectional area (overbark) of the stem at 4i ft. above ground, and h = height of stem. Now such a form factor can be as low as (and, indeed, lower than) 0"3, when the volume of the stem is given by

14 BACKGROUND
v = shJ3 which is the formula for the volume of a solid cone, and this has been held to support the idea that some tree stems may be conical in shape. The following quotation from a standard textbook on forest mensuration [4] exemplifies a view which is commonly heard, read, or implied.
'As one would expect from a dominant tree with a persisting rapid height growth, it has a very conical form, as evidenced by the form factor.' (The form factor of the specimen cited was 0'36.)
h'efght (feet)
Hoop Pine. 50 Gnu! /"",ab.,,-/< Ar.lwcJI'I.9 cunnm9h/lmli Aft Eucalyptus pBnI~vl.!l18 Sm.
.. - -~ - M.rcIlsnl.able he'gh' ~ .af.3-diom. ,
20 20
~~" 0·/ 0·2 0..5
Sec/,ons/ a,-eo (5<;.1;)
FIG. 3. Effect on form factor of inclusion of bark.
It is extraordinary that such loose expressions and inferences continue to be used with reference to an underbark volume measurement related to a cylinder derived from total height and sectional area corresponding to an overbark measurement at 4l ft. from the ground, especially as, owing to butt swell, the stem at this point of measurement is usually larger than would be expected from a continuation downwards of the main stem curve. To illustrate the variability of form factors of tr,ees of practically identical size, but of different bark thickness, and also the variability according to definition, sectional area/height curves of a specimen of hoop pine (Araucaria Cunninghamii Ait) and of ironbark (Eucalyptus paniculata Sm.) are shown in Fig. 3. The d.b.h. overbark dimension (measured with a diameter tape) of each was 7'98 in. and the height of the hoop pine 57 ft. and the ironbark 56 ft. The great difference in bark thickness will be noted so that, while the cylinder based on total height X sectional area corresponding to d.b.h. overbark was approximately the same in both cases, the underbark volume of the hoop pine was 7'92 cub. ft. while that of the ironbark was

BACKGROUND IS
only 4'78 cub. ft. Hence the artificial form factors were very different: hopa pine being 0'403, ironbark 0'247. If the difference in bark thickness is discounted by calculating the cylinder on underbark measurements, the form factors are more similar, viz. hoop pine 0'459, iron bark 0'449.
If the form factor is based on merchantable volume (e.g. to 3 in. small-end diameter), related to an underbark cylinder of merchantable height, it has of course a higher value in each case, viz. hoop pine 0'615, ironbark 0·688.
Form quotients. The development of the form-quotient concept was dealt with in detail in an earlier paper [1J. The point to be emphasized here is that fq = d5/D lI , where d5 is underbarh diameter, half-way between 4± ft. and total height and D is a derived underbarh diameter, excluding buttn
swell, at 41 ft. from the ground. Because it is free from many of the causes of anomaly to which the form factor is subject, the form-quotient ratio is undoubtedly superior. When therefore form-quotient ratios were found to range from o'50 to 0,85, that is from the ratio of a cone to that of a solid more than half-way between a cone and a cylinder, it was supposed (erroneously as will be shown), that there was a considerable variation in stem form, even when bark and butt swell were excluded.
3. INVALIDITY OF TOR JONSON'S TEST OF STEM FORM
Some fifty years ago, Tor Jonson [5J dismissed the possibility that the main stem of a forest tree conformed to the dimensions of a truncated paraboloid by what he apparently considered a convincing mathematical test. So far as the writer is aware, this so-called test, often quoted, has not been challenged.
The method followed in this test is to compare calculated data of relative diameters, based on observed values, with calculated values which a tree stem should have if it were a paraboloid to tree height, i.e. if the height/diameter curve ,vere a parabola, the vertex of which corresponded to tree height. In the latter case, diameters should be proportional to the square root of the distance from tree height, viz. d = --./h, where d = diameter at distance h from tree height. Relative values according to this assumption are shown in Table 1. For comparison, relative values of Dn , t based on observed values of a Pinus radiata D. Don. tree, a typical plantation specimen, actually used in such a 'test', are also given in this table, together with the differences and percentage differences between calculated and observed values.
Table 2 gives actual diameters at actual heights along the stem of the same tree. The tree was 104 ft. high and its d.b.h. underbark was 11'2 in. Underbark diameter at 2 ft. 1} in. above ground was 12'0 in. and D n , extrapolated from the curve based on observed values along the main stem, was 10' 57 in. The Table includes calculated values, assuming that the stem curve is a
t D lI = 'normal' diameter at breast height. It is a derived diameter, underbark and excluding butt swell, corresponding to the lowest point of a fonn class curve.

16 BACKGROUND
parabola to tree height, but not the percentage differences between observed and calculated diameters as, aJlowing for approximations in rounding off figures, these should of course be similar to those in Table I.
Sectional areas corresponding to observed diameters are also given in this Table.
TABLE I. Relati've Dimensions
Relative distance from tree height to On 100 90 80 70 60 so 40 JO 20 10
Square Root of relative distance from tree height = relative value of D" ('Yo) (00 94'9 89'4 83'7 77'S 7°'7 6]'2 54'8 44'7 J I '6
Observed relative diameters 94'6 88,8 82'J 74'7 66'2 57'7 45'4 32 '2 12'4 Difference 0'3 0,6 1'4 2,8 4'5 5' -=' 9'4 l2'S J9'2
Percentage difference O'J2 1'2 1'7 J'7 6'4 8'7 17'2 28'0 60'7
TABLE 2. Actual Dimensions
Height above I ground i" feet 4'25 I+ 24 J4 44 54 64 74 84 94 (04
Observed diameters in inches r I '2 10'0 9'4 8'7 7'9 7'0 1 6'1 4'8 J'4 ('J 0
Sectional areas i71 square feet, 0,68 0'55 0'48 0'4l o'J4 0'27 0'20 O'IJ 0'06 0'01 0
Calculated diameters assuming stem cun"e is a parabola to tree height, 10,6 ro'O 9'5 8,8 8'2 7'5 6'7 5,8 4'7 J'3
Difference inches
III
-0,6 0 +0'( I 0'1 o'J 0'5 0,6 1'0 I I 'J 2'0
The observed and calculated values clearly disagree, the percentage difference being large (60'7) at IO per cent. distance from tree height and quite considerable, (6'4) half-way between tree height and 41· ft. above ground. The weakness of this comparison, however, is the assumption, against all experience, that the stem from tree height dowmvards can be accurately described by a single simple curve,
Knowing that this is not the case, a more appropriate test is to calculate a parabola from values along the main stem. The results are shown in Fig. 4 (a). Observed-values curve 'a' conform, for all practical purposes, with the calculated parabola, curve 'b', along the main stem but diverge at the top and butt. The vertex of the calculated parabola does not of course coincide with tree height. By contrast, curve 'c' which is a calculated parabola with its vertex at a height corresponding to tree height, diverges from observed values along the whole stem.
Sectional area/height curves, corresponding to the diameter graphs in Fig. 4 (a), are shown in Fig. 4 (b). Here curve 'a' is based on observed values and is coincident along the main stem with the taper line corresponding to curve 'b'-Fig. 4 (a), but diverges at the top and butt. The linear curve 'c' from tree height corresponds to curve 'c' of Fig. 4 (a) and similarly diverges from observed values along the whole stem.

td '" ~ o
Hei
ghl
ha
l
80
70
00
:xl
'0
+
OI"II?(Z/~r'
HtZ
/9/1
! fu
r
(A)
(B)
80
70
60
"
.>0
40
.30
20
/0
<5
,i? f
ilC
hes
/0
/2
o
I I
I ,
,.,
-o
f...$
S~c/
ii:>
n.:l
/
a~a
(S<
jull
re f'~er)
FIG
. 4.
F
orm
dat
a o
f a
typi
cal
Pin
us r
adia
la D
. D
on
. tr
ee
(a)
Dia
met
er/h
eig
ht
rela
tio
nsh
ip;
(b)
Sec
tion
al a
rea/
hei
gh
t re
lati
on
ship
.
I~)e
! ..
. ...
......
.

18 BACKGROUND
This demonstration illustrates the inherent unreliability of using tree height as a term in formulae, such as those of Tor Jonson [5] and Behre [6], to calculate curves purporting to define the stem profile of a tree; it also illustrates that the so-called test is highly misleading and especially that it is not a disproof of the taper-line hypothesis.
Petterson [7] and Petrini [8] have long recognized the difficulty of evolving a stem-curve formula simple enough for practical purposes, to which measured observations from the butt swell region to tree height conform. Petterson suggests a logarithmic curve for the main stem and another logarithmic curve with a different power index to describe the 'top' portion. Petrini also suggests that the curves for the main stem and for the 'top' should be different. According as the shape of the crown is cylindrical, paraboloidal, or conical, he suggests that the curve for the stem in the crown should conform to h = kd 1' 5, h = kdH , and h = kd1·
Q respectively. Irrespective of the shape of the crown, he has suggested that the stem curve for the stem below the centre of gravity of the crown should conform to h = kd:J.
The significance of the suggested combination of curves of Petterson and Petrini is, in the writer's opinion, not the possibility of their Widespread use, for as will be seen from examples in this paper, the stem curve in the crown, particularly of broadleaved species, is often quite irregular, but on the emphasis given to the difference of the stem curve near the top of a tree and that of the main stem, even with species having comparatively simple crown structures.
4. SYSTEMATIC DEVIATIONS OF OBSERVED VALUES FROM FORM
CLASS CURVES
(a) General
To appreciate the demonstrations to follow, the derivation of ds and Dn needs to be understood. A method commonly used was described in an earlier paper [I], but similar and no less subjective results can be obtained more simply by eliminating the troublesome calculations for diameter and height quotients. Observed diameters can be plotted against observed heights, and representative values for do and Dn read from the curve. Since the above paper was published another method aiming at minimizing subjectivity has been proposed [10]. This proposal, in connexion with the measurement of standing trees, is that form quotients should be derived from straight-line anamorphosis, viz. xly = a+b(x), of observed values taken to about half height, according to Behre's stem-curve formula
x y = a+b(x)'
where
y = ~5 , X = percentage distance from tip to 4'25 ft. above ground, and n
a and b are constants varying with the form quotient.

BACKGROUND
Apart from the inherent weakness, already referred to, of using total height in such a stem-curve formula, the proposed method of derivation assumes that the main stem curve is a hyperbola. No theoretical basis for this assumption has been claimed nor does it seem likely that one cculd be sustained on either mechanical or physiological grounds.
--- ,w,llIn Sfem curve _._._._._ Crown Sf= CJJwe ~
I' 1\
\ I \ I \
.! (C)
.( ~.l-) ?l /{ 1.
f \\ \ \",\
hp1 L ~\
o
Dn SecIJona/ area
FIG. S. Sectional area/height diagrams:
(a) showing that when d5 and Dn fall on the main stem curve, the value of d./D" increases with the ratio between parabolic height (hp) and total height (h);
(b) typical case of low form quotient 0'50; (c) typical case of medium form quotient 0'707 ;
(d) typical case of high form quotient 0·80.
Systematic deviations from observed values along the main stem of formclass stem curves are generally not very noticeable, on the scales ordinarily used, in the case of medium form quotients in the range 0'50 to 0·80. Consequently illustrations are given in respect of high and low form quotients, i.e. those towards the upper and lower limits. Because of the sharper definition obtained and for other advantages to be shown later, the graphs are given in terms of sectional area/height rather than diameter/height.
As an introduction to demonstrations based on specific data of typical specimens, simple diagrams are shown in Figs. 5 and 6. Fig. 5 illustrates a

20 BACKGROUND
fact brought forward in an earlier paper [I] for which McIntyre gave a mathematical expression when the sectional area/height relation is linear, that if d5 and D fall on the main stem curve, form quotients are pron gressively smaller in value the lower the parabolic height is in relation to tree height, and conversely. The principle holds even if the sectional areal height relation is not quite linear.
(A) (8)
\ 1\ 1\ 1\ I \
\ I \ I \
I Crown Slrzm
XI curve \, ! \, i "
i '\
\ \d, \0,
..........
Sectional area
FIG. 6. Sectional area/height diagrams showing that when d, falls on the crown stem curve, the general
relation shown in Fig. 5 does not hold.
It is clear from Fig. 5 that the form quotient is low when the vertex of the main stem curve (parabolic height in these diagrams), corresponds to a height considerably lower than tree height, but high when the vertex of the main stem curve is above tree height.
If, however, d5 does not fall on the main stem curve, but on the top curve, the general relation referred to above does not necessarily hold. In this latter case it is possible for a form quotient to be low even when the height of the vertex of the main stem curve is as great as or greater than tree height. Fig. 6 (a) illustrates a comparatively slow-tapering main stem which bifurcates below d5 and Fig. 6 (b) a more usual case, namely that of

21 BACKGROUND
a young widely spaced tree having a rapidly tapering mam stem and a relatively long 'top'. The form quotient in both cases is below the average of the range ox form-quotient values.
In the examples to follow, examples are first considered where the derived D is not affected by the occurrence of 'subnormal' diameters asn
described and defined below under (d) of this section.
(b) High form quotients
These are common whenever there is a sharp diminution of diameter, relative to that of the main stem, of the stem in the crown. This is a feature of trees with large branched crowns and so is usual with large specimens of broadleaved species but less so with conifers, many of which retain an undivided stem to tree height, at least to an advanced age.
Fig. 7 illustrates a typical case. It is based on data of an Alpine Ash (Eucalyptus gigantea Hook L) tree from an indigenous forest of New South Wales. The tree was 115 ft. tall with a large spreading crown starting at about 87 ft. from the ground. The point ds (15'31 in.) was below this height, being at 59'5 ft. and on the main stem curve. D.b.h. underbark was 20·8 in., the derived D n 19' 15 in., and the form quotient therefore 15'31 / 19'15 in. = 0·80 approx. A calculated curvet corresponding to a form quotient of 0·80, in terms of sectional area/height and the observed values (sectional area) are shown for comparison. An appreciable and systematic deviation of the form-quotient curve from observed values along the main stem is quite apparent. By contrast observed values along the main stem show no systematic deviation from linearity, taking main stem as extending from the region of butt swell to the point on the stem where the crown starts. .
A second example, based on data from a Spotted Gum (Eucalyptus maculata Hook) from an indigenous forest of New South Wales, is illustrated in Fig. 8. The tree was III ft. tall with a large heavily branched crown starting at about 70 ft. above ground. Point ds (12 '76 in.), was below this, being at 57'5 ft. above ground, and on the main stem curve. D.b.h. underbark was 16'97 in., the derived D n 15'26 in., and the form quotient therefore 12 '76/ 15'26 in. = 0.836. The calculated curve corresponding to this form quotient is seen to deviate appreciably from observed values all along the main stem. By contrast there is no systematic deviation from linearity of observed values along the main stem, i.e. from the region of butt swell to bole height at about 70 ft. from the ground.
It will be noted in both cases that the derived parabolic height is much greater than the total height. A physical explanation for this is given later under Section 12(6).
Hundreds of similar examples have been observed.
t In this and the following calculations Behre's form class values have been used. Very similar results are given by Jonson's form-class values.

Hei
ghl
(lee
';!
14
0
Alp
ine
Ash
1
20
E
uca
lyp
tvs
glqa
nte.
o f/
ooi;r
'" \'x
10
0
0, , ," "
.' o x
,f
Ba
se o
f C
row
n'-
, " "
X
so
'0
'0, \ ·'0
'. 6
0"
~
\ °, \40
1 '0
\
\. o \ 2
0
;""0 "'
J·O
2
·0
Sec
f'o
na
l a
rea
(S
9-,
t)
FIG
. 7.
S
ho
win
g d
evia
tion
of
high
fo
rm-q
uo
tien
t cu
rve
from
obs
erve
d va
lues
alo
ng t
he m
ain
stem
.
fklg
ht (
feef)
12
0
Sp
olt
ed
Gvm
E
t/C!J
lypt
t/s
ma
ct/
tela
Hoo
A\
" 1
00
\ , '
\ "
\<
''0
, \.
\\
80
'\
"\
" "'
\y--
-Ba
se o
f C
row
n
........ _
\
60
40
20
!kit
sw
ell
1·0
'·
0
Sec/
'iona
l B
rrw
(sC
;.fr
)
FIG
. 8.
S
ho
win
g d
evia
tion
o
f hi
gh
fon
n·
qu
oti
ent
curv
e fr
om o
bser
ved
valu
es a
long
th
e m
ain
stem
.
Het
gh! (
fee!
) so
'N
este
r'''
Yel
low
Pin
e P
,nvs
pon
dero
s.<
DO
t/!!1
"
4<
) '\ \,
\,., \
30
·~
x
_ -d
s
\;;,
20
"
'0,,;,, ''
0, "
10
·...
..0, ',.
/-0
2
·0
S~/iOnBI
are
<?
(StJ
.ff)
FIG
. 9.
S
ho
win
g d
evia
tion
of
low
fo
rm-q
uo
tien
t cu
rve
from
ob
serv
ed v
alue
s al
ong
the
mai
n s
tem
.

23 BACKGROUND
(c) Low form quotients
For this range, the example used will be the more usual case referred to above in Para. 4 (a) and illustrated diagrammatically in Fig. 6 (b). Fig. 9 is based on data from an open-grown specimen of Western Yellow Pine (Pinus ponderosa Doug!.), an exotic grown in the Australian Capital Territory. The tree was 50'5 ft. tall and d.b.h. underbark was r9'2 in. Point ds (9.08 in.) at 27'4 ft. above ground, was read from the conical crown stem curve and derived Dn was r8'r6 in., giving a form quotient of 0'50. The calculated curve for this form quotient is seen to diverge from observed values in an opposite direction to that shown for high form-quotient curves. Here again there is no systematic deviation from linearity of observations along the main stem. In this instance, the main stem is relatively short because of the proportionately long crown and butt.
(d) Form quotients affected by 'subnormal' diameters
Owing to the usual occurrence of butt swell, diameters at 4l' ft. above ground should be, and generally are, larger (except perhaps in the case of very small trees), than 'would be indicated by a prolongation of the main stem curve. Under conditions to be described, however, diameters at such a height are not larger and frequently are appreciably smaller. Diameters which, taking account of butt swell, are smaller than might normally be expected are defined for the purpose of this paper as 'subnormal'. These subnormal dimensions at 4!- ft. above ground modify all other factors which affect the derived values of form quotient.
The probable reason why the local and often pronounced character of such subnormality has not been recognized by other workers is that it is not readily apparent from a free hand diameter/height curve as usually constructed. Actually subnormal dimensions could be recognized from a calculated diameter/height curve, if it were based on observed values along the main stem, but they are more clearly seen from a sectional area/height curve, which has the additional advantage that a 'taper line', based on the sectional area/height linear relation along the main stem, involves no calculations and is quicker to construct. Any criticism on the score of the subjectivity of this approach is considered to be adequately met in later sections of this paper.
When this interesting feature of subnormality was first recognized considerable attention was given to it and closely spaced measurements along the stem region affected were taken to define the character of the deviation from the extrapolation of the main stem curve. It was found that plotted points deviate in'wards from the taper line progressively and then turn and finally fall outside the line. Thus, with respect to the taper line, observed values follow a sharply defined and localized concave curve. If the normal phenomenon of butt svvell is taken into account, the subnormal character

24 BACKGROUND
of observations may be assumed to be maximum at ground level, although it tends to become obscured in this region. The physical significance of 'subnormal' diameters and of butt swell, will be referred to in later sections.
The point to be emphasized here is that when 'sub-normal' diameters
I-ki¢t (feet)
130 C4)
\ Flooded ui/m° '\120 Evcalyptus 91'dndis Hill '\0,
" \ 100 \
o
\o
\
\ o80\
\ o
<50 \
\
"6
\ \o \
~
\ \
o !
20 1 o I
o I o o I
I
5 /0
Dia~kr (inches)
0 0
15
FIG. 10 (a). Height curves for Eucalyptus grandis Hill showing that subnormal diameters which are not evident on a diameter/height curve (a) are manifest on a sectional area/height curve (Fig. ro) (b) and that the curve appropriate to form quotient 0'75 derived from (a) deviates from observed values along
the whole length of the stem.
occur at 4i- ft. above ground, derived form quotients are higher than they would otherwise be, and it seems reasonable to suppose that such subnormal diameters have been one of the causes tending to give plausibility to the idea of variation in the form of tree stems.
One of the many examples which could be given is shown in Fig. 10 (a), which is based on data of a 23-year old Flooded Gum (Eucalyptus grandis)

25 BACKGROUND
tree from indigenous forest in New South \iVales. The tree was 132 ft. high and the d.b.h. underbark 13'06 in. It should first be noted thatthe diameter height curve in Fig. 10 (a) gives no indication that diameters below 26 ft. are subnormal, but-and this is significant-this part of the curve is steep and in this respect rather like the lower portion of a high form-class curve.
(8) Flooded Cium
Eucalyptus grAndis Hill/20
/00
80
60
~. '\
<:> \. \. b \
20 " \ II 0>(
'.! ¥
~\- -- --0·2 0·+ 0-0 0-8 /·0
secftOnai area (s<J Ii)
FIG. 10 (b). For legend see Fig. 10 (a).
The curved value of D from this graph is 12'0 in. approx., and that of dsn
(at 68'1 ft. above ground) is 9 in. approx., so that the derived form quotient is 0'75 approx. Fig. 10 (b) is given in terms of area/height for observed values of diameter measurements and also for calculated diameters corresponding to form quotient 0'75.
The first point to note from Fig. 10 (b) is the very pronounced and local divergence of observations to about 30 ft. from the ground from the

26 BACKGROUND
straight line defining the main stem from about 30 ft. to about u5 ft. above ground. The divergence of observed values from the taper line resembles a concave curve inside it, terminating at about 4 ft. from the ground where butt-swell development is approaching maximum proportions. The other feature to be noted from Fig. 10 (b) is that the calculated form-class curve diverges systematically from observed values along the whole stem and obviously cannot be accepted as representing the basic shape of the stem.
5. ALTERNATIVE THEORIES OF STEM FORM
Of the various theories which have been put forward to account for the shape of forest-tree stems, and more especially, for differential diameter thickening along the stem, the two 'which have awakened most interest are Metzger's [I I] 'girder' theory, which has a mechanical basis, and Jaccard's [12 and 13] conduction theory which has a physiological basis.
(a) lV!echanical theories
(i) Metzger's girder theory
The basis of Metzger's theory is rational in so far as he regards the main stem primarily as a structural member fashioned to allow a tree to withstand external forces, to assist in survival in competition with other trees, and to have maximum chance of reproduction. In order that the greatest possible proportion of a tree's food-supply should be directed to the development of crown, foliage, flowers, and fruits, Metzger considered that the minimum material, consistent with its function, should be contained in the main stem. Following this line of thought Metzger supposed that lateral windpressures on the crown were the dominant external force, that these windpressures on the crown could be considered as centred at a 'focal point' of the crown, and that the stem below the focal point (and above the butt swell) was a cantilever beam of uniform resistance, i.e. of constant stress in the outside fibres, which is to say a cubical paraboloid.
He recognized that butt swell represented an additional thickening at the lower portion of the stern and that the proportional length between the focal point and the butt-swell region varied for individual trees.
As pointed out in an earlier paper [I] according to this hypothesis, the diameter/height curve of the portion of the stem considered should conform to the equation h = kd3 (where h = distance from the focal point, i.e. from the vertex of the supposed cubical paraboloid), d = diameter at hand h is a measure of taper. A graph of d3 against height should therefore give a straight line for that portion of the stem conforming to the theory, and the projection of this line should intercept the vertical axis of the graph at the height of the supposed centre of pressures on the crown.
Probably the reason that the theory has been accepted by many authorities, e.g. as cited by BUsgen and MUnch [14], is that with some trees the

27 BACKGROUND
dimensions of a portion of the stem do not deviate significantly, when tested statistically or graphically, from those of a cubical paraboloid. It can easily be shown, however (see Section 8 (a)), that the greater the length of the stem free from crown and butt-swell influences, the better the fit of observed values to a graph of d2 against height than to d3 against height. The inescapable conclusion from the very large number of examples which could be given are that it is only within restricted limits that the main stem approximates to the shape of a cubical paraboloid and that the basic shape is that of a quadratic paraboloid.
(ii) Tor Jonson's theory of the relation between wind forces and 'form' of tl'ee stems
In an earlier paper [I] reference was made to Hojer's formula which was adopted and modified by Tor Jonson and claimed by him to represent a mathematical expression of the diameter/height curve of tree stems (excluding butt swell and a variable length of the stem in the crown). The uncertainties connected with form quotients and the deviation of form-class Curves from observed values have already been dealt with. Assuming, however, that these curves are sufficiently accurate for general purposes, there is no technical difficulty in drawing up form-class-volume tables in terms of d.b.h. (underbark and excluding butt swell) and height. For their application to forest enumerations, \ovhich must necessarily be in terms of d.b.h. overbark, the relation between D n and overbark d.b.h. must be determined and appropriate allowances made if an appreciable variation in this relation is found to exist for different species, ages, localities, treatments, etc. Assuming again that adequate data are available of butt swell and bark thickness, so that form class tables can be applied to d.b.h. overbark measurements, there remains the difficulty of obtaining a field estimate of the average form quotient of different crops. To avoid climbing and measuring, or felling and measuring the considerable number of sample trees necessary for this purpose in large-scale work, Tor Jonson evolved a method of estimating the form class of standing trees. This method depends on a correlation which he claimed to have established between form quotient and 'form point'. By 'form point' is understood the 'centre of gravity' of the crown, or in other words Metzger's 'focal point'. This of COurse has to be estimated.
In trying to associate his system of form classes with Metzger's theory, Tor Jonson obviously did not realize, nor does it appear to have been realized by others, that he was in fact submitting an opposing concept, in as much as he inferred that 'form' and not 'taper' was related to lateral ",'indpressures. The fundamental difference of the two concepts is that, whereas Tor Jonson assumes that the 'form', i.e. the shape, of the stem varies in accordance with lateral wind-pressures on the crown, Metzger assumes that the 'form' of the stem is constant (a cubical paraboloid), and 'taper' varies with lateral wind-pressures on the crown. According to both concepts by
BACKGROUND
the 'stem' is meant that portion of it which is not affected by crown and butt-swell influence.
That the fundamental difference of the two concepts has not been recognized is doubtless due to the common confusion between 'form' and 'taper' and this is the reason the difference is stressed and the two terms are defined in this paper.
It remains to be said that while there is abundant evidence to show that Metzger's concept is at lea:3t rational, Jonson's is irrational.
(b) A physiological theory
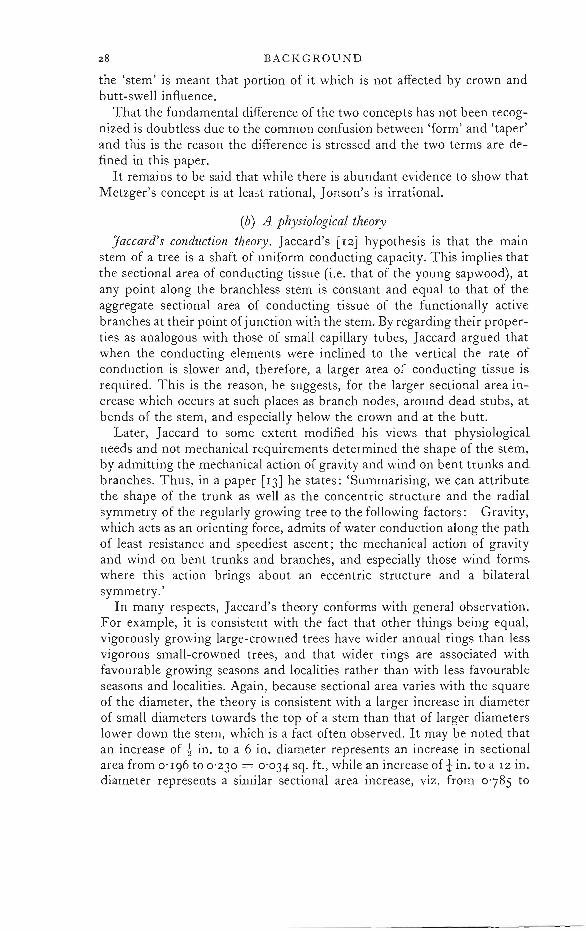
Jaccard's conduction theory. Jaccard's [12] hypothesis is that the main stem of a tree is a shaft of uniform conducting capacity. This implies that the sectional area of conducting tissue (i.e. that of the young sapwood), at any point along the branchless stem is constant and equal to that of the aggregate sectional area of conducting tissue of the functionally active branches at their point of j unction with the stem. By regarding their properties as analogous with those of small capillary tubes, Jaccard argued that when the conducting elements were inclined to the vertical the rate of conduction is slower and, therefore, a larger area of conducting tissue is required. This is the reason, he suggests, for the larger sectional area increase which occurs at such places as branch nodes, around dead stubs, at bends of the stem, and especially below the crown and at the butt.
Later, Jaccard to some extent modified his views that physiological needs and not mechanical requirements determined the shape of the stem, by admitting the mechanical action of gravity and wind on bent trunks and branches. Thus, in a paper [13] he states: 'Summarising, we can attribute the shape of the trunk as well as the concentric structure and the radial symmetry of the regularly growing tree to the following factors :-Gravity, which acts as an orienting force, admits of water conduction along the path of least resistance and speediest ascent; the mechanical action of gravity and wind on bent trunks and branches, and especially those wind forms where this action brings about an eccentric structure and a bilateral symmetry.'
In many respects, Jaccard's theory conforms with general observation. For example, it is consistent with the fact that other things being equal, vigorously growing large-crowned trees have wider annual rings than less vigorous small-crowned trees, and that wider rings are associated with favourable growing seasons and localities rather than with less favourable seasons and localities. Again, because sectional area varies with the square of the diameter, the theory is consistent with a larger increase in diameter of small diameters towards the top of a stem than that of larger diameters lower down the stem, which is a fact often observed. It may be noted that an increase of ~- in. to a 6 in. diameter represents an increase in sectional area from 0'196 to 0'230 = 0'034 sq. ft., while an increase of i in. to a 12 in. diameter represents a similar sectional area increase, viz. from °'785 to

29 BACKGROUND
0.819 = 0'034 sq. ft. While, as will be shown, the main stem of a tree maintains a paraboloidal shape, this can and does occur when, apart from the local irregularities referred to by Jaccard, sectional area increase along the main stem is not uniform. This is inconsistent with Jaccard's theory but, as will be shown, is consistent with mechanical theory.
(c) Summary
Summarizing this section on alternative theories it may be stated that, as often occurs with alternative concepts, the literature on the subject tends to over-emphasize the differences and to minimize the similarities. True it is that Metzger's theory emphasizes the relation of the dimensions of a stem to the tree's mechanical requirements and Jaccard's to its physiological requirements. Actually o~ course the shape of the stem must be consistent with both the mechanical and the physiological requirements of the tree. The ideas of both Metzger and Jaccard are unexceptional but their postulates are not in accord with the facts of experience.
6. THE CROWN OR 'Top' REGION OF THE CENTRAL STEM
In the literature on stem form it is generally recognized that the form of the stem in the crown differs from that of the main stem although, by implication, as has been shown, this difference is to some extent ignored by the use of total height as a term in some widely used mathematical stemcurve formulae.
I n an earlier paper [I] it was stated that in the case of species which retain an undivided axis to tree height the separate internodes embraced in the 'top' are indistinguishable from truncated paraboloids with successively steeper slopes. The shape of such a 'top' as a \-vhole approximates to a cone as will be seen if the diameter at the centre of each internode is plotted against height. The diameter/height relation being linear, the corresponding sectional area/height relation is curved (concave). In the case of double leaders the section of each leader immediately above the fork is much smaller than that of the stem below it. In each of the separate leaders, sectional area is linearly related to height as in the main stem, except for a variable distance from the 'tip' of the leader. In this respect each leader has similar characteristics to those of a single-stemmed specimen of a species of the above type. The central stem and side branches in the crown of broadleaved species and heavily branched species in general follow a similar pattern but the particular shape of the stem curve in the 'top' is conditioned by the character of the branching, and when a graph is drawn of sectional area against height of measurements taken along the stem in the crown, this may not conform with any symmetrical curve.
Experimental evidence indicates a close relation between the sectional area at any point in the crown (other than at nodal swellings or other points of contact between main and subsidiary stems) and that of the branches
BACKGROUND
above. Jacobs [IS] has demonstrated a relation of this sort in the case of the living crown of Pinus radiata trees. It may be a reasonable supposition that a relation exists between the area of the conducting tissue of the branches and of the stem, but it can easily be shown that sectional area increase along the main stem is not, as Jaccard supposed, always uniform.
3°
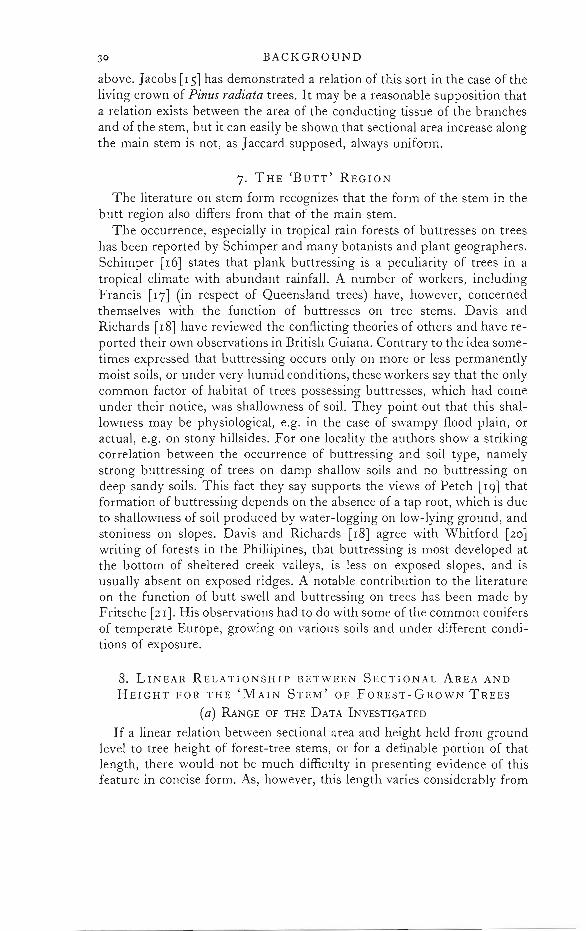
7. THE 'BUTT' REGION
The literature on stem form recognizes that the form of the stem in the butt region also differs from that of the main stem.
The occurrence, especially in tropical rain forests of buttresses on trees has been reported by Schimper and many botanists and plant geographers. Schimper [16] states that plank buttressing is a peculiarity of trees in a tropical climate with abundant rainfall. A number of workers, including Francis [17] (in respect of Queensland trees) have, however, concerned themselves with the function of buttresses on tree stems. Davis and Richards [18] have reviewed the conflicting theories of others and have reported their own observations in British Guiana. Contrary to the idea sometimes expressed that buttressing occurs only on more or less permanently moist soils, or under very humid cond itions, these workers say that the only common factor of habitat of trees possessing buttresses, which had come under their notice, was shallowness of soil. They point out that this shallowness may be physiological, e.g. in the case of swampy flood plain, or actual, e.g. on stony hillsides. For one locality the authors show a striking correlation between the OCCurrence of buttressing and soil type, namely strong buttressing of trees on damp shallow soils and no buttressing on deep sandy soils. This fact they say supports the views of Petch [19] that formation of buttressing depends on the absence of a tap root, which is due to shallowness of soil produced by water-logging on low-lying ground, and stoniness on slopes. Davis and Richards [18] agree with Whitford [20] writing of forests in the Phillipines, that buttressing is most developed at the bottom of sheltered creek valleys, is less on exposed slopes, and is usually absent on exposed ridges. A notable contribution to the literature on the function of butt swell and buttressing on trees has been made by Fritsche [2 I]. His observations had to do with some of the common conifers of temperate Europe, growing on various soils and under different conditions of exposure.
8. LINEAR RELATIONSHIP BETWEEN SECTIONAL AREA AND
HEIGHT FOR THE 'MAIN STEM' OF FOREST-GROWN TREES
(a) RANGE OF THE DATA INVESTIGATED
If a linear relation between sectional area and height held from ground level to tree height of forest-tree stems, or for a definable portion of that length, there would not be much difficulty in presenting evidence of this feature in concise form. As, however, this length varies considerably from
3 1 BACKGROUND
tree to tree, owing to the variab Ie length of the stem influenced by branching towards the 'top' and by 'butt swell' towards the ground, the universal feature of linearity along the main stem is best evidenced by sectional areal height graphs.
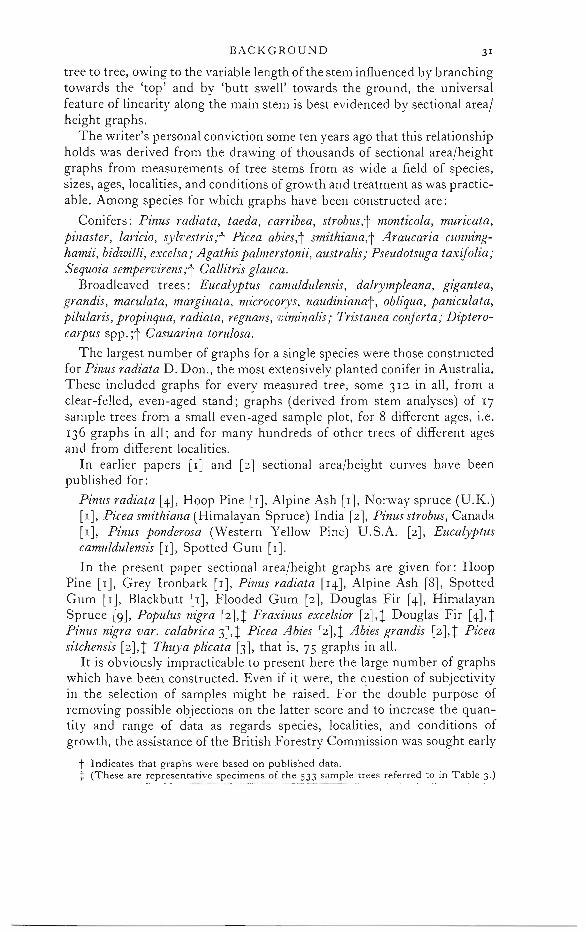
The writer's personal conviction some ten years ago that this relationship holds was derived from the drawing of thousands of sectional area/height graphs from measurements of tree stems from as wide a field of species, sizes, ages, localities, and conditions of growth and treatment as was practicable. Among species for which graphs have been constructed are:
Conifers: Pinus radiata, taeda, carribea, strobus,t monticola, muricata, pinaster, laricio, sylvestris;t Picea abies,t smithiana,t Araucaria cunninghamii, bidwilli, excelsa; Agathis palmerstonii, australis; Pseudotsuga taxifolia; Sequoia sempervirens;t Callitris glauca.
Broadleaved trees: Eucalyptus camuldulensis, dalrympleana, gigantea, grandis, maculata, marginata, microcorys, naudinianat, obliqua, paniculata, pilularis, propinqua, radiata, regnans, viminalis; Tristanea conferta; Dipterocarpus spp.;t Casum,ina torulosa.
The largest number of graphs for a single species were those constructed for Pinus radiata D. Don., the most extensively planted conifer in Australia. These included graphs for every measured tree, some 3IZ in all, from a clear-felled, even-aged stand; graphs (derived from stem analyses) of 17 sample trees from a small even-aged sample plot, for 8 different ages, i.e. 136 graphs in all; and for many hundreds of other trees of different ages and from different localities.
In earlier papers [IJ and [2J sectional area/height curves have been published for:
Pinus radiata [4J, Hoop Pine [rJ, Alpine Ash [rJ, Norway spruce (U.K.) [IJ, Picea smitlziana (Himalayan Spruce) India [2J, Pinus strobus, Canada [IJ, Pinus ponderosa (Western Yellow Pine) U.S.A. [2J, Eucalyptus camuldulensis [I J, Spotted Gum [r].
In the present paper sectional area/height graphs are given for: Hoop Pine [IJ, Grey Ironbark [IJ, Pinus radiata [14J, Alpine Ash [8J, Spotted Gum [rJ, Blackbutt [IJ, Flooded Gum [2J, Douglas Fir [4J, Himalayan Spruce [9J, Populus nigra [zJ,! Fraxinus excelsior [zJ,! Douglas Fir [4J,! Pinus nigra val'. calabrica 3J,! Picea Abies [2J,! Abies grandis (zJ,! Picea sitclzensis [zJ,! Tlzuya plicata [3J, that is, 75 graphs in all.
It is obviously impracticable to present here the large number of graphs which have been constructed. Even if it were, the question of subjectivity in the selection of samples might be raised. For the double purpose of removing possible objections on the latter score and to increase the quantity and range of data as regards species, localities, and conditions of growth, the assistance of the British Forestry Commission was sought early
t Indicates that graphs were based on published data. t (These are representative specimens of the 533 sample trees referred to in Table 3.)
32 BACKGROUND
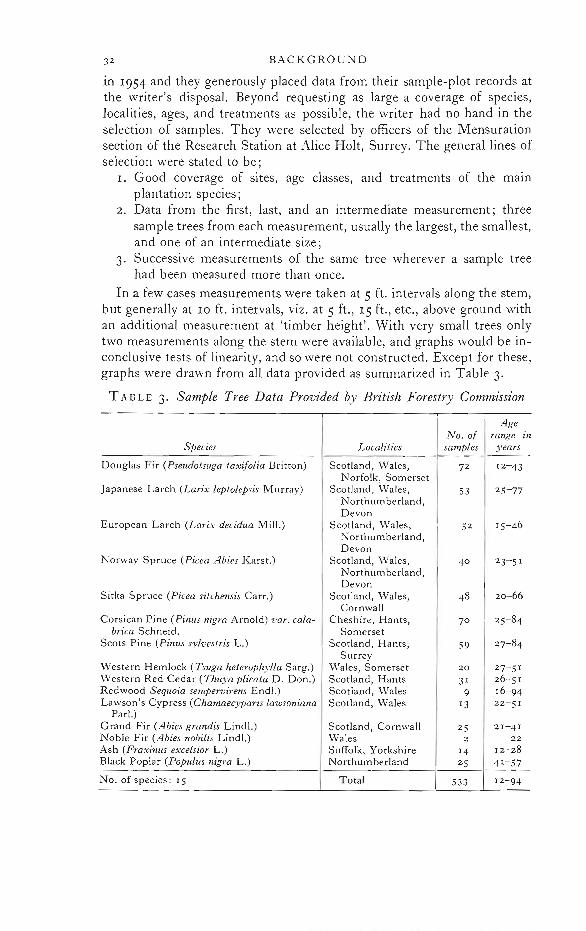
in 1954 and they generously placed data from their sample-plot records at the writer's disposal. Beyond requesting as large a coverage of species, localities, ages, and treatments as possible, the 'writer had no hand in the selection of samples. They were selected by officers of the Mensuration section of the Research Station at Alice Holt, Surrey. The general lines of selection were stated to be;
1. Good coverage of sites, age classes, and treatments of the malO plantation species;
2. Data from the first, last, and an intermediate measurement; three sample trees from each measurement, usually the largest, the smallest, and one of an intermediate size;
3. Successive measurements of the same tree wherever a sample tree had been measured more than once.
In a few cases measurements were taken at 5 ft. intervals along the stem, but generally at 10 ft. intervals, viz. at 5 ft., IS ft., etc., above ground with an additional measurement at 'timber height'. With very small trees only two measurements along the stem were available, and graphs would be inconclusive tests of linearity, and so were not constructed. Except for these, graphs were drawn from all data provided as summarized in Table 3.
TABLE 3. Sample Tree Data Provided by British Forestry Commission ,
Age No. of range 111
Species Localities samples years
Douglas Fir (Pselldo/suga taxifolia Britton) Scotland, Wales, 72 12-43 Norfolk, Somerset
Japanese Larch (Larix leptolepsis Murray) Scotland, Wales, 53 25-77 Northumberland, Devon
European Larch (Larix decidua Mil!.) Scotland, \,yales, 52 15-46 Northumberland, Devon
Norway Spruce (Picea Abies Karst.) Scotland, \,yales, 4° 23-5 1 Northumberland, Devon
Sitka Spruce (Picea sitche1tSis CarL) Scotland, Wales, 48 20-66 Cornwall
Corsican Pine (Pinus nigra Arnold) val'. cala- Cheshire, Hants, 7° 25-84 brica Schneid. Somerset
Scots Pine (Pinus sylvestris L.) Scotland, Hants, 59 27-84 Surrey
Western Hemlock (Tsllga he/erophylla Sarg.) Wales, Somerset 20 27-5 1 \,yestern Red Cedar (Tlnlya plica/a D. Don.) Scotland, Hants 31 26-5 1 Redwood Sequoia se1flpervirens End!.) Scotland, Wales 9 16-94 Lawson's Cypress (Chamaecyparis lawsoniana Scotland, Wales 13 22-5 1
Par!.) Grand Fir (Abies grandis Lind!.) Scotland, Cornwall 25 21-4 1 Noble Fir (Abies nobilis Lind!.) Wales 2 22 Ash (Fraxinus excelsior L.) Suffolk, Yorkshire 14 12-28 Black Poplar (Populus nigra L.) Northumberland 25 41-57
No. of species: 15 Total 533 12-94

33 BACKGROUND
The total number of stem measurements, excluding those for total height, was 3,075. Of these 368 fell on portions of the stem where the curve was quite different from that of the main stem; 227 measurements were in 'top' lengths where influence by branching is likely, and 141 (including 'negative' butt-swell in several cases), on lower lengths subject to 'butt' influence. Of the 227 'top' measurements, 138 were above a section corresponding to 3tin.diameter and onlyin the case of 56 stems (19 being large specimens of Corsican pine) did branching influence extend to a larger size. 'Butt' influence was apparent on 132 stems. The maximum height above ground to which this extended was 25 ft. (one large Sequoia) and the average for the 132 stems was 9l· ft. If the aggregate length (1,221 ft.) to which 'butt' influence extended is divided by the total of 533 stems, the average is 2} ft. This surprisingly low average is due no doubt to a considerable number of 'subnormal' sections. Details of 'top' and 'butt' deviations are shown in Table 4.
TABLE 4. Analysis of Numbers of 'Top' and 'Butt' Deviations from the Line Defining the 'Main Stem'
(Referring to the same samples as in Table 3)
De1.,:iations at 'lOP' Deviations at 'b"tt' I
Species
~
:: ~ '0' 0
" "<i ~
:: ~ ~ -~.::
...." -'~
""' '0
~ ~ ~ ~~ " O'N
-.:"" ~ ::Q
---
"<i (5 h
I
I ~
~ 'c0
:<>;
-- -
" ·2
" 'is ~ 'c0
:<>;
I. ,~
'c . <:l.":u v~ •.§'S ::; " 1
~~ ~ ~'S 'o-.~ 'c " ",,""-<>.
" .., ~ ~ ;: :::". ~.~
""" ;::: :::
~~ " e ~ ~ ,,-<>
~"" - ~~ ~:o "<i;;·E ;;
~ " " ~ ~ ~
---- ._ft. ft. ft.
Douglas Fir 72 24 8 ]2 17 20 170 10 .2'5 52 Japanese Larch European Larch Norway Spruce Sitka Spruce Corsican Pine
5] 52 40 48 70
2 17 7
27 32
I
4 ] 6
19
] 21 10 ]] 5[
]
7 6I]
18
]
7 6
17 20
22 47 47
154 168
7 7 8
12 9'3
0'4 1 ['2 3'2 2'4
6 28 16 50 71
Scots Pine 59 18 5 2] [7 17 154 9 2·6 40 Western Hemlock 20 [0 4 14 5 5 ]7 7 1'5 19 Western Red Cedar ] [ 5 .. 5 1] 13 II6 9 3'8 18 Redwood 9 8 5 I] 5 9 100 20 [[ 22 Lawson's Cypress I] 3 3 1 I 8 8 0·6 4 Grand Fir 25 5 5 7 ] 21 3 0'9 8 Noble Fir 2 . . .. Ash Poplar
Total
14 25
533
5 8
17 1
.. I
56
5 9
227
. . 20
1]2
. . 20
14' I,::~I~ . . 7
5 29
]68
For the purpose of an analysis of deviations from the main stem linearity, some minimum numerical measure of what constitutes a deviation must first be postulated. It might be thought that a sectional area value corresponding to say ±5 per cent. of the diameter assumed to be correct might be acceptable. An objection to this is that with a small dimension a 5 pef
B 52:10 C

34 BACKGROUND
cent. departure is hardly discernible on a conveniently sized sectional area/height graph, while for a large dimension a departure of less than 5 per cent. is often too large to ignore.
(N.B. 3 in'±5 per cent. = 3'15 in.-3·0 in.-2·85 in. = 0'°54-0'°490'045 sq. ft.; 15 in'±5 per cent. = 15'75 in.-15·0 in.-14·25 in. =
1'353-1'227-1'107 sq. ft.)
Since the demonstration is concerned with departures from a linear relation, deviation in terms of sectional area is considered suitable and 0'025 sq. ft. is taken as a reasonable minimum value to define as a deviation. This limit corresponds to diameter deviations of I per cent., 2'2 per cent., 3'5 per cent., 4'7 per cent., and 6 per cent. in the case of 15 in., 10 in., 8 in., 7 in., and 6 in. diameter dimensions respectively, and although it rises to about 25 per cent. for a 3 in. diameter, it should be noted that, apart from the small absolute deviation involved, it is often difficult to determine within a few feet the height at which 3 in. (timber height) is found.
TABLE 5. Analysis of stem measurements of samples in Table 3
I 2 3 I 4(2-3) I 5 6 I 7(5- 6)--f-- ---i------'-----I-----f----
Species
Douglas Fir, 7Z 439 52 387 9 8 Japanese Larch 53 266 6 z60 European Larch 5Z 340 28 3 I Z 7 7 Norway Spruce 40 2 [7 16 20 I 9 3 6 Sitka Spruce, 48 280 50 230 17 7 10 Corsican Pine 70 453 7 I )82 18 2 16 Scots Pine 59 340 40 300 16 4 12 \Yestern Hemlock, zo 100 19 81 2 2
\Yestern Red Cedar 31 lSI 18 133 5 2
Red Wood 9 73 Z2 51 18 15I Lawson's Cypress, 13 6z 4 58 I
Grand Fir Z5 150 8 142 I
Noble Fir 2 8, , 8 Ash 14 66 5 6 [ 2 I 2
B=:I,--a_ck.,.---Po-,p_l_ar_'__+_2-=-5 130 _7'29,,-,_----,1_°,--1_.1 4__1 + 4__ Total 533 3,075 361l 2,707 109 I 35 74
88% of (2) 4% of (4) i 32% of (5) 2,6% of (4)
From this table it will be seen that the average number of measurements per stem is nearly 6 and that the total number of 'main stem' measurements is 2,707, or 88 per cent. of the total of 3,075. Of these, 109 (i.e. 4 per cent.) deviated by 0'025 sq. ft. or more from a line defining the sectional areal height relation. Of these deviations 35 have been listed as demonstrably erroneous measurements because they can be shown to be incongruous with earlier or later measurements at the same height above ground of the

35 BACKGROUND
trees in question. Graphs illustrating 12 of the 35 such demonstrable errors, based on successive measurements of individual trees of Douglas fir, Corsican pine, Norway spruce, and Sitka spruce trees are given in Fig. I I (A), (B), (C), and (D) respectively.
From the graphs, errors in sectional area dimensions at the stated heights above ground are manifest, viz.:
(A) Douglas Fir at 15ft. 26 yrs. and 32 yrs. too large, at 25ft. 29 yrs. and 35 yrs. too small;
(B) Corsican Pine at 15 ft. 39 yrs. too small, at 25 ft. 30 yrs. and 39 yrs. too large;
(C) Norway Spruce at 15 ft. 58 yrs. too small, at 25ft. 39 yrs. too large, at 35 ft. 58 yrs. too large;
(D) Sitka Spruce at 15ft. 35 yrs. too small, at 35ft. 35 yrs. too large.
It could be argued that the 15ft. measurement at 26 years and at 32 years on the Douglas fir was representative of some peculiarity of a high-reaching 'butt', which was not shown in the 25-year and the 35-year measurements. Allowing for this rather dubious assumption there still remain 10, or 80 per cent. of the 12 measurements manifestly in error, and it is reasonable to suppose that a very high proportion at least of the remaining 74 deviations arose from similar causes. (N.B. Opportunity for checking was available for 56 stems only, i.e. 10'5 per cent. of the 533 stems measured, and for these, 32 per cent. of the total deviations along the stem have been listed as almost certainly erroneous.)
The manifest errors referred to above are in respect of 'main stem' measurements. As is to be expected, measurement errors are not confined to the main stem and some may be noted among the measurements recorded of the four sample trees above. Thus at 5 ft. on the Douglas Fir, the 26-year measurement is probably too large and the 35-year measurement certainly too small, for it is a smaller dimension than that recorded three years earlier. On the other hand, although the 5 ft. measurements of the Corsican pine appear to be too small the fact that they are at each of the three measurements suggests that the section was 'subnormal' at this point. From Fig. II (E) the 5 ft. measurement of the Western Red Cedar shows an abnormally large increment between 31 and 36 years and either or both of the 31-year and 36-year measurements may be wrong.
The above demonstration is not intended to detract from a series of measurements which are excellent by customary standards, but to emphasize the fact that, without a 'taper line' check, a few measurement errors of one sort or another, apart from measurements at 'unrepresentative' points, appear to be inevitable.
For many practical purposes, and especially when measuring standing trees by the 'taper line' method, the important question is not so much the

N.d
lht(
ke
l;)
so:
x
(A)
(8
)
CC
) (0
)
([)
70
Do
ug
/8S
Ft,
C
ors;
'can
Ah~
Sit
ka
SP"'uc~
>ve
slem
Red
Cew
,.
Pse
Lld
o!su
gSl
taxi
(o!J
!J 8
,.;1/
. P
Inu
s n
igra
Arn
old
PJ
CLB
stlc
hen
sis
Ca....r
. T
hu
jB p
/IC
I1IlJ
D D
o/1
\ i
so
4Q
30
20
'0
+
02
'·
0
are
_S
eerlo
na
l
(S<
p
11
'.)
FIG
. r r
. S
ecti
onal
are
a/h
eig
ht
curv
es f
rom
suc
cess
ive
mea
sure
men
ts o
f th
e sa
me
tree
s re
veal
ing
abn
orm
alit
y o
f ce
rtai
n o
f th
e re
cord
ed v
alue
s.

------
------ ------
37 BACKGROUND
percentage length of the whole stem for which a linear relation holds, but the percentage height above ground to which it extends, since measurement at the lower end of the stem can be carried out from the ground. For practical purposes also the percentage length of 'timber height' to which a linear relation extends is the important question, since the volume contained in the stem above say 3 in. diameter is very small and often not utilizable. (N.B. With large-crowned trees the small end of the utilizable 'bole' is often just below the crown at which point the diameter may be quite large. A linear relation usually holds to this point.)
For 349 stems, or 73 per cent. of the total 533, a linear relation holds down to 3 in. diameter, i.e. to 100 per cent. of the 'timber height' recognized by the British Forestry Commission. Of the remaining 144 stems the minimum percentage height to which the relation holds is 55 per cent. and the average for the 533 stems is 95 per cent. These calculated percentages are conservative because, in cases where no measurement was available, no allowance has been made for an extension of the linear relation between the highest 'main stem' measurement and the lowest one of the 'top'. Experience suggests that it is probable that a linear relation would hold, on the average, at least half-way between the last 'main stem' measurement and the lowest recorded measurement in the 'top'.
Perhaps it should again be emphasized that the percentage heights referred to above include the lengths subject to 'butt' influence, which it has been shown are generally inconsiderable in the case of these particular 533 stems.
Details by species are given in Table 6.
TABLE 6. Propat·tionallength Above Ground of 'Timber Height' to which Linear Relation Extends
100% Less than 100%
TOlal ~~ of Average 110. of No. of lolal No. of % of all
Species stems stems stems siems NIiIl. lVJax. Average sIems
--._
Douglas Fir 72 49 68 23 70 96 80 95 Japanese Larch 53 47 89 6 80 9 2 85 98 European Larch 52 39 75 13 65 89 79 94 Norway Spruce 40 34 85 6 61 93 81 97 Sitka Spruce 48 28 58 20 70 93 80 96 Corsican Pine 70 43 60 27 55 95 72 88 Scots Pine 59 48 81 II 64 94 79 96 ""estern Hemlock. 20 II 55 9 57 95 80 91 Western Red Cedar 3 1 27 87 4 81 94 87 98 Redwood 9 2 22 7 68 90 80 84 Lawson's Cypress. 13 II 85 2 86 88 87 98 Grand Fir 25 22 88 3 65 95 80 97 Noble Fir 2 2 100 .. Ash 14 9 64 5 81 97 86 95 Black Poplar 25 17 68 8 83 93 86 95
Total 533 389 73 144 . . . . .. 95

BACKGROUND
8(b). COMPARISON OF FIT OF OBSERVED V ALVES TO GRAPHS
OF d2jh AND d3jh
Confirmation of the statement in the last paragraph of Section 5 (a) i, that observed values give a better fit to a d2 jh graph than to a d3 jh graph will be seen by reference to Fig. 12 (a). To put the choice of samples for the test on an objective basis the shortest and the tallest sample trees for each of the fifteen species embraced in the whole sample tree data provided by the British Forestry Commission \vere graphed. In all, thirty samples were involved.
As far as practicable the overall dimensions of the diagrams in Fig. 12
are comparable for each pair of d2 and d3 graphs. This of course involves the use of different horizontal scales which rather tends to favour the representation of the d3 graphs.
Notwithstanding, in one case only, viz. the tall specimen of Lawson's cypress, does a graph of d3 appear to give a better fit for a longer length than does the graph of d2• In the writer's opinion this superiority is fortuitous and ascribable to heavy branching giving rise to a 'top' curve at about 45 ft. For the main stem beneath, the fit of observations to the d2
graph and to the d3 graph appear equally good. The greater length for which d3 is a better fit is because the prolongation of the 'main stem' curve, in terms of d3 , happens, in this instance, to coincide more or less with the 'top' curve in these terms. The intercept on the vertical axis certainly does not correspond to the centre of gravity of the crown, as Metzger's theory supposes.
In four of the short sample trees (not illustrated), namely those of Douglas Fir, Western Hemlock, 'Western Red Cedar, and Redwood, it might be claimed that observed values fit as well to a graph of d3 as to a graph of d2• For the tall specimens (not illustrated) of these four species, however, a longer percentage length conforms to a graph of d2 than to a graph of d3 viz:
d2 d3
Douglas Fir 85% 71 .8% Western Hemlock 85'7% 62·8% Western Red Cedar 79% 68% Redwood 73'9% 56'5%
All the other samples give a better fit of observed values to a graph of d2
than to a graph of d3 Out of the thirty samples d:J possibly gives the better•
fit for one sample only, for four there is little to chose, and for all the remaining twenty-five, d2 is definitely better.
I t is of interest to compare the fit of observations to the two graphs for typical examples of stem form not included in the British Forestry Commission data. Graphs have been drawn for a large-crowned broadleaved free (the Alpine Ash of Fig. 7), and another broadleaved tree showing
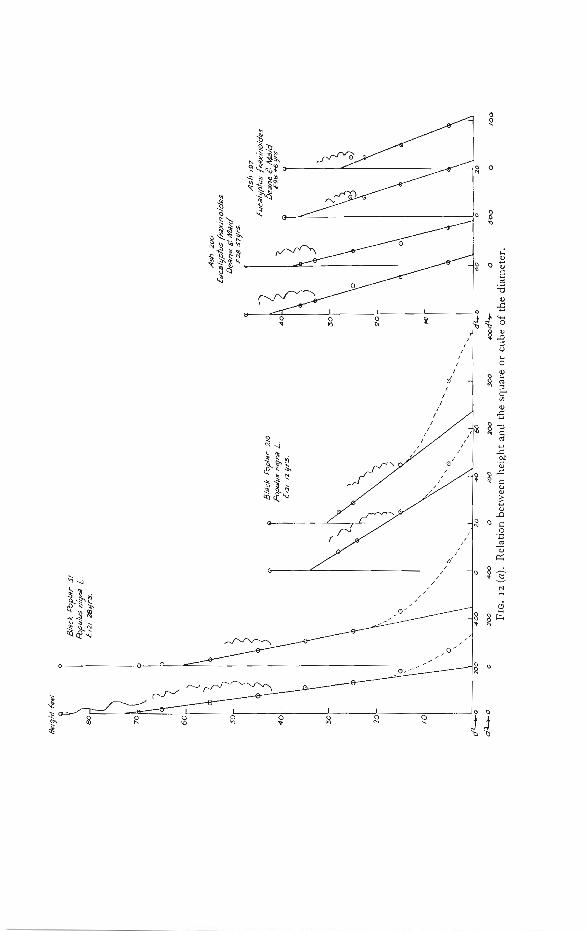
fleig
h! r
~...
Bla
ck A
Jp
lar
51
A:J
pulu
s "'9
'" L
.
EJ2
J 2S
yr.s
.
Ash
2
00
fwca
lljp
lus
(ra
xin
old
es
D(!.
!Ine
,,; M
'Bld
. £
28
S7
yrs
.
As
h /
97
E
UC
.!ItY
pfus
(ra
xin
oid
<ls
Bla
ck F
bpla
r 2
10
D"an.G~/d
40
AJ
j>W
IJS
"'9r.!
l L.
Eg
S f
'Cy
rs
E/2
1
12
Yr5
.
'0
"0
10
2
0
10
"
, "
M)
, "
"'
o... ,
'""
r)
'>!,
I "
>'
1\
......
1
\ I
... ,.
...
J 1
\\1
1\
1\
dJ~o
20
0
40
0
0 2
0
+0
6
0
d!.-O
:5
n
n om
d~o
o 2
00
4
00
0
10
0
20
0
30
0
4O
Od
L,.
. 0
$0
0
a 1
00
FIG
. 1
2 (
a).
Rel
atio
n be
twee
n he
ight
an
d t
he s
qu
are
or
cub
e o
f th
e d
iam
eter
.

/I"9
hl k
</
00
(irA
nd
r;;-
Ab
ie'
9ra
nd
is L
ind
l,
S J
5
4.l
yr$
60
70
60
) ~)
Ch
amae
cyp8
ns
LAw
X)Il
'U3n
l R
id
L.a
wso
ns
Cyp
r'es
s 5
1 y
rs
lki9
h/ f,,
' 7
0
50
I \ ]\
::10
1I
I \ \ ~
I \
I
Gn
Md
Fir
Ab(~s
9",1
7015
B
S.$
5
21 If
"$
\ "
~
4<!
~o
:1
0
o~
o~
Ch
.am
Re'
1p;i
ris
La
ws
on
,,*n
.t p
..,.
/ L
JlW
SO
I1S
C
ypre
ss
31
yrs
10
d.l d'
\ I
20
0
0
\ I
0
20
00
I 2
0
,\
40
a
I
10
0
\. "
I
20
0
10
d'
0 5
D
d J
FIG
. 1
2 (
a) c
onti
nued
.
0 S
'OO
0 zo
.., a
10
0
20
0

100 .
\ \ o \
\ BO"
" ........
20 '0
......o ....... -0_ 100 1000 ::l000
FIG. 12 (b). Comparison of fit of observations to graphs of d'Jh and d 3Jh: Alpine Ash (Eucalyptus gigantea Hook f.).
Flooded tium Eve.t1lyptvs grandI' 11,11
120 "0
60
'0
100 200o
FIG. 12 (C). Comparison of fit of observations to graphs of d'Jh and d3Jh: Flooded Gum (Eucalyptus grandis Hill).

42 BACKGROUND
pronounced subnormality of section at the lower end of the stem (the Flooded Gum of Fig. 10). These graphs are shown in Figs. 12 (b) and 12 (c) respectively.
Here again it will be seen that the graph of d2 represents a better fit for a longer length than does the graph of d3 .

PART II. NEW THEORY
9. INTRODUCTION
THE writer's hypothesis derives from both actual measurements and inductive reasoning. '~Tithout rigorous search for data to illustrate unusual as well as common features, the opportunity would not have occurred to demonstrate that, far from being inconsistent with the hypothesis, as at first might have been thought, such cases have given indirect support to it, and in particular have led to the formulation of a theory in terms of much wider applicability than could otherwise have been possible. To Mr. G. Odgers the writer is indebted for successive mathematical demonstrations, which are summarized in the Appendix, and for the formulation of the theory cited herein, covering usual and unusual phenomena connected with stem form. In the following sections it is shown that the stem form of every type of forest-grown tree likely to be met with, accords with the theory submitted, and various implications of the theory are given.
10. GENERAL THEORY
There have been, and are, many in general agreement with Metzger's idea that resistance to \vind is a dominant factor influencing the shape of a forest-tree stem, and general acceptance of his deduction that the main stem should therefore conform to the dimensions of a truncated cubic paraboloid has tended to follow. A natural consequence has been for the wind pressure theory to be discounted by those whose investigations show that a tree stem is not of this shape. Critical reflection suggests that Metzger's deduction is rather an artificial one, because only if a tree were embedded in a material sufficiently strong to ensure that the attachment at the base would hold against forces greater than those necessary to break the stem, would it require the dimensions of a cubic paraboloid to offer uniform resistance to lateral pressures centred on the crown. As a tree is embedded in relatively weak material it would appear that Metzger's stem is unnecessarily strong, and so does not represent the most efficient structural member from a mechanical point of view. On the other hand, as indicated in earlier papers, and particularly in Section 8 above, there is abundant evidence to show that the dimensions of the main stem conform to those of a (quadratic) paraboloid. Since, for a given height and base, a cubic paraboloid contains 20 per cent. more volume, it represents a less efficient structural member than a paraboloid. In the appendix, a paraboloidal stem is shown to be consistent with the mechanical requirements of a tree, not only in regard to horizontal wind-pressures on the crown, but also to other forces acting on the stem, and a general hypothesis is offered in the following terms: 'The mechanical stress averaged over the whole section underbark is constant along the

44 NEW THEORY
length of the main stem, and if this is circular, the area of the section is proportional to the stress on it.'
In the following Sections II to 15 confirmatory data are given and discussed.
11. RELATION OF HORIZONTAL WIND-PRESSURES ON THE
CROWN TO STEM TAPER
(a) General deduction
As diHerences in the slopes of straight lines are easier to express either graphically or mathematically than are diHerences in the slopes of curves, the eHect of horizontal wind-pressure on the crown will be demonstrated in terms of taper-line slope according to the notation below. For ready reference equations are numbered.
(1) h = hd2
where d = diameter at distance h from parabolic height and k varies for diHerent tree stems,
(2) h = hiS
where S = sectional area at distance h from parabolic height and hI varies for diHerent stems,
taper line slope.
Consider first the case of a forest tree with its crown an appreciable distance from the grounD, which is the usual case, and when lateral pressures on the crown are dominant and are not, on balance, preferential in any particular direction. The sections of the stem should then be circular and the equation for the main stem may be written:
(4) F(H-h]) = Ks
where F = resultant force at height H [iOm the base, i.e. at the height of the centre of pressure on the crown; s = sectional area at hI from the base, and K is a constant of proportionality for a given strength of material.
Lateral pressures are normally dominant in the case of a forest tree having a relatively small branched and undivided stem to tree height. t
The relation between the expression for wind-pressures on the crown, F, and the expression for taper-line slope, hI' may now be shown. First it will be seen from Fig. 13 that:
(5) h = H-hi
since h = distance from parabolic height and hI = distance from parabolic base. Combining (2) and (5).
t Fig. 13 illustrates diagrammatically such a caSe. The expression F(H-h,) = Ks leads to hI = IIp when s = 0, and since hI = H when s = 0, parabolic height is equal to the height of the centre of pressures on the crown, which of coUrse is less than tree height.

NEW THEORY 4S
(6) H-h l = kIS.
Combining (4) and (6)
(7) Hence
(8) F = Kjk l .
Thus kl varies inversely with F, that is to say strong lateral pressures on the crown are associated with a low value of kl . This may be graphically
Sl?Ct/on~/ area
FIG. 13. Diagram illustrating the effect on taper of lateral pressures on the crown when
these are dominant.
represented by a gentle taper-line slope, but a forester usually speaks of such a stem as having 'rapid' taper. Conversely weak lateral pressures are associated with a high value of k l . This may be graphically represented by a steep taper-line slope, or spoken of as a stem with 'slow' taper. Actually foresters more often speak of such a stem as one which 'carries its girth (or size) up', or more generally as a 'cylindrical' stem, and sometimes, alas, as one with a 'high form factor'.
In whatever way taper is expressed the general relation referred to above is in accord with observations and some examples are given below. It is obvious that other things being equal, the resultant of lateral \vind forces will be greater on large cro\vned trees than on smaller ones and greater on exposed crowns than on sheltered crowns.

NEW THEORY
(b) Variation of taper as between different trees at a given time
By definition, dominant trees have larger, higher, and more exposed crowns than sub-dominant trees, which in turn have larger and more exposed crowns than dominated trees, A sectional area/height graph of a typical example of each of these crown classes from an unthinned, 19-yearold plantation of Pinus radiata is shown in Fig. 14.
Ifeight(feet)
Montel'e!l Pine Pinus ,-.;refia/a D. Don.
so
20
/0
0-/ 0·2 0·3 0-+ 0·5 Seclion£l/ anu~ (59.!!:)
FIG. 14. Variation of taper with crown class. (Trees from unthinned 19-year-old stand of Pinus radiata.)
The characteristics of the taper-line slopes of these trees are:
Dominant hI = 112'4 gentle slope = rapid taper Sub-dominant hI = 258'0 medium slope = intermediate taper Dominated hI = 410'0 steep slope = slow taper
are entirely in accord with the theory outlined.
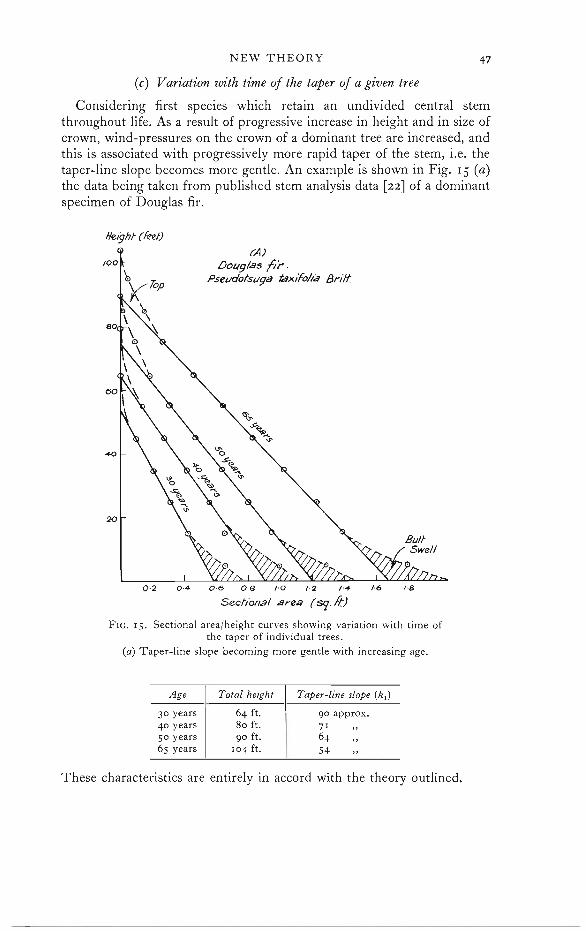
47 NEW THEORY
(c) Variation with time of the taper of a given tree
Considering first species which retain an undivided central stem throughout life. As a result of progressive increase in height and in size of crown, wind-pressures on the crown of a dominant tree are increased, and this is associated with progressively more rapid taper of the stem, i.e. the taper-line slope becomes more gentle. An example is shown in Fig. IS (a) the data being taken from published stem analysis data [22] of a dominant specimen of Douglas fir.
lIeighf (kef)
rAJ /QO DOll9/as {/r.
Psevdotsvga ~xifo/ia BriH
0·2 0·4 0·6 0 B /·0 /·2 /·4 /·6 /·8
Sect/onal area (S<J./i:)
FIG. IS. Sectional area/height curves showing variation ''lith time of the taper of individual trees.
(a) Taper-line slope becoming more gentle with increasing age.
Age Total height Taper-line slope (h,)
30 years 64 ft. 90 approx. 40 years 80 ft. 71
50 years 90 ft. 64 65 years 1°4 ft. 54
These characteristics are entirely in accord with the theory outlined.

10
NEW THEORY
Considering next a tree of intermediate crown class. The conditions of growth of such a tree lend support to the idea that increased shelter from surrounding trees should be sufficient to offset the effect of increase in
Height (kef)
(8) Albn~,.e!l Pln~
P1nus r~di8tN DDon.
FIC. IS (b). Taper-line slope remaining substantially constant with age.
height and in size of crown, at least within certain limits of time, and this should result in the taper of a tree remaining substantially constant within such limits of time. From Fig. 15 (b), based on stem analysis data of a 25-year-old specimen of Pinus radiata of this type, it is obvious that while,

49 NEW THEORY
shortly after the period of initial establishment, i.e. between the ages of 7 and 15 years, the taper-line slope steepened somewhat, from the age of 15 to the last measurement at 25 years, the taper-line slope remained substantially constant.
Age Total height Taper-line slope (k,)
7 years 24'0 ft. 136 approx. IS years 52'S in. 146 17 years 57'S in. '47 25 years 81'0 in. 147
These characteristics are again entirely in accord with the theory.
Hei9ht(FrtP) (C) 75 Afonfe,-e!l Pine
Anus r.8diiif8 D,Don
4-5
.30
0,/ 0'2 0,3
Sec/i'ona/ iilrea (51,!;)
FIG. IS (c). Taper-line slope becoming steeper with increasing age.
Taking finally the dominated tree growing in a dense stand. The increase in height is small and owing to severe restriction of growing space the increase in size of crown may be negligible. At the same time shelter from surrounding trees is increased and this may be sufficient to reduce windpressures on the crown. In such a case a less rapid taper is necessary to ensure uniform resistance to bending and the taper-line slope becomes steeper. Fig. 15 (c) based on two measurements, at a Io-year interval, of
B 5220 D
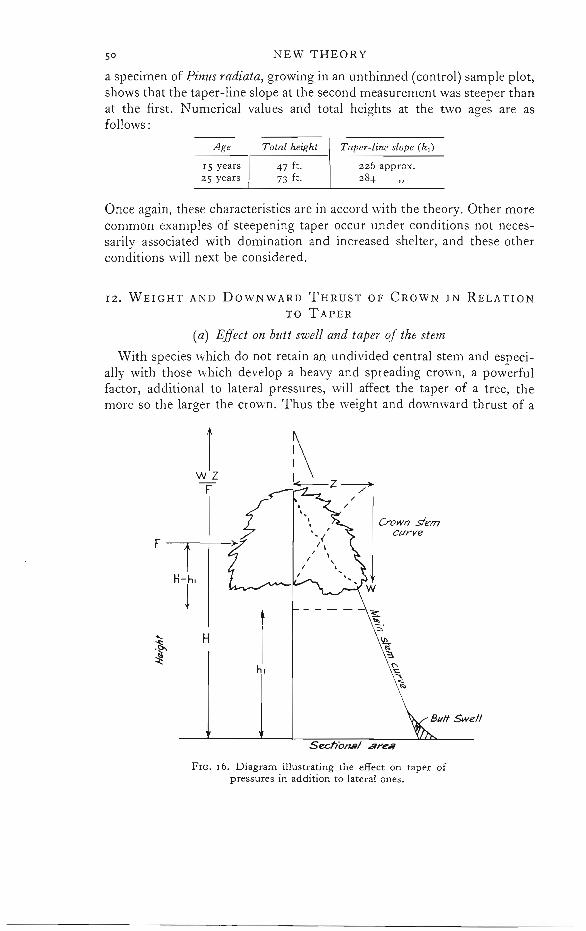
- - ---
NEW THEORY5°
a specimen of Pinus radiata, growing in an un thinned (control) sample plot, shows that the taper-line slope at the second measurement was steeper than at the first. Numerical values and total heights at the two ages are as follows:
Age Total height Taper-line slope (k l )
15 years 47 ft. 226 approx. 25 years 73 ft. 284
Once again, these characteristics are in accord with the theory. Other more common examples of steepening taper occur under conditions not necessarily associated with domination and increased shelter, and these other conditions 'will next be considered.
12. WEIGHT AND DOWNWARD THRUST OF CROWN IN RELA nON
TO TAPER
(a) Effect on butt swell and taper of the stem
With species which do not retain an undivided central stem and especially with those which develop a heavy and spreading crown, a powerful factor, additional to lateral pressures, will affect the taper of a tree, the more so the larger the crown. Thus the weight and downward thrust of a
1 wz T
Crown sfem cvrve
~ .... ",'
Bilil Swell
FIG. 16. Diagram illustrating the effect on taper of pressures in addition to lateral ones.

51 NEW THEORY
swaying, heavy, and spreading crown may contribute appreciably to the bending moment about any section. The additional bending moment may be expressed by the term WZ in the equation:
(9) F(H-h1 )+ WZ = Ks
where W = weight of the crown and Z is related to the amplitude of the swing of the crown, as illustrated diagrammatically in Fig. 16.
The additional bending moment is greatest at the base, thus partly accounting for butt swell, but its contribution to the total bending moment is relatively greater near the top of the trunk than lower down. In the case of a relatively short main stem surmounted by an abnormally heavy crown, the term F(H-h1 ) will be small relative to WZ and stem taper may be very slight, at least over a short distance. In limiting cases taper will be hardly perceptible. Outstanding examples of such cases are the so-called 'taperless' trunks of giant specimens of New Zealand kauri, referred to in Part I. These trees also represent noteworthy examples of steepening taper in the course of development, as before the tree develops a large umbrageous crown it has a stem which tapers in exactly the same sort of way as that of a pine, spruce, fir, or in fact that of any other species of forest tree. It will be appreciated that the conditions resulting here in steepening of taper are entirely different from those applying to small crowned dominated trees.
(b) Effect on Relation of parabolic height to total height
It has been shown under Section I I (a) that in the common case of a forest tree having a relatively small-branched undivided stem to tree height i.e. when lateral pressures are dominant, parabolic height is less than total height. In the case, however, of trees with flat-topped crowns, double or multi-leaders, and especially those with heavy branching crowns referred to in the above sub-section, the theory outlined provides the reason why parabolic height is greater than the assumed centre of lateral pressures on the crown, often greater than total height and in the limiting case of negligible taper, very much greater indeed than total height. That under these conditions parabolic height, (hp ) is greater than that of the centre of lateral pressures on the crown is evident from the expression
F(H-h I )+ WZ = Ks,
because hp = hI when s = 0, so that the expression leads to:
(10) hp = H+ WZjF.
It is not difficult to understand that with a heavy spreading crown the term WZjF may be very large.
Fig. 16 illustrates diagrammatically such a case and Figs. 7 and 8 illustrate specific examples of Alpine Ash and Spotted Gum respectively. Many similar examples could be given to show that under the conditions described, parabolic height is greater than total height.

52 NEW THEORY
13. RELATION OF PRESSURES ON THE CROWN TO SHAPE OF
SECTION
(a) Preferential pressures and eccentric sections
Many workers have demonstrated that when lateral pressures on a tree stem are preferential with respect to a particular direction, eccentricity of stem sections tends to occur, as also happens with unbalanced downward pressures due to an asymmetrical crown or a leaning stem. Millett [23] is among those who have given attention to the latter aspect. The orientation of anchoring roots and of large branches springing from the base of the crown, is associated with local eccentricity at the lower and at the top end respectively of a tree trunk. Eccentricity is most marked at the lower end of the stem where the bending moment is greatest, and, other things being equal, eccentricity increases with the height and size of the crown. Owing to natural causes such as windfall of adjacent trees, or to artificial causes such as the felling of adjacent trees, the degree of exposure to which a tree has been subject may change suddenly, and result in development of eccentricity of a formerly circular section or of increased eccentricity of a formerly eccentric one. It will be appreciated also that such changes of shape of sections vvill be more rapid, relatively near the lower end of the stem than further up.
(b) Eccentricity of section and 'subnormal' dimension
To effect economy of material, it is normal engineering practice to use a beam with a rectangular section orientated so that the longer axis is in the direction of the load to be supported. The sectional area of the beam is of course smaller than that of a square beam sufficiently strong to carry the load. Similarly an eccentric section of a tree stem, suitably oriented, does not require to be so large as a circular section of equal bending resistance. In Section 4 (d) instances were given of the occurrence, towards the lower end of tree stems, of 'subnormal' sections, i.e. sections smaller than to be expected from the continuation downwards of the curve of the main stem. The coincidence, under the conditions to be described, of 'subnormal' sections with eccentric sections, lends substantial support to the mechanical theory outlined herein.
(c) Examples
Reference has already been made to the point that 'subnormal' sections, typically portrayed as a concave curve inside the taper line defining the sectional area/height relation of the main stem, would probably not have been recognized but for the taper-line hypothesis. Naturally therefore the question of their physical significance has not hitherto arisen. Considerable research and collection of data was involved in seeking a rational explanation of the anomaly which these subnormal sections at first appeared to present to the original taper-line hypothesis. Although the association of eccentricity of stem with subnormal sections was a natural line of thought,

53 NEW THEORY
an obvious association was not always to be found and the typical concave curve was not always evident on relevant graphs.
Systematic investigation was hampered by circumstances and deductive reasoning was necessary to obtain the maximum relevant information within restricted time limits. Observations were first made on a species and situation thought likely to provide evidence on the point. This was a very dense crop of even-aged natural regeneration of Flooded Gum, growing in a small sheltered valley of high rainfall forest. The height growth of the species in such a locality is extremely fast, being 30 ft. or more in 2 years and up to 140 ft. in 23 years in the case of dominants at the time of observation. In youth the individual trees had enjoyed a high degree of shelter from the dense 'rain forest' undergrowth and from the topographical situation. Vigorous competition between individuals in height and in spread of crown resulted in considerable asymmetry of crown development which led of course to increased and uneven forces acting on the crowns. Qualitatively the connexion between eccentricity of section and asymmetry of crown was very marked. Graphs of representative samples, however, showed that inside the taper line of some large trees, no concave curve was evident, as it was for example on the specimen illustrated in Fig. 10 (b). Critical observation and reflection, however, suggested the likelihood in such cases that subsequent butt swell development had obscured the existence of concave curves within the taper lines of these trees at earlier ages.
This idea could not be tested with Flooded Gum as the species does not exhibit annual rings and stem analysis were therefore impracticable. Obviously any stem analysis (of a ringed species), of the sort envisaged would need to be of a large tree which showed no indication of subnormal sections from external measurements and many 'possible' samples might have to be stem-analysed, involving considerable time and labour for the precise measurements necessary. As this project could not be undertaken at the time a less satisfactory method had to be followed, namely an examination of the rather scanty available published stem-analysis data. By good fortune these included those of five large Himalayan Spruce trees of India [24].
Taper lines of one of these spruces are shown in Fig. 17. The first indication of a concave curve, with respect to the 2.0-year-old taper line, its extension in older lines and its disappearance as the curve was masked by buttswell development will be noted. Similar taper-line graphs were drawn for the other four trees but one only of these, a smaller tree, showed a concave curve, a very pronounced one, at the lower end of the stem. vVith this tree the size of the concave curve increased for a time as the tree got bigger and then commenced to decrease, although it was still pronounced at the time of felling.
These examples give striking confirmation of the possible occurrence of subnormal sections even when it is not apparent from external measurements. This point having been established, the next was to see if a relationship could be shown between eccentricity and subnormality of section.

40
54 NEW THEORY
Unfortunately the relevant data of the Himalayan spruce trees were not recorded in terms of maxima and minima, but in terms of mean radii, so the relationship could not be demonstrated with those trees.
It was, however, no longer necessary to pursue the investigation by examination of large trees and at a later date the easier task of testing smaller
Height(met)
120
PlCe3 Smi/hi"na BO/55. IIlin.alaljiJn sp"i'ce
SectIonal ar128 In Sf Ii:
F1G. 17. Sectional area/height curves illustrating the appearance and extension of a concavity at the lower end of the stem and its disappearance through the develop
ment of butt swell.
trees was found possible, from conditions of growth deduced as likely to provide evidence. An example was an 18-year-old dominant Alpine Ash (a species of the mountain forests which exhibits annual rings), from a patch of dense unthinned natural regeneration on a sheltered valley slope. The tree was felled and stem-analysis data collected. Graphed taper lines of this tree are shown in Fig. 18 in which are shown also numerical values (taken from Table 7 below), indicating the measure of eccentricity of the stems at different points. Since there should be evidence of butt swell, at least from the age of 10 years, when the tree was over 40 ft. high, sections of the lower stem shown on the graph for 10 years are obviously subnormal. At 15 and
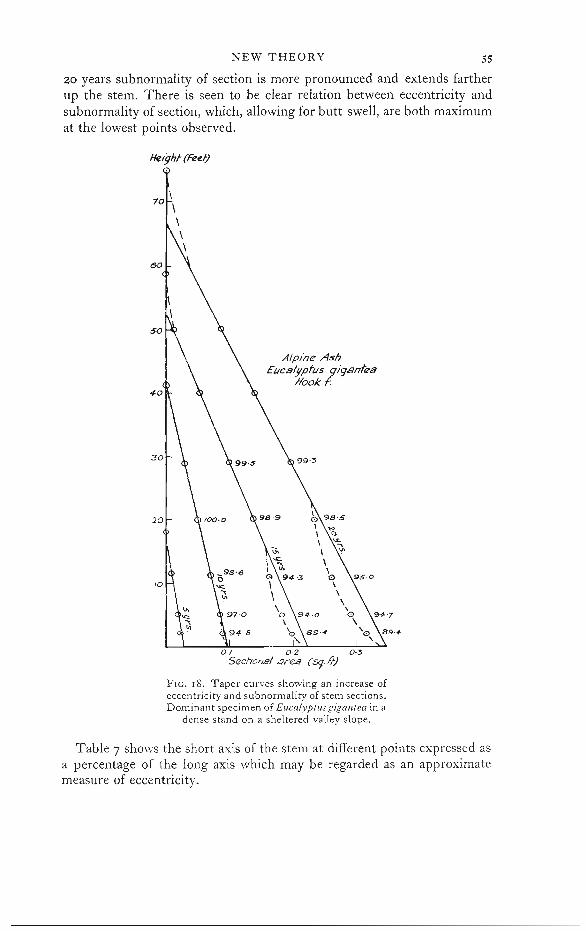
NEW THEORY 5S
20 years subnormality of section is more pronounced and extends farther up the stem. There is seen to be clear relation between eccentricity and subnormality of section, which, allowing for butt swell, are both maximum at the lowest points observed.
50
Alp/ne Ash Etlcalypftlsl/ganfqa
/look . 40
30
20
10
FIG. 18. Taper curves showing an increase of eccentricity and subnormality of stem sections. Dominant specimen of Eucalyptus gigantea in a
dense stand on a sheltered valley slope.
Table 7 sho\\'s the short axis of the stem at different points expressed as a percentage of the long axis which may be regarded as an approximate measure of eccentricity.

56 NEW THEORY
TABLE 7. Based on Diameter Measurements of an r8-year-old Alpine Ash
(Eucalyptus gigantea)
Eccentricity as measured by percentage relationship of sho,ot axis to long axis
Height above ground in feet At IO yrs. At IS yrs. At 20 yrs.
Zoo 94'8 89'4 89'4 5'0 97'0 94'0 94°7
II'5 98 '6 94'3 95'0 19'5 100'0 98 '9 98 'S 39'75 .. 99'S 99'3
Height (feu) Positive evidence having been established Alpine Ash of the association of eccentricity and sub
Eucalyptus 9/9Pntu normality of section under conditions of llook f:
40 growth deemed likely to give it, the next step was to see whether eccentricity and subnormality of section were present under conditions of growth where sharp changes from shelter to exposure did not occur. Accordingly a specimen was chosen, growing a little distance from the dense patch of natural regeneration, but on a relatively exposed position at the top of the slope. It was a symmetrically crowned, open-grown, I 4-year-old Alpine Ash sapling. The fact that the tree had been open grown from youth \vas apparent from its branchy crown which extended half of the
10 tree's total length, and from bumps lovver on the stem at places where occlusion had occurred over stubs of large branches. (N.B. most Eucalyptus species are self-pruning even
0'1 0·2 when open grown.) Taper lines of this tree areSectJ(mal Clres (~Ii:) shown in Fig. 19 and it will be noted that the
FlGo 19. Taper curves showing stem within the branchy Crown tapered rapidlythe absence of eccentricity and subnormality of stem sections. but that there is no indication of subnormal Symmetrically crowned speci sections at the lower end of the stem at any men of Eucaly/)!1IS gigontea open time in the life of the tree. grown from youth on a relatively
Similar confirmatory evidence that the deexposed site near the top of the slope. velopment of 'subnormal' sections is not a
specific character, but one occurring under particular conditions of growth may be seen from a comparison of Fig. 10 (b) showing a pronounced concave curve within the taper line of a large Flooded Gum growing under conditions already described, with Fig. 20 below'. This is based on data of a Flooded Gum from the same locality, but growing near the top of a ridge and not in a dense stand, and having a symmetrically

57
100
NEW THEORY
shaped crown. Note the absence of a concave curve on the stem profile. As with the open grown specimen of Alpine Ash, this Flooded Gum had obviously not grown under rapidly changing environmental conditions described which result in asymmetry of crown, eccentricity of sections, and subnormality of such.
He'9ht(feet)
Alpif7e Ash Eucalyptus 9'9antea
1Io0K f'. 80
60
20
0·2 0-4- 0·6 0'8 Seclionq/ /ireD (SlJ. f't)
FIC. 20. Taper curves showing the absence of subnormal stem sections. Symmetrically crowned specimen of Eucalyptus gmndis open grown on a relatively exposed site near the top
of a ridge.
Obviously there is wide scope for more detailed and precise work on the subject, but it is submitted that the arguments and evidence given in this section, particularly the fact that examination of deliberately selected trees showed that they had the characteristics which it had been deduced they should have, lend very strong support to the theory and hypotheses outlined.
14. THE CROWN OR 'Top' REGION OF THE CENTRAL STEM
In Section 6 (Part I) the general character of the central stem within the crown was discussed and mention made of physiological requirements and
58 NEW THEORY
theories. From a mechanical aspect each branch may be regarded as a lateral stem embedded in the central stem with the maximum bending moment at the point of attachment of the branch and stem. Mechanical as well as physiological reasons therefore combine to cause local thickening at what might be called the branch 'butt'. Local swellings are often very pronounced at the top of the main stem supporting a heavy spreading crown. The relation of smaller branches to their parent larger branches can be similarly regarded.
In regard to external forces on the stem in the crown it is shown in the appendix that these cannot be considered as being concentrated at a point, but rather as being uniformly distributed along the length, and that the application of the hypothesis outlined would lead to a cone as being the expected stem form in the crown and this, in the case of simple crown structures, is in fact found to be the case. None of the stem forms to be found in the crowns of forest trees would appear to be inconsistent with the general hypothesis.
15. THE BUTT REGION OF THE STEM
In Section 7 the general character of butt swell and buttressing was described and discussed. The actual shape of the stem in the butt region "vould appear to be the resultant of a complex of factors, such as the weight of the trunk and crown, effective depth and texture of the rooting medium, type of root development, and conditions of exposure. The variability of these factors and of the resulting shapes of the stem in the butt region would seem, even after extensive investigation, to preclude the submission of a formula to define the stem profile in the butt region which would be of scientific or practical use.
On a qualitative basis, however, it is explained in the appendix:
(a) Towards the base of the stem the weight of the trunk and crown above will represent a force additional to lateral pressures, so that the section near the base would be larger than a continuation of the main stem would lead one to suppose. This would account in some measure for butt swell.
(b) The 'weight and swing of a large crown will contribute appreciably to the bending moment, and this additional bending moment is greatest at the base, thus partly accounting for butt swell.
(c) 'When, owing to shallowness, softness, or any other cause, the ground provides too weak a hold, development of buttresses, giving a base covering a greater area for a given volume, would offer better support and anchorage.
Thus at least it can be said that the various stem forms of the butt region are not inconsistent with the general hypothesis.

SUMMARY OF PARTS I AND II
BACKGROUND
I. Because the subject of stem form has been confused by the indiscriminate use of the terms 'form' and 'taper', these terms are separately defined for the purpose of this paper to mean:
'form' the characteristic shape of a solid as determined by the power index of d in the equation for the diameter/height curve of such a solid.
'taper' the rate of narrowing in diameter in relation to increase in height of a solid of a given form, as determined by k in the equation for the diameter/height curve of such a solid.
e.g. for a paraboloid h = kmd 2
for a cone h = hnd.
2. Visual impressions and inferences from numerical data, giving rise to the idea of 'conical' stems on the one hand and 'cylindrical' stems on the other, are discussed.
3. The 'main stem' is defined as the central length of the stem, which can be described by a single simple curve, differing from that of the 'top' or functional crown stem curve and that of the butt.
4. The invalidity is shown of a frequently quoted 'test' which purports to demonstrate that the main stem of a tree does not conform to the dimensions of a truncated paraboloid.
S. It is shown that form quotients are not a reliable indication of stem form for a number of reasons including:
(i) diameter/height measurements or curves from which form quotients are derived do not take account of 'sub-normal' diameters in the region of 4i ft. above ground-level;
(ii) these measurements or curves do not take account of the effect on the size of d5 relative to that of Dn consequent on the great diversity in form and taper of the 'top' relative to that of the main stem.
6. As a corollary of S (ii) above, stem curves based on formulae which contain, explicitly or implicitly, a term for tree height, deviate systematically from observed values along the main stem.
7. The form-point method of estimating the form of forest-tree stems, by inference based on Metzger's girder theory, is illogical because Metzger supposed that all tree stems had the form of a cubical paraboloid and that form point was an indication of taper of such form.
8. Because of the uncertainties associated with total height in the determination of stem form, and because of itself it has little volumetric significance, a method of determination of the form and taper has been developed which does not rely on total height. This has been termed the 'Taper-line'
60 SUMMARY OF PARTS I AND II
method and it relies on a linear relation which has been found to exist between sectional areas (corresponding to observed diameters) and the height above ground of such observations, along the main stem of forest trees.
9. Evidence from a variety of species, sites, localities, and conditions of treatment demonstrates the universal character of the sectional area/height, or d2/height relation referred to.
JO. Evidence is presented which shows that while in many cases a graph of d3/height represents a fair fit to observed values along the main stem, a graph of d2/height represents a better fit for a greater length and this implies that the form of the main stem resembles that of a paraboloid rather than a cubical paraboloid.
NEW THEORY
1. In so far as the new theory submitted is based on the mechanical requirements of a tree stem, consistent of course with the tree's physiological requirements, it is similar to that of Metzger, but there are important differences between the two, viz.
(i) Metzger
Metzger supposes that the diameter is proportional to the stress on it which leads to a cubical paraboloid as the form of a forest-tree stem. This deduction, however, supposes that a tree is embedded in material sufficiently strong to ensure that the attachment at the base would hold against forces greater than those neces'sary to break the stem. As a tree is embedded in weaker materiallVIetzger's stem is unnecessarily strong. l\1etzger's theory does not comprehend forces other than lateral pressures acting on the crown of a tree and so does not account for all variations of taper met with, particularly those which are found in the case of trees with heavily branched large crowns.
(ii) New theory
This supposes that the area of the section is proportional to the stress on it, which leads to a paraboloid as the form of forest-tree stems. Since, for a given base and height, a cubical paraboloid contains 20 per cent. more volume, it represents a less efficient structural member than a paraboloid. The theory takes account of forces which influence stem taper other than lateral ones acting on the crown of a tree, and so embraces variations of taper which are anomalous to Metzger's hypothesis.
2. The new theory, which is consistent with observed fact, was formulated by lVIr. G. Odgers as developed by him in the Appendix. It may be briefly stated thus:
'The mechanical stress averaged over the whole section underbark is constant along the length of the main stern, and if this is circular, the area of the section is proportional to the stress on it.'

SUMMARY OF PARTS I AND II 61
3. Formulae are deduced to account for stem taper:
(i) When horizontal wind-pressures are dominant. (ii) When the weight and downward thrust of the crown introduced
forces additional to lateral ones.
4. Reasons are advanced to account for the vertex of the main stem curve corresponding, under some conditions, with a height greater than tree height.
5. The inter-relation of crown pressures, preferential in direction, with eccentric sections and the sub-normality of such sections is described and specific examples are given.
6. Specific examples, which accord with the theory, are given of:
(i) variation of the taper of different tree stems at a given time, according to conditions of growth;
(ii) variation of the taper of a given tree with time, according to conditions of growth.
7. The form of the stem in the 'top' or functional crown, and at the 'butt' is discussed and shown, on a qualitative level, to be consistent with the theory.

PART III. APPLICATIONS OF THEORY
1. INTRODUCTION
THE importance of the volume determination of individual trees is that it is the starting-point of a number of steps of procedure for the volume estimation of forest crops and so is basic to growlh and yield studies as well as being an essential requisite in the solution of numerous problems which involve the volume estimation of trees and crops. This statement, it will be understood, has reference only to measurements of volume of the precision usually required in the case of 'sample trees', and some limitations imposed on the accuracy of stem-volume determination should first be recognized.
No method of stem-volume determination, except perhaps the xylometric one, can be considered to lead to accurate results. As this method is impractical for general use in forestry practice others are followed which aim at giving estimates sufficiently reliable for the particular purpose required. All of these methods are based on diameter (or girth) measurements taken at different points along the stem. The technique of volume computation of the whole or of separate lengths of a stem, using Huber's, Smalian's, or Simpson's formulae, or the form class method, was detailed in an earlier paper and being generally well known, need not be repeated here.
It is, however, desirable to refer again to the invalidity of the assumption that the shorter the distance between the points of measurements the more reliable the estimate will be. This assumption infers that a tree-stem underbark is a smooth-surfaced solid as are those to which the above formulae apply. Actually on the underbark surface of a stem there are often a number of minor protuberances or other surface irregularities in addition to the nodal swellings in the vicinity of the points of attachment of side branches, living or dead. The effect of these nodal swellings often extends farther from the nodes than is supposed. Some of these surface irregularities appear in situ to be of little account but their possible significance is clearly seen if a diameter/height or sectional area/height graph is constructed, based on closely spaced measurements along the stem. Measurements which, when plotted, show substantial deviations from the trend of the main stem curve have, for the purposes of this paper, been termed 'unrepresentative' because they are not indicative of the essential solid form of the stem.
These unrepresentative dimensions are biological in origin and are additional to others which arise from mechanical inaccuracies of measurement such as:
(a) Mistakes in overbark measurement. (b) Mistakes in measurement of bark thickness. (c) Diameter dimensions which are correct in themselves, but have been
taken at heights on the stem different from those for which they are recorded.
(d) Incorrect calling or recording of any of the above measurements.

APPLICATIONS OF THEORY
It might be thought that, with clear instructions and care in carrying them out, all types of unrepresentative dimensions could be avoided. Years of experience, however, have convinced the writer that the liability to record even grossly unrepresentative dimensions is present in mensuration parties regardless of their standard of measurement performance. So much so that the writer's first real interest in the subject of stem form arose from attempts to devise objective techniques to minimize the liability of recording unrepresentative dimensions. The development of the 'taper line' hypothesis was the final outcome, the acceptance of which leads to a fresh approach to many forestry problems involving measurement, and some specific examples of this are given below.
2. ADVANTAGES OF THE TAPER-LINE METHOD FOR ACCURATE
RECORDING OF STEM DIMENSIONS
Features of the 'taper-line' method are that:
(a) the points along the stem at which measurements are made are determined in terms of height above ground, so that they are not dependent on calculations involving total height;
(b) the points of measurement along the stem are not pre-determined but are made at points judged least likely to be unrepresentative;
(c) measurement of the whole stem is included so that the series as a whole affords a check on individual dimensions;
(d) the number of measurements can be restricted to that necessary to define the stem profile as closely as required for the particular purpose 111 view;
(e) on conveniently scaled graph paper, sectional areas corresponding to underbark diameters (or girths) are plotted against the heights at which observations are made, and a taper line drawn through these along the main stem. (N.B. Plotting is carried out as measurement proceeds.)
Ordinarily three or four measurements, well spaced along the stem, as distant as possible from nodal swellings or other visual irregularities, are sufficient to establish the path of the taper line, and the plotted position on the vertical axis corresponding to the measured total height will at once indicate the general trend of the 'top' curve, which by measurements along it can be defined as closely as desired. At the bottom end of the graph the butt-swell curve can be similarly defined. Good definition here is from the aspect of the utilizable timber represented more important than for the 'top' curve.
If, as is often the case, it is difficult to obtain a good representative dimension directly at 4t ft. above ground, this should be read from an

APPLICATIONS OF THEORY
overbark butt-curve, for it is as essential that the dimension of the allimportant reference d.b.h. overbark is representative, as it is that the volume to which it relates represents a reliable estimate. This is a point which is frequently overlooked.
The actual procedure is simpler than might be inferred from the above description which takes account of contingencies not always found. It is admittedly subjective in conception but it works objectively. The separate mechanical measurements all hold interest for each helps in a creative effort of graphic representation and the extra efficiency so stimulated is an added advantage of the method.
It is obviously impossible for incongruous dimensions to be overlooked. Any noted can of course be checked at the time of measurement.
3. DETECTION OF FAULTY DIMENSIONS RECORDED BY
OTHER METHODS
Comparison of current and past measurements is required for many purposes such as increment determination, effect of different treatments, etc. Many foresters will have been perturbed at the anomalies such comparisons sometimes disclose.
The taper-line method ensures that incongruous dimensions can be detected by the measuring party at the time of measurement, and also provides a master check which can be used in the office by those responsible for working up data. Moreover, records of past measurements can be readily checked by graphing data of such measurements. Only in the case of dimensions towards the lower end of the stem may doubt arise as to whether a past measurement is 'unrepresentative', or 'subnormal' as defined in this paper. Naturally if a tree, past measurement of which is in doubt, is still available for measurement the question can be quickly resolved and, if necessary, closely spaced measurements, which are unusual with conventional methods, can be made in the vicinity of the doubtful points on the stem.
The most convincing and immediate evidence of unrepresentative dimensions occur when successive measurements are available for the same stem, and when at a given height above ground, the dimension recorded at one time of measurement is quite incongruous with that at another. A few examples of such cases have been given in Fig. I I. Among examples, all· based on published data, given in an earlier paper was one of successive measurements of a tree of particular interest in this connexion, because it was used to illustrate the effect of a certain type of felling on the form of the remaining stems, using form quotients as criteria. Form quotients are not, as has been shown, reliable criteria of form but the case is cited as an exexample of the way in which incorrect inferences can be drawn when comparisons are vitiated by unrepresentative dimensions.

65 APPLICATIONS OF THEORY
4. A QUICK AND RELIABLE METHOD OF VOLUME COMPUTATION
(a) Parabolic volume
As was shown in Section I of Part I and illustrated in Fig. I, parabolic volume, vp , is computed from the unit values corresponding to half the height multiplied by the base of the triangle formed by joining the taper line to the vertical axis at parabolic height, hp , and the horizontal axis at parabolic base, sp, according to the formula:
vp = !hpsp.
The simplicity and quickness of the computation is self evident. The practical value of this computation naturally depends upon how
closely parabolic volume approximates to a recognized volume unit, such as total stem volume, or to merchantable volume, under a given set of circumstances, assuming of course equal reliability of recorded dimensions in each case. Examination of the various sectional area/height graphs presented in this paper, which are based on specific data from a number of representative trees, will show that in the case of trees which retain an undivided stem to total height, conformity of parabolic volume with total stem volume is very close indeed. When merchantable volume in such cases embraces the stem volume to a small-end diameter of say 3 in., parabolic volume usually represents a close approximation to it.
The case is different with large-crowned trees as will be seen from the following sub-sections.
In view of the small differences of volume involved and the additional measurements and computations necessary for what are after all approximate estimates only, it is suggested that the easier computed parabolic volume might be regarded as a good enough estimate for either total stem volume or merchantable volume to 3 in. in the cases first described.
(b) Total stem volume
Total stem volume can be obtained from the sectional area/height graph by adding to or subtracting from parabolic volume, the volume corresponding to the areas embraced by the whole tree profile which are outside or inside the triangular figure respectively. This can be done in several ways, e.g.:
(i) by direct calculation from a count of the squares of the graph paper which the portions in question embrace;
(ii) by planimeter readings; (iii) by calculating from the formula half vertical height multiplied by
base, of triangles enclosing similar areas to those concerned.
The last method is the quickest and, considering that the volumes involved are often small and otherwise unimportant, will give a sufficiently good estimate. B~ E

66 APPLICATIONS OF THEORY
(c) Merchantable volume
First it should be noted that the proportion of total stem volume which is regarded as merchantable varies within wide limits. Thus at one extreme, merchantable volume may be embraced by stem volume from an inch or so above ground to a small-end diameter limit of 3 in. On the other hand, in natural forests in many parts of the world, merchantable volume excludes stem volume to a 'felling height' of several feet above the ground and extends only to a height just below the lowest part of the crown, and this may be little more than half the total height, the diameter at merchantable height being 18 in. or more.
For any given type of tree utilization standards also vary from place to place, and for any given place from time to time. In this regard the taperline method of measurement has the advantage that from the sectional height graph, merchantable volume can be obtained to any standard of utilization, whereas other methods require different or additional measurements to supplement past measurements if utilization standards change.
The simplest method of computing merchantable volume will vary according to the particular case but can be readily appreciated from an inspection of the graph and taking count of felling height and the dimension of the small end of merchantable length. If, for example, felling height is, for all practical purposes, ground level then merchantable volume may be obtained from sectional area at half merchantable height multiplied by the mcrchantable length. To this must be added the volumc, calculated by any of the methods referred to under (b) represented by areas outside the taper line and below merchantable height. Volume corresponding to areas inside the taper line below merchantable height must of course be deducted. On the other hand, it may be considered simpler, when felling height is at some distance from the ground, to compute volume from the mean of the sectional areas at the bottom and top of merchantable length multiplied by merchantable length, with any necessary additions or subtractions. In some cases, if total stem volume has already been computed, the volume above merchantable height can readily be computed and deducted from stem volume to give merchantable volume.
Here again a description covering various contingencies may make the method of calculating merchantable volume appear less simple than it actually is.t
t An alternative and simple method which may be worth adopting in some cases is illustrated in Fig. 21. Diagram 21 (a) is based on data of a large crowned specimen of Blackbutt (Eucalyptus pilularis Sm.), 125 ft. tall, merchantable height 75 ft., where the diameter was 16·6 in. and felling height 5 ft. Diagram 21 (b) is based on data of a typical specimen of Pinus mdiato. D. Don. 103 ft. tall, merchantable height (to 4t in. diameter), 82 ft. and felling height 1 ft.
Reference to 2 I (a) will show that volume may be calculated from /':, ABC less /':, ADE, plus the butt-swell wood above felling height, viz.:
Volume = (.!~5X2'9)-(lfXl'5)+Z2DXO'23 = 210'25-56'25+2'3 = 156'3 cub. ft. Similarly for 21 (b):
Volume = (.!llXo·78)-elxo'll)+.!z!!xo·06 = 36'27-0'66+0'30 = 35'91 cub. ft.

APPLICATIONS OF THEORY
(d) Estimation of volume by 'assortments'
For a variety of reasons it may be desirable to know what particular sizes of timber, in terms of length and mid or end diameters, can be obtained from given forest crops, or the quantities of timber of sizes most suitably disposed of for a particular purpose, such as pulpwood.
HeI9ht(jeet) A (A) (B)150
Blackbult Monterey Rae EI/ca!f;ptvs p,lulal'/S 5nJ Pinus rao'tat.8
£J.Oon. HeighrrfeefJ
100 _ ,,,, ,,, \
I \ \ ,,,
~ £ 16·6' ~o 75 - - - - :]- - - dtameter
~ ':t:: ~ ~
50
~ -<:> ~ t:
~ 25- t
~
Ftd/iny. ,8 1-r,.-T"TTT7-rr~'77777TTT;"77"7'7TT,....,)i7-To<"'"- height c"
O·lJ;-0 2·0 0·4
Sectional ,tirea (51uare feet) Sect/om.1 area (.s~=re ~eI)
FIG. 21. Sectional area/height curves for calculation of merchantable volume.
Such information can readily be obtained from height sectional area graphs, as will be seen from the simple diagram, Fig. 22. From this figure it is obvious that volume to any given diameter limit and therefore, by subtraction, the volume of any portion of the stem can be obtained on the basis of truncations of the parabolic triangle, to which volumes can be added or subtracted volumes corresponding to areas outside or inside respectively the parabolic triangle, as appropriate, if such a degree of accuracy is required.
The computed volumes of the different portions of the stem are shown on p. 68:

68 APPLICATIONS OF THEORY
Log 110. Mean sectional area (square ft.) Length (ft.) Volume (cub. ft.)
I t (0'79+ 0 '62) X 20 14'1 2 ~. (0'62 +0"48) x 18 9'9 3 -~. (0'48 +0'335) X 18 7'33 4 J (0'35+ 0 '24) X 12 3'54 Cordwood J (0'24+0-049) X 24 3"46
Total .. . . 38 '33I
100
80
60
20
Is! log
ol=<==~=m=z:p.===2;Z2==:z2l~2>. 2 .+- 6 ,8
Sectional arel1 (59,Nlre feet)
FIC. 22. Sectional area/height diagram illustrating the basis of calculation of volume by assortments and value.
(e) Estimate of the value of the stem
Often, particularly in the case of large trees, and especially if the timber has an unusually high intrinsic value, different stumpage rates apply to different portions of the stem. The unit price generally increases as the mean diameter size of the log increases. Thus the bottom logs of stems are usually the most valuable and their value may be enhanced if, as a result of early pruning or other treatment, they produce a large proportion of clear timber or are suitable for ply\vood logs, etc.
From a sectional area/height graph of a specific tree or from a graph

APPLICATIONS OF THEORY
representing the average dimensions of a particular class of tree, the most suitable division in terms of lengths and mean diameters, can be determined to yield the maximum value for the whole stem.
As an example of the ease of the method, the mean sectional areas of the different logs shown in Fig. 22 have been converted to diameters, and different hypothetical stumpage rates applied to the various logs as set out below:
Mean diameter Volume Stumpage Value of Log no. (inches) I (cub. ft.) per cub. ft.
s. d.
log (approx.)
s. d. I 11'0 14'1 2 0 28 0 2 10'0 9'9 I 6 IS 0
3 8'5 7'33 I 0 7 + 4 7'0 3'54 9 2 8
lVlln. Dia. Cordwood 3'0 3'46 4 I 2
Total value of stem .. . . . . ! 54 2 -
5. MEASUREMENT OF STANDING TREES
(a) The problem,
Sample plots, permanent or otherwise, are ordinarily established to study the development of forest crops with age, for different species, sites, and treatments. The conditions embraced by these variables are very great indeed. Determination of the volume development of the crops rests basically on the measurement of sample trees. Even if only a few sample trees are measured for volume in each plot, the aggregate number required from numerous plots is very large. Apart from other considerations the number of trees that can be felled from a plot, or from its surround, is limited as otherwise experimental conditions will be upset. If therefore felled trees are used as samples they ordinarily consist of a few 'mean' trees or trees taken out in thinning operations.
Volume determination of standing trees has the very great advantage that a good representative sample of the crop can be used without affecting the experimental conditions. A further advantage is that volume can be obtained by diameter classes, information which is not available if plot volume is derived from calculations based on the volume of sample trees conforming generally to the mean tree of the plot. The limiting factors to the acknowledged optimum practice for determining the volume of standing sample trees are the time, expense, and mechanical difficulties involved.
Consequently a great deal of attention has been given to the possibility of developing techniques, instruments, and appliances for measuring standing sample trees. No method, other than direct measurement, which involves climbing of the tree to be measured, has proved reliable, and, considering the numerous opportunities there are for making unrepresentative measurements even when fallen trees are suitably disposed on the ground,

APPLICATIONS OF THEORY7°
this is not surprising. Direct measurement of the lower half of the stem and an estimate of the remainder has been practised, and was described in an earlier paper [1]. Briefly, this involves climbing to rather over half height to measure d5, determining the form quotient, and calculating diameter dimensions of the upper portion of the stem for which direct measurements are not available. For reasons set out in Part I accurate results from this method are never likely, but it is possible that errors may not be serious if the form quotient is about the medium of the range and if, of course, the form quotient, which is a very sensitive ratio, is derived from representative dimensions at d5 and D,p which very often is not the case. Consequently the method must be regarded as unreliable and it can be grossly so.
(b) The taper-line method
Compared with direct measurement which is the only other method which theoretically (though not actually) could be claimed to give equally reliable results, the taper-line method of measuring standing trees has the advantages that it is safer, less laborious, quicker, and cheaper.
Basically, the taper-line method of measuring standing trees is similar to that for fallen trees, except that the lower portion only of the stem is measured directly and, of course, the operation is more troublesome. It is very desirable for mensuration parties to have some experience of the method with fallen trees before adopting it for standing ones, so that practice is gained in the choice of points on the stem where representative dimensions are to be expected; familiarity \vith general character and extent of 'top' and 'butt' curves is obtained, and the general relation between parabolic height and total height with a range of crown structures and/or of stem forking is appreciated. Practice on fallen stem in obtaining bark thickness is especially necessary, for it is easy to press the bark gauge into the outer layers of the sapwood or not to press the gauge completely through the bark, and so to derive too small or too large underbark measurements respectively. With such experience the overall pattern of stem dimensions for different tree types can be visualized beforehand, and measurement consists not of a number of disconnected operations but of a single purposeful one.
The simple equipment and procedure which the writer has found convenient is set out below. Neither has been formally standardized and improvements in technique could doubtless be devised. Metric units may of course be substituted if desired. The description here is concerned only with essential details.
(i) Equipment
Diameter tape; bark gauge; cloth tape (a 66 ft. tape is ordinarily long enough); tables of areas (in square feet) for diameters of the range likely to be met with, in terms of diameters to the second place of decimals (the accuracy to which a diameter tape can be read); graph paper, conveniently

7 1 APPLICATIONS OF THEORY
sized, e.g. foolscap size, preferably scaled in inches and tenths to facilitate plotting; a light board, for example, stiff cardboard or thin sheet of plywood, on which to clip graph paper if loose sheets are used and, in this case, to give a firm surface for graph drawing; note-book; pencil; rubber; suitable climbing gear, e.g. light ladders for the branchless bole.
(ii) Operation
A minimum of two men, viz. a climber (or measurer) and a booker, who can alternate duties, is required for the measurement of each tree. A reliable estimate of total height is first obtained, using the most convenient instrument available. The booker remains on the ground, controls the outgoing tape, books the heights of the points on the stem selected by the climber, records the ov'erbark diameters and bark thicknesses as called to him by the measurer, derives from these the underbark diameters, converts diameters to sectional areas and plots their values against the appropriate scaled heights on the graph paper. As the taper line is based on underbark sectional areas along the main stem, the values of these should be plotted as soon as possible. The taper line can then be established with the minimum of time and unrepresentative dimensions detected and measurement or other checks made before the measurer descends from the tree. By defining a reliable taper line quickly from a few measurements, the climber's exertions are reduced to a minimum. Such additional measurements as are necessary to obtain representative dimensions for d.b.h. overbark and to define the lower end of the butt-swell curve, can be carried out from the ground by the booker.
The climber takes the forward end of the cloth tape, a diameter tape, and a bark gauge. He is responsible for making all measurements along the stem at points which are out of reach of the booker. As he ascends the tree, he selects a good point for measurement bet,veen say 8 ft. and 12 ft. from the ground and calls to the booker the height, the overbark diameter, and the bark thickness measurements made at that point. The booker calls back the dimensions. Successive well-spaced points along the stem to about half total height are similarly selected and measured. Because the booker plots his graph as soon as each underbark dimension has been derived he can call attention to any seemingly anomalous dimension for check, and if necessary indicate the approximate height at which he considers a confirmatory measurement is desirable.
Active and intelligent workers can, with practice, carry out the necessary measurements on a standing tree in no more time, and often less than it requires to fell and measure a sample tree. The more experienced and skilled the climber and booker, the fewer measurements required and the lower the height to which climbing is necessary to obtain reliable dimensions for any given tree.
An example of the results obtained from the measurement of a standing tree was given in an earlier publication [2], and is reproduced here in
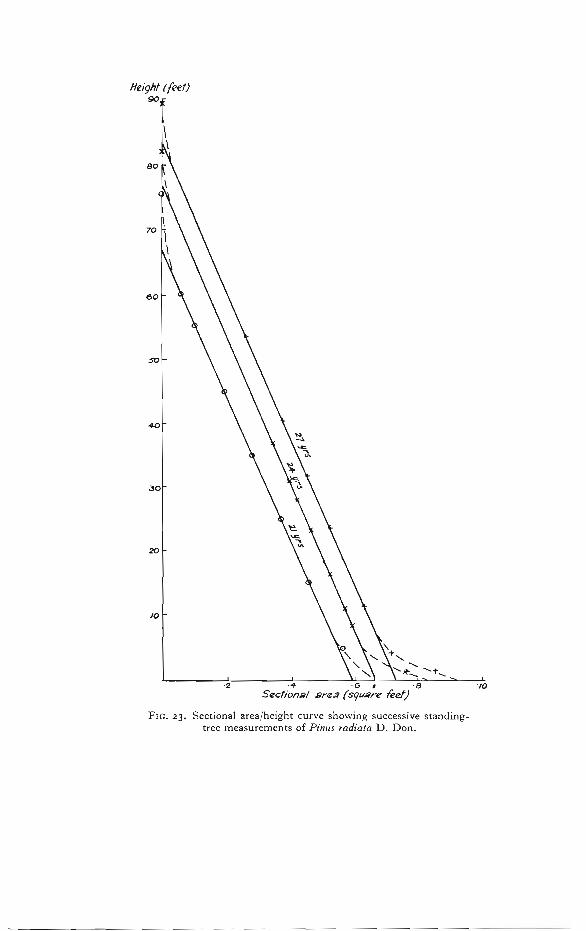
Height ((eel) 90
\ \
80
70
60
.30
20
10
·2 .-4 '0 ~ ·8 '10 Seerional 8re3 (s9uJilre feet)
FIG. 23. Sectional arealheight curve showing successive standingtree measurements of Pinus radiata D. Don.

73 APPLICATIONS OF THEORY
Fig. 23. This is based on data of successive measurements of a Pinus radiata tree in a plot at Mt. Stromlo plantation, in the Australian Capital Territory. The first measurement, made on 24 September 1937, when the tree was 21 years old, followed the standard practice, i.e. measurements were made at 10 ft. intervals along the stem to merchantable height (4 in. diameter underbark in this case). This involved climbing to a height of 59 ft. above the ground, i.e. to about 78 per cent. of total height, and seven measurements were made. (N.B. The taper line from these data was not graphed in the field, but in the office, about three years after the field measurements were made.) The second measurement was made on 22 August 194o-tree age 24 years-at the time when the taper-line hypothesis was being developed. The highest point of measurement at this date was at 35'75 ft., i.e. at about 43 per cent. of the total height at that date. The third measurement was made on IS May 1943-tree age 27 years-the highest point of measurement was higher up the stem, to afford a check on the first two taper lines.
A very large number of similar examples for plantation-grown conifers could be given.
6. SYNTHESIS OF STEM DEVELOPMENT
Whenever periodic measurements for volume of standing trees are desired, the advantages of plotting successive taper lines on the same sheet of graph paper, as shown in Fig. II, is manifest; for not only are all measurements interchecking, but a clear and vivid picture of stem development is obtained. To the extent that the taper line holds to a height, which for all practical purposes embraces the usable volume, the resulting diagram will be a graphic representation of those elements of growth customarily obtained from a stem analysis; with the additional advantage that they can be related to successive d.b.h. overbark measurements.
7. ANALYSIS OF STEM DEVELOPMENT
The carrying out of stem analyses is regarded by some rather as an academic exercise in mensuration than as an undertaking of direct practical value. Actually, if reliably constructed, they are of great potential value in connexion with the solution of a variety of problems beyond the scope of this paper.
On the other hand, the standards of precision of measurement ordinarily laid down in instructions for making them involves time-consuming and laborious effort, with, as those with experience of the difficulties and of the anomalous interior diameter/height curves often obtained will agree, frequently very unsatisfactory results.
Construction of stem analyses, following the taper-line method for the measurement of felled sample trees, is quicker, more reliable, and more purposeful than by conventional methods.

74 APPLICATIONS OF THEORY
Conventional methods require that a tree felled for stem analysis is cross cut at even intervals, that is at predetermined points, along the stem. The taper-line method requires sufficient representative dimensions to define reliably the stem profile at given ages. The volume at that age is then readily obtained as explained for an individual sample tree. It should be emphasized, however, that while comparatively few well-spaced measurements are necessary to define the exterior underbark profile of a tree, additional intermediate cross cuts may be necessary for reliable determination of the shorter stem profiles toward the centre of the tree. It should be noted also that while total height at different ages may be obtained from the position of whorls, or in the case of multinodal specimens, by other indications (e.g. vide Jacobs's [2S] technique for P. radiata), age/height data below the living crown may have to be derived from ring counts, in the conventional way.
The various stem-analysis graphs presented in this paper show the realistic picture which successive taper lines give of stem development and particularly of variation of taper with age. Fig. IS(b) is an example of a stem-analysis graph constructed by the taper-line method out of the large number that have been so constructed.

APPENDIX
By G. ODGERS, M.A. (Melb.)
THEORY OF STEM FORM
I N order to establish the stem form on a mechanical basis it is necessary to be able to deduce the form under different circumstances from a few plausible assumptions. The usual supposition to date is that the stress in the extreme fibre is constant along the stem, which though natural enough, is not necessary in any way. To obtain some idea of this and associated matters, consider the stem as a beam fixed at one end and acted on by a set of forces which may in general be assumed to have a horizontal resultant acting through a certain point near the other end.
Suppose this point is distance H from the base and that the magnitude of the resultant force is F. Consider a section distance hI from ground, and call r the radius of this section. Now if F has no preferential direction, i.e. is likely to be in any direction, hence the sections are circular, the stress at a point distance y from the neutral axis of the section is then EyjR = P say, where E is the Young's modulus for the material and R is the radius of curvature at the point considered.
Then the resisting moment for the whole section IS:
~7T
4= 4~r4 f sin2cP COS2cP dcP = TTE rR 4R
o and this must equal the external bending moment, so that:
FIC. A.(I)
where S is the area of the section concerned. Assumptions of various sorts may be made at this stage. Metzger supposed that
Pmax = ErjR was constant along the stem, which shows immediately that H-h l
is proportional to r3 as the stem form. However, this assumption, though sufficient, is hardly necessary and a less conservative one ,vould do. If the area of any section is assumed proportional to the external bending moment, or in other words the resisting moment per unit area is constant along the stem, the equation (I) gives r2 proportional to R, and thence H -hI is proportional to r2 as the stem form. In this case the stress in the extreme fibre will be proportional to I jr and thus increases upwards, so that the fibre would collapse near the top, if at all -a likely circumstance. In practice, however, if any force sufficient to break the

APPENDIX
stem were encountered, in all likelihood the tree would have fallen from failure of the ground support before this could take place.
The total pressure on the side of any section in compression will be: 'r
J JEy 2Er3
p dS = - 2,J(r2_ y 2) dy = -R 3R
o proportional to r, because r2 is proportional to R.
Now toward the base of the stem a further force will become important, that of the weight of the tree, and since our assumption is equivalent to supposing that the radius of section is proportional to the pressure, to be consistent it would have to be supposed that the radius near the base would be larger than a continuation of the stem form would lead one to suppose. This would thus account in some measure for the 'butt-swell'. In the extreme case when the ground can only put forth a weak hold (for any reason at all, such as either softness or shallowness), such a modification may not be efficient. Instead of a butt-swell, the tree would develop buttresses which would give a base covering a much greater area for a given volume and offering better support to the weight. However, a proper investigation of this question would involve an examination of possible root structures and allied matters and will not be attempted here.
Furthermore, the weight of the crown, if large, may contribute appreciably to the bending moment about any section, the more so the larger the crown. If W is the weight of the crown, then according to our hypothesis we should have
I
F(H-hl )+ WZ = Ks (where K is the constant of proportionality, s = the area of the section at height hI' and Z is related to the amplitude of the swing of the crown).
Now this quantity varies with the section considered, as is evident from the diag-ram, in such a way that the
I additional bending moment is greatest for the base, and hence the butt swell is partly accounted for by this process.
Consider now the effect on parabolic lI'1"wz height of an increased bending moment.
F If this is negligible we have
F(H-hi) = Ks,
so that when s = 0, hi = parabolic height = hp = H, the 'focal point' of forces on the crown. If, however, the increased bending moment is considerable as indicated above, when s = 0,
FIG. B. I.e.
parabolic height = h = H p+WZ/F. Thus hp is greater than H by a quantity of amount WZ/F, and this may be sufficiently large to make parabolic height appreciably greater than the total height. At any rate parabolic height should increase the larger the crown, other things being the same. There is thus no a priori reason for parabolic height invariably to

77 APPENDIX
be less than total height. If W is abnormally large the parabolic height then becomes very much greater than the total height so that for sufficiently large values of W, the taper of the main stem may be negligible over a short distance at least.
Of course Metzger's hypothesis if similarly considered would lead to the same qualitative result, the difference between the two being obviously quantitative. For instance consider the crown. Here the external forces cannot be considered as concentrated at a point but rather as being uniformly distributed along the length. The external bending moment about the section distance x from the top will be then: x
f Fydy o�
where F (the force per unit length at a point) is constant. This t� should be equal or proportional to the sectional area, hence x2 x� is proportional to r2, or x is proportional to r is the stem form,� i.e. a cone, which is a fact observed. In this case an application 1of Metzger's hypothesis would lead to the result x is proportional to r~ giving a greater volume, other things being equal.
For the case of the stem it is easy to see that a tree obeying Metzger would be considerably bulkier for a given base and height than one for which this other hypothesis held true. For let a common height be H, and the common base be S. Then the stem forms are:
r = aM, r = bht , respectively; and aHt = bHt (since the bases are equal).
The volumes are H H�
r7Td2Mdh, J7Tb2hdh, respectively� o o�
FIG. C.= '1 7Ta2H! 5 '
'whence the ratio is
an excess of 20 per cent. The most convincing comparison of these two alternatives, and in general
between any possible stem forms, would be to show that there exists one which is stable and of minimum volume, but since some factor of safety must be allowed, this test would not be a sharp one. Failing sufficiently precise data to show the adequacy of the parabolic stem form with respect to mechanical requirements, one would have to be content with the observation that the ground support fails first. In this regard though we make some rough estimates to serve the purpose. Considering two trees with the same base and height one of which obeys Metzger's hypothesis, etc.
Then for the Metzger stem R = ar1
and for the other R = br2•
If r1 be the radius of the base, then a = br1•
Hence the ratio of 'Metzger' stress in the extreme fibre to the stress in the other stem is

APPENDIX
and from above this = (hjH)', where h is the distance of the point from the top at which section has radius T. Now at most Hjh is approximately 4. Hence (Hjh)i is approximately 2, meaning that the greatest stress is this much more than that of the base, a quantity well within the factor of safety.
Other characteristics of stems that can be explained by similar arguments are now discussed, the results being in these cases only qualitative, so no new division can be drawn between the two hypotheses. For a tree for which the wind forces are distributed preferentially in a certain direction, the shape of a cross section would become elliptical with the major axis in the direction of the wind. Also if the circumstances under which a tree grows were to change suddenly, so that from being sheltered it became unprotected, a sudden modification of the stem would be expected; the stem changing shape near the base more rapidly, relatively, than the sections farther up. In such a case it is very likely that the forces will be eccentrically distributed as discussed immediately above; the protection not being removed in all directions. Hence the change will be increased ellipticity, or even development of eccentricity, of a formerly circular section. The area of the section may of course (since this structure is intrinsically more efficient and hence requires less area), not increase as rapidly as that of those other sections with respect to which there is increase in eccentricity.
Other circumstances than the one above considered may lead to a parabolic shape of the stem. For instance in the extreme case, where the stem may be regarded as a large crown, the forces may still be regarded as greatest near the top (owing to protection at lower levels), but as not being zero along the stem. Suppose that a force F acts at point distance I from the top, and that this falls off as FjX for any point distance x. Then
h
r2 is proportional to ff (h-x) dx
1
approximately Fh(log h- I),�
and as log h- I may be regarded as constant with respect to h for the ranges� occurring, we get the parabolic shape approximated to, in this case, within the� limits of experimental error.�

LIST OF REFERENCES�
I.� GRAY, H. R. Va!. Meas. of Single Trees. Awt. For. 7, 1943. 2.� -- Ibid. 8, 1944. 3.� HUTCHINS, D. E. New Zealand Forestry, Pt. I. p. 47, 1919. Govt. Printer,
Wellington. 4.� JERRAM. iVI. R. K. Elem. Forest Mensuration, p. 70, 1939. 5.� JONSON, TOR. Taxatoriska Undersokningar am Skogstradens Form:
(i)� Granens Stamform. Slwgsvdrdsjor. Tidshr. 8 (I I), 285-328, 19 ro. (ii) Tallens Stamform. Ibid. 9 (9-ro), 285-329, 191 I.
(iii) Formbestamning ii Stiiende Trad. Ibid. 10 (4), 235-75,1912. 6.� BEHRE, C. E. Form-class Taper Curves and Volume Tables and their Applica
tion. Jow'. Agr. Research, 35 (8), 673-743, 1927. -- Factors involved in the Application of Form Class Volume Tables.
Ibid., 51, no. 8, 1935. 7.� PETTERSON, I-I. Studier over Stam/ormen. J1!Iedd. Statens SllOgsjorsohsanstalt.
H. No.2, 1927 (Summary in German). 8.� PETRINI, S. Fonnpunktsbedomning. Ibid. H. 16 Nos. 6 and 7, 1919. -- Stamforms Undersokningar. Ibid. H. 18, NO.4, 1921. -- En Narmeformel fOr Kubering av Trad. Ibid. H. 24, Nos. 6-7, 1928. -- Skogsuppskattning och Skogsekonomi. Lars Hoherbergs Boliforlag.
Stochholm, 1937. 9.� MACDONALD, J. The Measurement of Standing Trees. Scott. For. Journal,
14, 1931. 10.� IVotes on F01'est Mensuration. Contributed by Imp. For. Inst.. Oxford in
Forestry, 18, 1944. I I. lVIETZCER, C. Der vVind als massgebender Faktor fUr das vVachstum der
Baume. Miindener jorst!. Hejte, H. 3. Berlin, 1893· 12.� JACCARD, P. Neue Untersuchungen Uber die Ursachen des Dickenwachstums
der Baume. Naturwissmsch. Zeitschrift jUr Forst. Landwirtschajt, 13, (8-9), 321-60,1915 (U.S.A. For. ser.: Trans. No. 176).
13.� -- The Mechanical and Physiological Effect oj the Wind on the Form oj Tree Trunhs, 1930. (U.S.A. For. Ser. Trans. 173.)
14.� BDsCEN, iVI. and MUNCH, E. The Structure and Life oj Forest Trees. (English translation by T. Thomson, 1929.)
IS.� JACOBS, iVI. R. Observations on Features which inRuence Pruning. Com. For. Bur. Bull. 23, 1938.
16. SCHIMPER, A. W. F. Plant Geography, p. 305. 17.� FRANCIS, W. D. The Development of Buttresses in Queensland Trees. Proc.
Royal Soc. Queensland, 36, 1925. 18.� DAVIS, T. A. W. and RICHARDS, G. W. The Vegetation of Morabilti Creek.
Brit. Guiana Jour, Ecol. 22, pp. 126-32, 1934. 19. PETCH, J. Buttress Roots. Ann. Roy. B.G. Peridenya, 2, pp. 277-85, 1930. 20.� WHITFORD, H. N. The Vegetation of Lamoa Forest Reserve. Philippine Jour.
1, pp. 373-43 I and 637-82, 1906. 21.� FRITSCHE, K. Sturmgefahr und Anpassung. Tharandter Forstl. Jahrbuch, 84.
Band, Heft I (Com. For. Bur. trans.). 22. JERRAM, M. R. K. Elementary Forest Mensuration, pp. 65-69. 1939. 23.� MILLETT, M. R. O. Lean and Ellipticity of Stems of j\tlonterey Pine in the
Australian Capital Territory. Com. For. Bur. Leaflet, No. 60, 1944. 24. Silv. Research Man. India, Vol. 2. The Statistical Code. pp. 71 et seq. 1921. 25.� JACOBS, M. R. Detection of the Annual Stages of Growth in the Crown of
Pinus radiata. Com. For. Bull. 19, 1936.

PRINTED IN�
GREAT BRITAIN�
AT TI{E
UNIVERSITY PRESS
OXFORD
BY
CHARLES BATEY
PRINTER
TO THE
UNIVERSITY

