the future of burley supply burley stabilization corporation daniel green burley stabilization...
TRANSCRIPT

The Future of Burley Supply
Burley Stabilization CorporationDaniel Green

Overview
Historical Trends Review
U.S. Market Review
Short-term Supply Issues
Long-term Supply Issues

25 Year Production Review
World Production Trends Filler vs. Flavor Production in Flavor Exporters

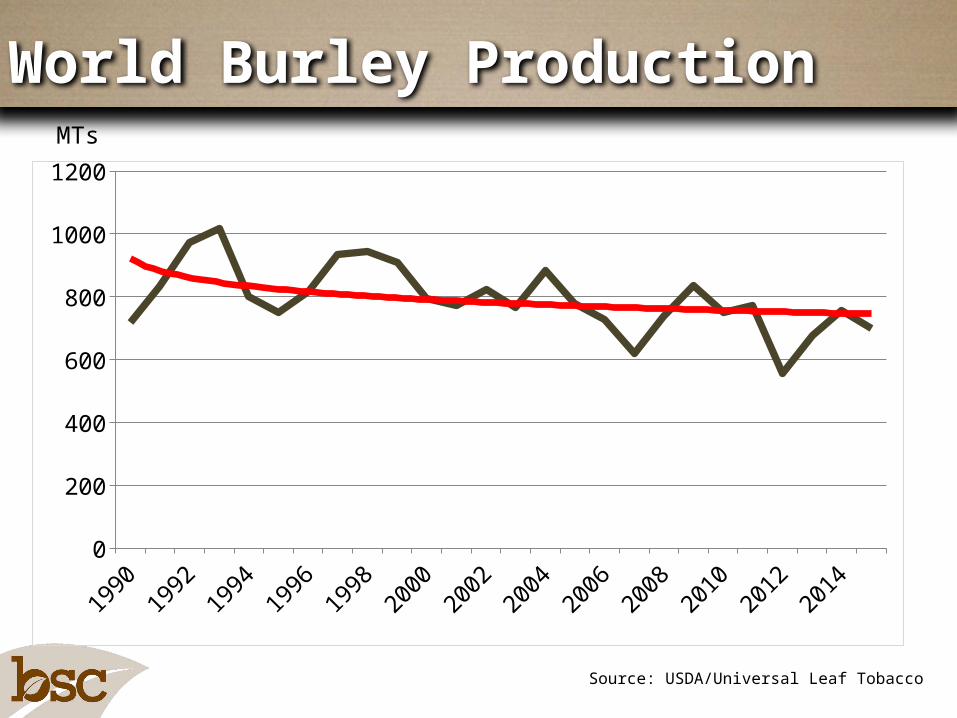
Source: USDA/Universal Leaf Tobacco
World Burley ProductionMTs
19901992
19941996
19982000
20022004
20062008
20102012
20140
200
400
600
800
1000
1200
Source: USDA/Universal Leaf Tobacco
World Burley ProductionMTs
19901992
19941996
19982000
20022004
20062008
20102012
20140
200
400
600
800
1000
1200

Flavor vs. Filler Production
19901992
19941996
19982000
20022004
20062008
20102012
20140%
10%
20%
30%
40%
50%
60%
70%
80%
90%
100%
Flavor
Filler

MTs
Burley Production
19901992
19941996
19982000
20022004
20062008
20102012
20140
50
100
150
200
250
300
350
Argentina Brazil USA

World Burley Production Share
1989 1999 2009 20150.00%
10.00%
20.00%
30.00%
40.00%
50.00%
60.00%
70.00%
80.00%
90.00%
100.00%
USA Brazil ArgentinaMalawi Others

The significant decrease in higher-value flavor burley in recent years exemplifies a relatively rapid shift from traditional flavor producing regions.
Given the much smaller supply of flavor burley, manufacturers are certainly substituting filler for flavor.
Better technology in cigarette production.
Better quality filler tobacco.
Consumer demand for cheaper cigarettes.
Flavor vs. Filler Burley

U.S. Cigarette Taxes
2002200320042005200620072008200920102011201220132014 $-
$0.50
$1.00
$1.50
$2.00
$2.50
$3.00
Federal Excise Tax Avg. State Tax
$/Pack
Source:

U.S. Cigarette Retail Price
Source:
1992 1994 1996 1998 2000 2002 2004 2006 2008 2010 2011 2012 2013 2014 $-
$1.00
$2.00
$3.00
$4.00
$5.00
$6.00
$7.00
$1.93 $1.85
$1.95 $2.29
$3.29
$3.91 $4.25
$4.14 $4.58
$5.87 $6.00 $6.03 $6.05 $6.10

U.S. Cigarette Production
Source: USDA ERS, TMA
19971998
19992000
20012002
20032004
20052006
20072008
20092010
20112012
20132014
0
100
200
300
400
500
600
700
Domestic Consumption Exports
Billion Pieces
16% since 2009
45% last 10 years

Source: NASS/ERS/USDA2006-2008 Estimates by Univ. KY
KGs
US Burley Trade Balance
2005 2006 2007 2008 2009 2010 2011 2012 2013 2014 -
10,000,000
20,000,000
30,000,000
40,000,000
50,000,000
60,000,000
70,000,000
80,000,000
US Exports US Imports

American Blend Outlook Approximately 39% of cigarettes consumed worldwide are American blend compared to 53% Virginia and 8% other.
Consumption of American Blend cigarettes is concentrated in USA,
Russia, Japan, Philippines, Ukraine, South Korea and Germany. All are declining markets with approximately 5% decrease in consumption per year the past two years.
Growth markets for American Blend include Egypt, China, Iran, Thailand, Indonesia, Vietnam, Belarus and Taiwan.
While a declining market, American Blend sales declines are not substantially different from Virginia Blend declines and still represent a 2.1 trillion stick market.

Short-Term vs. Long-Term Supply
Short-term factors affecting supply will contribute to excess quantities and general reduction in quality.
Long-term factors contribute to lower capacity to produce flavor burley to meet demand.

U.S. Burley Tobacco
Hectares
2001
2002
2003
2004
2005
2006
2007
2008
2009
2010
2011
2012
2013
2014
2015
-
10,000
20,000
30,000
40,000
50,000
60,000
70,000
KY+TN Others

U.S. Burley Tobacco
Hectares
2001
2002
2003
2004
2005
2006
2007
2008
2009
2010
2011
2012
2013
2014
2015
-
10,000
20,000
30,000
40,000
50,000
60,000
70,000
KY+TN Others
Actual hectares planted in 2015 may be closer to 31,000
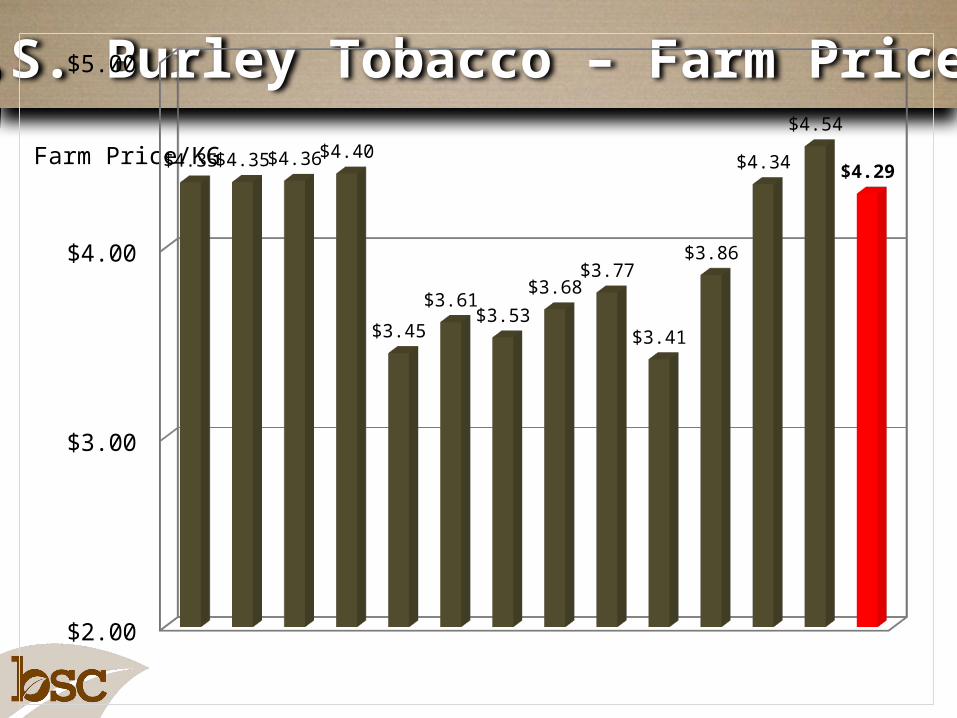
U.S. Burley Tobacco – Farm Prices
Farm Price/KG20
0120
0220
0320
0420
0520
0620
0720
0820
0920
1020
1120
1220
1320
14
$2.00
$3.00
$4.00
$5.00
$4.35 $4.35 $4.36 $4.40
$3.45
$3.61 $3.53
$3.68 $3.77
$3.41
$3.86
$4.34
$4.54
$4.29

Burley Production Decision
2014 Contract Volume - 84 MT 2014 Production Volume - 95 MT
2015 Contract Volume - 59 MT
2014 Production Volume - 95 MT

• Growers are planting tobacco without a marketing contract.
• Current incentives to produce are out of line with current burley demand.
• If substantial contract volume reductions and price reductions are in place for 2015, then why are growers overproducing?
Burley Production Decision

Expected Price for Burley
1 acre of burley, 2,000 lb. yield history, 75% coverage
Produced 2,000 pounds of burley grading B4GF
B4GF receives discount factor of 0.60
1-0.6 = 0.4, 0.4 x 2,000 = 800 pounds counting as production

Expected Price for Burley
2014 Guaranty = 0.75 x 2,000 = 1,500 pound guarantee
Indemnity = 1,500 - 800 = 700700 x $2.05 = $1,435
Grower sells tobacco at 3rd quality for $1.90

Expected Price for Burley
Total price received per pound:
$1,435 indemnity + $3,800 sale price
$2.63/LB ($5.78/KG)

Expected Price for Burley - 2015
For 2015, Price election is $1.80/LB
Under same example, expected indemnity for B4GF is $1,260.
If grower expects $1.32/LB or greater for insured non-contract tobacco, non-contract tobacco will average the same as 2014 contract tobacco ($1.95/LB).

Source: US Ag Census, 2012
Average Age of U.S. Burley Growers
Under 251%
25-347%
35-4412%
45-5423%
55-6429%
65+28%

Likelihood of Producing in 10-Years
Source: UT CTGR Survey Data
KY-Burley KY-Dark NC-Flue NC-Burley TN-Burley TN-Dark0%
10%
20%
30%
40%
50%
60%
70%
80%
90%
100%% Prob or Def will produce % prob or def will not produce
Likelihood of Producing in 10 YRs

Likelihood of Producing in 10-Years
Source: US Ag Census
Number of Tobacco Farms in KY
1992 1997 2002 2007 2012 -
10,000
20,000
30,000
40,000
50,000
60,000
59,373
44,967
29,237
8,113 4,530

15.50%
35.90%17.20%
14.20%
6.20%
11.00%Grain cropsCow/calfBeef CattleHayFruits/Veg.Other
Source: UT CTGR Survey Data
Alternative Crops to Burley Growers
Other Market Outlook Issues
Impact of the WHO – FCTC, FDA regulation and the EU Tobacco Products Directive
Participation of Big Tobacco into the electronic alternatives market
Continued growth in illicit trade – 1 in 10 cigarettes are illicit
Approach of Public Health to electronic cigs/vapor products


Future of Tobacco Regulations
Increased Attack on Combustibles Growth & Acceptance of E-options
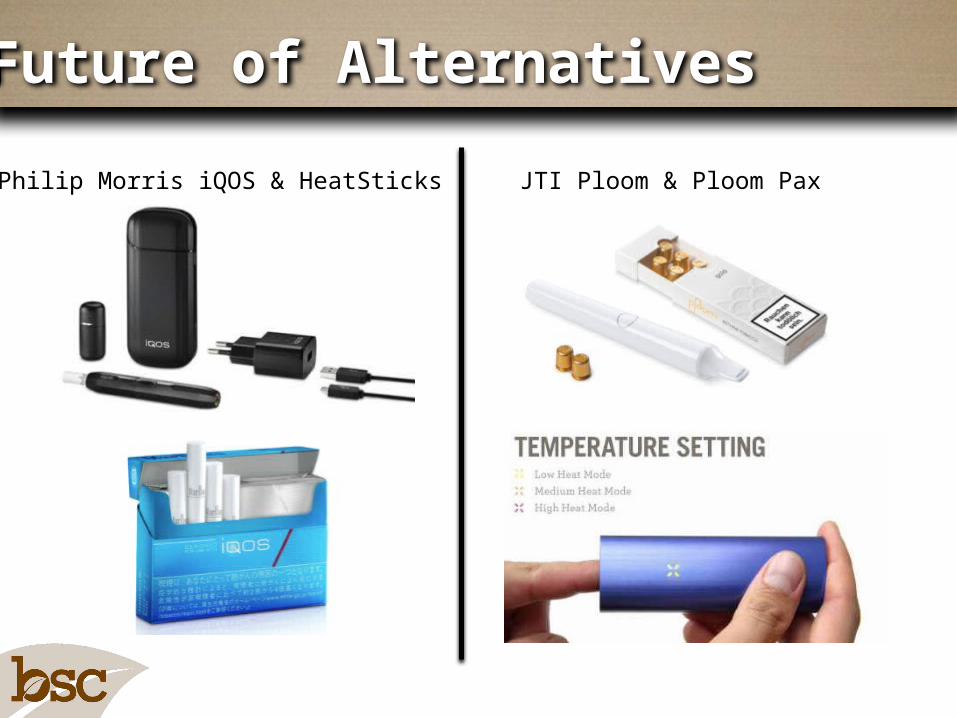
Future of Alternatives
Philip Morris iQOS & HeatSticks JTI Ploom & Ploom Pax

Moist Snuff Sales
Source:
Million Pounds
20022003
20042005
20062007
20082009
20102011
20122013
20140
102030405060708090
100110120
E-Cig/Vapor
E-Cigs first on the market less than ten years ago.
Worldwide sales of vapor products totaled $3.5 billion in 2013, with approximately half of the sales in the USA.
E-Cig and Vapor product sales are approximately 2% of the value of cigarette sales in the USA.
Projected to exceed $50 billion per year worldwide by 2030 by Euromonitor.
