the future of equity - national league of cities
TRANSCRIPT

NATIONALLEAGUEOF CITIES
The
In Cities
FUTURE OF EQUITY

ABOUT THE NATIONAL LEAGUE OF CITIES
The National League of Cities (NLC) is the nation’s leading advocacy organization devoted to strengthening and promoting cities as centers of opportunity, leadership, and governance. Through its membership and partnerships with state municipal leagues, NLC serves as a resource and advocate for more than 19,000 cities and towns and more than 218 million Americans. NLC’s Center for City Solutions provides research and analysis on key topics and trends important to cities, creative solutions to improve the quality of life in communities, inspiration and ideas for local officials to use in tackling tough issues, and opportunities for city leaders to connect with peers, share experiences, and learn about innovative approaches in cities.
ABOUT THE AUTHORS
Nicole DuPuis is the Principal Associate of Urban Innovation; Elias Stahl is a Research Assistant; and Brooks Rainwater is Senior Executive and Director of the Center for City Solutions.
ACKNOWLEDGEMENTS
The authors would like to acknowledge Soren Messner–Zidell & JoElla Straley, who designed the report and visualizations; and Courtney Bernard for editing the report. Freddy Trejo designed the cover. We are also grateful to all of the city officials, thought leaders, and experts that took the time to speak to us about equity and cities.
© 2017 National League of Cities. All Rights Reserved.

The
In Cities
NATIONALLEAGUEOF CITIES
FUTURE OF EQUITY

Introduction: Why Is Equity Important?
Infrastructure - autonomous vehicles, road pricing and more
Economic Development - equitable growth
Public Safety - predictive policing, community engagement
Conclusion
1
7
19
31
41
Table of Contents

VNATIONAL LEAGUE OF CITIES

INTRODUCTION: WHY IS EQUITY IMPORTANT?

“Equity is just and fair inclusion into a society in which all can participate, prosper and reach their full potential.”
-POLICYLINK

3 NATIONAL LEAGUE OF CITIES
THE FUTURE OF EQUITY IN CITIES
Richest 1/10th of a percent
Bottom 90 percent
EQUAL AMOUNT OF WEALTH
Source: National Bureau of Economic Research
The success we have seen in our nation’s cities is clear, but the future of our urban
places will be defined by how we work together to lift all members of our communities in the future. Great places don’t rise from a blank slate — they use unique assets to build up what’s special about the community, rather than seeking to recreate success from elsewhere. As cities continue to grow, equity and inclusion will be ever-more pressing.
While many cities feel the immediate positive outcomes from wealth flooding into metropolitan regions, they also feel the negative impact on community members of varying income levels – particularly, those at the bottom that face increased housing prices, greater need for social services and growing concern for community safety. The income inequality and wealth gaps are at
outsized levels, with the richest 0.1 percent holding the same amount of wealth as the bottom 90 percent. And when examined through a racial equity lens, the disparities become even starker; on average, white families have six times the wealth of African American and Hispanic families. This is where we are now. Unfortunately, the current policy environment at the national level isn’t focused on alleviating these inequities—cities are.
It is clear that our nation’s cities cannot only be defined by the growth of the tech and the creative sectors. Instead, we must act deliberatively for growth of any kind to be truly sustainable. As the tide of innovation in cities rises, local leaders must work assiduously to lift all boats by planning for inclusive economic development.
Cities are shaping the story of America.
The income inequality and wealth gaps are at outsized levels, with the richest 0.1 percent holding the same amount of wealth as the bottom 90 percent.

4NATIONAL LEAGUE OF CITIES
The National League of Cities (NLC) seeks to help city leaders lead. Our annual State of the Cities research analyzes the key issues that matter to mayors and cities. For a number of years now the top issues that matter are: economic development, infrastructure, and public safety. The Future of Equity in Cities seeks to take these core issues and forecast the opportunities and challenges to come in cities not just today, but in the decades to come through an analysis of long-range planning, an examination of on-the-ground programming of inclusive economic growth, and by seeking to better understand the public safety challenges that cities will face far into the future.
Infrastructure - autonomous vehicles, road pricing and moreMobility is critical to humanity’s growth in the urban environment. It is one of the major facilitators of human settlement and success. Where an individual goes, how they get there, and the resources they have access to have the potential to influence nearly every other element of their lives. As mobility and
adequate infrastructure have become more widely regarded as civil rights, central to inclusion and critical to individuals’ capacity to participate and prosper in the modern-day economy, they have simultaneously been impacted by the rise of technological forces.
New technology is promising a hyper-connected future for cities in which driverless cars and smart city applications have the potential to improve services, efficiency and quality of life. We can imagine a not too distant future in which every consumer product and piece of infrastructure increasingly has the ability to sense surrounding stimuli, to communicate with other devices and people, and to draw on the computing and storage power of the cloud. However, along with all of these exciting advances come a bevy of new questions about equity. With current demographic shifts, generational preferences, wealth creation and other factors pointing toward the continued growth of cities, the importance of mobility and infrastructure is ever-present. The recognition that equity is driven and sustained by these forces presses city officials to ask new questions and prepare for a new future.
As the tide of innovation in cities rises, local leaders must work assiduously to lift all boats by planning for inclusive economic development.

5 NATIONAL LEAGUE OF CITIES
THE FUTURE OF EQUITY IN CITIES
Economic development - equitable growthCities are becoming more diverse, but simultaneously more segregated and inequitable. Ninety-eight percent of growth in the one hundred largest cities since 2000 was from growth in minority populations. A Brookings Institution analysis of the 2011-2015 American Community Survey found that despite this increased diversity in cities, racial segregation has only moderately declined.1 Dominantly white neighborhoods in cities were 79 percent white in 2000 and 72 percent white in 2015, despite the overall white population in cities having dropped from 64 percent to 56 percent during the same period. For neighborhoods outside of
large metropolitan areas, this reduction was even smaller, from 84 percent to 80 percent.
As a nation, higher birth rates for racial minorities are projected to make the aggregate minority population a majority of the country by 2043.2 In the majority of cities, the fastest growing employment sectors are high-skill and high wage, but unfortunately these sectors are not likely to add the same number of aggregate jobs as much larger and lower-skilled sectors like retail, food service, and office and administration. This spatial mismatch of employment and wages will only be amplified by future growth trends in cities and will reinforce inequities. It is imperative that cities work to counteract these trends now.
Public safety - predictive policing, community engagement
As urban populations become more diverse, so are police departments.Police departments are becoming more representative of the populations they protect. Many cities are recognizing that prioritizing equity and diversity in making hiring decisions for public safety agencies is critical to establishing trust between citizens and the officers that serve them. In addition to becoming more representative of their communities, more police departments are also adopting the tenets of community policing in their mission statements, with nearly 70 percent of departments emphasizing community policing values as of 2013. Public safety agencies are also more frequently establishing problem-solving partnerships with local organizations
of growth in the 100 largest cities since 2000 was from growth in minority populations.
98%

6NATIONAL LEAGUE OF CITIES
that address specific challenges in their communities. These trends highlight a positive shift in police force composition and policing tactics toward approaches that focus on community trust, outreach, and cooperation.
Additionally, like cities, public safety institutions are moving toward data-driven applications. Increasingly, smart cities use data analytics to increase efficiency and transparency, developing metrics with which to measure municipal operations. As this trend accelerates nationwide, police departments are adapting and learning
from prior successes, developing their own crime metrics and using data analytics to forecast crime. Concepts like predictive policing and other data-driven public safety strategies will continue to attract debate, as they often rely on prior causal relationships between environments and past offenses. With such significant changes in how policing is administered in our cities, we must be cognizant of the nuances between communities and neighborhoods, and ensure a focus on equity is at the core of all public safety decision-making.
Many cities are recognizing that prioritizing equity and diversity in making hiring decisions for public safety agencies is critical to establishing trust between citizens and the officers that serve them.
Cities are partnering more with the private sector, nonprofits and other intersectional partners in order to best approach these oncoming challenges. Only by working
together can we effectively seize the opportunities to come. This is the century of the city and urbanity is the future of humanity. The future of cities is not something that can be predicted by simply looking into a crystal ball and pronouncing what will be next. Only through rigorous analysis of existing trends, working with city leaders and national experts, and forecasting what will impact cities can we collectively succeed—this report seeks to provide city leaders with a cogent analysis of what the future of cities will hold.

INFRASTRUCTURE


LONG RANGE TRANSPORTATION PLANS
Albuquerque
Arlington
Atlanta
Austin
Baltim
ore
Boston
Charlotte
Chicago
Colorado Springs
Colum
bus
Dallas
Denver
Detroit
El Paso
Fort Worth
Fresno
Houston
Indianapolis
Jacksonville
Kansas C
ity
Las Vegas
Long Beach, C
A
Los Angeles
Louisville
Mem
phis
Mesa
Miam
i
Milw
aukee
Minneapolis
Nashville
New
Orleans
New
York
Oakland
Oklahom
a City
Om
aha
Philadelphia
Phoenix
Portland
Raleigh
Sacramento
San Antonio
San Diego
San Francisco
San Jose
Seattle
Tucson
Tulsa
Virginia B
each
Washington D
C
Wichita
2020
2025
2030
2035
2040
2045
2050
Less than 500,000
500 - 999,0001m-2.5m
2.5+m
Does Plan mention equity?
City Population (2016)
No
Yes
n order to examine factors at the nexus of equity, mobility and technology, we analyzed long range transportation plans
from the 50 largest U.S. cities. In 19 of these
82%of cities lay out explicit intentions or strategy around ITS investment.
38%of cities mention autonomous vehicles.
30%of cities address the impact of TNCs, despite the fact that they operate in all of the markets in the analysis.
84%of cities have a complete streets policy.
80%of plans mention equity.
cities, there were up-to-date (adopted after 2010) municipal transportation plans available. The remaining plans in the analysis are regional long-range transportation plans.
Visualization Guide
Our analysis found:
I
11 NATIONAL LEAGUE OF CITIES
THE FUTURE OF EQUITY IN CITIES
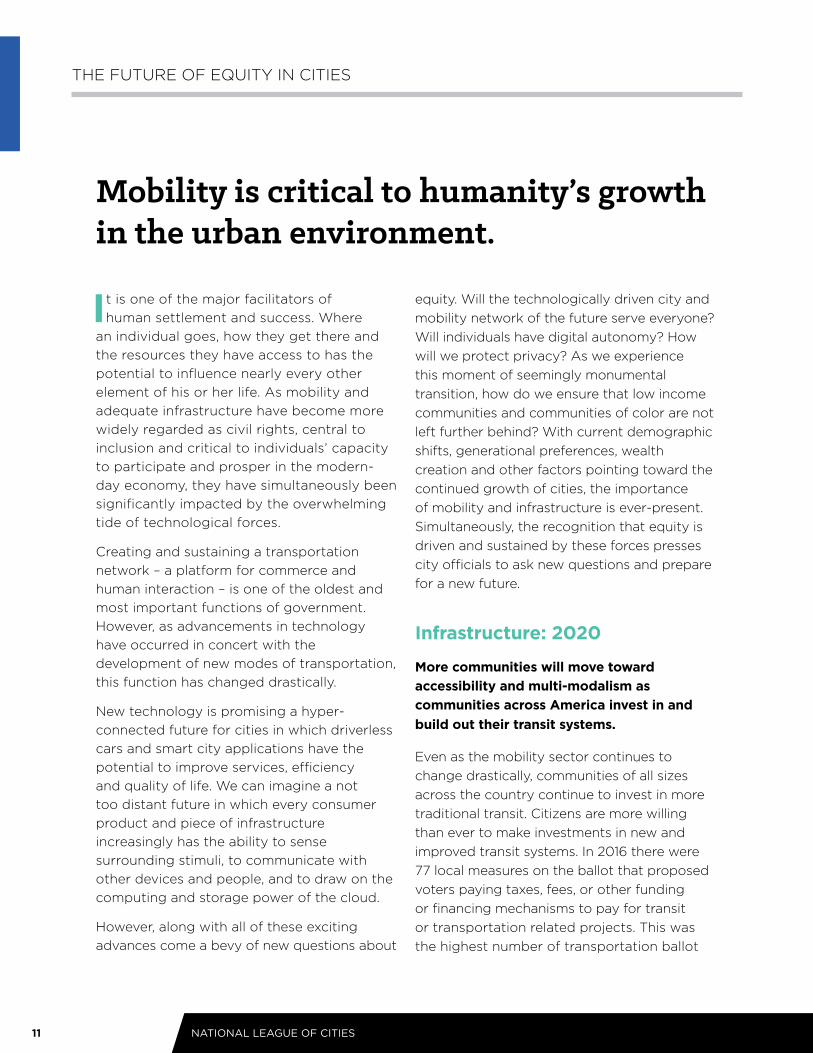
It is one of the major facilitators of human settlement and success. Where
an individual goes, how they get there and the resources they have access to has the potential to influence nearly every other element of his or her life. As mobility and adequate infrastructure have become more widely regarded as civil rights, central to inclusion and critical to individuals’ capacity to participate and prosper in the modern-day economy, they have simultaneously been significantly impacted by the overwhelming tide of technological forces.
Creating and sustaining a transportation network – a platform for commerce and human interaction – is one of the oldest and most important functions of government. However, as advancements in technology have occurred in concert with the development of new modes of transportation, this function has changed drastically.
New technology is promising a hyper-connected future for cities in which driverless cars and smart city applications have the potential to improve services, efficiency and quality of life. We can imagine a not too distant future in which every consumer product and piece of infrastructure increasingly has the ability to sense surrounding stimuli, to communicate with other devices and people, and to draw on the computing and storage power of the cloud.
However, along with all of these exciting advances come a bevy of new questions about
equity. Will the technologically driven city and mobility network of the future serve everyone? Will individuals have digital autonomy? How will we protect privacy? As we experience this moment of seemingly monumental transition, how do we ensure that low income communities and communities of color are not left further behind? With current demographic shifts, generational preferences, wealth creation and other factors pointing toward the continued growth of cities, the importance of mobility and infrastructure is ever-present. Simultaneously, the recognition that equity is driven and sustained by these forces presses city officials to ask new questions and prepare for a new future.
Infrastructure: 2020
More communities will move toward accessibility and multi-modalism as communities across America invest in and build out their transit systems.
Even as the mobility sector continues to change drastically, communities of all sizes across the country continue to invest in more traditional transit. Citizens are more willing than ever to make investments in new and improved transit systems. In 2016 there were 77 local measures on the ballot that proposed voters paying taxes, fees, or other funding or financing mechanisms to pay for transit or transportation related projects. This was the highest number of transportation ballot
Mobility is critical to humanity’s growth in the urban environment.

12NATIONAL LEAGUE OF CITIES
measures in one calendar year to date, and 71 percent of these ballot measures were passed by voters. This data is consistent with previous years. Since 2000, there has been an overall 71 percent approval rate of these types of ballot measures, even during politically polarizing ebbs and flows dominated by anti-tax sentiment.3
Currently we see many cities embarking on new transit projects and building out existing systems, with bus-rapid-transit (BRT) and streetcar systems gaining momentum and support. In 2017 there will be 10 new BRT lines opening in cities across the county, and six projects beginning construction that will likely be in service within the next five years.4 There are also two new streetcar lines opening and four planned that will be either well underway or finished in this time frame.5
By 2020, expansion and improvement of transit systems and movement toward community design that favors accessibility and multi-modalism will enable more individuals to get to the places that they live, work, play, and pray without relying on the increasingly exorbitant expense of a single occupancy vehicle.
Smart city applications will be deployed in a more standardized and comprehensive way, and in cities of all sizes.
The conversation around smart cities has been largely driven by the private sector and aimed toward large cities with the organizational and budget capacities to do expansive projects. However, small and medium sized cities are beginning to see that smart city solutions can and should be deployed in an iterative manner and in a way that is consistent with their objectives. Context sensitivity is a primary consideration in the deployment of smart cities and small and mid-sized cities don’t necessarily face the same problems as large cities.
As cities of all sizes begin to implement and explore smart city solutions, context and scale are front of mind for local leaders. A recent NLC survey asked cities whether they had invested in any sort of smart city technology, and 66 percent of city officials surveyed said yes. When asked about which types of smart city solutions they had adopted, they cited smart meters for utility management, intelligent traffic signals, e-governance applications, wifi kiosks and RFID sensors in pavement, among many others. Of the 34 percent of cities without any smart city systems in place, a quarter said their cities
of cities have invested in some sort of smart city technology.
of cities that haven’t invested in smart city technology are currently exploring it.
66% 25%
Source: NLC’s 2017 report, “Cities and the Innovation Economy: Perceptions of Local Leaders”

VIEWPOINTS ON EQUITYAnita Cozart, PolicyLink
Anita Cozart is a central figure in the equity movement. She is a senior
director at PolicyLink and she oversees the organization’s work across a number of issues, including transportation, housing, and equitable development. While all of the issues that she works on are directly linked to federal policy, PolicyLink’s work is grounded in the impact it can make around policy change at the local level. “Much of what we do is to try to create links between innovation and ideas that are really advancing equity for low income people and communities of color at a local level. We also want to ensure that those great ideas and programs have an opportunity for scale, learning, and implementation at a national level,” says Cozart.
As PolicyLink has worked in this space, it has found that cities are prioritizing equity as they think about their programs, policy and constituency services. So much so that the organization has launched the All-In Cities13 initiative, which helps city officials, community advocates, and other local leaders work together to advance racial economic inclusion and equitable growth.
The equity movement has changed and broadened enormously over the last decade, and there is a likelihood that it will continue to evolve. Anita added that “over the past 10-15 years since we began talking about equity, we’ve seen a lot of uptake in the advocacy
space and in the non-profit and government sectors. There are also emerging leaders in the philanthropic and business sectors who are embracing the agenda.” As the movement grows, and new sectors join the conversation, we may see some different language used to describe equity outcomes.
Technological forces have proven to have the potential to both enhance and hinder equity. If the focus is on delivering the highest degree of technology or producing the intervention that meets the needs of the technology company, then the outcome is more likely to hinder equity. If there is an attempt to use technological interventions to solve challenges for the most vulnerable
We can apply these principles to home-
sharing, job-sharing, and ride-sharing, as
well as to autonomous vehicles, and all kinds
of technology including that which is being
imagined and hasn’t even been introduced yet.

populations, there arises an opportunity to enhance equity. Solving problems for vulnerable populations, also improves conditions for a whole host of other people, creating cascading benefits (think the ‘curb cut effect’).14 This is the approach that is necessary when we think about integrating technology into our cities.
In thinking specifically about how equity applies to transportation and infrastructure, Cozart identifies the most pressing issues as access, affordability and employment.
“On the access side, there are national and local level studies that talk about the disparate access by income and race. When you couple that with affordability and see that the bottom 90th percentile of income earners are spending twice as much on transportation as the top 10 percent, it becomes evident that
these two issues combine to create significant mobility hurdles for a majority of Americans.”
An additional challenge is employment – nearly 1 in 10 jobs in America is a transportation or infrastructure related job, but the underrepresentation of women and people of color in these sectors compared to their overall participation in the workforce is cause for concern.
“In addition to harming minority communities, this underrepresentation threatens the viability of the transportation industry and the prospects of sustaining it with the skilled employment necessary.” When we seek to solve these challenges, and begin to think about them from the perspective of people of color and low-income communities, the result will be a stronger, more resilient, and prosperous economy for everyone.
Nearly 1 in 10 jobs in America is a transportation or infrastructure related job.

15 NATIONAL LEAGUE OF CITIES
THE FUTURE OF EQUITY IN CITIES
were currently exploring implementing some sort of smart city application.6
As these technologies becomes more commonplace in cities of all sizes and geographies, they have the potential to bridge some of the divides that exist between communities and their municipal government officials. In many cases, smart city solutions automatically inform city departments of deficiencies or areas where attention is needed rather than relying on communication or reporting from individuals who might not be comfortable interfacing with government institutions.
To date, one of the challenges related to deployment of smart city infrastructure is the lack of interoperability. Though not yet fully implemented, the National Institute of Standards and Technology (NIST) is working in conjunction with a number of other organizations on a framework for smart city development.7 The framework is designed to address two main concerns: the interoperability and portability of information
and communications technology (ICT) development across cities, and the need for standard architectural principles. Their goal is to establish enough standardization that systems can be integrated across cities, without standardizing so much as to create an obstacle for further innovation.8 With some of the interoperability challenges removed, more cities and regions will be able to continuously roll out new smart city applications to make the lives of their residents easier and more seamless. By 2020, smart city applications and systems might look different, but ultimately, they will be more commonplace, seamless, and effective across locales.
Autonomous vehicle pilots will exist in all 50 states and fleets will be deployed in many communities.
Over the course of a few years, there has been significant policy movement toward autonomous vehicle (AV) testing. Twenty states have thus far passed legislation related to AVs.9 Additionally, governors in Arizona, Massachusetts, Washington
20 states have passed legislation related to autonomous vehicles.

16NATIONAL LEAGUE OF CITIES
and Wisconsin have issued executive orders related to the operation, testing or regulation of autonomous vehicles.10 In January of 2017, the Department of Transportation (USDOT) announced 10 proving grounds to move autonomous vehicles testing from controlled to real world vehicle operating environments, with a focus on developing best practices for data sharing as well as future policy guidance.11
In addition to initiating testing programs, some cities, are deploying fleets of AVs. The introduction of autonomous Uber fleets in cities like Pittsburgh, Pennsylvania, and Tempe, Arizona, has gained significant attention. Between federal, state and local level action, some sources predict that driverless car pilots might be deployed in up to 30 cities by the end of 2017.12 We can expect that several other cities will invite similar testing fleets and programs into their jurisdictions by 2020. In addition to pilot programs focused on ridesharing or single-occupancy use, we can also expect to see testing in the transit and freight sectors. Cities’ usage of autonomous and connected vehicle technology in service fleets will also become much more common over the next 3-5 years.
This will have significant equity implications, as these pilots will set in motion any regulatory efforts that take place around AVs in these jurisdictions in the years to come.
Infrastructure: 2030Roadways will be maintained via Vehicle Miles Traveled (VMT) or mileage based user fees.
Given the insolvency of the nation’s Highway Trust Fund, and dwindling funding streams
from federal and state level partners, policy makers are looking to alternate methods of paying for transportation infrastructure. VMT fees, also called mileage-based user fees (MBUF), are gaining traction as a plausible mechanism to fund transportation infrastructure. As cities continually move toward alternate financing mechanisms for infrastructure, mileage based user fee models will become more commonplace. MBUF require drivers “to pay based on distance driven and, perhaps other costs of road use, such as wear and tear on roads, traffic congestion, and air pollution.”15 Several states have completed large-scale pilot programs exploring the feasibility of charging drivers per mile traveled. The federal government recently committed to providing individual states and a coalition of sixteen states plus the District of Columbia (I-95 Corridor Coalition) with funding to support additional pilot programs.
Although no tax or fee program can be entirely equitable, there are pertinent concerns related to equity that arise with the prospect of instituting MBUF. Concerns include the ways in which this system could disproportionately affect rural and low income drivers. One of the solutions to the challenges faced by individuals in rural areas is to structure the fee system into aggregate zones that separate rural and urban roads and to charge fees according to which zone the travel occurred. A portion of revenue from MBUF could also be devoted to improvement of rural transit and public mobility options.16 Other equity challenges might include the electronic billing of those who are unbanked, and the additional burden placed on low income and rural drivers that drive older, less fuel-efficient vehicles. Even with these concerns about social equity, there are plenty of policy options in an MBUF

17 NATIONAL LEAGUE OF CITIES
THE FUTURE OF EQUITY IN CITIES
system to address them. Future MBUF systems could be structured in a progressive manner or even be eliminated for drivers who live in households under a specified income level.17
Employers will be much more conscious of job sprawl and locating their offices in desirable and accessible places.
Younger entrants into the workforce are showing increasing preference for offices located in city centers, and at the very least, in close proximity to different mobility modes. As Millennials are eschewing cars and showing preferences for other modes of transportation like biking and walking, it is hard to imagine that they will suddenly feel the urge to purchase cars and start driving to work.18, 19
This means that offices will need to be located in proximity to all of these transportation options, as well as to the metropolitan areas that this generation prefers in order to attract the best workers.20
Employers addressing the demands of a generation that prefers to work in a transit friendly, metropolitan area is another example of a rising tide that lifts all boats. In addition to making their companies more competitive, it also addresses the issue of job sprawl. Job sprawl is defined as “low-density, geographically spread-out patterns of employment growth,” in which a majority of jobs in a metropolitan region are located in the suburbs versus the region’s city center.21 Job sprawl is a symptom of urban sprawl, and often results in a phenomenon called spatial mismatch. Spatial mismatch refers to instances in which low income communities and communities of color are unable to easily access jobs, as a result of increasing job sprawl and limited transportation options. Low
income households are disproportionately affected by job sprawl, and the rising cost of transportation impacts these households more severely.22 A Brookings Institution study indicates that for working-poor homeowners, nearly 25 percent of their household income is consumed by housing and commuting expenses alone. This is comparable to 15.3 percent, on average, for other households. For those working-poor individuals who rent, 32.4 percent of their household income is consumed by these costs.23
As more cities and employers actively embrace the equity movement, they will recognize that locating jobs in areas that are accessible to transit and other mobility options is good for the economy as a whole. It bolsters the tax base and benefits everyone in the region, especially low income households and communities of color that are overwhelmingly disadvantaged by inequitable job locales. By 2030, the majority of jobs will be located in cities’ central business districts once again.
Autonomous technology will be commonplace in our mobility networks.
Fully autonomous vehicles will be deployed first in major cities, but by 2030 they will
By 2030, the majority of jobs will be located in cities’ central business districts once again.

18NATIONAL LEAGUE OF CITIES
likely be ubiquitous with everyday life in cities of all sizes and geographies. City officials and regulators will continue to confront significant issues related to regulation, traffic management, and safety of AVs. This will be exacerbated by the continued promise of deployment on our roads and the increased commingling of varying levels of automated vehicles with varying levels of connected vehicles and traditional non-autonomous vehicles. To date, nearly every major car manufacturer has set a deadline of producing fully autonomous cars by 2021, with China’s Baidu aiming for 2019 and Tesla aiming for the end of 2017.24, 25 Outside of major metropolitan areas where pilot projects are already taking place, the adoption of driverless cars will be determined largely by the private sector, requiring local leaders to anticipate and adapt as the sole means of transportation for their citizens and a significant portion of their local economy changes in the span of a few years.
The first transportation sectors likely to see mainstreamed use of autonomous vehicle technology include the freight/trucking industries and the transit industry. Even before trucking becomes fully automated, single truck drivers will have the ability to lead caravans of trucks that are remotely linked to a lead driver
for long-haul trips. Eventually, this will threaten the jobs of millions of professional truck drivers (between 2 and 3.5 million, depending on the source).26 The change will ripple through countless small towns with cottage service industries that rely heavily on the working-class incomes that truck drivers receive today.27
Transit agencies will also be among the first to adopt autonomous technology. Honolulu is already running the first fully automated rail line in the nation, and bus fleets are ripe for automation as well. There are a number of companies providing automated shuttle service that might serve first/last mile and closed route trip needs such as Local Motors, Navya, 2GetThere and EasyMile.28 Other discussions surrounding automated transit have suggested fixed route busing, platooning BRT, and paratransit.29 While there is a great deal of potential to expand transit service, there are equity concerns inherent in the elimination of professional driving and transit operation jobs, which have historically had relatively low barriers to entry. Cities will need to consider the impact of adopting these new technologies on their local economies.
Fully autonomous vehicles will be deployed first in major cities, but by 2030 they will likely be ubiquitous with everyday life in cities of all sizes and geographies.

ECONOMIC DEVELOPMENT


FUTURE EMPLOYMENT TRENDS
$10,000
$20,000
$30,000
$40,000
$50,000
$60,000
$70,000
$80,000
$90,000
-35% -30% -25% -20% -15% -10% -5% 0
$10,000
$20,000
$30,000
$40,000
$50,000
$60,000
$70,000
$80,000
$90,000
$100,000
$110,000
0% 20% 40% 60% 80% 100% 120%
OCCUPATIONS EXPECTED TO GROWFew New Jobs Likely for Middle Income OccupationsOCCUPATIONS EXPECTED TO DECLINE
FASTEST GROWING OCCUPATIONS WILL NOT CREATE JOBS EQUALLY DECLINING OCCUPATIONS IMPACT HIGH SCHOOL EDUCATED MOST ACUTELY
11,9005,500
Solar photovoltaic installers
Wind turbine service techs
Home health aides
Personal care aides
Personal care aidesTotal jobs in 2016: 2,016,100
Software developersTotal jobs in 2016: 831,300
Wind turbine service techsTotal jobs in 2016: 5,800
Respiratory therapists Total jobs in 2016: 130,200
Word processors and typistsJobs in 2016: 74,900
SecretariesJobs in 2016: 2,536,200
Cooks, fast foodJobs in 2016: 517,600
Physician assistants
Nurse practitioners
Statisticians
Physical therapist assistants
Software developers
Bicycle repairers
No formal education required Bachelor’s degree
Some college,no degree
Associate’sdegree
Postsecondarynondegree
award
High school diploma or equivalent
Percent of jobs lost by level of education required
Ten Year Projections, 2016-2026
PERCENT CHANGE (2016-2026) NUMBER OF JOBS (2016-2026)
83% 7% 5%
2% 2% 1%
105%96%
47%37%37%
36%33%
31%31%
29%
425,600754,000
39,70056,000
12,40027,200
253,4003,700
Circle size indicates current number of jobsCircle size indicates current number of jobs
CashiersJobs in 2016: 3,555,500
Source: Bureau of Labor Statistics “Employment Projections: 2016-26”

23 NATIONAL LEAGUE OF CITIES
THE FUTURE OF EQUITY IN CITIES
Ninety-eight percent of growth in the hundred largest cities since 2000 was
from growth in minority populations. A Brookings Institution analysis of the 2011-2015 American Community Survey found that despite this increased diversity in cities, racial segregation has only moderately declined.30 Dominantly white neighborhoods in cities were 79 percent white in 2000 and 72 percent white in 2015, despite the overall white population in cities having dropped from 64 percent to 56 percent during the same period. For neighborhoods outside of large metropolitan areas, this reduction was even lower, from 84 percent to 80 percent. While these are national trends, there remained a marked difference in diversity between large coastal metropolises and smaller, inland cities. Cities such as Las Vegas and Orlando became markedly more diverse due to increased migration as well, particularly in the American south and sunbelt. This phenomenon has made Houston the most diverse city in America, surpassing New York in 2010.31 As a nation, higher birth rates for racial minorities are projected to make the aggregate minority population a majority of the country by 2043.32
The fastest growing urban employers are high-skill and high-wage, while the largest net growers of jobs are lower-skill and
lower-wage. There is an emerging cleavage between the largest urban employers and the fastest growing urban employers. In the majority of cities, the fastest growing employment sectors are high-skill and high wage, but unfortunately these sectors are not likely to add the same number of aggregate jobs as much larger and lower-skilled sectors like retail, food service, and office administration.
The majority of wage growth over the past quarter century has gone to high-wage workers, while low and middle-wage workers have seen their earnings grow by only 14.7 percent and 16.8 percent respectively.33 This serves to exacerbate existing inequalities in educational attainment and economic access. Even more starkly, earned income growth was negative for the bottom 10th, 20th and 50th percentile of the workforce, while it reached 16.9 percent for the 90th percentile. In addition, the average median wage for people of color in the United States is more than 22 percent lower than the wage for white workers, making the lowest percentiles dominantly communities of color. Relationships like these are exacerbated by differences in educational attainment, where African-American and Hispanic Americans are 15 percent less likely to hold a four-year degree.
Cities are becoming more diverse, but simultaneously more segregated and inequitable.

In response to many of these community challenges, Neighborhood Centers, Inc., an outgrowth of the older settlement houses founded a century ago, has grown to become the largest non-profit human services provider in Texas, operating 75 service centers in the Houston area. These centers partner with other local service providers to offer cradle to career services focused on economic access. In 2010, the first federal
Promise Neighborhood planning grant in Houston was awarded to Neighborhood Centers, Inc. to develop the Gulfton Promise Project, a center in Houston’s most densely populated and underserved neighborhood which now hosts a charter school, adult education, citizenship classes, expanded health services, an opportunity center for financial education, and other community spaces.
Community Centers Offer Path to Economic Opportunity in Underserved Neighborhoods

25 NATIONAL LEAGUE OF CITIES
THE FUTURE OF EQUITY IN CITIES
Economic Development: 2020The fastest growing metropolitan areas will be responsible for the bulk of job and population growth, but also rising inequality.
The fifteen fastest growing metropolitan areas have already been responsible for over half of new jobs and three-quarters of births from 2000 – 2014.34 This incredible growth has also created challenges, as much of the population growth is from immigrant communities who face barriers to equal economic access. In an Urban Institute white paper, Pendall and Turner used growth, job quality, cost of living, diversity, and disparities in economic opportunity as indicators with which to cluster the largest 99 metropolitan areas of the country. Some of the main barriers to economic access in America’s cities include language barriers, affordable child care and healthcare, and access to public transportation.
Urban economies will be more segregated, and health and personal services will be the fastest growing employers.
As our economy becomes more segregated, cities will be no exception. In many cases, this segregation will be more severe in urban markets where rising real estate prices have outpaced wage growth. While it is difficult to say what the economy of the future will look like, there are indicators that will become more prominent and pervasive by 2020. The hollowing out of mid-skill and mid-wage employment will continue, albeit variated across geographic regions. While some urban centers will attract younger populations of high-earners, others will attract older populations, often supported
by a low and mid-wage service industry. Cities that are experiencing the greatest demographic growth, will continue to grow a mixed economy, likely proving to be the most resilient over time. While cities will experience greater segregation between them, they will also see inequality grow within them. Cities that put in place policies that encourage the growth of a middle class, equal access to education and infrastructure (including financial and digital), and a floor for those most vulnerable will be the cities that encourage a diverse population and economy.
The fifteen fastest growing metropolitan areas have already been responsible for
over half of new jobs
three-quarters of births
FROM 2000-2014

26NATIONAL LEAGUE OF CITIES
Economic Development: 2030
Rising inequity will threaten the long-term social stability of urban economies.
Cities are for everyone, but they haven’t always been. Historically, the populations in cities have changed over time, adapting themselves to changing social, technological, and workforce shifts. In the urban economies of pre-war America, cities were centers of industrial production centered along strategic trade routes. This made them crowded, dirty, and impoverished. At that time, the emerging middle class of doctors, lawyers, financiers and public servants earned only slightly more than industrial laborers and artisans. The real wealth of the Gilded Age was in huge family fortunes, often held in estates in the countryside or wealthy city manors. Following two world wars, social and policy shifts as well as incredible economic growth altered the preferences and settlement patterns of many Americans. As a strong middle class emerged, cities became increasingly impoverished and neglected due to the fact that highways and trains along with the unfortunate social ills of “white flight” encouraged many to relocate from the city to the suburbs. This culminated in some cities experiencing challenges and, in some cases, the collapse of certain urban economies in the 1980s.
Today, an urban renaissance is occurring as high-earners and populations of all ages return to large cities. Cities are once again an exciting and diverse mix of industries and populations. But as wealth returns to cities that are now confined by zoning and health and safety codes, the growing population is
contributing to gentrification, higher rents, and rising inequality. Poorer residents are being priced out and cities are becoming emptied of middle-income jobs.
If this trend is brought to its ultimate conclusion, cities will become increasingly segregated, with entirely different economies found within a few miles of each other. This will have profound implications for economic access, as opportunities are increasingly only available in the most expensive cities, which debt-burdened students or lower-income families will not be able to afford. Cities must decide how they will offer economic access to their most vulnerable populations through affordable housing, access to education and workforce development. Cities that establish partnerships with public universities, such as those offering free tuition like CUNY and SUNY in New York, are providing the best kind of start to their younger residents, and are encouraging entrepreneurship from students who finish their degrees debt-free. There are many innovative approaches cities and their states can take to ensure equal economic access to all of their residents in the future, but this issue will only increase in importance over the coming decades.
Cities’ populations will age rapidly.
As a nation, and within our cities, our population is aging. The number of Americans over 65 will double between 2000 and 2040, while the number of adults over 85 will quadruple over that period.35 Over the next two decades, elder Americans over 65 will make up 20 percent of the population.36 Declining fertility rates, longer life expectancy and the increasing ease of aging

Boston
• Restructuring its existing Boston Youth Options Unlimited to serve as a worker co-operative incubator.
• Ensuring worker co-ops can access existing city services while finding new sources of investment for them.
Charlotte
• Creating a pilot workforce development program in partnership with Goodwill and its regional Urban League.
• Implementing a recruiting database in cooperation with workforce development partners.
• Requiring Business Investment Grant recipients to recruit from the aforementioned database.
• Establishing a funding mechanism for workforce development and small business capacity-building programs.
• Enhancing the CharlotteBusinessResources.com web portal with consistent evaluation, preventing duplication of services and connecting larger employers with small local businesses for contracting and procurement.
National League of Cities’ (NLC) Equitable Economic Development (EED) Fellowship offers case studies and municipal tools for increasing equitable
economic access. Launched in 2016 through a partnership between NLC, the Urban Land Institute and PolicyLink, the EED Fellowship selects six cities

Houston
• Creating an incentive program to attract large employers to east Houston that will provide jobs that align with the community’s skill and education-level.
• Collaborating with the city’s Office of Business Opportunity to focus on the development and support of small businesses in east Houston.
Memphis
• Inaugurating the Bluff City Match Program, that creates incentives for owners of vacant or under-utilized commercial space in targeted areas to match their properties with small and minority-owned businesses and entrepreneurs.
Milwaukee
• Launching a project to identify partnerships to match city owned and managed mixed-use properties with small entrepreneurs to service communities lacking economic activity.
• Exploring a local commercial real estate training program that attracts people of color to the commercial real estate development field.
Minneapolis
• Piloting a capital access project for disadvantaged businesses in north Minneapolis that are not of a similar small business profile already targeted by the city’s Business Technical Assistance Program.
across America and works with them over a year on an action plan to spur equitable economic development. Below is a summary of some of the tools used by last year’s cities.

29 NATIONAL LEAGUE OF CITIES
THE FUTURE OF EQUITY IN CITIES
The ten largest cities in America already account for just over $4 trillion in consumption
22% of U.S. GDP
Also equal to
in place will mean urban populations will age significantly in this period. The median age in Houston, for example, will increase from 33 in 2010 to 38 by 2040.37 In New York City, the overall population is projected to increase by 13.9 percent from 2010 to 2030 while the elderly population is expected to increase by 44.2 percent. In contrast, the school-age population of children in New York is expected to decline from 17.5 percent of the city in 2000 to 15.4 percent in 2030.38 These trends are iconic of the way our cities are changing, and will cause challenges for how cities plan and evolve to meet their residents’ needs. School systems, health care, mobility and the housing markets will all be impacted, and the aggregate effect of these demographic changes on urban economies will be substantial.
Urban aging populations will drive growing sectors with low productivity growth, such as healthcare, and become main drivers of urban consumption.
As cities become older in population, demand for healthcare and personal care services will increasingly be the drivers of urban economies. These sectors have lower productivity and wage growth than others, and may weigh on urban economies. In addition, consumption is a key driver of urban economies. Consumption as a fraction of U.S. GDP grew to 68 percent in 2015.39 The ten largest cities in America already account for just over $4 trillion in consumption, or over 22 percent of U.S. GDP.40 A McKinsey Global Institute (MGI) report argues that elderly and retired consumption will generate 51 percent of urban consumption growth by 2030.41
While much of the future job growth may be in healthcare, MGI found that the elderly and retired will contribute more than 40 percent of consumption growth in housing, transport, and hospitality sectors. The demographic shifts that will occur in urban centers over the next decades will impact our urban economies, with significant growth in service sectors. While the elderly population tends to be at its peak in terms of wealth, there are many who have not adequately saved to prepare them for the expenses of increased life expectancy and aging in place. Unfortunately, MGI predicted that this trend will exacerbate already latent inequalities.

30NATIONAL LEAGUE OF CITIES
New technologies like blockchain will increase financial access and reshape urban economies.
While bitcoin and other cryptocurrencies have garnered much of the attention this year, the technological platform over which they operate promises trustless and secure peer-to-peer exchanges. This has the opportunity to revolutionize urban economies. Blockchain is already powering nascent experiments in local producer-consumer power generation, where homeowners install solar panels on their homes and sell their excess power to their neighbors. As local economies transform, residents will be increasingly empowered to produce, sell and buy in their neighborhoods, making larger investments like a car or solar panels financially viable. Bitcoin and other cryptocurrencies also have the potential to
revolutionize the financial sector by reducing or eliminating the role of the intermediary and increasing access to financial accounts, financing, and investment. This may have an outsized impact for equitable economic access in communities across America. The FDIC estimated in 2015 that 7 percent, or approximately 9 million households in the U.S., were unbanked entirely. An additional 19.9 percent, or around 24.5 million households, were underbanked.42 By contrast, the Pew Research Center found that nearly 90 percent of American adults are online and over three-quarters owned smartphones.43 Families that have virtual wallets rather than accounts at traditional banks could exchange value for much lower costs, and face no minimum balance requirements, credit checks, or prohibitive fees.
While bitcoin and other cryptocurrencies have garnered much of the attention this year, the technological platform over which they operate promises trustless and secure peer-to-peer exchanges.

PUBLIC SAFETY


1987
1990
1993
1997
2000
2003
2007
2013
1987
1990
1993
1997
2000
2003
2007
2013
FEMALE SHARE OF LABOR FORCE NATIONWIDE
RACE OF OFFICERS NATIONWIDE
SEX OF OFFICERS NATIONWIDE
PERCENT MINORITY OFFICERS BY POPULATION SERVED, 1987-2013Larger Cities Have More Diverse Police Forces
DIVERSITY IN AMERICA’SPOLICE DEPARTMENTS
White
MaleFemale
Black
AsianNativeAmerican
Other*
Latino/Hispanic
US POPULATION19.7% MINORITY
US POPULATION24.9% MINORITY
US POPULATION27.6% MINORITY
Averaged percent minority shown for communities of different size categories:
*Asian and Native American officers not counted separately prior to 2007
20%
500,000-999,999
250,000-499,999
100,000-249,999
50,000-99,999
25,000-49,999
10,000-24,999
2,500-9,999
Under2,500
1,000,000+
20% 40% 60% 80% 100%0
20% 40% 60% 80% 100%0
2013
2010
2007
2003
2000
1997
1993
1990
1987
30%10% 40% 50%

1987
1990
1993
1997
2000
2003
2007
2013
1987
1990
1993
1997
2000
2003
2007
2013
FEMALE SHARE OF LABOR FORCE NATIONWIDE
RACE OF OFFICERS NATIONWIDE
SEX OF OFFICERS NATIONWIDE
PERCENT MINORITY OFFICERS BY POPULATION SERVED, 1987-2013Larger Cities Have More Diverse Police Forces
DIVERSITY IN AMERICA’SPOLICE DEPARTMENTS
White
MaleFemale
Black
AsianNativeAmerican
Other*
Latino/Hispanic
US POPULATION19.7% MINORITY
US POPULATION24.9% MINORITY
US POPULATION27.6% MINORITY
Averaged percent minority shown for communities of different size categories:
*Asian and Native American officers not counted separately prior to 2007
20%
500,000-999,999
250,000-499,999
100,000-249,999
50,000-99,999
25,000-49,999
10,000-24,999
2,500-9,999
Under2,500
1,000,000+
20% 40% 60% 80% 100%0
20% 40% 60% 80% 100%0
2013
2007
2003
2000
1997
1993
1990
1987
30%10% 40% 50%

35 NATIONAL LEAGUE OF CITIES
THE FUTURE OF EQUITY IN CITIES
Our cities are becoming more diverse and police departments are becoming
more representative of the populations they protect. In 1987, only 8 percent of officers were female, while in 2013 women make up 12 percent of forces.44 Also in that year, less than 15 percent of police officers were from a racial or ethnic minority, while in 2013 27 percent are. This trend is more pronounced in larger and more diverse cities. As police departments become more representative of their surroundings, they have also become more likely to adopt community policing in their mission statements, with nearly 70 percent of departments emphasizing community policing as of 2013. In departments serving populations of 25,000 or more, this ballooned to 90 percent. The same can be said for police departments that have problem-solving partnerships with local community organizations. While a majority of police departments serving populations of 25,000 or more have formed these partnerships, 86 percent of departments who serve over 1 million residents have these partnerships. These trends highlight a shift in policing tactics toward approaches that focus on community outreach and cooperation. However, this shift is primarily occurring in larger jurisdictions first.45
Public safety institutions moving toward data driven applications. Increasingly, cities are using data analytics to increase efficiency and transparency, developing metrics with which to measure municipal operations. As
this trend accelerates nationwide, police departments are also adapting and learning from prior successes, developing their own crime metrics and using data analytics to forecast crime. Philadelphia has been one of the most forward-leaning cities in this space. A team of researchers from the Temple University Center for Security and Crime Science examined U.S. Census and crime data from the Philadelphia Police Department within a two-week period. They found that these factors combined with community characteristics and crime counts from the previous year, generated the best prediction of how likely it is for a specific type of crime to occur in a certain area. The university then partnered with a civic geospatial software and data company called Azavea to develop software that will predict future crime risk potential along with a visual and statistical report, which is offered free to police departments.47
Concepts like predictive policing and other data driven public safety strategies will continue to attract debate, as they often rely on prior causal relationships between environments and past offenses. While broad aggregate statistics show a strong relationship between heat waves and violence, for instance, it remains to be seen how robust the relationship is at a more micro level. And while predictive policing may be possible in large cities such as Philadelphia, it is challenging to scale in smaller jurisdictions that lack robust crime
Police departments are beginning to better reflect the urban populations they serve.

36NATIONAL LEAGUE OF CITIES
Community PolicingCommunity policing is the concept that trust and mutual respect between police and the communities they serve is critical to public safety. It is a law enforcement strategy that emphasizes the systematic use of community engagement, partnerships and problem-solving techniques to proactively address conditions that cultivate crime and social disorder. Community policing emphasizes a “guardians not warriors” mindset that can significantly benefit both police officers and the communities they serve. Collaborating with community members to identify needs, establish best practices and provide feedback for law enforcement is common practice. Community policing requires cooperation among police, citizens and local decision-makers in order to forge effective partnerships that combat criminal activity. While cities have made tremendous progress through the adoption of community policing strategies for positive, proactive engagement with the public, there is much more to be done. Although it is down nationally, in many cities across the country crime continues to be a significant barrier to individual and family safety, quality of life, and social cohesion, particularly in racially diverse and disadvantaged neighborhoods.46

37 NATIONAL LEAGUE OF CITIES
THE FUTURE OF EQUITY IN CITIES
history. With such significant changes in how policing is administered in our cities, we must be cognizant of the nuances between communities and neighborhoods, and ensure a focus on equity is at the core of all public safety decision-making.48
Public Safety: 2020Body-worn cameras, Automated License Plate Readers and other recording technologies will become nearly ubiquitous in public safety agencies.
Body-worn cameras are becoming widely adopted with positive results. While the national debate over police transparency continues, police departments are moving ahead. In 2015, the U.S. Department of Justice announced $20 million in aid to local agencies purchasing these cameras. Today, at least 35 states are passing or have passed funding bills specifically for body-worn cameras (BWCs).
As police departments nationwide adopt BWCs, episodes of police brutality and misconduct are becoming more publicized, provoking controversy. While these episodes erode community trust, the subsequent adoption of BWCs aims to increase internal and external transparency. In a year-long study on the impact of BWCs in Mesa, Arizona, officers who did not wear body cameras performed 9.8 percent more stop-and-frisks and made 6.9 percent more arrests. Officers who did wear body cameras in turn issued 23.1 percent more citations, initiated 13.5 percent more interactions than those without the cameras, and were 25.2 percent more likely to perceive the camera as helpful during interactions with the public.49 Officers in this study were less aggressive in their encounters with the public, feeling reassured by the presence of body cameras. This ultimately led to a wider acceptance of BWCs by officers who had used them, a reduction in arrests and an increase in interactions.
Another year-long study in Rialto, California, showed a 59 percent reduction in use-of-force incidents and an 87 percent reduction in civilian complaints following the adoption of BWCs.50 A more recent study conducted with the Orlando Police Department between March 2014 and February 2015 showed a 53 percent drop in response-to-resistance incidents among the officers with BWC, as well as a significant reduction in civilian and officer injuries. The report also showed initial reluctance on the part of the police officers to wear body cameras, but a recognition of its utility afterwards, citing improved evidence collection, report writing and individual reviews.51
In addition to BWCs, police departments will also be able to use an interconnected web
Today, at least 35 states are passing or have passed funding bills specifically for body-worn cameras (BWCs).

of sensors, such as those already deployed by ShotSpotter, to reduce response times and increase their intelligence gathering. Automated License Plate Readers (ALPR) are another example of a growing sensor technology that enables police departments to read and process up to 1,800 license plates a minute. A 2011 Police Executive Research Forum survey of over 70 departments found that 71 percent already use ALPR technology, and 85 percent expect to acquire or use it in the next five years.52 Clearly, as computing moves to the fringes more generally, creating a connected internet of things, police departments will be no exception.
Police officer culture will grow to accept BWCs.
As police departments increasingly adopt body-worn cameras, preliminary studies
indicate that these cameras will bring positive benefits to both police officers and the communities they police. The previously mentioned study with the Orlando Police Department found that 74.4 percent of officers thought that all front-line police officers should be equipped with BWCs. Further, 25.6 percent of officers found that their own behavior was directly impacted by the camera, and 28.2 percent found that the cameras impacted the behavior of the residents they encountered. Interestingly, 41 percent of officers perceived that BWCs influenced their fellow officers’ behavior, meaning officers were less likely to admit their behavior was influenced by BWCs than their compatriots. An overwhelming majority of officers found that BWCs improved their evidence collection, recollection of events, and reporting, while 69.2 percent found that it made them better police officers.53
Challenges with Predictive Policing As policing becomes more reliant on data and moves steadily toward predictive policing models, it may increasingly focus on certain racial groups or income classes. Furthermore, as departments become increasingly equipped with advanced technology and their intelligence gathering widens, there are significant threats to privacy. The data police departments are already gathering could be used to determine individual identities and their movements in public space. Strong public oversight and transparency is an essential prerequisite to such powerful tools being used for policing communities. It is important that police departments always move to interact rather than intervene in their communities, relying on community relationships and interpersonal intelligence and not solely datasets to reduce crime.

39 NATIONAL LEAGUE OF CITIES
THE FUTURE OF EQUITY IN CITIES
Police departments will increase their data collection and analysis workforce, and more funding will go towards advanced technology and updating their data centers.
Police departments are already moving funds towards their data science departments while also taking advantage of federal grants to purchase drones, body-worn cameras and other advanced technology. With an increase in data collection and the general trend of the public sector relying on data to support policy decisions, police departments will increasingly invest in data collection, analysis and possibly even begin to hire data scientists.
Public Safety: 2030
Police departments will increasingly leverage technology to increase efficiency.
Much of the current movement toward data collection is not targeted towards specific activity, but rather collecting data indiscriminately and using computer algorithms and databases to detect an expired registration or the sound of a gunshot. The data collected today is governed, in most cases, by state law, and some states have moved to exempt such data from public records law. The lack of public oversight and broad reach of the data collected is concerning to privacy advocates who call for more transparency, stricter public oversight, and data use policies that ensure privacy and equity.
As smart policing increases, the data collection capabilities of police departments will become less inclined toward wide-
ranging data collection and more reliant on historical relationships in datasets and smart algorithms. While this trend is a potential boon to understaffed and resource-starved departments, allowing them to more easily and efficiently monitor their jurisdictions and respond to incidents, this shift also has equity implications. One such implication is a gradual move toward predictive policing, or the reliance on historical crime patterns as well as community indicators such as income and education, which are often highly correlated with race and ethnicity.
While predictive policing focuses on more efficient deployment of police officers, the debate over the effect of increased police presence continues. A 2015 report from the Brennan Center for Justice at the New York University School of Law sought to identify the factors which caused the decline in crime in the past two decades from its height in 1991. While the report did not find that increased incarceration rates led to a reduction in crime in the 2000s, and only a 6 percent reduction in crime in the 1990s, it identified the use and adoption of CompStat as responsible for a 5-15 percent reduction in crime.
CompStat is the progenitor of today’s predictive policing, first adopted in New York City to find patterns in subway crime in the 1980s.54 While these trends are positive, it is essential for police departments to put in place the correct policies for using and storing the data they are collecting. Data has privacy implications and clear policies for the storage, use, and destruction of that data must exist before it can be used.

40NATIONAL LEAGUE OF CITIES
Data use will be coupled with effective police training, in which there will be a greater emphasis on equity.
Today, the conversations surrounding data and technology, use of force, and policing approaches are wracked with tension. This tension continues to be stoked by a series of violent use-of-force incidents between police officers and civilians, and the social activism of equity focused groups like Black Lives Matter. While new tools such as BWCs and predictive policing models may help to move public safety agencies toward more effective and efficient policing, it is ultimately the training and policies of these police departments that will determine how they support their communities.
Effective public safety requires a strong partnership between communities and the police that protect them. This requires police officers to focus on community partnerships, problem-solving and de-escalation. Currently, police recruits spend an average of 58 hours on firearms training, but only 16 hours on de-escalation and crisis intervention training.55
Officers are encountering mental illness, addiction, domestic violence and terrorism in their communities, each of which requires a unique set of skills and responses. As police officers find themselves in a diverse set of demanding situations, training and local partnerships are essential for understanding their own community’s unique needs and challenges. By 2030, equity will be central to public safety institutions’ values and policies. While technology will empower our police departments, they will need to keep pace in training and evaluation in order to ensure that new tools are used responsibly and to benefit the entire community.

CONCLUSION

As cities embrace a future that is increasingly permeated by technological forces, local leaders will need to continually reassert and revisit community values, and ensure that they remain the foundation of new plans, policies, and programs.
As cities take advantage of new, disruptive technologies, they also need to get serious
about equity. This means comprehensively defining it, determining what it means
and how it might benefit the community, and ensuring it is a priority in every facet of their
administrations, including partnerships with other sectors and outside organizations.
New technological interventions can offer significant value to cities. There is always an
opportunity to channel the forces of new tech to solve challenges for the most vulnerable
populations. Solving problems for these populations often improves life for everyone in a
community, as public problems tend to be collective. Policymakers should remember that
technology is a means rather than an end in and of itself. New technology initiatives must
be aligned with community values and they should be accessible and advantageous to all
populations in a jurisdiction. Furthermore, we must remember that technological forces
are not inherently neutral, and that sometimes their reliance on market forces means that
they impact different communities in different ways. An autonomous vehicle might be
groundbreaking and exciting in a dense urban area and simultaneously wipe out a prominent
sector of the economy in a remote, rural area. For this reason, an acknowledgement of values
and priorities must precede adoption.
Finally, cities should begin with an honest evaluation of how their city is performing across
all departments, programs and policies. As they adopt new technologies and smart city
systems, they should think about whether those new interventions might improve or hinder
existing inequities and biases. Cities are uniquely positioned to lead the nation toward more
equitable outcomes.

• Incorporate equity as a core tenet of future plans while also remaining flexible to take advantage of new, disruptive technologies;
• Embrace technology, but realize it’s not inherently neutral; and
• Actively ensure new technologies don’t reinforce inequity or bias.
Addressing and prioritizing equity takes a great deal of intentionality and sometimes courage on the part of city leaders. As cities move toward a new era of technology and governance, there awaits of great deal of opportunity. Prioritizing equity in city government is a step toward building a stronger, more resilient and prosperous community for everyone.
In summary

45 NATIONAL LEAGUE OF CITIES
THE FUTURE OF EQUITY IN CITIES
Endnotes1 Frey, William H. “White Neighborhoods Get Modestly More Diverse, New Census Data Show” (December 13, 2016), Brookings Institute. Retrieved from https://www.brookings.edu/blog/the-avenue/2016/12/13/white-neighborhoods-get-modestly-more-diverse-new-census-data-show/?utm_campaign=Brookings+Brief&utm_source=hs_email&utm_medium=email&utm_content=39290843 2 Ortman, Jennifer M., Velkoff, Victoria A., and Howard Hogan. An Aging Nation: The Older Population in the United States (Population Estimates and Projections: Current Population Reports), issued May 2014. Retrieved from https://www.census.gov/prod/2014pubs/p25-1140.pdf 3 Center for Transportation Excellence (2017). Transportation Ballot Measures. Retrieved from: http://www.cfte.org/elections4 Freemark, Y. (2017). Openings and Constructions Starts Planned for 2017. The Transport Politic. Retrieved from: https://www.thetransportpolitic.com/2017/01/12/openings-and-construction-starts-planned-for-2017/ 5 Ibid6 DuPuis, N. & Brooks Rainwater 2017). Cities and the Innovation Economy: Perceptions of Local Leaders.7 U.S. Department of Commerce, National Institute of Standards and Technology. (2016). IoT-enabled smart city framework [White paper]. Retrieved from https://s3.amazonaws.com/nist-sgcps/smartcityframework/files/ IoT-EnabledSmartCityFrameworkWP.pdf8 Ibid., p. 3.9 Alabama, Arkansas, California, Colorado, Connecticut, Florida, Georgia, Louisiana, Michigan, Nevada, New York, North Carolina, North Dakota, Pennsylvania, South Carolina, Tennessee, Texas, Utah, Virginia and Vermont and Washington D.C.10 National Conference of State Legislatures (2017). Autonomous Vehicles: Self-Driving Vehicles Enacted Legislation. Access at: http://www.ncsl.org/research/transportation/autonomous-vehicles-self-driving-vehicles-enacted-legislation.aspx11 City of Pittsburgh; Texas AV Proving Grounds Partnership; U.S. Army Aberdeen Test Center; AMC at Willow Run; Contra Costa Transportation Authority and GoMentum Station; San Diego Association of Governments; Iowa City Area Development Group; University of Wisconsin-Madison; Central Florida Automated Vehicle Partners; and North Carolina Turnpike Authority.12 Zolfagharifard, E. (2015). Self-driving cars could be in 30 US cities by 2017: Pilot project aims for mass roll out of driverless vehicles - but how safe are they?. The Daily Mail. [online] Available at: http://www.dailymail.co.uk/sciencetech/article-2981946/Self-driving-cars-30-cities-2017-Pilot-projects-aims-mass-roll-driverless-vehicles-safe-they.html [Accessed 1 Sep. 2017].13 All In Cities. (n.d.). [online] Available at: http://allincities.org/ [Accessed 11 Oct. 2017].14 The ‘curb-cut effect’ refers to the curb cuts or ramps that exist at every intersection that allow pedestrians to make
their way easily across the street. Those curb cuts are a result of some really courageous disability advocates who said “we can’t get in restaurants, we can’t get to work, we can’t pick our kids up from day care, we can’t do all of the things that everybody else does on a daily basis because literally we can’t get there.” As those ramps were installed, it created an opportunity for little kids to cross the street safely, for people who are pushing a stroller, or carrying a hand cart to get the catered food into the office building downtown. Individuals who are just learning how to ride a bike and/or figuring out how to travel the streets safely, individuals who have some limited mobility, even though they might not be in a wheel chair, individuals carrying a suitcase. This is a prime example of how solving a mobility challenge for the most vulnerable populations resulted in improved conditions for a whole host of other people. 15 Congressional Research Service (2016). Mileage-Based Road User Charges. Retrieved from: https://fas.org/sgp/crs/misc/R44540.pdf, p. 2. 16 University Transportation Center for Mobility (2009). Mileage-Based User Fees: Defining a Path toward Implementation Phase 2: An Assessment of Institutional Issues. Retrieved from: http://utcm.tamu.edu/publications/final_reports/Goodin_inst_09-39-07.pdf. p. 30.17 NLC (Forthcoming). Mileage Based User Fees in Cities. 18 Ross, D. (2014). Millennials Don’t Care About Owning Cars, And Car Makers Can’t Figure Out Why. Co.Exist. Retrieved 15 October 2015, from http://www.fastcoexist.com/3027876/millennials-dont-care-about-owning-cars-and-car-makers-cant-figure-out-why19 Ball, J. (2014). The Number of Young People Who Drive is Plummeting in Amazing Ways. The New Republic. Retrieved 15 October 2015, from http://www.newrepublic.com/article/116993/millennials-are-abandoning-cars-bikes-carshare-will-it-stick20 Graves, B. (2015). The Transportation Choices That Millennials Want. Governing.com. Retrieved 15 October 2015, from http://www. governing.com/blogs/view/gov-transportation-choices-millennials-multi-modal.html21 Stoll, Michael A. (2005). Job Sprawl and the Spatial Mismatch between Blacks and Jobs. Washington D.C.: Brookings Institution, Metropolitan Policy Program. Retrieved from: https://law.wustl.edu/landuselaw/Articles/Brookings_jobsprawl.pdf 22 Good Jobs First. Smart Growth, Good Jobs: An Overview. Retrieved from: http://www.goodjobsfirst.org/smart-growth-working-families23 Roberto, E. (2008). Commuting to Opportunity: The Working Poor and Commuting in the United States. Brookings Institution, Metropolitan Policy Program. Retrieved from: https://www.brookings.edu/research/commuting-to-opportunity-the-working-poor-and-commuting-in-the-united-states/ 24 Aycock, J. (2017). Baidu, Jianghuai plan self-driving car production for 2019. [online] Seeking Alpha. Available at: https://seekingalpha.com/news/3292376-baidu-jianghuai-plan-self-driving-car-production-2019 [Accessed 11 Sep. 2017].

46NATIONAL LEAGUE OF CITIES
25 Thompson, C. (2017). Elon Musk: Fully autonomous Tesla will drive across the country by the end of 2017. [online] Business Insider. Available at: http://www.businessinsider.com/elon-musk-autonomous-tesla-drive-across-country-by-end-of-2017-2016-10 [Accessed 11 Sep. 2017].26 McArdle, M. (2015). When Will Self-Driving Trucks Destroy America? BloombergView.com. Retrieved from: http:// www.bloombergview.com/articles/2015-05-27/when-will-self-driving-trucks-destroy-america- 27 Santens, S. (2015). Self-Driving Trucks Are Going to Hit Us Like a Human-Driven Truck — Basic income. Medium. Retrieved from: https://medium.com/basic-income/self-driving-trucks-are-going-to-hit-us-like-a-human-driven-truck-b8507d9c5961 28 Isaac, L. (2016). Automated and Connected Vehicle Tech Offers Promise for Transit Agencies. Metro Magazine. [online] Available at: http://www.metro-magazine.com/management-operations/article/715509/automated-and-connected-vehicle-tech-offers-promise-for-transit-agencies [Accessed 11 Sep. 2017].29 Ibid30 Frey, William H. “White Neighborhoods Get Modestly More Diverse, New Census Data Show” (December 13, 2016), Brookings Institute. Retrieved from https://www.brookings.edu/blog/the-avenue/2016/12/13/white-neighborhoods-get-modestly-more-diverse-new-census-data-show/?utm_campaign=Brookings+Brief&utm_source=hs_email&utm_medium=email&utm_content=39290843 31 Mejia, Brittny. “How Houston Has Become the Most Diverse Place in America” (May 9, 2017), Los Angeles Times. Retrieved from http://www.latimes.com/nation/la-na-houston-diversity-2017-htmlstory.html 32 Ortman, Jennifer M., Velkoff, Victoria A., and Howard Hogan. An Aging Nation: The Older Population in the United States (Population Estimates and Projections: Current Population Reports), issued May 2014. Retrieved from https://www.census.gov/prod/2014pubs/p25-1140.pdf 33 National Equity Atlas. Retrieved from http://nationalequityatlas.org/indicators/Job_and_wage_growth 34 Pendall, Rolf and Turner, Margery Austin. Expanding Access to Economic Opportunity in Fast-Growth Metropolitan Areas. An Urban Institute White Paper (May 2014).35 Program on Retirement Policy, Urban Institute. Retrieved from http://www.urban.org/policy-centers/cross-center-initiatives/program-retirement-policy/projects/data-warehouse/what-future-holds/us-population-aging 36 An Aging Nation37 H-GAC 2016 Forecast38 New York City Population Projections by Age/Sex & Borough: 2000 - 2030 Report. 39 The World Bank, Retrieved from http://data.worldbank.org/indicator/NE.CON.PETC.ZS?end=2015&start=1960 40 Dobbs et. al. McKinsey Global Institute. Urban World: The Global Consumers to Watch (April 2016) Retrieved from http://www.mckinsey.com/global-themes/urbanization/urban-world-cities-and-the-rise-of-the-consuming-class and The Bureau of Economic Analysis. National Income and
Product Accounts, Gross Domestic Product: Fourth Quarter and Annual 2015 (Third Estimate), Corporate Profits: Fourth Quarter and Annual 2015. Retrieved from https://www.bea.gov/newsreleases/national/gdp/2016/gdp4q15_3rd.htm 41 Ibid.42 Federal Deposit Insurance Corporation (2015). 2015 FDIC National Survey of Unbanked and Underbanked Households. Washington, DC: FDIC.43 Smith, A. (2017). Record shares of Americans now own smartphones, have home broadband. [online] Pew Research Center. Available at: http://www.pewresearch.org/fact-tank/2017/01/12/evolution-of-technology/ [Accessed 11 Oct. 2017].44 U.S. Department of Justice, Office of Justice Programs, Bureau of Justice Statistics. Local Police Departments, 2013: Personnel, Policies, and Practices45 Ibid46 DuPuis, N. & Yucel Ors (2016). City Officials Guide to Policing in the 21st Century. National League of Cities. Access from http://www.nlc.org/sites/default/files/2016-12/NLC%20Community%20Policing%20Guide%20updated%2071516_0.pdf 47 National Institute of Justice. “Research on Repeat Crime Risk Leads to Software Tool Development” (January 23, 2017). Accessed from https://nij.gov/topics/law-enforcement/strategies/Pages/research-on-repeat-crime-risk-leads-to-software-tool-development.aspx 48 Andersen, C. (2001). Heat and Crime. Current Directions in Psychological Science, [online] 10(1), pp.33-38. Available at: http://public.psych.iastate.edu/caa/abstracts/2000-2004/01A.pdf [Accessed 1 Nov. 2017].49 Ready, J. T., & Young, J. T. N. (2015). The impact of on-officer video cameras on police–citizen contacts: findings from a controlled experiment in Mesa, AZ. Journal of Experimental Criminology, 11(3), 445-458. 50 Ariel, B., Farrar, W.A. & Sutherland, A. J. (2015) The Effect of Police Body-Worn Cameras on Use of Force and Citizens’ Complaints Against the Police: A Randomized Controlled Trial. Journal of Quantitative Criminology, 31(3), 509-535. 51 Jennings, Wesley G., Lynch, Mathew D., & Fridell, Lorie A. University of Florida (2015). Evaluation the Impact of Police Officer Body-Worn Cameras (BWCs): The Orlando Police Department (OPD) Experience. Journal of Criminal Justice, 43, 480-486.52 Electronic Frontier Foundation. Retrieved from https://www.eff.org/sls/tech/automated-license-plate-readers/faq 53 Ibid.54 Roader, Oliver, Eisen, Lauren-Brooke, and Bowling, Julia. (2015) What Caused the Crime Decline? Brennan Center for Justice, New York University School of Law. Accessed from https://www.brennancenter.org/sites/default/files/analysis/What_Caused_The_Crime_Decline.pdf 55 Critical Issues in Policing Series: Re-Engineering Training On Police Use of Force. (2015) Police Executive Research Forum, p11. Accessed from http://www.policeforum.org/assets/reengineeringtraining1.pdf
NATIONALLEAGUEOF CITIES