the future of the chesapeake bay bridge-tunneljlarc.virginia.gov/pdfs/reports/rpt287.pdfthe future...
TRANSCRIPT
JOINT LEGISLATIVE AUDIT AND REVIEW COMMISSION OF THE VIRGINIA GENERAL ASSEMBLY
The Future of the Chesapeake Bay Bridge-Tunnel

REPORT OF THEJOINT LEGISLATIVE AUDITAND REVIEW COMMISSION
The Future of the Chesapeake Bay Bridge-Tunnel
TO THE GOVERNOR ANDTHE GENERAL ASSEMBLY OF VIRGINIA
HOUSE DOCUMENT NO. 18
COMMONWEALTH OF VIRGINIARICHMOND2003

Members of the Joint Legislative Audit and Review Commission
Chairman Senator Kevin G. Miller
Vice-Chairman Delegate Lacey E. Putney
Delegate Vincent F. Callahan, Jr. Senator John H. Chichester Senator Charles J. Colgan Delegate M. Kirkland Cox
Delegate Frank D. Hargrove, Sr. Delegate Johnny S. Joannou
Delegate Dwight C. Jones Senator Thomas K. Norment, Jr.
Delegate Harry J. Parrish Delegate John A. Rollison III
Senator Walter A. Stosch Delegate Leo C. Wardrup, Jr.
Mr. Walter J. Kucharski, Auditor of Public Accounts
Director Philip A. Leone
COPYRIGHT 2003, COMMONWEALTH OF VIRGINIA

Preface
Since 1964, the Chesapeake Bay Bridge-Tunnel has provided the only direct highway link between the Eastern Shore and the Virginia mainland. Each year, it car-ries more than three million vehicles across the mouth of the Chesapeake Bay, from the City of Virginia Beach at its southern end, to Northampton County at the northern end. The Chesapeake Bay Bridge and Tunnel District operates the facility, providing for capital improvements, maintenance, police and safety patrols, toll collection, and administrative services. Construction and operations have been funded almost entirely from bonds issued by the district and toll revenues collected on the facility. e provides less than one million dollars annually for operations.
Concerns of some Eastern Shore residents about the long-term economic im-
pact of increased traffic resulting from recent toll discounts prompted the 2002 General Assembly to direct this study of the Bridge-Tunnel through House Joint Resolution 210. The Joint Legislative Audit and Review Commission (JLARC) was directed to ex-amine the appropriate role of the facility in the economic growth of the Eastern Shore and the Commonwealth, the appropriate toll structure, and the efficiency of facility op-erations.
Overall, the review found that the construction and operation of the Chesa-
peake Bay Bridge-Tunnel has been a successful endeavor. ty provides an es-sential link between the Eastern Shore and the mainland, supporting the agricultural economy on the Shore, and tourism on both sides of the bay. Given its importance to transportation in the region, the review also found that the appropriate role for the Bridge-Tunnel in economic growth is to ensure a safe, convenient, low-cost link be-tween the Shore and the mainland. neral Assembly has not authorized the Bridge-Tunnel district to involve itself in growth management or economic develop-ment, either as part of its operations or through the toll structure. The business and government leaders on the Eastern Shore interviewed for this study expect the local governments to be responsible for growth management, not the Bridge-Tunnel district.
The review also found that the toll structure provides adequate revenue for
operations, maintenance, and existing debt service. However, it may not provide ade-quate revenue for future capital expansion if parallel tunnels are needed by the year 2020. The report recommends that the district begin the process now for development of a long-range capital plan to address future facility needs and funding. Maintenance and operations of the facility were found generally appropriate. Improvements were recommended for toll and emergency staffing, facility security, major maintenance pro-jects, and administration of the district’s personnel management.
On behalf of the Commission staff, I wish to express our appreciation for the
assistance of the staffs of the Chesapeake Bay Bridge-Tunnel, the Virginia Department of sportation, the ond Metropolitan uthority, and the ccomack-Northampton Planning District Commission in the completion of this report.
Philip A. Leone
January 2, 2003
The Stat
The facili
The Ge
Tran Richm A A

i
JLARC Report Summary
he e Bay Bridge-Tunnel (CBBT) is a 17.6-mile long facility consisting of highways, bridges, and tunnels connecting the Eastern Shore of Virginia with the Virginia mainland. The Bridge-Tunnel was opened to traffic in 1964, replacing the ferry service that had served the Eastern Shore for more than 30 years. The facility was expanded in the late 1990s to include parallel bridges, which were opened to traffic in April 1999. Being the longest combination of bridges and tunnels in the world, it stretches beyond the horizon, and offers motorists a drive across open ocean (see figure below). It is designated as U.S. Route 13, a primary arterial, and is part of Virginia’s National Highway System. The CBBT is operated
as a toll facility by the Chesapeake Bay Bridge and Tunnel District, a political subdivision of the Commonwealth of Virginia.
The trict commission were created by the General Assembly, and the State provides almost $1.0 million annually in urban street funding for the facility. General Assembly has never reviewed the operations of the Bridge-Tunnel in its 38-year history. With the recent controversy surrounding the toll structure and economic impact of the facility on the Eastern Shore, the Assembly directed the Joint Legislative Audit and Review Commission (JLARC) to complete this study of the future of the ke Bay HJR 210 specifically directed a review of: the appropriate role of the Bridge-Tunnel in the economic Eastern Shore and the Commonwealth; the appropriate toll structure to ensure proper funding for the facility; the efficiency and efficacy of the district’s policies, practices, and operations; and the appropriate State role in determining the future of the Bridge-Tunnel.
Overall, this review found that the Chesapeake Bay Bridge-Tunnel
has fulfilled its original mission to pro-vide a convenient connection between the Eastern Shore and the Virginia mainland that supports commerce in the region. The facility appears to be generally well maintained and operated, although this report recommends several improvements. The toll structure appears sound, providing adequate revenue for operations, maintenance, debt service. Looking however, the Chesapeake Bay Bridge and Tunnel Commission will need to examine long-term capital requirements for the facility, and take the necessary actions to ensure that the district is financially prepared to meet those
The Future of the Chesapeake Bay
Bridge-Tunnel
The Joint Legislative Audit and Review Commission
January 2003
T Chesapeak
dis and
Chesapea
its governing
Yet, the
2002 General
Bridge-Tunnel.
growth of the
has been a largely successful endeavor. It
and to the future,
require-

The Chesapeake Bay Bridge Tunnel
The Thimble Shoal Tunnel and fishing pier, looking north.
The North Channel bridges, looking south toward the Chesapeake Channel Tunnel.
Source: Chesapeake Bay Bridge and Tunnel District.
ments. To further the role of the commission in meeting future challenges, the Virginia General Assembly will need to establish the commission as the permanent governing body for the district, and authorize the continued use of tolls for operation and maintenance of the facility.
Overview and History of the Chesapeake Bay Bridge-Tunnel
For more than 250 years, the Chesapeake Bay has posed an obstacle to travel to and from Virginia’s Eastern Shore. Various packet ships and steamers provided passenger and freight service from the early 1700s, but in 1933 the Virginia Ferry Corporation began the first regular vehicular ferry service. By 1953, growing numbers of passengers and vehicles transported by ferry prompted the General Assembly to create the Chesapeake Bay Ferry District to purchase and operate the ferry service. The Chesapeake Bay Ferry Commission was established as the governing body for the district. Then, in response to the growing demands on the ferry service, the 1956 General Assembly authorized the ferry commission to
finance and construct a bridge-tunnel for vehicular traffic from the Eastern Shore to the Virginia mainland. The ferries continued in operation until April 14, 1964, when the Bridge-Tunnel opened to traffic.
The Chesapeake Bay Bridge-Tunnel was constructed in two phases, spanning more than 39 years. The original facility, completed in the mid-1960s, consisted of two-lane trestle bridges and tunnels. Parallel trestles were completed in the late 1990s, making the facility a four-lane divided high-way except for the two miles of tunnel and two miles of tunnel approaches, which remain two lanes.
The Chesapeake Bay Bridge and Tunnel Commission is the governing body for the district. Its 11 members include two members each from Northampton and Accomack counties; one member each from the cities of Virginia Beach, Norfolk, Portsmouth, Chesapeake, Hampton, and Newport News; and one member from the Common-wealth Transportation Board. Members are appointed by the Governor for four-year terms. Operation of the CBBT is the responsibility of 165 employees, in
ii

cluding toll collectors, police officers, maintenance workers, administrators, and others. The staff organization is headed by an executive director, who reports to the CBBT commission.
In FY 2002, 3,294,480 vehicles used the Bridge-Tunnel. About 88.6 percent of that traffic was cars and light trucks. The remaining portion of traffic was from heavy trucks of various lengths and axle combinations. The largest single source of revenue for the district is from tolls on use of the facility. The CBBT toll structure is based on the number of axles of the vehicles using the facility, and ranges from $10 for passenger cars to $36 for six-axle trucks. In FY 2002, toll revenue totaled $38.4 million.
The Appropriate Role for the CBBT in Economic Growth Is to Ensure a Safe, Convenient, Low-Cost Link Between the Eastern Shore and the Virginia Mainland
HJR 210 directed JLARC to determine “the appropriate role of the CBBT in the economic growth and development generally in the Common-wealth and especially on the Eastern Shore.” This requirement arose in the context of the controversy over modification of the Bridge-Tunnel toll structure, which some saw as an action in-tended to promote the development of the lower end of Northampton County. Those who favor development view the toll as a barrier, and seek to reduce tolls and implement commuter discounts, which would make daily travel across the bay more economical for those who might want to live on the Eastern Shore and work on the Virginia mainland. Those who do not favor development prefer to retain a toll structure without reductions and without commuter discounts. In other words, they agree that the toll is a barrier to development, and want that barrier to remain in place. Their concern is that development will be detrimental to the rural quality of life for current residents.
Based on the JLARC staff review, it appears that the CBBT is essential to the economic well being of the Eastern Shore, and plays an important role in tourism in Virginia Beach. However, a JLARC staff analysis indicates that there is little measurable impact of changes in Bridge-Tunnel traffic on the economies either of the Eastern Shore or of Hampton Roads. Further, government and business leaders interviewed by JLARC staff for this review have concluded that CBBT tolls have little direct impact on employment, business decisions, or the future of economic growth. Instead, the overwhelming consensus was that the importance of the CBBT is in its presence as an essential link between the Eastern Shore and the Virginia main-land.
Moreover, the Acts of Assembly explicitly authorize the CBBT commission to “fix, revise, charge and collect tolls” for two purposes: (a) to pay the cost of maintaining, repairing, and operating the facility, and (b) to pay the principal of and interest on bonds issued by the commission, and to create reserves for those purposes. Therefore, the commission is not authorized to revise the toll structure for the purpose of either promoting or discouraging economic development. Rather, the obligation of the commission is to collect the lowest possible toll which provides sufficient funds for the purposes set out in law. Accordingly, the appropriate role for the CBBT in the economic growth of the Eastern Shore and the Common-wealth is to ensure a safe, convenient, low-cost link to the Virginia mainland.
Based on this review, the expectation is that local governments on the Eastern Shore will need to manage economic growth and development, not the Chesapeake Bay Bridge and Tunnel Commission. Therefore, the question of the appropriateness of the toll structure can be narrowly focused. An appropriate toll structure for the Chesapeake Bay Bridge-Tunnel is one which provides sufficient revenue to support the
iii

lowest practical costs for operations, maintenance, debt service, and future capital requirements.
The CBBT Toll StructureIs Adequate for Operations, Maintenance, and Debt Service
To assess the adequacy of toll revenues for the Chesapeake Bay Bridge-Tunnel, JLARC staff examined the district’s revenues and expenses over the short, intermediate, and long term. The short-term analysis focused on FY 2002. In that year, toll revenues totaled $38.4 million. Total expenses, including ordinary maintenance, maintenance reserve projects, operations, and debt service, totaled $26.8 million. This resulted in net toll revenue of $11.6 mil-lion, which is accumulated in the district’s general fund. Currently then, toll revenues are adequate to cover CBBT costs, even without other sources of in-come such as returns on investments or the urban street payments from VDOT.
The intermediate-term assessment was based on a CBBT staff projection of revenues to assess whether the district’s bonds could be defeased early. Over the ten years in the CBBT projection, toll and other revenues are estimated to total almost $468 million. Operating expenses, reserve maintenance, debt service, and other costs are projected at $359 million. Thus, the CBBT intermediate-term projections demonstrate that toll revenues are more than adequate through 2012.
JLARC staff also completed a long-term analysis of the adequacy of toll revenues through 2025, the year that the district’s current debt service requirements will be satisfied. The analysis involved a projection of CBBT traffic, estimates of toll revenue based on the traffic projections, and estimates of costs for operating, maintenance, and debt service. JLARC staff also made projections of other revenue sources, such as urban street payments from VDOT and interest on investments. The traffic projections were based on a series of regression models designed to
explain the seasonal and long-term trends in the traffic data from prior years.
The long-term projection of costs and revenues indicates that the CBBT revenue stream is more than adequate for the period well beyond 2025. Over the 23-year period of the projection, there is no year in which revenues are less than estimated expenses. Toll revenue for the entire period is estimated to total just over $1.0 billion, and the total of all revenue is estimated at $1.3 billion. Total expenses are estimated to total about $900 million for the period. As a result, the CBBT general fund could accumulate a cash balance of about $450 million.
Future Capital Improvements Will Depend on Available Funding
While the toll structure is more than adequate for the current and future cost of operations, maintenance, and debt service, it may be inadequate to fund future capital improvements. Specifically, the costs to construct parallel tunnels may exceed the funds the district will have available, depending on when those additional facilities will be needed. To assess the adequacy of the toll structure to support construction of the tunnels, JLARC staff first examined the need for, and timing of, construction of the tunnels based on four criteria: increases in traffic, improvements to safety, tunnel maintenance, and the future need for deeper shipping channels in the bay.
The traffic models developed by JLARC staff were used to project monthly traffic volume through the year 2025. Based on those projections, it appears that traffic congestion and unstable traffic flow will become a significant problem by 2020. The analysis of accident data, maintenance requirements, and a study of channel depths by the Virginia Port Authority found no justification for advancing the completion of tunnel construction prior to the year 2020. Engineering and construction of the parallel tunnels is estimated by
iv

CBBT staff to take approximately six to eight years. Therefore, to have the tunnels open to traffic by 2020, the planning and engineering would need to be-gin by 2012, and construction by 2014.
The district’s ability to fund construction of the tunnels is dependent on two factors: the general fund balance (cash), and the capacity to issue debt. Both the general fund balance and the district's bonding capacity are dependent on toll revenues. To assess the adequacy of CBBT revenues to fund the construction of the parallel tunnels, JLARC staff: (1) estimated the cost of engineering and construction of the tunnels in future years, (2) projected general fund balances and bonding capacity for the district, and (3) compared the estimated costs of construction to the available funding.
The table below shows the avail-ability of funding for construction of the tunnels in five-year increments through 2025, as well as in 2014 -- the year construction would need to begin in order for the tunnels to be open to traffic by 2020. In 2014, the district will likely have insufficient funds available to begin construction of the tunnels, with a short-fall of cash and bonding capacity of about $103 million. With the current revenue stream, sufficient funding will not likely be available until 2020. The shortfall in revenue is due to the general inadequacy of toll rates, as well as the 24-hour round trip discount implemented
in March 2002. A survey of motorists by JLARC staff found that few of the motorists using the discount were induced by the lower toll, but rather would have made the trips on the CBBT regardless. Using the JLARC staff projections of monthly traffic in FY 2003, the 24-hour discount will likely result in a loss of revenue of about $2 million annually.
The District Needs to Develop a Long-Range Capital Plan
In interviews with JLARC staff, several members of the CBBT commission raised concerns about the implementation of the 24-hour round trip discount in the absence of a long-range capital plan. They also expressed concern about the expansion of the discount to vehicles making round trips within 72 hours, a proposal now under consideration by the commission. The specific concern was that the discount could mean that the decision regarding when the parallel tunnels should be built would be driven solely by the availability of funds, rather than by a careful consideration of traffic, safety, and other requirements.
Since the analysis for this report shows that parallel tunnels may be needed by 2020 and that current revenues are likely insufficient to fund such a project, the commission should begin the process to evaluate alternatives to address future capital needs. In developing a long-range capital plan the
Funding Available for Construction of Parallel Tunnels (In $Millions, Current Toll Rates)
General Debt Total Tunnel Funding Fund Total Debt Principal Capacity Funds Construction (Shortage)/
Year Balance Capacity Outstanding Available Available Costs Excess
2002 $ 64.2 $315 $218.7 $ 96.3 $160.5 $468.9 $(308.4) 2010 119.9 390 114.9 275.1 395.0 558.1 (163.1) 2014 220.8 399 113.7 285.3 506.1 608.8 (102.7) 2015 246.8 409 113.2 295.8 542.6 622.2 (79.6) 2020 350.8 449 71.5 377.5 728.3 693.8 34.5 2025 450.5 453 0 453.0 903.5 773.5 130.0
v

commission could consider at least three alternatives:
• Do not build the tunnels for the next 25 to 35 years, and implement toll reductions over time.
• Build the tunnels when revenues are sufficient, probably in the year 2020.
• Increase tolls to advance construction to an earlier date, such as 2014.
The full report examines how toll in-creases can be used to provide the funding necessary for construction of the tunnels. Recommendations in the report call for the CBBT commission to develop a long-range capital plan which includes a financial analysis of alternatives to fund future capital requirements. Pending completion of the capital plan, it is recommended that the commission delay further consideration of toll discounts.
CBBT Operations Are Generally Sound, But Some Staffing Efficiencies Are Possible
Overall, this review found that Bridge-Tunnel operations are generally effective with regard to toll collections, law enforcement, and emergency response. Appropriate policies and procedures are in use to ensure that toll receipts are collected, secured, and accounted for properly. Police officers appear to be properly trained and are certified by the Department of Criminal Justice Services. Comprehensive policies related to law enforcement have been developed and the district has necessary equipment and vehicles to implement the law enforcement function. The district has also developed an appropriate emergency response function, with staff who appear adequately trained, and with the necessary equipment to respond to accidents, fires, and other emergencies.
Some staffing efficiencies in toll collections and emergency response are possible, however. For example, toll collections staffing could be improved by greater use of part-time positions to better match staffing to workload. JLARC staff completed a detailed analysis of traffic entering the plazas in each hour for one full week in each of the past 12 months of operation. Based on that analysis, it appears that toll collection staffing is inadequate during peak summer months. In fact, during some peak traffic days on the weekends in July and August, the CBBT has too few toll lanes to handle the traffic, even if additional staff were available. On the other hand, toll collections staffing appears to be excessive for most of the rest of the year, when traffic is much less than in the peak summer months. The district needs to restructure staffing for toll collections and also be more flexible in its scheduling of work shifts to better match staffing with the daily changes in traffic volume.
Based on the current duties of emergency crew workers, use of leave, and requirements for training, the district appears to need 24 full-time equivalent emergency crew positions, instead of the 26 positions in the current organization. Since three of the 26 positions are currently vacant, the district can adjust the authorized number of positions with-out having to reduce the actual number of emergency workers employed. Installation of modern video surveillance cameras in the tunnels could also eliminate the need for emergency crew workers to patrol the tunnels and would improve the district’s monitoring of traffic. With the installation of cameras, an additional five FTE positions could be redeployed to other duties or eliminated.
An analysis of police staffing found that it appears reasonable, with appropriate levels of supervision for toll, emergency, and law enforcement functions. Based on the current duties of officers, use of leave, requirements for training and court attendance, and the
vi

level of traffic on the Bridge-Tunnel, the district appears to need a minimum of 43 full-time equivalent police positions. While some minimal reduction in police positions is possible, the current overall level of staffing will be necessary as long as the existing toll collections, emergency response, and law enforcement functions are needed. Moreover, if the district is to address the current situation with excessive speeds, greater patrol visibility may be appropriate. Therefore, no changes in the overall level of police staffing are recommended at this time.
Improvements Are Needed in Enforcement of Speed Limits, Facility Security, and Disaster Response
Three areas of concern were identified in the review of CBBT operations. First, the parallel trestles appear to have resulted in increased speeds which could endanger motorists using the Bridge-Tunnel. This finding is based on a JLARC staff analysis of traffic summonses issued by CBBT police officers before and after the parallel bridges were built. In calendar year 1994, the last full year of operation prior to construction of the parallel bridges, CBBT police officers cited 428 motorists for reckless driving for speeds in excess of 75 miles per hour. In contrast, in calendar year 2000, the first full year of operation after the parallel bridges were opened, police wrote 2,030 summonses for reckless driving. Of those, 203 were for speeds in excess of 90 miles per hour, and 36 were for speeds in excess of 100. The report recommends that the district take steps to reduce speeds, including enhanced and more visible police patrols, the use of radar/speed signs which warn motorists of their actual speeds in comparison to the posted speed limit, and reduction of the tolerance above the posted speed limit.
Second, a review of the Bridge-Tunnel's security strategy found that little has been done to secure the facility despite its status as a major transporta
tion system and its location near several military installations. No formal risk assessment has been completed by the district. Because risks have not been evaluated, the district has not examined countermeasures appropriate to various threat levels. It is recommended that the commission develop a comprehensive security strategy.
Third, the most recent revision of the CBBT emergency action plan provides general guidance in the event of a natural disaster, such as a hurricane, or an accident, such as a ship collision with the facility. The plan does a good job of outlining the general responsibilities of the divisions in responding to emergencies, contains a comprehensive directory of contacts in various public safety, emergency, and military organizations, and outlines how the public should be notified of a closure. However, the plan is silent on emerging threats, such as the intentional release of chemical, biological, or radiological agents. How employees respond to such hazards could be critical in reducing casualties among district employees and users of the facility. This review also found that CBBT staff have not participated in disaster or other emergency action plan training or exercises. The report recommends that the district revise its emergency action plan to address emerging threats, and train employees on implementation of the plan.
Capital Improvements Are Needed to Improve Operations
While the toll plaza buildings appeared generally adequate for toll operations, they are inadequate for police operations. There is no office area for the shift supervisor, who is responsible for all toll, emergency, and police operations for the facility. The general layout of the buildings is also a problem, with the vault and workroom for toll collectors accessible only through the control room, and the vaults opening into public view at the entrance to the control rooms. Also of particular concern is the lack of secure holding areas for persons
vii

placed under arrest by CBBT police officers pending transfer to a local jail. As a result, police officers reported that persons under arrest are sometimes held in the toll plaza buildings in the lobby area or the employee break rooms. Officers reported that this can be a serious problem if more than one person is under custody. The report recommends that replacement or renovation of the toll plaza buildings be considered as part of the long-range capital plan. The renovation of the toll plaza areas should include additional lanes and installation of the Smart Tag electronic toll collection system.
The CBBT Maintenance Program Is Adequate, But Some Reserve Maintenance Projects Should Be Accelerated
The JLARC staff examination of district assets confirmed that the maintenance program keeps the facility in generally good repair. Roadway surfaces are smooth and well maintained, ventilation and pump equipment appeared in good condition, and with a few exceptions, buildings appeared clean and well maintained. In interviews with CBBT commissioners, all considered the maintenance program to be successful in keeping the district’s facilities in good condition.
In several on-site assessments of CBBT facilities, however, JLARC staff
confirmed the need for several major maintenance projects. The need for these repairs was identified by the district's consulting engineer, but have not been addressed because of the construction of the parallel bridges. With that construction completed, the district needs to refocus its attention on maintenance projects too long delayed. Among the most critical of the needed maintenance projects are: (1) repairs to the pilings on the southern-most portion of the trestle between the Virginia Beach shoreline and the first island; (2) renovation of the tunnel interiors, including re-pairs to concrete, replacement of broken tile, replacement of metal frames, doors, handrails, and other components, and repaving of the asphalt road surfaces; and (3) repairs to the interior concrete and exterior brick in the ventilation building walls. The current condition of some of these assets is shown in the photo-graphs below.
The district has significant funds available to complete needed repairs. The reserve maintenance fund had a balance of approximately $4.5 million at the end of FY 2002, which is insufficient for the projects which should be accelerated. However, the commission can transfer additional funds from the CBBT general fund to the reserve maintenance fund at any time. The FY 2002 balance of the general fund was approximately $65 million, which is available for trans-
Tunnel and Bridge Maintenance Needs
viii

fer as needed. Since toll revenues exceed operating costs and debt service, additional funds will be available over the course of the major reserve maintenance projects. The report recommends that the commission accelerate completion of critical maintenance projects.
The District Does Not Have an Employee Evaluation Process
With 165 employees, across a broad range of occupations, skill levels, and responsibilities, the district faces a significant challenge to evaluate work performance. In addressing the challenge, the district has chosen to decentralize the process, relying on individual supervisors. As a result, it is not clear that employee performance is evaluated on a regular, consistent basis, if at all. To implement an employee performance system and to improve personnel management generally, a new focus on human resources management by the district may be needed. The report recommends development of a written evaluation system for all employees, to be implemented by a new human re-sources division.
Salaries and Benefits Are Comparable to Other Public Agencies
JLARC staff undertook a limited comparison of salaries for several positions in the administrative, operational, and maintenance areas. Non-law enforcement positions were compared with similar positions at the Hampton Roads Bridge-Tunnel (VDOT), and the Richmond Metropolitan Authority (RMA). Those comparisons confirmed that salaries are generally in line with other public agencies. For CBBT police officers, a comparison was made with the salary scale authorized by the State Compensation Board for deputy sheriffs with law enforcement responsibilities. Specifically, the salary scale as used for supervisory and other deputies in Northampton County were the basis for the analysis. As with the salaries for other positions, the comparison found that the
salaries for police officers are comparable to those of deputy sheriffs.
Employee benefits also appear adequate and comparable to those for employees of other public agencies, except that CBBT police officers have not been provided the enhanced benefits provided by the Local Enforcement Officers Retirement System (LEOS) administered by VRS. The enhanced benefit consists of unreduced retirement at age 50 with 25 years of service, rather than 30 years of service as required in the regular VRS program, as well as a supplement currently valued at about $9,800 annually. A review by VRS found that most police officers in Virginia receive the enhanced benefits. The incremental cost for the district to implement LEOS coverage for uniformed police officers is estimated by JLARC staff to be about $359,000 annually.
The Commission Could Enhance Public Participation
A review of CBBT commission minutes for meetings since January 2000 showed that the commission has regularly provided the opportunity for public comment at each of its monthly meetings. However, in considering changes to the operation of the facility that could generate significant public concern, the commission may need to do more to facilitate public participation. For example, the commission might want to hold public hearings for all changes in the toll structure or traffic regulations, such as speed limits. To maximize public participation, the commission should consider conducting the hearings in the evening, at convenient locations on the Eastern Shore and in Hampton Roads.
The State Role Regarding the CBBT Should Be Limited
This review found that the Bridge-Tunnel is generally well maintained and operated. The evidence suggests that the commission and its staff have discharged their duties only in the interests of the facility and its users. While this
ix

review found the need for some improvements to certain operational and administrative functions, the findings of this report do not point to any failure of the commission to carry out the responsibilities delegated to it by the General Assembly. In the absence of any evidence that the State needs to intervene in the operation of the facility or to pro-vide additional funding, there appears to be no compelling reason for the General Assembly to change the nature of the State role vis-à-vis the Bridge-Tunnel.
Accordingly, the primary State role with regard to the Chesapeake Bay Bridge-Tunnel should be limited to providing the statutory framework for the CBBT commission and staff to carry out essential functions related to finance, maintenance, and operations.
Given the inability of the State to fund future capital requirements of the CBBT, the district and commission should be retained to operate and maintain the Bridge-Tunnel as a toll facility in perpetuity.
x

Table of Contents
Page
I. INTRODUCTION ……………………...……………………………………….. 1
Overview of the Chesapeake Bay Bridge-Tunnel …………………..………. 3Funding of Bridge-Tunnel Construction and Operations ……..…………... 10Prior Studies of the Chesapeake Bay Bridge-Tunnel ..…………………….. 15JLARC Review and Report Organization ………………………………..….. 18
II. ROLE OF THE BRIDGE-TUNNEL IN ECONOMIC GROWTH ……. 23
The Local Economies in the CBBT District ………………………………….. 24The Relationship Between the CBBT and Economic Growth …………….. 27CBBT Tolls Cannot Be Used to Restrict or Enhance Growth …………….. 30
III. THE BRIDGE-TUNNEL TOLL STRUCTURE ………………………….. 33
Overview of the CBBT Toll Structure ………………………………………… 33CBBT Tolls in Context …………………………………………………………... 35Tolls Are Adequate for Operations, Maintenance, and Debt Service ……. 37Future Capital Improvements Will Depend on Available Funding ……… 39The District Needs to Develop a Long-Range Capital Plan ……………….. 47
IV. TOLL, POLICE, AND EMERGENCY OPERATIONS ………………… 51
Overview of CBBT Operations …………………………………..…………….. 52Toll Operations and Staffing …………………………………………………… 55Police Operations and Staffing ………….……………………………………... 57Emergency Response Operations and Staffing ……………………………… 62Security and Disaster Response ……………………………………………….. 65Certain Capital Improvements Should Be Considered
to Improve Operations ……………………………………………………….. 68
V. THE BRIDGE-TUNNEL MAINTENANCE PROGRAM ……………… 71
Overview of the CBBT Maintenance Program ……………………..……….. 72The District Completes Required Inspections of Assets …………………... 74The Ordinary Maintenance Program Appears Adequate …………………. 76Certain Reserve Maintenance Projects Should Be Accelerated ………….. 78
V. GENERAL ADMINISTRATION AND GOVERNANCE ……………… 87
The CBBT Has Developed Appropriate Administrative Policies …………. 88The CBBT Does Not Have an Employee Evaluation Process …………….. 89CBBT Salaries Are Comparable to Other Public Agencies ……………….. 91Employee Benefits Are Generally Appropriate ……………………………… 93The Commission Could Enhance Public Participation in Decision Making 94State Role in the Future of the CBBT ………………………………………… 95
APPENDIXES .……………………………………………...…………………………... 97

Page 1 Chapter I: Introduction
I. Introduction
On April 15, 1964, after three and one-half years of construction, the Chesapeake Bay Bridge-Tunnel (CBBT) was opened to traffic, replacing the ferry service that had served the Eastern Shore of Virginia for more than 30 years. The facility was expanded in the late 1990s to include parallel bridges, which were opened to traffic in April 1999. The 17.6 mile long bridge and tunnel facility connects Virginia’s Eastern Shore with the City of Virginia Beach on the Virginia mainland (Figure 1). Being the longest combination of bridges and tunnels in the world, it stretches beyond the horizon, and offers motorists a drive across open ocean (Figure 2, next page). It is designated as U.S. Route 13, a primary arterial, and is part of Virginia’s National Highway System. The CBBT is operated as a toll facility by the Chesapeake Bay Bridge and Tunnel District, a political subdivision of the Commonwealth of Virginia.
While the district and its governing commission were created by Acts of Assembly and the State provides almost $1.0 million in annual urban street funding for the facility, the General Assembly has never reviewed the operations of the Bridge-Tunnel in its 38-year history. With the recent controversy surrounding the toll structure and economic impact of the facility on the Eastern Shore, the 2002 General Assembly directed the Joint Legislative Audit and Review Commission (JLARC) to complete a study of the future of the Chesapeake Bay Bridge-Tunnel.
Figure 1 The Chesapeake Bay Bridge-Tunnel
Atlantic Ocean
Chesapeake Bay
N
City of Virginia Beach
Northampton County
Fisherman Island National Wildlife Refuge
Thimble Shoal Tunnel
Chesapeake Channel Tunnel
North Channel Bridges
Administrative Offices/Maintenance Facilities
Restaurant Fishing Pier
Fisherman Inlet Bridges
Parallel Trestle Bridges
Parallel Trestle Bridges
Parallel Trestle Bridges
1313
1313
Source: JLARC staff illustration.

Page 2 Chapter I: Introduction
Figure 2 The Chesapeake Bay Bridge Tunnel
a. Thimble Shoal Tunnel and fishing pier, looking north.
b. North Channel bridges, looking south toward the Chesapeake Channel Tunnel.
Source: Chesapeake Bay Bridge and Tunnel District.
House Joint Resolution 210 (Appendix A) directs JLARC to examine the findings of recent studies relative to the Bridge-Tunnel and to issue recommendations regarding the appropriate State role in determining the future of the facility. The study is to specifically address three key issue areas:
1. The appropriate role for the CBBT in the economic growth and development generally in the Commonwealth and especially on the Eastern Shore;
2. An appropriate toll structure to ensure proper maintenance, sustain CBBT operations, meet debt obligations, and plan for needed capital improvements; and
3. The efficiency and efficacy of overall commission management policy, practices, and operations.
HRJ 210 also notes a need for the General Assembly to assess the operations of the CBBT, including procurement, employment and hiring, salary structure, and police and security force staffing. JLARC was required to submit its findings and recommendations to the Governor and the 2003 Session of the General Assembly by November 30, 2002.
This report addresses the broad range of issues called for in HJR 210, including the role of the Bridge-Tunnel in the economic growth and development of the Eastern Shore. This chapter provides an overview of the Bridge-Tunnel, a discussion of prior studies related to the facility, and a summary of the research completed by JLARC staff to address the study issues.

Page 3 Chapter I: Introduction
OVERVIEW OF THE CHESAPEAKE BAY BRIDGE-TUNNEL
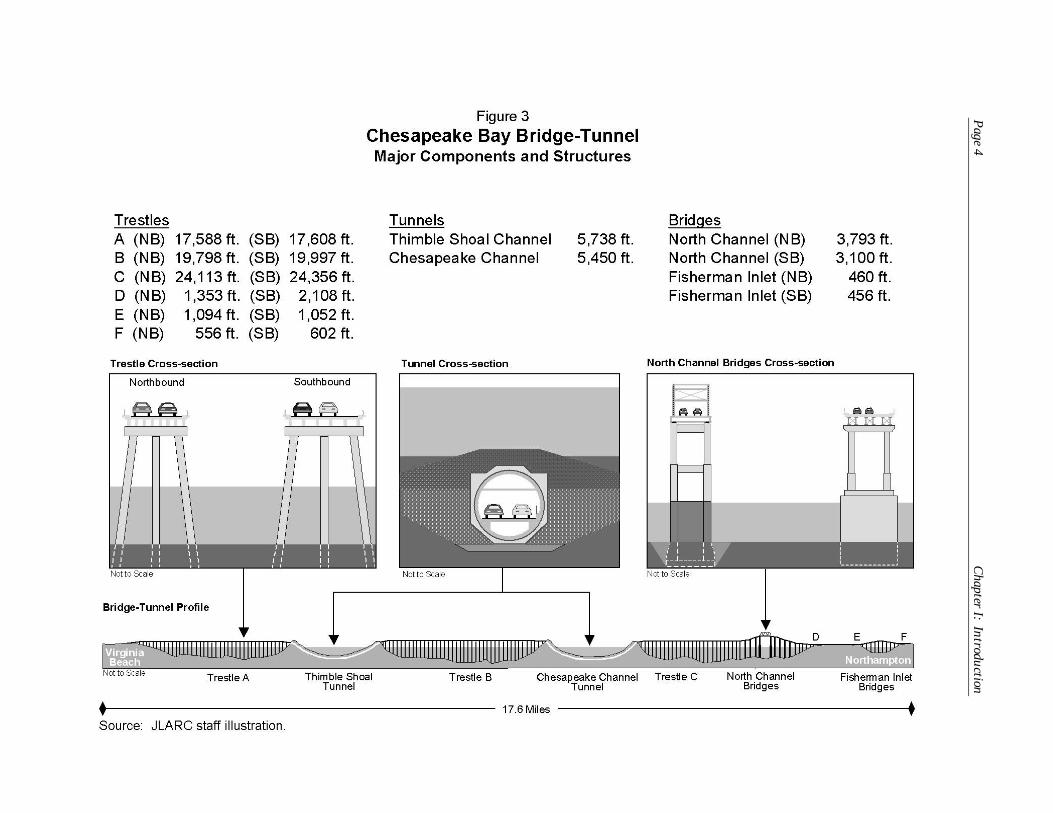
The Chesapeake Bay Bridge-Tunnel is a 17.6-mile long facility consisting of a combination of highways, bridges, and tunnels to span the mouth of the Chesapeake Bay. Among the key structures are six pairs of low-level trestles, two one-mile long tunnels, four man-made islands, four bridges, and several miles of four-lane divided highway approaches. The facility also includes a restaurant, a fishing pier, a rest area and parking lot, two toll plazas and plaza buildings, maintenance support facilities, and administrative offices. Figure 3 illustrates some of the major components of the facility, as well as a profile of the entire Bridge-Tunnel.
Construction of the original facility in 1964 and the subsequent parallel structure in 1999 were financed with bonded debt; no federal, State, or local transportation funds were used. More than 3.2 million vehicles used the Bridge-Tunnel in FY 2002, generating about $38.4 million in toll revenues. Tolls on the facility range from $10 for passenger cars to $36 for six-axle heavy trucks. The Bridge-Tunnel staff organization of 165 employees consists of toll collectors, maintenance personnel, police officers, and administrative staff. Its administrative offices are located at the north end of the facility in Northampton County.
The Chesapeake Bay Ferries
For more than 250 years, the Chesapeake Bay has posed an obstacle to travel to and from Virginia’s Eastern Shore. Packet ships provided service between the Eastern Shore and York, Norfolk, and Old Point Comfort in Hampton as early as 1705. So-called bay steamers, operated by the Pennsylvania Railroad, began providing regular service from Cape Charles in 1880. Then in 1933, the Virginia Ferry Corporation began regular vehicular ferry service. Initially, the service consisted of one ferry, which made six one-way crossings daily. Bay steamers continued to pro-vide passenger and freight service.
With termination of steamer service by the Pennsylvania Railroad in 1953, and with the number of passengers and vehicles transported by ferry increasing steadily, the Virginia General Assembly created the Chesapeake Bay Ferry District. The Chesapeake Bay Ferry Commission was established as the governing body for the district. The commission was authorized to acquire the private ferry corporation through bond financing, improve the existing ferry service from Kiptopeke on the Eastern Shore to Little Creek in Princess Anne County (now Virginia Beach), and to re-establish service between the Eastern Shore and Old Point Comfort in Hampton.
The district operated seven ferries, which could carry between 66 and 104 cars and up to 1,200 passengers (Figure 4). The one-way trip from Kiptopeke to Little Creek took approximately one and one-half hours, with an additional half hour for unloading and loading of vehicles at the terminal. The service ran every half hour during the day, and every hour at night. The toll was $3.00 per passenger vehicle and $0.85 for each passenger. Other vehicles paid according to length. A
Page 4
Chapter I: Introduction

Page 5 Chapter I: Introduction
Figure 4 The Chesapeake Bay Ferries
S.S. Pocahontas, one of seven ferries that provided service to the Eastern Shore.
Crossing the bay by ferry.
Source: Chesapeake Bay Bridge and Tunnel District.
tractor-trailer combination between 75 and 80 feet in length paid $34 for example. In February 1958, additional service was provided from Kiptopeke to Hampton. In 1963, the last full year of operation, the ferries carried 731,215 vehicles.
In response to the growing demands on the ferry service, the 1956 General Assembly authorized the ferry commission to finance and construct a bridge, tunnel, or combination for vehicular traffic from Northampton County on the Eastern Shore to any location within the district on the Virginia mainland. The ferries would continue in operation by the district until April 14, 1964. After the opening of the Bridge-Tunnel, four of the ferries were sold for $3.3 million to the Delaware River and Bay Authority (DRBA) for service between Lewes, Delaware and Cape May, New Jersey (the original ferries have been replaced by the DRBA and are no longer in service).
Construction of the Chesapeake Bay Bridge-Tunnel
The Chesapeake Bay Bridge-Tunnel was constructed in two phases, spanning more than 39 years. The original facility, completed in the mid-1960s, consisted of the two-lane trestle bridges and the tunnels. Parallel trestles were completed in the late 1990s, making the facility a four-lane divided highway except for the two miles of tunnel.
Construction of the Original Facility. Construction of the original Bridge-Tunnel began in September 1960 and was completed in April 1964. The two lane trestle bridges were erected from prefabricated concrete components manufactured at a plant constructed in Northampton County specifically for that purpose (Figures 5a and 5b). The concrete plant continues to operate today as one of the major employers in the county. Each trestle bent (bridge support) consists of three pilings and a horizontal concrete cap (Figure 5c). The concrete pilings, up to 172 feet in length, were driven into the floor of the bay, and then the cap was added to complete

Page 6 Chapter I: Introduction
the bent. Four pre-cast roadway deck sections 75 feet in length and shaped like double Ts when viewed from the end ( TT ), were then placed between pairs of bents to complete each trestle span (Figure 5d). After all the spans were in place, the concrete decks were paved with asphalt to complete each of the trestles.
Trestle A, which runs from the Virginia Beach shore to the south island of the Thimble Shoal Tunnel, is 3.3 miles long. Trestle B, running from the north is-land of the Thimble Shoal Tunnel to the south island of the Chesapeake Channel Tunnel, is about 3.7 miles long. Trestle C, which connects the north island of the Chesapeake Channel Tunnel with the North Channel Bridge, is about 4.6 miles long. Short sections of trestle which form approaches to the North Channel and Fisherman Inlet brides are designated as D, E, and F.
The original North Channel bridge is an overhead truss with 75 feet of vertical clearance from sea level. The truss bridge was constructed on barges, floated into place, and lowered onto piers. The North Channel Bridge is 3,795 feet long. This bridge connects trestle C with one and one-half miles of highway on Fisherman Island at the southern end of the Eastern Shore. The Fisherman Inlet Bridge connects the highway on Fisherman Island with U.S. Route 13 in Northampton County.
The two tunnels are steel and concrete tubes which were constructed in sections, floated into place, and sunk into final position in a prepared trench on the bottom of the bay (Figure 5f). The Thimble Shoal Tunnel consists of 19 of these tubes, each of which is about 286 feet long. The Chesapeake Channel tunnel consists of 18 tube sections. Each tunnel consists of reinforced concrete road decks, walls and ceilings. The road deck is paved with an asphalt overlay, and the ceilings and walls are covered with ceramic tile.
The tunnel entrances are located on four man-made islands, each about eight acres in total area. The islands were built in 30 to 45 feet of water, and rise 30 feet above mean sea level (Figure 5e). Each island took 1.5 million tons of sand and 300,000 tons of rock to build. The islands are the location of ventilation buildings which house the fans for fresh air supply and air exhaust of the tunnels, as well as various electrical equipment. The south island of the Thimble Shoal Channel Tunnel is also the location of a restaurant and fishing pier.
Construction of the Parallel Bridges. Construction of the parallel bridges, which are of similar design as the original trestles, began in 1995. Span length was increased from 75 feet to 100 feet and the bridge deck was widened, with 8-foot shoulders the entire length of the roadways (Figure 6). Parallel tunnels were not constructed, so the new trestles were connected to the existing islands and tunnels. The new structures were aligned to accommodate the parallel tunnels when they are built, however (see Figure 2a above). Upon completion of the new bridges, the old trestles and bridges were taken out of service for rehabilitation. Several spans were completely replaced, and the entire length of all the trestles and bridges was repaved. No rehabilitation was completed on the tunnels, although the islands and tunnel entrances were modified to accommodate traffic entering from the new parallel bridges. The expanded facility was opened to traffic in April of 1999.

Page 7 Chapter I: Introduction
Figure 5 Construction of the Chesapeake Bay Bridge-Tunnel
(1960-1964)
a. Piling segments were “spun” in 16 foot sections, and strung together with steel cables to complete a full piling. h piling is 4.5 feet in diameter.
b. Concrete trestle bridge decks were poured at the Cape Charles plant and carried by barge to the construction site in the bay.
c. Pilings were driven into the floor of the bay and finished with a horizontal cap. The pilings and cap are called a bent.
d. Pre-cast sections of bridge deck were placed on pairs of bents.
f. The tunnels consist of 18 or 19 steel tube segments, each 286 feet long, with concrete road decks, walls, and ceilings.
e. Four islands were constructed in the bay from sand and rock. he islands are the anchors for the ends of the two tunnels. Each island is eight acres in area.
Eac
T
Source: Chesapeake Bay Bridge and Tunnel District.

Page 8 Chapter I: Introduction
Figure 6 Construction of the Parallel Bridges
(1995-1999)
a. Concrete sections were pre-cast at the Little Creek property in Virginia Beach. b. Pre-cast bridge decks were set in place.
c. Piers were constructed for the parallel North Channel Bridge.
d. Box girders were used for the new North Channel Bridge, eliminating the need for a truss structure.
Source: Chesapeake Bay Bridge and Tunnel District.
CBBT’s Administrative and Management Structure
The Chesapeake Bay Bridge-Tunnel is operated by the Chesapeake Bay Bridge and Tunnel District, which was created as a political subdivision of the State in 1954 (as the Chesapeake Bay Ferry District). The district consists of the two Eastern Shore counties, Accomack and Northampton, and the Hampton Roads cities of Virginia Beach, Norfolk, Portsmouth, Chesapeake, Hampton, and Newport News (Figure 7). The district initially operated the ferries which ran between the Eastern Shore and Virginia Beach.
The Chesapeake Bay Bridge and Tunnel Commission is the governing body for the District. Its 11 members include two members each from Northampton and Accomack counties, one member each from the Hampton Roads cities, and one mem-

Page 9 Chapter I: Introduction
Accomack
Northampton
Virginia Beach
Norfolk
Chesapeake
Newport News
Hampton
Portsmouth
Atlantic Ocean
Chesapeake
Bay
Source: JLARC staff illustration.
Figure 7 The Chesapeake Bay Bridge and Tunnel District
13
13
Accomack
Northampton
Virginia Beach
Norfolk
Chesapeake
Newport News
Hampton
Portsmouth
Atlantic Ocean
Chesapeake
Bay
Source: JLARC staff illustration.
Figure 7 The Chesapeake Bay Bridge and Tunnel District
1313
1313
ber from the Commonwealth Transportation Board. Members are appointed by the Governor for four year terms. A chairman, vice-chairman, and secretary-treasurer are elected from among the commission membership. The commission meets monthly, and is responsible for all aspects of the Bridge-Tunnel’s construction and operation, including issuing bonds; purchasing property; employing staff, consult-ants and engineers; making rules and regulations regarding operations of the district; and establishing tolls for use of the facility.
Operation of the CBBT is the responsibility of 165 employees. The staff organization is headed by an executive director, who reports to the CBBT commission. Staff are organized into four divisions (Figure 8).
The Maintenance Division. The maintenance division is responsible for all maintenance on the facility, including: roadway, tunnel, and bridge structures; electronics and communications equipment; heating, ventilation, and air conditioning, carpentry, and tunnel operations. The maintenance division has 63 employees in four departments – technical (engineering), shops and services, electrical/mechanical, and electronics/communications. The maintenance division is also responsible for purchasing.

Public Relations Marketing Mailroom Switchboard/Reception
Law Enforcement Toll Collection Emergency Response
Engineering Electrical/Mechanical Electronics/Communications Equipment/HVAC Highway Maintenance
Page 10 Chapter I: Introduction
Figure 8 Chesapeake Bay Bridge-Tunnel Organization
Commission
Executive Director
Public Relations Division Finance DivisionOperations Division Maintenance Division
Public Relations Law Enforcement Toll Audit Engineering Marketing Toll Collection Accounting Electrical/Mechanical Mailroom Emergency Response Human Resources Electronics/Communications Switchboard/Reception Risk Management Equipment/HVAC
Highway Maintenance
Source: JLARC staff illustration.
The Operations Division. The operations division has 89 employees, responsible for toll collections; emergency response to vehicle accidents, breakdowns and other incidents; and law enforcement. Currently, five positions are vacant. The chief of police heads the division. Police lieutenants are the shift supervisors, and are responsible for daily operations, including toll collections (16 FTE positions) and emergency response (29 FTE positions). About 30 of the police positions are responsible for law enforcement patrol.
The Finance Division. The finance division has six positions, including two accountants and the agency human resources specialist. The division is responsible for all financial operations, such as accounting for toll revenues, payroll and benefits administration, payment of all district expenses for supplies materials, and services, and risk management.
The Public Relations Division. The public relations division has four positions, including a director, assistant to the director, mail clerk, and switchboard operator. The CBBT is actively marketed as a tourist attraction. In 2001, the division mailed approximately 582,000 brochures, and other forms of promotional mate-rial to AAA agencies, travel centers, hotels and motels, and individuals. Mailings to individuals are typically in response to requests generated by advertising.
FUNDING OF BRIDGE-TUNNEL CONSTRUCTION AND OPERATIONS
As with any large transportation facility, funding for construction and operation of the Chesapeake Bay Bridge-Tunnel has come from a number of sources. The original two-lane facility was funded entirely from a $200 million bond issue of the district. No federal, State, or local funds were used. Planning for and construction of the parallel bridges in 1995 were funded from CBBT cash reserves totaling

Page 11 Chapter I: Introduction
$100 million and from three series of bonds totaling $116.4 million. Again, no federal, State, or local funds were used. Operation and maintenance of the facility is funded from a combination of toll revenue, other revenue such as investments and rent, and State assistance in the form of urban street payments.
CBBT Bonds and Debt
Chapter 714 of the 1956 Acts of Assembly authorized the Chesapeake Bay Ferry Commission to issue revenue bonds to build a bridge-tunnel to cross the bay. Additional bonding authority was provided to the CBBT by Chapter 203 of the 1990 Acts for construction of parallel bridges and tunnels. The commission’s bonds are payable only from toll and other revenue and do not constitute a debt of the district or the Commonwealth. The commission’s 1956 enabling legislation requires that when all bonds have been paid the facility will become a part of the State highway system and be maintained by the Commonwealth Transportation Board free of tolls.
Construction of the original facility in 1960 was funded entirely from bonded debt. No federal or State transportation trust funds were used. The 1960 bonds were issued in three series in the amounts of $70 million (Series A), $30 mil-lion (Series B), and $100 million (Series C). In July 1970 the district defaulted on the $100 million series C bonds due to insufficient funds from toll revenues. It did not default on the other series. The district emerged from default in 1985 by repaying all past due interest in full. It subsequently funded its reserve maintenance and general reserve accounts and began redeeming the series C bonds in 1988.
Since 1991, the district has had eight additional bond issues, totaling $418.2 million. Five of the series have been refunding bonds to fully or partially defease prior issues. The other bond issues were to partially fund the planning and construction of the parallel bridges. As of July 1, 2002, approximately $219.4 mil-lion in bonds were outstanding (Table 1).
Table 1 Chesapeake Bay Bridge-Tunnel Bonds
Bond Issue Par Amount
Original Issue Purpose Outstanding
Amount* 1960 Revenue $200,000,000 Construction of original facility $ 0 1991 Revenue 30,400,000 Parallel construction planning 17,297,145 1991 Refunding 113,345,000 Refunding of 1960 Revenue Bonds 0 1995 Revenue 42,450,000 Construction of parallel bridges 0 1995 GR Revenue 60,250,000 Construction of parallel bridges 28,441,768 1996 GR Refunding 74,125,000 Refunding of 1991 GR bonds 70,058,209 1998 Refunding 44,405,000 Refunding of 1991 GR bonds 47,774,402** 2001 Refunding 30,390,000 Refunding of 1995 revenue bonds 31,903,561** 2001 GR Refunding 22,835,000 Refunding of 1995 GR/RB bonds 23,931,768** Total ,200,000 $219,406,853
*Outstanding amount as of July 1, 2002. **Includes unamortized Original Issue Premium/Discount and Underwriter’s Discount. Source: Chesapeake Bay Bridge-Tunnel bond Official Statements and Director of Finance.
$618

Page 12 Chapter I: Introduction
The bonds issued in 1991 and since have been under terms established by two bond resolutions adopted by the CBBT commission in 1991. The Revenue Bond Resolution (February 12, 1991) sets out terms and covenants for the issue of revenue bonds to fund the construction of the parallel bridges, which are referred to as “senior bonds.” A subsequent General Revenue Bond Resolution (November 21, 1991) establishes covenants for the general resolution bonds, referred to as “junior bonds.” General resolution bonds are subordinate debt to any outstanding senior bonds.
The bond resolutions set out several covenants that are of particular note. First, the commission is required to maintain the tolls at a level, based on the opinion of the traffic engineers, that will provide revenues sufficient to cover 300 percent of the amount necessary for the annual payment of principal and interest on the senior bonds, and 120 percent of the amount for payment of principal and interest on the general resolution bonds. These bond coverage amounts are net of revenues necessary for maintenance of the facility, which is also required by the covenants. The resolutions also require that the tolls be uniform, with free passage provided only for certain explicitly enumerated classes such as police officers, fire departments, employees of VDOT and DMV, and CBBT employees. The district is required to hire consulting traffic engineers to project traffic and revenues, and to make recommendations on the appropriate level of tolls.
The bond resolutions also require the district to hire a consulting engineer to perform an annual inspection of the facility and to report on whether it has been “maintained in good repair, working order and condition.” The consulting engineer’s report includes recommendations for proper maintenance and for the insurance to be carried as required by the covenants. The commission is required to return the facility to good repair in response to any recommendation of the consulting engineers. The district has a six-year maintenance reserve plan to address the recommendations of the consulting engineer, as well as other maintenance work identified by the maintenance staff.
The commission is required by the bond resolutions to prepare an annual budget of expenses which must be filed with the trustee, each depositary, the consulting and traffic engineers, and any bondholders who have requested it. The district’s expenses are not to exceed reasonable and necessary amounts for the maintenance, repair, and operation of the facility.
Traffic, Tolls, and Revenue
In FY 2002, 3,294,480 vehicles used the Bridge-Tunnel. About 88.6 percent of that traffic was cars and light trucks. The remaining portion of traffic is from buses and heavy trucks of various lengths and axle combinations. Since 1992, traffic has increased about 23.7 percent. The average growth rate from 1965 to 2001 has been approximately 3.0 percent per year. As one might expect, given the importance of tourists for both the Eastern Shore and Virginia Beach areas, traffic increases significantly in the summer months. In calendar year 2002, for example, peak traffic was in July, with 416,303 vehicles. The lowest traffic volume was in January, with only 174,151 vehicles, or less than half the traffic in the peak month.

Page 13 Chapter I: Introduction
The CBBT district has several sources of operating revenue. The largest single source of revenue is from tolls on use of the facility. The CBBT toll structure is based on the number of axles of the vehicles using the facility. For passenger cars and light trucks the one-way toll is $10. An additional toll of $3 per axle is charged for trailers. In March, the commission implemented a commuter toll discount so that a return trip within 24 hours is only $4. The discount applies only to cars and light trucks. The one-way toll for heavy trucks ranges from $14 for two-axle, six-tire vehicles to $36 for six-axle vehicles. Over-dimension or over-weight vehicles pay $60 for the toll, and an additional $60 if a police escort vehicle is necessary. The toll for school buses is $10; commercial buses pay $25 for two axles, or $26 for three axles. In FY 2002, toll revenue totaled $38.4 million.
The Code of Virginia also authorizes the Commonwealth Transportation Board to make urban street payments to the CBBT, and in FY 2002, these payments totaled $964,075. Other operating revenues come from rent on property the district owns at Little Creek in Virginia Beach and from concessions at the restaurant on the south island of the Thimble Shoal Tunnel. Other operating revenues amounted to $992,755 in FY 2002. The CBBT also has certain non-operating revenues, such as changes in the fair value of investments and interest. These amounted to $6.0 mil-lion in FY 2002. So, total revenues in 2002 were more than $46 million.
Bridge-Tunnel Costs
The CBBT has three major costs which are funded from toll and other revenues. The largest single cost is debt service on various bonds issued since 1991. FY 2003 debt service costs are more than $22.4 million for the six outstanding bond issues. Debt service costs are funded from toll revenues through sinking funds and debt service reserve funds created by the 1991 bond resolutions.
The second highest category of costs is operating expenses. The CBBT operating budget for FY 2003 totals $9,840,850. This represents a $461,397 increase from the FY 2002 actual expenses, or about 4.9 percent (Table 2). By function, the largest category of costs in FY 2002 was operations, at $2.9 million. The second largest expenditure was for the maintenance function, at $2.4 million. In contrast to the maintenance reserve projects, this maintenance is routine, daily maintenance such as repairing emergency call phones or cleaning tunnel walls. General expenses, which are employee fringe benefit costs across all divisions, totaled $1.7 mil-lion. Advertising, and promotional activities are the fourth largest item in the operating budget.
By administrative account, salaries, benefits, and other salary-related expenses account for the largest portion of the costs in the operating budget across the entire organization. In the 2003 operating budget, salaries and fringe benefit costs are $7.8 million, or just over 79 percent of the total. Advertising is a distant second at about five and one-half percent. Other significant expenditures include utilities and maintenance supplies and materials. The operating budget by type of expenditure is shown in Table 3.

Page 14 Chapter I: Introduction
The third highest cost is for facility repairs from the six-year reserve maintenance plan. Maintenance projects in the six-year plan are funded from the reserve maintenance fund, which is required by the 1991 bond resolutions. This maintenance represents specific projects for major repairs, upgrades, or improvements to the CBBT assets. Many of the projects are repairs or improvements recommended by the consulting engineer as required by bond covenants. The current six-year re-serve maintenance plan includes 63 projects totaling $39.7 million, with $9 million planned in FY 2003. In addition, $400,000 in annual insurance costs are paid from the reserve maintenance fund.
Table 2 CBBT Operating Expenses and Budget by Function
Administrative Account FY 2002 Expenses FY 2003 Budget
Administration $ 285,585 $ 312,400 Public Relations 678,824 718,200 Finance 259,936 290,100 Operations 2,928,207 3,156,700 Maintenance 2,467,415 2,668,850 General Expenses 1,747,347 1,817,200 Consultants, Legal, etc. 537,172 402,400 Utilities 474,968 475,000
Total $9,379,453 $9,840,850
Source: Chesapeake Bay Bridge and Tunnel District.
Table 3 CBBT FY 2003 Operating Budget by Administrative Account
Description
Salaries Benefits and Other Salary Expenses AdvertisingUtilities
Amount
$5,979,200 1,817,200
535,000
Maintenance Equipment, Supplies, Materials.ConsultingConsulting (Engineering)OtherOffice Supplies and EquipmentTravel and Expenses Memberships TrainingAdministrative Computer Support
475,000 401,050 282,400 120,000
81,600 55,500 53,400 17,000 13,500 10,000
Total $9,840,850
Source: Chesapeake Bay Bridge and Tunnel District.
Page 15 Chapter I: Introduction
PRIOR STUDIES OF THE CHESAPEAKE BAY BRIDGE-TUNNEL
HJR 210 specifically directs JLARC to consider the findings of all recent reports relative to the Chesapeake Bay Bridge-Tunnel. Three reports, completed in 2000 and 2001, relate to the structure and procedures of the CBBT commission, the CBBT toll structure and its elasticity, land use impacts of a discounted commuter toll, the general impact of the commuter toll on the Eastern Shore, and other toll discount programs. In addition, a VDOT consultant has recently completed a study of the U.S. Route 13 corridor, and the findings of that report are also relevant to an assessment of the future of the Chesapeake Bay Bridge-Tunnel. The study resolution directs that the JLARC report issue recommendations regarding the appropriate State role in determining the future of the Bridge-Tunnel.
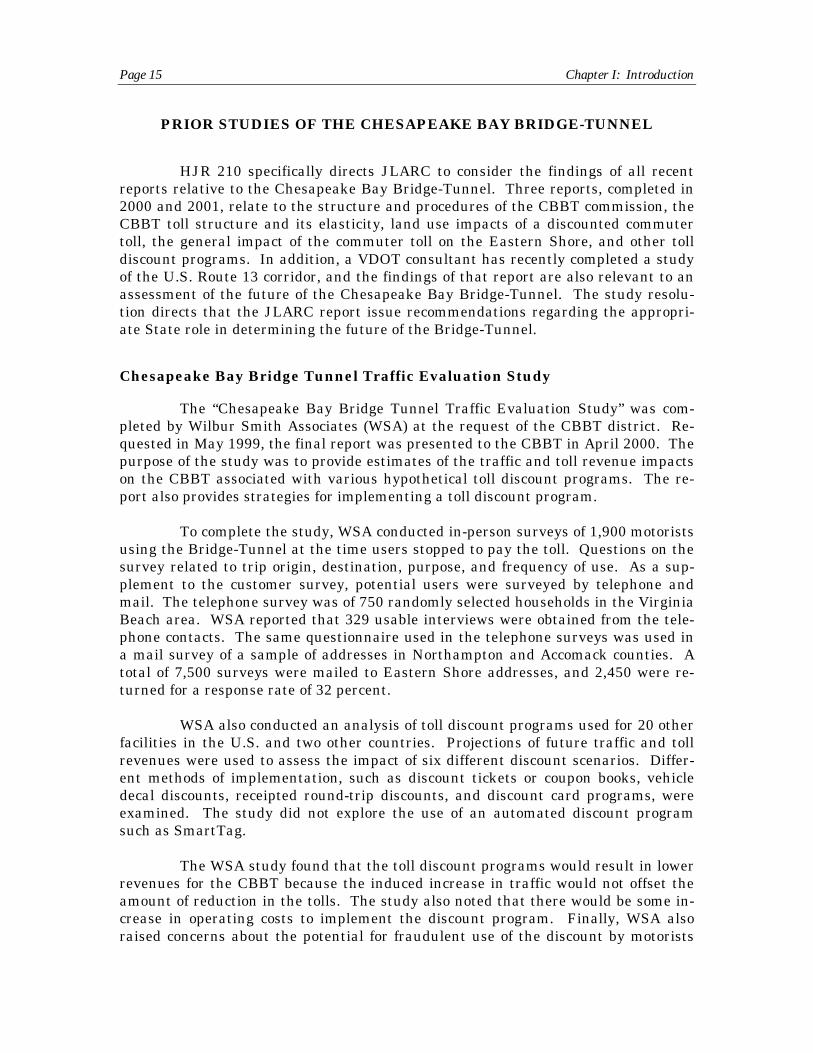
Chesapeake Bay Bridge Tunnel Traffic Evaluation Study
The “Chesapeake Bay Bridge Tunnel Traffic Evaluation Study” was completed by Wilbur Smith Associates (WSA) at the request of the CBBT district. Re-quested in May 1999, the final report was presented to the CBBT in April 2000. The purpose of the study was to provide estimates of the traffic and toll revenue impacts on the CBBT associated with various hypothetical toll discount programs. The re-port also provides strategies for implementing a toll discount program.
To complete the study, WSA conducted in-person surveys of 1,900 motorists using the Bridge-Tunnel at the time users stopped to pay the toll. Questions on the survey related to trip origin, destination, purpose, and frequency of use. As a supplement to the customer survey, potential users were surveyed by telephone and mail. The telephone survey was of 750 randomly selected households in the Virginia Beach area. WSA reported that 329 usable interviews were obtained from the telephone contacts. The same questionnaire used in the telephone surveys was used in a mail survey of a sample of addresses in Northampton and Accomack counties. A total of 7,500 surveys were mailed to Eastern Shore addresses, and 2,450 were re-turned for a response rate of 32 percent.
WSA also conducted an analysis of toll discount programs used for 20 other facilities in the U.S. and two other countries. Projections of future traffic and toll revenues were used to assess the impact of six different discount scenarios. Different methods of implementation, such as discount tickets or coupon books, vehicle decal discounts, receipted round-trip discounts, and discount card programs, were examined. The study did not explore the use of an automated discount program such as SmartTag.
The WSA study found that the toll discount programs would result in lower revenues for the CBBT because the induced increase in traffic would not offset the amount of reduction in the tolls. The study also noted that there would be some in-crease in operating costs to implement the discount program. Finally, WSA also raised concerns about the potential for fraudulent use of the discount by motorists

Page 16 Chapter I: Introduction
and the need for enhanced auditing to ensure the integrity of toll collection process. There were no findings related to the economic impact of the discount programs.
At the request of one member of the CBBT commission, the WSA study was reviewed by an economics professor at Old Dominion University. The WSA report was criticized for not accounting for people who might be induced to move to Northampton as a result of lower tolls. In addition, the study was said to have shortcomings in survey design, notably the failure to survey residents of the City of Norfolk or other localities in the Hampton Roads MSA. The conclusion of the reviewer was that the study’s methods caused an underestimate of the effect of a toll reduction.
Potential Land Use Impacts of a Commuter Toll Reduction on the Chesapeake Bay Bridge-Tunnel
A second study, “Potential Land Use Impacts of a Commuter Toll Reduction on the Chesapeake Bay Bridge-Tunnel,” was completed by Michael Baker Jr., Inc. and Fitzgerald and Halliday, Inc. for the Transportation Planning Division of the Virginia Department of Transportation (VDOT). The purpose of the study was to determine the potential land use impacts to the Eastern Shore communities as a result of a commuter toll reduction. The study was completed in June 2000.
The study’s primary methods consisted of an analysis of commuting pat-terns on the Eastern Shore and in Hampton Roads, a travel time analysis, a toll sensitivity and travel cost analysis, a housing market analysis, a review of land use planning and regulations in Northampton County, and a review of potential environmental constraints on future development on the Eastern Shore. As a part of the analysis, the consultants completed a comparison of development trends on the Eastern Shore with those of Hampton Roads.
The VDOT study concluded that commuters are not highly sensitive to changes in tolls, and that a commuter toll on the Bridge-Tunnel would not be likely to cause substantial changes in commuting patterns. The report also concluded that there does not appear to be any direct relationship between changes in traffic due to a toll reduction and changes in land use. However, the report states that a reduced commuter toll could place the Eastern Shore in the Hampton Roads region’s outer zone of rapid growth sooner, although development and growth would be likely in any case over the next 20 years. It also notes that significant environmental constraints, especially with regard to groundwater, could limit development in Northampton County to some extent.
The VDOT report was also reviewed by the professor at Old Dominion University. In contrast to the WSA report, for this study the criticism was that it over-stated the amount of CBBT commuter traffic and Eastern Shore development likely as a result of a commuter toll. Specific concerns were raised with regard to the job markets used in the commuter travel analysis, as well as the use of “friction factors” such as stopping for tolls, in the total travel cost analysis. The reviewer’s conclusion was that the commuter toll would not draw Northampton County into the Hampton Roads outer zone of rapid development.

Page 17 Chapter I: Introduction
Chesapeake Bay Bridge-Tunnel Commuter Toll Impact Study
The third study was completed by The Louis Berger Group, Inc. and Travesky and Associates, Ltd. for the Chesapeake Bay Bridge-Tunnel Commuter Toll Impact Study Committee. The study was commissioned by Northampton and Accomack counties through the joint toll impact study committee and the Accomack-Northampton Planning District Commission. The purpose of this third study was to assess the impacts of a commuter toll on land use, the environment, and Eastern Shore communities. The design for this study, in contrast to the WSA and VDOT studies, specifically incorporated public comment and involvement by Eastern Shore residents. Analysis focused on six topic areas: transportation, tourism, economic development, agriculture/aquaculture, the environment, and quality of life. The consultants note that the methodology for the study was based on the National Cooperative Highway Research Program (NCHRP) Report 403: Guidance for Estimating the Indirect Effects of Proposed Transportation Projects, which was produced by Louis Berger & Associates. Three toll scenarios were examined: (1) no-action, (2) a commuter toll of $14 for a 24-hour round trip, and (3) a one-way maintenance toll of $3 to provide sufficient funds for operation and maintenance of the Bridge-Tunnel.
The final report was released in October 2001. Among the key findings were:
• Eastern Shore residents are concerned about the level of their representation on the CBBT commission, and about public participation in the commission’s decision-making process.
• A reduction of the CBBT tolls may make the southern portions of Northampton County more attractive for residential development.
• The annualized household growth rate for Northampton County is estimated to be 0.7 percent in the no-action scenario, 1.5 to 2.3 percent for the commuter toll scenario, and 2.1 to 3.3 percent with a maintenance toll.
• A reduction of tolls on the Bridge-Tunnel could be expected to increase traffic in the U.S. Route 13 corridor, an impact not accounted for in corridor studies for the highway.
• Both toll reduction scenarios would increase tourism income for Eastern Shore businesses, though the increase is modest over the no-action scenario.
• The toll reduction scenarios could be expected to have significant impacts on economic development, especially in the areas of housing construction and retail employment.
• Some adverse environmental impacts could be expected with toll reductions as a result of commercial and residential development.

Page 18 Chapter I: Introduction
• Both positive and negative impacts on the quality of life were identified, but one significant concern cited in public hearings was the potential loss of a rural lifestyle.
The report recommended that the Eastern Shore counties request that the CBBT commission postpone any decision on the commuter toll reduction until further study on how to reduce the adverse impacts identified. As a result of comments from the public, the report also recommended that the CBBT commission and General Assembly assess the level of Eastern Shore representation on the CBBT commission, the commission’s policies on public comment, and the use of surplus toll revenue for off-site improvements. Several recommendations were directed to the local governments related to land use regulations, use of agricultural and forestal districts, and planning for infrastructure.
U.S. Route 13 Corridor Study
In May 2002, VDOT released a comprehensive corridor study of U.S. Route 13 on the Eastern Shore. The study was completed by Vanasse Hangen Brustlin, Inc. (VHB), for VDOT’s transportation planning division. Corridor studies are conducted for significant transportation projects in metropolitan and rural areas, such as major highway or transit improvements. Corridor studies seek to identify the mix of transportation improvements that would be most effective in moving people and goods in specific travel corridors and balancing those improvements with avail-able funding and community concerns. These improvements have substantial costs and have significant impacts on travel in a transportation corridor.
The VHB Route 13 corridor study examined existing corridor conditions, future traffic conditions, and how traffic growth can be accommodated. The key finding of the study was that various improvements to Route 13 will be needed to ad-dress growth in traffic over the next 20 years. Among the improvements recommended are addition of turn lanes, widening of medians, synchronizing existing traffic signals, adding frontage roads, and construction of grade-separated inter-changes in some locations. The total costs of the recommended improvements is more than $139 million. The reduction of the CBBT tolls and its impact on traffic were considered as a part of the Route 13 study. With regard to the CBBT, the VHB corridor study found that the expected increase in traffic did not result in the need for any significant additional improvements beyond those already required by corridor-wide traffic growth.
JLARC REVIEW AND REPORT ORGANIZATION
House Joint Resolution 210 of the 2002 General Assembly directed a broad review of the future of the Chesapeake Bay Bridge-Tunnel. Specific concerns about the toll structure for the facility were the underlying basis for the study, but HJR 210 also directed the review to include an assessment of operational and administrative efficiency as well. Because the scope of the study was broad, JLARC staff used numerous research activities to complete the evaluation.

Page 19 Chapter I: Introduction
Study Research Activities
Based on the study mandate in HRJ 210, JLARC staff developed six issues for this review. The issues focus on three major areas – the economic impact of the Bridge-Tunnel on the Eastern Shore and the State, the adequacy of the CBBT tolls, and the administration, operation, and maintenance of the facility. The six issues were:
• To what extent, and in what ways, has the CBBT provided positive economic benefits to the Eastern Shore and the Commonwealth?
• Is the CBBT toll structure adequate for maintenance and operation of the facility, retirement of existing debt, and funding of debt for anticipated capital improvements, considering: statutory and other requirements, current and projected traffic, debt, operating, and maintenance costs, and future capital improvements?
• Has the CBBT implemented a maintenance program that is efficient, protects the interests of bondholders, and ensures that the facility will be available to the traveling public?
• Are CBBT operations efficient and cost effective?
• Are CBBT policies and procedures for public participation, human re-sources, procurement, toll operations, and law enforcement appropriate and consistent with other public organizations?
• What is the appropriate State role in determining the future of the Chesapeake Bay Bridge-Tunnel?
Several research activities were used by JLARC staff to address the study issues. The research activities used were: interviews, field observation, modeling of traffic and revenues, analysis of State and regional economic data, surveys of CBBT motorists, analysis of workload, staffing, salary and other data, and reviews of documents.
Interviews. JLARC staff conducted interviews with more than 60 individuals, including all 11 members of the CBBT commission; the CBBT executive director, division directors, police officers, emergency crew members, toll collectors, and maintenance personnel; planning district and local government staff; Eastern Shore business owners and representatives; local residents; and several members of the General Assembly. Interviews were also conducted with staff of several State agencies, including the Virginia Department of Transportation, the Department of Criminal Justice Services, the Department of Labor and Industry, and the Virginia Retirement System. Staff of the Richmond Metropolitan Authority were also inter-viewed.
Field Observation and On-Site Review of Facilities. JLARC staff completed several on-site reviews of the Bridge-Tunnel facilities, and photographed

Page 20 Chapter I: Introduction
various aspects of operations and maintenance. Field observations were made as a part of interviews with police officers, for example. In addition, JLARC staff made two inspection tours of the Bridge-Tunnel with CBBT maintenance staff. The inspections were intended to verify the conditions cited by the district’s engineering consultant, and to document specific areas of concern related to the need for maintenance on the facility. JLARC staff examined the administrative and maintenance facilities, toll buildings and booths, bridges, tunnel interiors, ventilation buildings, tunnel islands, and property owned by the district at Little Creek in Virginia Beach. Bridge substructures were also examined and photographed from the water using the CBBT hydrographic survey boat.
Projections of Traffic, Revenues, and Costs. In order to evaluate the long-term adequacy of the CBBT toll structure, JLARC staff projected CBBT traffic, revenue, and costs for the period from FY 2003 to 2025. The traffic projections were based on a series of regression models designed to explain the seasonal and long term trends in the observed historical traffic data. The models were used to project traffic counts for each of the 14 vehicle classes in the CBBT toll structure, for each month in the 23 year period through 2025. In order to account for the impact of economic recessions on CBBT traffic, the traffic models were used to simulate two re-cessions approximating the historical trend. Since the 1970s, recessions have occurred about every ten to twelve years, so the JLARC staff projections of traffic and revenues assume recessions in 2012 and 2024.
Using the projected monthly traffic counts for each vehicle class, JLARC staff estimated the annual toll revenue by applying the appropriate toll rate for each type of vehicle. For the base analysis, no changes in the rates were assumed for the period through 2025. To estimate how changes in toll rates might generate sufficient revenue to cover future capital improvements, modified rates were applied to the traffic models after accounting for the elasticity of traffic in relation to increases in tolls.
CBBT costs were also projected for the 23-year period through 2025. The estimated annual costs were based on the historical trends of expenditures, except for debt service and reserve maintenance costs. Debt service costs are set out for the entire 23-year period in the payment tables in the official statements for the out-standing bond issues, so no estimates were necessary. Reserve maintenance costs were based on the amounts budgeted by the CBBT in its six-year reserve maintenance plan through the year 2008, and were estimated for subsequent years using the U.S. Bureau of Labor Statistics producer price index for highway and street construction.
Analysis of State and Regional Economic Data. In an effort to quantify the impact of the Bridge-Tunnel on economic activity on the Eastern Shore and in Hampton Roads, JLARC staff analyzed personal income, agricultural production, and other economic data. The analysis also included other demographic data such as U.S. and regional employment, and regional and local population. Interviews with representatives for major employers in the region also provided qualitative as-

Page 21 Chapter I: Introduction
sessments of the impact of CBBT traffic and tolls on the agricultural economy on the Eastern Shore and the tourist industry in Virginia Beach.
Surveys of Motorists. In order to determine the impact of the 24-hour round trip discount on traffic, CBBT toll collectors completed a JLARC-designed in-person survey of motorists as they presented receipts to qualify for the discount. Survey questions related to whether the user’s trip would have been taken without the discount and how many round trips the user made before and after implementation of the discount in March 2002.
The survey was administered 24 hours a day, seven days a week to motorists for two one-week periods, first in August 2002, and then in October 2002. A total of 14,147 motorists were surveyed in the two-week period. To avoid traffic delays during peak periods, toll collectors were instructed not to complete surveys when backups at the toll plazas developed. As a result, approximately 79 percent of 9,235 motorists using the discount were surveyed for the one-week period in August, and about 83 percent of 7,792 motorists using the discount for the one week period in October were surveyed.
Analysis of Workload, Staffing, Salary, and Other Data. JLARC staff completed several analyses of data on CBBT workload, staffing, and salaries. CBBT workload data were gathered from the toll collection system and monthly director’s reports. The toll collection system provided data on weekly, monthly, and annual toll transactions by vehicle type. Data in the director’s reports from January 1, 1999, to September 30, 2002, were used in the review, and included services rendered to motorists, vehicle accidents, warnings and summonses issued by police officers, vehicle incidents (such as fires), maintenance work accomplished, and promotional activities completed. The analysis focused on changes over time, and in relation to the full time equivalent positions in each of the CBBT divisions. A full year of leave and training data for operational personnel were collected and used in the analysis. Salary data from the Richmond Metropolitan Authority, the Hampton Roads Bridge-Tunnel, the State Compensation Board, and the Northampton County Sheriff’s Office were used to complete a comparison for selected CBBT positions.
Document Reviews. JLARC staff reviewed a number of documents for this study, from several sources, including the CBBT; federal, State, and local agencies; consultants, and private organizations. Among the documents reviewed were the Code of Virginia, the Acts of Assembly, CBBT administrative, policy and procedures manuals, prior studies of the CBBT, corridor studies of U.S. Route 13, a study of channel depths for the Chesapeake Bay, bond resolutions and official statements, public relations reports, employee newsletters, financial statements, and various technical manuals such as the Highway Capacity Manual, Tolling Practices for Highway Facilities, and Toll Plaza Design.
Report Organization
This report is organized into six chapters. Chapter I has provided an over-view of the construction and operation of the Chesapeake Bay Bridge-Tunnel, prior

Page 22 Chapter I: Introduction
studies of the CBBT, and the JLARC review. Chapter II examines the role of the Bridge-Tunnel in the economic growth of the Eastern Shore and Hampton Roads regions. The chapter also discusses why it is inappropriate to use the Bridge-Tunnel toll structure to manage economic growth. Chapter III discusses the adequacy of the toll structure to support the operational, maintenance, and debt service costs of the facility. Chapter IV examines toll, police, and emergency operations, including staffing. Chapter V evaluates the CBBT ordinary and reserve maintenance programs, and documents the need for certain maintenance activities. Finally, Chapter VI re-views the general administration and governance of the district. The chapter includes a discussion of salaries and benefits for CBBT personnel, the adequacy of policies and procedures, and the State role in the future of the Bridge-Tunnel.

Page 23 Chapter II: Role of the Bridge-Tunnel in Economic Growth
II. Role of the Bridge-Tunnel in Economic Growth
This study was completed in the context of the controversy over modification of the Bridge Tunnel toll structure, which some see as an action intended to promote the development of the lower end of Northampton County. Those who favor development view the toll as a barrier, and seek to reduce tolls and implement commuter discounts, which would make daily travel across the bay more economical for those who might want to live on the Eastern Shore and work on the Virginia mainland. Those who do not favor development prefer to retain a toll structure without reductions and without commuter discounts. In other words, they agree that the toll is a barrier to development, and want that barrier to remain in place. Their concern is that development will be detrimental to the rural quality of life for current residents.
HJR 210 directed that this review of the Chesapeake Bay Bridge-Tunnel determine “the appropriate role of the CBBT in the economic growth and development generally in the Commonwealth and especially on the Eastern Shore.” To ad-dress the questions related to the role of the CBBT in economic growth and development, JLARC staff completed reviews of long-term economic data, statistical analysis of traffic and employment levels, and interviews with private citizens, business owners, and local public officials. Staff also completed a review of the mission and authority of the Chesapeake Bay Bridge and Tunnel Commission as outlined in the Acts of Assembly.
Based on the JLARC staff review, it appears that the CBBT is essential to the economic well being of the Eastern Shore, and plays an important role in tour-ism in Virginia Beach. However, there is little measurable impact of Bridge-Tunnel traffic on the economies either of the Eastern Shore or of Hampton Roads. More-over, government and business leaders interviewed by JLARC staff for this review agreed that CBBT tolls have little direct impact on employment, business decisions, or the future of economic growth. Instead, the overwhelming consensus was that the importance of the CBBT was in its presence as an essential link to the Virginia mainland. Most also agreed that the future role of the Bridge-Tunnel in economic growth and development should be in providing a safe, efficient, low-cost facility to support commerce on the Eastern Shore and throughout the Commonwealth.
This view is consistent with the views of CBBT commissioners and with the actual legal authority of the commission. While some Eastern Shore residents would like to use the CBBT toll to limit growth, the commission simply has no legal authority to use the toll structure as a method to either promote or discourage economic growth and development. Management of growth and development is the responsibility of local governments, and should be implemented through local land use planning and zoning policy, not the CBBT toll structure.
This chapter outlines key aspects of the local economies within the Bridge-Tunnel district and assesses the measurable relationship between CBBT traffic and economic activity. It also outlines the authority of the district regarding the collec-

Page 24 Chapter II: Role of the Bridge-Tunnel in Economic Growth
tion of tolls, and concludes with a discussion of the inappropriate link between the toll structure and economic growth management. Because the tolls cannot be used to manage economic growth, JLARC staff did not complete any analysis to deter-mine how changes in the toll structure might affect residential and commercial development.
The Local Economies in the CBBT District
The Chesapeake Bay Bridge and Tunnel District encompasses eight local jurisdictions, including the two counties on the Eastern Shore, and six cities in Hampton Roads. Two distinct economies exist within the district – a rural, agricultural economy on the Eastern Shore, and a more diverse, urban economy in Hampton Roads. In assessing the role of the Bridge-Tunnel in the economic growth of the district, it is necessary to examine these two economies separately. Among those government officials and business leaders interviewed for this study, the consensus was that the Bridge-Tunnel has a more fundamental impact on the Eastern Shore economy than on Hampton Roads.
The Eastern Shore Agricultural Economy. Accomack and Northampton counties are two of the most important agricultural counties in Virginia. They have long enjoyed a national standing in terms of production and the market value of their products. In 1997 Accomack was ranked fourth in Virginia and 651st in the nation in terms of total agricultural sales. Northampton was ranked 16th in the State and 1,476th in the nation. One farmer on the Eastern Shore noted that early in the 20th century, Accomack and Northampton were among the wealthiest agricultural counties in the nation. Since then, the relative fortunes of the Eastern Shore have decreased somewhat. The most important driver of this trend has been the same change affecting U.S. agriculture, with declining numbers of family farms, in-creases in farm size, and increases in efficiency and yield. The Eastern Shore experience mirrors that of U.S. agriculture.
Trends in Eastern Shore agriculture appear to be more a function of world commodity prices and changes in farming technology than any relationship to the CBBT. Still, the CBBT plays an important role in providing a transportation link to the Virginia mainland for shipping agriculture products throughout the nation and, by way of the ports in Hampton Roads, the world.
According to the U.S. Census of Agriculture, Accomack County had 92,452 acres in farms in 1997. This represented a slight increase over the previous census in 1992. At the same time, the average farm in the county increased in size from 328 acres to 345 acres. There were 172 full-time farms in the county that year. The market value of agricultural products sold in 1997 was $84.8 million with, crops accounting for 41 percent of the total and livestock (mostly poultry) accounting for 59 percent of market value. The average market value of products sold per farm was $316,601, a 23 percent increase over 1992.
Northampton County had 56,435 acres in farms in 1997. This represents an eight percent increase over 1992. At the same time, the average farm increased

Page 25 Chapter II: Role of the Bridge-Tunnel in Economic Growth
in size from 324 acres to 371 acres. The number of full-time farms was 104. In 1997 the total value of agricultural products sold in Northampton County was $38.6 mil-lion. Crop sales accounted for 70 percent of total market value, with livestock accounting for 30 percent. Northampton County lacks the large poultry output pre-sent in Accomack. The average value of products sold per farm in Northampton County was $253,929 in 1997.
Compared to the average farm in Virginia, both Accomack and Northampton farms are larger and more productive. In 1997, the average farm in Virginia covered 200 acres and produced $57,027 in agricultural output, or about $284 per acre. In Accomack, the average farm produces almost $918 per acre, while Northampton County farms produce $684 per acre. Further, these counties represent a significant share of State agricultural output. In sales, for example, among all Virginia counties, Accomack County ranked first in vegetables, sweet corn and melons, soybeans, wheat, and corn for grain. Accomack also ranked fifth in poultry and poultry products.
Interviews with public officials, planning district staff, and farmers on the Eastern Shore confirmed the trend away from small farms growing a variety of crops such as tomatoes, potatoes, corn, and strawberries, to large farms growing a smaller variety of commodity crops such as wheat or soybeans. In addition, a sizeable poultry production of around 7.4 million chickens per year in 1964 more than doubled with the expansion of the poultry processing industry southward from Maryland and Delaware into Accomack County.
Currently, two poultry processing facilities operate in Accomack County employing approximately 3,000 individuals. These processing facilities ship their products both north into Maryland and the northeastern U.S., and south over the CBBT for distribution both within the U.S. and overseas though the ports in Hampton Roads. These poultry facilities consume a large portion of Eastern Shore agricultural products. For example, corn consumption by the poultry industry exceeds the output of Northampton County, necessitating the import of corn from other regions.
Two relatively new agricultural industries have emerged on the Eastern Shore in recent years. These are nursery farming and clam aquaculture. There is relatively little official data on these two industries, yet local officials and farmers note that they represent potentially important, relatively high dollar yield products. The presence of the CBBT may offer an opportunity to ship these products to markets off the Eastern Shore. Northampton County is the number one aquaculture producer in the State.
Without the presence of the CBBT, the agricultural industry on the Eastern Shore would face a marginally higher cost of exporting to the mainland or foreign markets. It is difficult to quantify the increased cost to agriculture if the CBBT were not available.
The Eastern Shore Non-Agricultural Economy. Historically, non-agricultural economic activity on the Eastern Shore has been limited to small-scale

Page 26 Chapter II: Role of the Bridge-Tunnel in Economic Growth
commerce centered in towns and villages surrounded by farms, woods, wetlands, and other open spaces. Recent development has relocated commercial activity from the traditional town centers to an expanding commercial strip along Route 13. This resulted in the relative decline of the towns, loss of locally-owned businesses, the spread of national retail and restaurant chains, and increased traffic on Route 13. The more fundamental effect is that the once relatively isolated and self-sustaining economy on the Eastern Shore is now more focused and dependent on the retail corridor spreading along Route 13. Staff with both county governments consider their localities’ economic situations are more impacted by through traffic than by regional influences either from Maryland to the north or from the Hampton Roads area to the south.
Most recently, there have been some improvements in town economic activity with the arrival of new residents and an increase in tourist activity. Local government and planning district officials note that many new businesses in the towns cater to seasonal residents and tourists. They further noted that many of these businesses are “hobby” businesses created by new, retired residents. These part-time businesses can function on a smaller economic margin than would be possible for a full-time business, thus providing economic activity that the counties would not enjoy otherwise.
Additional positive development trends include the emergence of a relatively large bed and breakfast industry, now more than 30 establishments, and the potential for major resort-type developments. Planning district staff reported their belief that the Eastern Shore could accommodate two “signature” resort communities while maintaining the vast majority of land in traditional uses. According to planning district staff, the best locations for these signature resorts are in Cape Charles, and in northern Accomack County.
According to interviews for this study, the major negative economic development trends have been the decline of family and truck farming, the spread of strip-type developments along a growing segment of Route 13, increased traffic on Route 13, and the decline of the vegetable and seafood food processing industry. Some private citizens are also concerned that the Eastern Shore is at risk from excessive housing development that could reduce agricultural and other open spaces.
The Hampton Roads Economy and Virginia Beach Tourism. The other local economy examined as a part of this study is the Hampton Roads metropolitan area. The Hampton Roads area has a diverse economy with a heavy concentration of commercial maritime activity, a variety of manufacturing industries, and tourism. The Hampton Roads economy is also one of the most heavily dependent on federal civilian and military operations. Most observers in the region felt that the CBBT has a relatively minor role to play in the metropolitan area.
The clear exception appears be the tourism industry in the Virginia Beach area. Some estimates indicate that five percent of tourists over the course of a typical summer arrive at Virginia Beach across the CBBT. In general, however, the CBBT serves as an important transportation route in the region providing an alter-native to Interstate 64 and Interstate 95 for shipping goods north.

Page 27 Chapter II: Role of the Bridge-Tunnel in Economic Growth
According to the City of Virginia Beach, approximately three million tourists visited the city in 2000, spending $630 million during their stays for hotels, meals, and entertainment. One useful measure of this tourist activity is hotel revenues. Monthly data from 1988 to 2002 indicate that hotel revenues in the Hampton Roads region are highly seasonal. A JLARC staff analysis of monthly passenger car traffic and monthly hotel revenue indicates that additional vehicles are associated with additional hotel revenue.
These results are consistent even when controlling for business cycle factors such as metropolitan employment and the normal seasonal pattern of traffic. This is one of the few measurable indicators of CBBT impacting the regional economy. It appears that tourist traffic over the facility plays an important role in the metropolitan area, where a one percent increase in car traffic is associated with almost a half a percent increase in hotel revenue. The extra revenue generated ranges from around $150,000 in the winter months to more than $300,000 in the summer months.
The Relationship Between the CBBT and Economic Growth
The JLARC staff analysis of local and regional employment found no significant impact on the total local economies from construction of the Bridge-Tunnel in the early 1960s. There is also no apparent relationship between the level of traffic on the facility and overall employment in the region. Rather, economic growth in the region served by the CBBT appears to be driven more by statewide business cycles and seasonal variation in certain segments of the economy.
Employment Changes Before and After Construction of the Chesapeake Bay Bridge-Tunnel. Using information from the Virginia Employment Commission, JLARC staff assessed annual changes in employment in the years be-fore and after the opening of the CBBT. The JLARC staff analysis tracked changes in total employment by year and changes in employment by industry over the 1960s and 1970s. This approach found that, overall, there are few measurable changes in employment that may be associated with the opening and subsequent operation of the CBBT.
Table 4 shows total employment in Accomack and Northampton counties. The trends in employment in this table lack any clear pattern. If the CBBT’s construction had played a major role in the Eastern Shore economy, there should be one or two possible effects. First, there should be a detectable increase in employment around the time of the opening of the facility. The data indicate no such change, and in fact, employment in Northampton County actually declined in three of the four years after the CBBT opened to traffic. Second, there should be an increase in the rate of change in employment growth. Again, this short time series shows no change in growth rates. The entire ten-year period is characterized by uneven, and mostly small, changes in employment in both counties.
Appendix B provides detailed employment data by industry in the decade before the opening of the CBBT (the 1950s) and in the decade in which the facility

Page 28 Chapter II: Role of the Bridge-Tunnel in Economic Growth
Table 4 Total Eastern Shore Employment from 1960 to 1970
Accomack County Northampton County Year Employment Annual Change Employment Annual Change 1960 9,407 5,681
1961 9,523 1.2 % 5,904 3.9 % 1962 9,445 -0.8 5,736 -2.8 1963 9,708 2.8 5,589 -2.6 1964 9,819 1.1 5,572 -0.3 1965 9,932 1.2 5,334 -4.3 1966 9,875 -0.6 5,671 6.3 1967 9,831 -0.4 5,495 -3.1 1968 10,198 3.7 5,188 -5.6 1969 10,369 1.7 5,202 0.3 1970 10,418 0.5 5,285 1.6
Source: JLARC staff analysis of Virginia Employment Commission data.
was opened (the 1960s). The largest sector of the economy in both counties was and remained agriculture. Agricultural employment, however, declined in importance over both decades. Manufacturing and trade employment showed mixed performance. Finance, insurance, real estate and services employment grew both in absolute numbers of jobs and in the share of total employment in those sectors. Finally, government employment grew as a share of total employment in both counties. These patterns are typical of post World War II economic development patterns for the State, and cannot be directly attributed to the CBBT.
One clear and direct impact from the construction of the Bridge-Tunnel was the opening and continued operation of Bayshore Concrete in Northampton County. The plant was built to manufacture pilings, bridge decks, and other concrete components used in the construction of the original CBBT trestles. The Bayshore plant became operational in the 1950s, and while overall manufacturing employment declined dramatically in Northampton County from 1950 to 1960, the loss would have been greater without the estimated 150 to 300 jobs the plant has employed since its opening.
CBBT Traffic and Regional Employment. For the most part, there is no statistically significant relationship between local employment and traffic volume on the CBBT. JLARC staff used several statistical models to assess the relationship between regional employment and traffic volumes. These models covered various periods from 1974 to 2002. The best performing models covered the period from 1986 to the present, because changes in federal local area labor markets made the earlier time series data inconsistent at several points.
The models evaluated the importance of several factors as potential employment drivers. These included overall inflation, fuel prices, measures of State and national business cycles such as personal income and employment, exchange rates, seasonal patterns, and several variables representing changes in the CBBT toll structure and the opening of the parallel span. The models addressed the ques-

Page 29 Chapter II: Role of the Bridge-Tunnel in Economic Growth
tion as to whether any locality in the study area had its monthly employment affected in a statistically significant way by traffic on the CBBT, changes in the toll structure, or changes in any of the other employment drivers.
The results were remarkably consistent. Employment in the general Hampton Roads area and on the Eastern Shore was not related in any statistically significant way to the traffic volume on the CBBT. In all cases, local employment was related to the overall national and statewide business cycle patterns and to seasonal fluctuations.
Employment in Northampton County in any given month is related to county employment in the previous month, time (growth from month to month), and seasonal fluctuations (with employment peaking in summer months), inflation, and population growth in Northampton County. Each of these variables were found to be statistically significant drivers of county employment. The volume of traffic across the CBBT is not a statistically significant factor in determining county employment. Other variables included in the model were county employment 12 months ago, U.S. personal income, U.S. employment, Virginia employment, and the currency exchange rate (which might indicate changes in activity at the port of Hampton Roads). None of these latter variables were found to be statistically significant drivers of county employment.
Employment in Accomack County was evaluated using a model similar to the one applied to Northampton County. The results were very similar. Monthly employment in Accomack is significantly related to last month’s employment, a long term trend, seasonal patterns, inflation, and county population. Traffic volumes, national and state employment, U.S. personal income, and exchange rates were not significant influences on county employment.
This analysis was repeated for all counties in the study area with similar results. CBBT traffic is not a significant influence on regional employment. Additional models indicated that county employment was similarly unaffected by more detailed measures of CBBT traffic. For instance, models were unable to detect any statistically significant relationship between county employment and car traffic, or county employment and truck traffic specifically.
These results are not altogether surprising because CBBT traffic volumes represent such a small fraction of regional trips. Further, the results are consistent with information from interviews conducted for this study, in which local employers indicated that their businesses do not rely on specific volumes of traffic on the Bridge-Tunnel. When local business was considered to be related to traffic volumes, the most important factor was seasonal fluctuation – high in the summer, low in the winter. CBBT traffic and local employment moved together due to these calendar-based effects. The most important factor for most employers was the simple presence of the CBBT. Its presence guaranteed the minimal level of traffic and a connection between the mainland and the Eastern Shore to support their businesses.

Page 30 Chapter II: Role of the Bridge-Tunnel in Economic Growth
CBBT Tolls Cannot Be Used to Restrict or Enhance Growth
Except for a small but statistically significant impact on regional hotel revenues, statistical and other quantitative measures indicate little relationship be-tween the CBBT and economic growth. This conclusion was supported by employers and government officials interviewed for this study. According to those interviewed, the most important role of the CBBT is to serve as a reliable transportation link be-tween the Eastern Shore and the Virginia mainland. The CBBT also serves the wider region, providing an alternative shipment route for producers in the Hampton Roads area to the Northeast, or providing access to Virginia ports for companies further up the East Coast. This impact is most directly felt in several areas on the Eastern Shore. In particular, the CBBT facilitates the agricultural and food processing industries and tourism traffic.
Local Governments Are Expected to Manage Growth, Not the CBBT. In interviews for this study, employers, business owners, citizens, local government officials, and planning district staff agreed that the Chesapeake Bay Bridge-Tunnel was a vital asset for the Eastern Shore. Concerns were expressed about the perceived relationship between the toll structure and negative economic development trends on the Eastern Shore. It was also clear, however, that local officials, employers, and some private citizens do not believe that changes to the toll structure will result in substantial economic development activity beyond that which the Eastern Shore would experience regardless.
The more important issue for those interviewed for this study seems to be the ability of local planning and zoning efforts to properly manage future development and economic growth. Most interviewees felt that it was the responsibility of the local governments to control growth, not the CBBT. Most also felt that the local governments have been slow in responding to the perceived economic development threats. The combination of the concern that local governments have not adequately planned for development and the perception that increased CBBT traffic would result in harmful economic development patterns appears to be the source of controversy over changes in the toll structure.
Officials from both county governments on the Eastern Shore recognized the concerns expressed by many private citizens and community groups. County officials also felt that in the past, local government planning and zoning was inadequate to prevent the types of development patterns feared by these community activists. Officials also noted that, until relatively recently, these types of development patterns had not occurred. To date, there have been no major losses of open space, even though retail “sprawl” along Route 13, and increasing residential development on the coastal areas have become notable development trends.
The county officials interviewed feel that their governments are becoming more responsive to citizen concerns. They noted that only recently have these concerns become sufficiently focused and widespread to play a major role in county public policy making. Individuals expressing these concerns are still not equally vocal or organized in both counties. Observers in and out of government in both counties felt that Northampton County residents have played a larger role in raising the is-

Page 31 Chapter II: Role of the Bridge-Tunnel in Economic Growth
sue of growth management. As a result, Northampton County appears to have made the more dramatic changes to its planning and zoning regulations. Officials in both counties feel that, while their governments are not yet to the point where they can adequately respond to all potential economic development issues, they are moving in the right direction.
Interviews with employers and business owners on the Eastern Shore also found general skepticism about the impact of the toll structure on the local economy. Most employers felt that changes in the toll rates would not affect their business activity. These employers noted that the most important factors affecting their business success are matters of workforce development and the adequacy of the transportation infrastructure along Route 13 on the Eastern Shore. Accordingly, none of the employers interviewed for this study felt that the CBBT commission was responsible for managing economic development on the Eastern Shore. Rather, like others interviewed, they cited a failure of the local governments to promote appropriate development patterns through zoning and planning.
Employers generally believed that growing traffic and retail development along Route 13 was caused by a lack of proper growth management by the county governments. One employer summarized the overall feeling of most of those inter-viewed: “The toll doesn’t make a difference – the county government needs to be controlling development.” Another said that “controlling development is not the CBBT’s problem – this should be done by the elected county officials.” In addition, employers generally felt that governance and administration of the CBBT should not be based on its potential economic or quality-of-life impacts on the Eastern Shore.
Employers also agreed that the primary role of the CBBT is to connect the Eastern Shore to the mainland. While most employers indicated that they would prefer lower tolls on the CBBT, most thought that their businesses were not affected directly by the toll rate. Nor did any plan to alter their hiring or firing plans or ship their products on the basis of toll rates on the facility. In addition, most employers felt that the potential impact of lower tolls would not make a significant difference in economic development. Concerning commercial traffic, a manager from one large employer stated, “I can’t imagine truck traffic increasing or decreasing because of the toll – they’re going to take the shortest route.”
The Link Between CBBT Tolls and Growth Management Is Not Sup-ported by Law. The General Assembly declared in 1956 that the purpose of the construction of a bridge-tunnel crossing the Chesapeake Bay was “for the benefit of the people of the State and for the increase of their commerce and prosperity…” Clearly, the General Assembly intended for the Bridge-Tunnel to serve as an economic link between the Eastern Shore and the Virginia mainland. Analysis for this study shows that the facility has likely met the intent of the General Assembly.
However, this clear intent must be viewed in light of the specific authority granted to those responsible for carrying out that intent. While the Chesapeake Bay Bridge-Tunnel is intended to be a key element in the economic well-being of the Eastern Shore, the Hampton Roads region, and the Commonwealth, the Chesapeake Bay Bridge and Tunnel Commission was not authorized by law to use the toll struc-

Page 32 Chapter II: Role of the Bridge-Tunnel in Economic Growth
ture to either promote or discourage economic development on the Eastern Shore or for the Commonwealth. The Acts of Assembly offer the commission no authority to establish or promote economic development policy on behalf of the district’s member localities or for the Commonwealth. Clearly, the use of the CBBT toll structure to manage economic growth and development was not anticipated in the authorization for the commission to use tolls to finance construction and operation of the facility.
Instead, the same Acts of Assembly that set out the important economic purpose of the facility also explicitly authorize the commission to “fix, revise, charge and collect tolls” for two purposes: (a) to pay the cost of maintaining, repairing, and operating the facility, and (b) to pay the principal of and the interest on bonds issued by the commission, and to create reserves for those purposes. Therefore, the commission is not authorized to revise the toll structure to promote or discourage economic development. Rather, the obligation of the commission is to collect the lowest possible toll which provides sufficient funds for the purposes set out in law.
Conclusion. The Chesapeake Bay Bridge-Tunnel’s appropriate role in economic growth and development is to provide a safe, well-maintained facility, with appropriate capacity, at the lowest practical cost. This does not mean that the toll structure has no impact on economic activity, but rather that the economic impacts cannot be used to drive the toll structure. An appropriate role for the CBBT commission is to provide adequate notice of changes to the toll structure to local governments in the district so they can properly account for those changes in their planning processes. This, in fact, was the view expressed by CBBT commissioners in interviews with JLARC staff.
Based on this review, the expectation is that local governments on the East-ern Shore will manage growth. In addition, it is clear that the CBBT commission is not authorized to use the toll structure as a mechanism to manage economic growth on the Eastern Shore or in Hampton Roads. Therefore, the question of the appropriateness of the toll structure can be more narrowly focused.
Government officials, business leaders, CBBT commissioners, and others interviewed for this study agreed that the essential role of the Bridge-Tunnel in sup-porting commerce in the region could be served best by ensuring that the facility remains a safe, convenient, and low-cost transportation link to the Virginia mainland. This points to a toll structure that ensures adequate revenue to operate and maintain the facility, while at the same time keeping the tolls at the lowest possible level. An appropriate toll structure for the Chesapeake Bay Bridge-Tunnel is one which provides sufficient revenue to support the lowest practical costs for operations, maintenance, debt service, and future capital requirements. In the next chapter, the appropriate toll structure is discussed in detail.

Page 33 Chapter III: The Bridge-Tunnel Toll Structure
III. The Bridge-Tunnel Toll Structure
House Joint Resolution 210 directs JLARC to include as part of the review of the future of the Chesapeake Bay Bridge-Tunnel an examination of the facility’s toll structure. Specifically, the study is to determine the “appropriate toll structure to ensure proper maintenance, sustain CBBT operations, meet debt obligations, and plan for needed capital improvements…” While no specific concerns have been raised regarding the adequacy of the general toll structure to meet the district’s obligations, current and future toll levels have become a part of the debate surrounding several issues. Among these are the impact of tolls on economic growth and development on the Eastern Shore and the adequacy of tolls to fund the construction of parallel tunnels.
The most recent change in CBBT tolls, providing a discount for a 24-hour round trip, has been linked to the debate over growth and development on the East-ern Shore. As discussed in Chapter II, however, the CBBT is not authorized to use the toll structure to manage economic growth, so only Northampton and Accomack counties can provide for appropriate growth management and development planning. Therefore, a proper toll structure need meet only one clear goal: CBBT tolls should provide adequate revenue to cover expenses related to maintenance, operations, debt service, and future capital requirements.
Based on CBBT projections, as well as independent estimates by JLARC staff, the general toll structure appears to provide adequate revenues for operations, maintenance, and debt service well into the future. In fact, the current level of toll revenue may provide sufficient funds for the CBBT to defease its current bonds by 2010, instead of 2025 as set out in the bond schedules. The current level of tolls may be inadequate to cover the cost of constructing parallel tunnels, however. This raises concerns about the recently implemented discount, which has not been effective in inducing substantial amounts of new traffic.
Overview of the CBBT Toll Structure
The Chesapeake Bay Bridge and Tunnel District has implemented a variable toll rate structure based on the number of axles of the vehicles using the facility. This is consistent with the tolling structure for other toll facilities in Virginia. Toll rates based on gross vehicle weight or vehicle length are more difficult to ad-minister, and are not used in Virginia, or by the CBBT.
Currently, the CBBT toll schedule has 14 toll classes or rates, grouped into three major types of vehicles: passenger cars and light trucks, buses, and heavy trucks (Table 5). The variable toll rate structure based on axles is a recognition that larger, heavier vehicles contribute more to the deterioration of the facility and the costs to maintain it. The necessity of accommodating larger vehicles also added significantly to the cost of construction. Without the need to accommodate heavy trucks, for example, tunnel ceilings would not have to be as high, and travel lanes on

Page 34 Chapter III: The Bridge-Tunnel Toll Structure
Table 5 Chesapeake Bay Bridge-Tunnel Toll Structure
Effective March 1, 2002
Class Passenger Cars, Light Trucks, and RVs Toll 1 Two axle, four tire vehicle including passenger car, pick-up truck,
panel truck, station wagon, motorcycle, and minibus/van with 15 or less seating capacity.
$10.00
65 Return trip of Class 1 vehicle within 24 hours, with receipt. 4.00 2 Class 1 vehicle towing one-axle trailer. 13.00 3 Class 1 vehicle towing two-axle trailer or other two-axle vehicle. 16.00 4 Class 1 vehicle towing three-axle trailer. 19.00
Buses 8 School buses as defined by the Code of Virginia. $10.00
14 Two-axle buses. 25.00 15 Three-axle buses. 26.00
Heavy Trucks and RVs 9 Two-axle, six-tire vehicle (except buses). $14.00
10 Three-axle vehicle, (except buses); Class 9 vehicle towing one-axle trailer.
18.00
11 Four-axle vehicle; Class 9 vehicle towing two-axle trailer or other two-axle vehicle; Class 10 vehicle towing one-axle trailer.
24.00
12 Five-axle vehicle; Class 9 vehicle towing three-axle trailer; Class 10 vehicle towing two-axle trailer; Class 11 vehicle towing one-axle trailer.
30.00
13 Six-axle vehicle; Class 10 vehicle towing three-axle trailer; Class 11 vehicle towing two-axle trailer; Class 12 vehicle towing one-axle trailer.
36.00
16 Special over-dimension vehicle*, i.e. vehicles unable to maintain 45 mph, exceeding 80,000 lbs, 100 feet in length, or 8 feet, 6 inches in width. (Maximum width permitted, 14 feet.)
60.00
*Escort fee and prior approval required except over-width vehicles less than 10 feet, six inches.
60.00
Source: Chesapeake Bay Bridge and Tunnel District.
the bridges could be narrower. Because these larger, heavier vehicles contribute more to the cost of construction and maintenance, it is equitable for those vehicles to pay more to use the facility. Again, this is consistent with the tolling practices of other facilities in Virginia and throughout the United States.
The minimum toll of $10 has been in effect since the last major adjustment to the toll structure in October 1991. The $4 toll for a round trip within 24 hours became effective in March 2002. It is the only discount available on the CBBT. The maximum toll, in effect since April 1980, is $120 for over-dimension vehicles, consisting of a $60 toll and a $60 escort fee. The over-dimension fee is intended to re-

Page 35 Chapter III: The Bridge-Tunnel Toll Structure
coup some of the costs associated with having to provide a police escort for those vehicles, and for closing the tunnels to other traffic while the vehicle passes.
Over the past 38 years, the toll structure has been adjusted nine times, with the last general increase in 1991. That increase was for the purpose of generating sufficient revenue for cash and debt service needed to construct the parallel bridges in 1995.
CBBT Tolls in Context
HJR 210 notes that the Chesapeake Bay Bridge-Tunnel has the highest toll per mile of any facility in the nation. In fact, however, the toll cost of other transportation facilities exceeds the CBBT, for both shorter and comparable distances. In one particularly useful comparison, travel for a 17-mile trip by ferry costs twice as much, and takes more than twice as long as the 17.6-mile trip on the CBBT. The current CBBT toll can also be assessed based on inflation since the opening of the facility.
Comparison of Virginia Facilities’ Toll Cost-per-Mile. In comparing tolls for passenger cars across transportation facilities, it is useful to make such comparisons on a per-mile basis. The per-mile comparison helps to relate the toll charge to the operating and capital costs of the facility, which vary by length and type of facility. In Virginia, there are currently ten toll facilities operated by five different organizations (Table 6). The Chesapeake Bay Bridge-Tunnel has the highest actual toll of these ten facilities, but the third highest toll per mile, at $0.50 per mile. The George P. Coleman Bridge has the highest per-mile toll, at $1.00 per mile. This and several other facilities offer substantial discounts for commuters, however, in the form of the electronic toll system called Smart-Tag. The CBBT has not implemented the Smart-Tag system, so no discount of that sort is available. The CBBT does provide a 30 percent discount for passenger cars making a round trip within 24 hours. When discounts are considered, the Boulevard Bridge in Richmond, for which no discount is available, has the highest per-mile toll, at $0.66 per mile.
Costs and Time of a Comparable Trip by Ferry. It is impossible to know what the toll would have been today for ferry service across the Chesapeake Bay had the Bridge-Tunnel not been built. Simple inflation of the ferry tolls from the time the service was discontinued would place the toll today at more than $19 for the car and driver. But inflating the toll from 1964 does not recognize the likely changes in service which would have occurred over the past 38 years. Instead, a comparison with an active ferry service is more useful. The Cape May-Lewes Ferry in Delaware provides a useful comparison of costs for a trip of almost identical length.
The Cape May-Lewes Ferry provides for vehicular crossing of the Delaware Bay, a distance of 17 miles. The CBBT, at 17.6 miles, provides for a crossing of almost the same distance across the Chesapeake Bay. There is a significant difference in both cost and travel time, however. The one-way toll for a passenger car and the driver on the Cape May-Lewes Ferry is $25, with an additional toll of $5 for each

Page 36 Chapter III: The Bridge-Tunnel Toll Structure
Table 6 Comparison of Toll Rates for Virginia Transportation Facilities
Length Regular Per-Mile Smart-Tag Discount Facility (Operator) (Miles) Toll Rate Discount Rate
Coleman Bridge (VDOT)* 1.0 $2.00 $1.00 Yes $0.25 Boulevard Bridge (RMA) 0.38 $0.25 $0.66 No $0.66
Chesapeake Bay Bridge-Tunnel (CBB&TD) 20.0 $10.00 $0.50 No** $0.35
Downtown Expressway (RMA) 2.5 $0.50 $0.20 Yes $0.18
Pocahontas Parkway (VDOT) 8.8 $1.50 $0.17 Yes $0.15
Powhite Parkway(RMA) 3.4 $0.50 $0.15 Yes $0.13
Chesapeake Expressway (Chesapeake) 16.0 $2.00 $0.13 Yes $0.03
Dulles Greenway (Private) 14.0 $1.50 $0.11 Variable $0.10-0.09
Powhite Parkway Extension (VDOT) 10.0 $0.75 $0.075 Yes $0.067
Dulles Toll Road (VDOT) 14.0 $0.50 $0.04 No $0.04
*Toll charged for traffic in northbound direction only. **30 percent discount provided for 24-hour round trip.
Source: Virginia Department of Transportation, Chesapeake Bay Bridge and Tunnel District, and the Richmond Metropolitan Authority.
passenger. The one-way toll on the CBBT is $10, with no charge for passengers. So, a passenger car with the driver and two passengers will cost $35 on the ferry, but only $10 on the CBBT. There is also a cost difference for five-axle trucks (tractor-trailers). The CBBT toll is $30, while the Cape May-Lewes Ferry toll is $52 (or $71 if longer than 60 feet).
Travel time for the ferry is approximately one hour and ten minutes, plus about 30 minutes for loading and unloading of vehicles. Traffic on the CBBT crosses the 17.6 miles of the Chesapeake Bay in about 25 minutes, less than one-third of time needed to cross the 17 miles of Delaware Bay on the Cape May-Lewes Ferry. This is an especially important difference for commercial traffic for which additional time means higher operating costs. Based on this comparison, it is reasonable to expect that the Bridge-Tunnel provides faster, cheaper transportation across the Chesapeake Bay than the ferries it replaced more than 38 years ago.
Current Tolls and Inflation. When the Chesapeake Bay Bridge-Tunnel was opened in April 1964, the toll was set at a rate slightly higher than the toll for the ferries it replaced. The toll for a car and driver was $4.00, with an additional $0.85 per passenger. The passenger charge was eliminated in 1971, when the toll was increased to $5.25. Since 1964, inflation in the consumer price index totals more than 555 percent, but the CBBT toll for cars has increased 250 percent. If the 1964 toll had been increased to keep pace with inflation, it would now be $22.20, with an additional charge of $4.70 for each passenger – or $35.70 for the car and its four occupants.

Page 37 Chapter III: The Bridge-Tunnel Toll Structure
For five-axle trucks, the toll has increased from $16 in 1964 to $30 currently, or only about 188 percent. Had the five-axle truck toll kept pace with inflation, it would now be about $89.
Tolls Are Adequate for Operations, Maintenance, and Debt Service
To assess the adequacy of toll revenues for the Chesapeake Bay Bridge-Tunnel, JLARC staff first reviewed current financial statements for the CBBT. That review provided a short-term view of revenue, expenses, and the financial soundness of CBBT operations. To determine the adequacy of toll revenues over time, JLARC staff examined the CBBT’s intermediate-term projections of expenses and revenues, and prepared an independent long-range estimate of toll revenues and operational expenses. These analyses found that revenues are adequate over the short, inter-mediate, and long term.
Current Toll Revenues Are Adequate for Operations, Maintenance, Reserve Maintenance, and Debt Service. In FY 2002, 3,294,480 vehicles used the Chesapeake Bay Bridge-Tunnel, generating approximately $38.4 million in toll revenues. For the year, total expenses, including ordinary maintenance, maintenance reserve projects, operations, and debt service totaled $26.8 million. This resulted in net toll revenue of $11.6 million, which is accumulated in the district’s general fund. Therefore, toll revenues are adequate to cover CBBT costs, even without other sources of income such as returns on investments or the urban street payments from VDOT. There are also sufficient reserves in various accounts such as the reserve maintenance fund required by the district’s bond resolutions.
Revenues Are Sufficient to Defease Bonds Early, According to CBBT Intermediate-Term Projections. Debt service for the six outstanding bond issues totals $357 million over the 23 years remaining in the debt service schedule. The debt service structure was designed to provide a window for additional debt in the 2011 to 2016 timeframe, when CBBT management expected construction of the parallel tunnels to be necessary and economically viable. The current schedule for retirement of CBBT debt calls for payments of principal and interest on the six out-standing series of bonds through the end of FY 2025.
At its meeting in August 2002, the CBBT commission requested that staff examine the projected revenue stream and determine whether the district’s bonds could be defeased earlier than scheduled. In response to the commission’s request, the CBBT staff prepared a projection of revenues and expenses through 2012. The CBBT staff analysis shows that revenues will be sufficient to defease all outstanding bonds by FY 2010. The commission has not yet approved any action to defease the bonds early.
Over the ten years in the CBBT staff projection, toll and other revenues are estimated to total almost $468 million. Operating expenses, reserve maintenance, debt service, and other costs are projected at $359 million. Over the ten years in the CBBT projections, then, the general fund would accumulate an additional $109 mil-lion, resulting in a balance of more than $173 million by 2012. By 2010, the general

Page 38 Chapter III: The Bridge-Tunnel Toll Structure
fund balance would exceed the $114.9 million in outstanding principal on CBBT bonds, permitting the district to defease outstanding issues. Thus, the CBBT inter-mediate-term projections demonstrate that toll revenues are more than adequate through 2012.
Long-Term Toll Revenues Also Appear Adequate. Since the focus of this review was to be on the future of the Chesapeake Bay Bridge-Tunnel, JLARC staff completed an analysis of the adequacy of toll revenues through 2025, the year that the district’s current debt service requirements are satisfied. The analysis involved a projection of CBBT traffic, estimates of toll revenue based on the traffic projections, and estimates of costs for operating, maintenance, and debt service. JLARC staff also made projections of other revenue sources, such as urban street payments from VDOT and interest on investments.
The traffic projections were based on a series of regression models designed to explain the seasonal and long-term trends in the traffic data from prior years. A separate model was developed for each class of vehicles. A total of seven independent variables (and seasonal and toll structure dummy variables) were included in the models, although not all of the variables were used in every model. The variables included in the models were: U.S. employment, Virginia non-agricultural employment, regional (CBBT district) employment, real U.S. personal income, Virginia population, regional (CBBT district) population, and the motor fuels consumer price index.
Since the projections covered a 23-year period, the JLARC staff models were adjusted to account for the observed historical impact of economic recessions on CBBT traffic. The JLARC staff traffic projections include two simulated recessions, each lasting nine months. Historically, recessions have occurred approximately every ten years, so JLARC staff models assume recessions beginning in January 2012 and January 2024. Toll revenues were estimated from the traffic projections on a monthly basis by applying the appropriate toll rate to the projected traffic counts for each vehicle class. Table 7 shows the projected total traffic and revenue for the CBBT through 2025, and Appendix C describes the traffic models in more detail.
The VDOT urban street payments for future years were estimated from the five-year trend of the maintenance cost index, because annual changes in the most recent period are dissimilar to changes in more distant years. Other revenues include rent and concessions from the Sea Gull Pier restaurant, which were projected from the prior five-year trend, and interest on CBBT securities, which were projected by CBBT finance staff based on the estimated return on U.S. Government securities.
Long-term estimates of CBBT expenses in various categories and projections of other revenues were based on the most recent five- or 12-year trends, de-pending on the stability of the trend over time. The estimated operating costs, for example, were based on the prior 12-year trend because those costs are largely for the salaries of CBBT maintenance and operating personnel, and tend to grow at a

Page 39 Chapter III: The Bridge-Tunnel Toll Structure
Table 7 Chesapeake Bay Bridge-Tunnel Estimated Traffic and Toll Revenues
Fiscal Total Traffic Total Toll Fiscal Total Traffic Total Toll Year Count Revenue Year Count Revenue
2003 3,575,652 $38,730,000 2015 4,059,882 $43,218,000 2004 3,626,194 39,240,000 2016 4,121,844 43,826,000 2005 3,678,495 39,764,000 2017 4,185,819 44,459,000 2006 3,731,968 40,299,000 2018 4,251,514 45,109,000 2007 3,786,640 40,846,000 2019 4,318,868 45,777,000 2008 3,842,551 41,405,000 2020 4,387,893 46,461,000 2009 3,899,739 41,977,000 2021 4,458,619 47,162,000 2010 3,958,241 42,562,000 2022 4,531,086 47,881,000 2011 4,018,088 43,160,000 2023 4,605,340 48,617,000 2012 4,042,418 43,358,000 2024 4,641,896 48,936,000 2013 3,958,925 42,310,000 2025 4,562,048 47,935,000 2014 4,001,355 42,658,000
Source: JLARC staff regression models of traffic and the CBBT toll rate schedule.
relatively constant rate over time. Costs for reserve maintenance projects were relatively low prior to 1999 due to construction of the parallel bridges, but have experienced significant increases in recent years. Therefore, for reserve maintenance costs, CBBT projections from the six-year reserve maintenance plan were used through 2008, with the five year average of the VDOT maintenance cost index used to inflate costs for the period from 2009 to 2025. Debt service costs did not have to be projected because the actual annual amounts are included in the payment schedules in the official statements of bond issues.
Table 8 shows JLARC staff’s projection of toll and other revenues compared to estimated expenses through 2025, with the net revenue to be accumulated in the district’s general fund. Long-term projections by JLARC staff of operating and maintenance costs, toll revenues, and other sources of funding indicate that the revenue stream is more than adequate for the anticipated costs for operations, maintenance, and existing debt service well beyond 2025. Over the 23-year period there is no year in which revenues are less than estimated expenses. Toll revenue for the 23 years is estimated to total just over $1.0 billion, and the total of all revenue is estimated at $1.3 billion. Total expenses are estimated to total about $900 million for the 23-year period. As a result, the CBBT general fund could accumulate a cash balance of about $450 million.
Future Capital Improvements Will Depend on Available Funding
While the toll structure is more than adequate for the current and future cost of operations, maintenance, and debt service, it may be inadequate to fund future capital improvements. Specifically, the costs to construct parallel tunnels for both shipping channels may exceed the funds the district will have available, de-pending on when those additional facilities will be needed. The likely unavailability

Page 40 Chapter III: The Bridge-Tunnel Toll Structure
Table 8 Chesapeake Bay Bridge-Tunnel
Projected Revenues, Expenses, and Net Income (In $Millions)
Revenues Expenses Urban Street
Payments Other Total
Revenues Operations Maintenance
Reserve Debt
Service Total
Expenses Net
RevenueFY Tolls
2003 $38.7 $1.0 $4.6 $44.3 $9.8 $9.5 $22.4 $41.7 $2.6
2004 39.2 1.0 4.5 44.8 10.2 9.4 22.4 42.1 2.7
2005 39.8 1.1 4.7 45.5 10.7 7.3 22.4 40.4 5.1
2006 40.3 1.1 5.0 46.4 11.1 5.8 22.4 39.4 7.0
2007 40.8 1.1 5.3 47.3 11.6 5.8 22.4 39.9 7.5
2008 41.4 1.2 5.7 48.2 12.1 5.8 22.4 40.4 7.9
2009 42.0 1.2 6.1 49.2 12.7 6.0 22.4 41.0 8.2
2010 42.6 1.2 6.5 50.3 13.2 6.1 16.3 35.6 14.7
2011 43.2 1.3 7.2 51.6 13.8 6.3 6.3 26.4 25.2
2012 43.4 1.3 8.2 52.9 14.4 6.5 6.3 27.2 25.6
2013 42.3 1.3 9.2 52.8 15.0 6.7 6.2 27.9 24.9
2014 42.7 1.4 10.2 54.2 15.7 6.8 6.5 29.0 25.2
2015 43.2 1.4 11.2 55.9 16.4 7.0 6.5 29.9 26.0
2016 43.8 1.5 12.3 57.6 17.1 7.2 6.5 30.8 26.8
2017 44.5 1.5 13.4 59.3 17.9 7.4 11.1 36.4 22.9
2018 45.1 1.5 14.3 61.0 18.7 7.6 17.0 43.3 17.6
2019 45.8 1.6 15.1 62.5 19.5 7.8 17.0 44.4 18.1
2020 46.5 1.6 15.9 64.0 20.3 8.1 17.0 45.4 18.6
2021 47.2 1.7 16.8 65.7 21.2 8.3 17.0 46.5 19.1
2022 47.9 1.7 17.7 67.3 22.1 8.5 17.0 47.7 19.6
2023 48.6 1.8 18.6 69.0 23.1 8.8 16.5 48.3 20.7
2024 48.9 1.8 19.6 70.4 24.1 9.0 16.5 49.6 20.8
2025 47.9 1.9 20.6 70.4 25.2 9.3 16.5 50.9 19.5
Total $1,005.7 $32.3 $252.6 $1,290.6 $376.1 $171.1 $357.0 $904.2 $386.4
Source: JLARC staff estimates of revenues and expenses.
of State and federal transportation funds to supplement toll and other existing revenues means that the CBBT commission will need to: (1) develop a long-range capital plan which includes an assessment of the ability of the district to fund future projects, and (2) reassess the long-term adequacy of the toll structure based on capital funding requirements. Analysis completed for this study indicates that the current toll structure will likely generate insufficient funds for parallel tunnels, which will be needed by the year 2020.
The Need for Parallel Tunnels Will Be Driven by Increases in Traffic. The project to construct the parallel bridges, completed between 1995 and 1999, did not include parallel tunnels for the Thimble Shoal or the Chesapeake channels. The tunnels were excluded from the parallel project because the district had insuffi-

Page 41 Chapter III: The Bridge-Tunnel Toll Structure
cient sources of funding to cover the costs to construct them. The parallel bridges were aligned, however, so that the tunnels could be constructed at a later date.
Since completion of the parallel bridges there has been considerable debate among CBBT commissioners and staff about the timing for construction of the tunnels. In interviews with JLARC staff, some commissioners and staff felt that the process to build the tunnels should begin almost immediately, before escalation in costs make the project more difficult to fund. They also expressed concern about the safety of two-way traffic in the tunnels and in the tunnel approaches where the four lanes of traffic merge into two lanes. These commissioners and staff said that the tunnels might be needed as early as 2010. Other commissioners and staff believe the tunnels will not be needed until after 2020, when traffic is more likely to justify the additional capacity that would be provided by the new tunnels. These commissioners and staff also note that there are few accidents in the tunnels or merge zones, indicating that the existing tunnel configuration does not pose a particular safety hazard to motorists.
To assess the adequacy of the toll structure to support construction of the tunnels, JLARC staff first examined the need for, and timing of, construction of the tunnels based on four criteria: increases in traffic, improvements to safety, tunnel maintenance, and the future need for deeper shipping channels in the bay. As with the construction or expansion of any highway, bridge, or other transportation facility, the primary reason for construction should be to carry an increasing flow of traffic. Unless safety concerns or some other factor indicates a need to construct the tunnels earlier, JLARC staff assumed for this analysis that traffic would be the factor that determines when the tunnels should be built.
Therefore, the first criterion for determining when the parallel tunnels might need to be in service is the growth in traffic. JLARC staff used the monthly projections of traffic to examine how the increases in traffic over time would expand peak periods currently seen only in July and August to other months, and how traffic in the peak periods would increase. During the peak periods of traffic, the facility currently experiences some congestion in the tunnels and merge areas at the tunnel entrances.
According to the Transportation Research Board of the National Academy of Engineering, a two-lane highway with the configuration similar to that of the CBBT tunnels will experience moderate congestion when traffic reaches about 710 vehicles per hour. Congested conditions and potentially unstable traffic flow occur when traffic reaches about 1,390 vehicles per hour. Bridge-Tunnel peak traffic occurs between 8:00 a.m. to 5:00 p.m. About 37 percent of the traffic each week in July and August currently experiences moderate congestion, and an additional 13 percent of the traffic each week experiences congested, unstable traffic flow.
Given the current volume of traffic and the pattern of peak traffic on the Bridge-Tunnel, this level of traffic equates to a monthly volume of about 333,000 vehicles. JLARC staff used this level of monthly traffic to determine how periods of congestion and unstable flow might extend to other months of the year as traffic continues to grow. The traffic models developed by JLARC staff were used to project

Page 42 Chapter III: The Bridge-Tunnel Toll Structure
monthly volume through the year 2025. As shown in Table 9, actual traffic in July and August of 2001 exceeded the monthly threshold for periods of congestion and unstable traffic flow. By 2010, traffic in five months exceed the threshold, and by 2015 traffic in two additional months approach the threshold as well.
By 2020 the monthly traffic exceeds the criterion for periods of congestion for eight months, from April to November. Also by 2020, traffic in July and August is projected to surpass one-half million vehicles per month, or about 27 percent more than the volume of traffic in those peak months currently. Since traffic volume is not evenly distributed over the course of the day, the impact of the increases will be most problematic during peak hours. JLARC staff used the hourly traffic patterns to estimate the traffic in peak periods by 2020. In peak hours, traffic could be expected to reach 2,300 vehicles per hour, well above the level for congestion and unstable traffic flow. Unstable flow could be expected for up to eight hours on Saturdays, the day with the heaviest traffic. Based on the JLARC staff projections of traffic, it appears the CBBT should be expected to have the parallel tunnels in place and open to traffic by 2020.
As a second step in the analysis, JLARC staff examined accident data to determine if specific safety concerns about the tunnels and merge zones might indicate a need to begin construction earlier than indicated by increases in traffic. Descriptions of all reportable motor vehicle accidents on the facility since April 1999 were
Table 9 Projected Monthly Traffic for the Chesapeake Bay Bridge-Tunnel
Actual Estimated Traffic Count in Each Month
Month 2001 2005 2010 2015 2020 2025 January 168,622 218,869 242,207 250,680 278,047 292,208 February 169,054 212,269 235,651 244,136 271,566 285,606 March 199,509 251,496 274,919 283,417 310,909 324,814 April 260,991 300,711 324,178 332,690 360,243 374,024 May 274,632 326,716 350,226 358,751 386,366 400,026 June 304,646 341,634 365,184 373,723 401,400 414,942 July 394,554 442,394 465,992 474,545 502,283 515,712 August 390,561 441,731 465,370 473,938 501,736 515,055 September 273,471 323,936 347,622 356,205 384,064 397,275 October 248,321 295,539 319,269 327,869 355,787 369,048 November 258,321 281,881 305,656 314,274 342,250 355,505 December 236,573 267,892 291,712 300,348 328,383 341,653
Note: = Traffic in excess of 333,000 vehicles per month; = Traffic in excess of 400,000 vehicles per month; = Traffic in excess of 500,000 vehicles per month.
Source: JLARC staff analysis of CBBT monthly traffic.

Page 43 Chapter III: The Bridge-Tunnel Toll Structure
reviewed to identify how many involved two-way traffic in the tunnels or merging traffic in the approaches. The purpose was to determine how many accidents might have been avoided if the parallel tunnels were now in place.
In the 44 months since the parallel bridges have been open there have been 88 reportable accidents, and only 19 were in the tunnels or on the tunnel approaches where traffic merges to a single lane. None of the 19 involved fatalities. Only three of the accidents could likely have been avoided if parallel tunnels were in use. Most involved driver error, such as excessive speeds on wet pavement or falling asleep. Therefore, the accident data do not appear to indicate the tunnels or merge zones present any unreasonable safety hazards to motorists.
A third assessment related to the ability of the district to perform ordinary maintenance in the tunnels. On the bridges, a lane can be closed for maintenance without the need for flagmen to alternate traffic. Trucks with crash cushions protect maintenance staff while work is underway. Because the tunnels have two lanes with opposing traffic, maintenance work in one lane requires that police or emergency crew members stop and alternate traffic in the remaining lane. In interviews with JLARC staff, CBBT maintenance personnel reported that the requirement for lane closures severely limits the ability to complete required maintenance tasks in the tunnels. For example, due to concerns about rear-end collisions, lane closures are not made when the bridge pavement is wet due to rainy weather. Parallel tunnels with two lanes of traffic in each direction would provide maintenance personnel with greater flexibility in completing work in the tunnels.
However, even under current conditions, maintenance staff indicated that work can proceed in the tunnels when necessary, with some inconvenience to the traveling public. At no time did any maintenance staff indicate that the restrictions related to lane closures were making it impossible to do necessary work. The limitations on maintenance do not appear, then, to be a sufficient justification for advancing the construction of the parallel tunnels prior to the year 2020.
One final consideration in determining when the parallel tunnels should be constructed is the proposal by the Virginia Port Authority (VPA) to increase the depth of the Thimble Shoal Channel from 50 feet to 65 feet below mean low water. Because the top of the existing tunnel structure is at 63 feet, with an additional 10 feet of protective cover, the CBBT is a significant barrier to a deeper channel. In a study released in August 2002, the VPA recommended that the channel be deepened to the authorized 55 feet. This would require that five feet of protective cover be re-moved from the portion of the Thimble Shoal Channel directly below the shipping channel. The U.S. Army Corps of Engineers has recommended that a layer of armor rock be used to cover the tunnel to protect it from ships running aground or sinking on the tunnel. With this modification, the VPA report concludes that the channel "could effectively accommodate all of the container vessels likely to serve the Atlantic Coast container trades over the next 10 to 20 years." With regard to the dry bulk fleet, such as ships transporting grain or coal, the report states that a 55 foot channel "can accommodate approximately 70% of the world's dry bulk fleet capacity…."
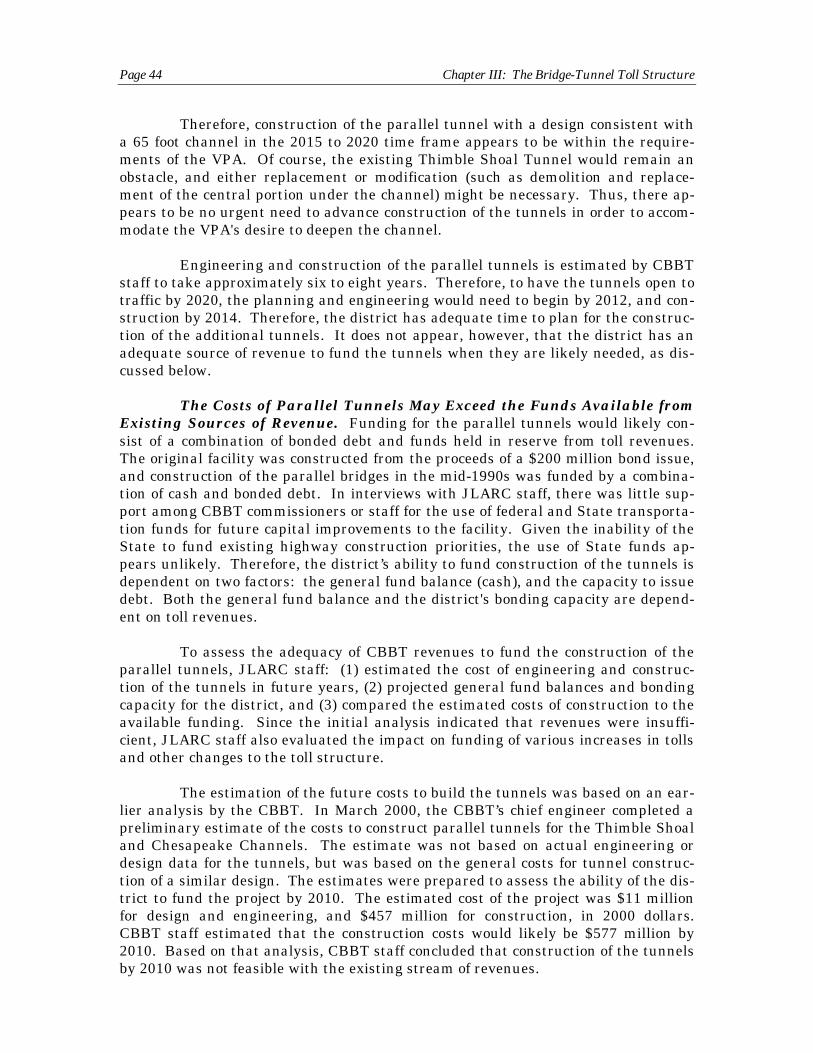
Page 44 Chapter III: The Bridge-Tunnel Toll Structure
Therefore, construction of the parallel tunnel with a design consistent with a 65 foot channel in the 2015 to 2020 time frame appears to be within the requirements of the VPA. Of course, the existing Thimble Shoal Tunnel would remain an obstacle, and either replacement or modification (such as demolition and replacement of the central portion under the channel) might be necessary. Thus, there appears to be no urgent need to advance construction of the tunnels in order to accommodate the VPA's desire to deepen the channel.
Engineering and construction of the parallel tunnels is estimated by CBBT staff to take approximately six to eight years. Therefore, to have the tunnels open to traffic by 2020, the planning and engineering would need to begin by 2012, and construction by 2014. Therefore, the district has adequate time to plan for the construction of the additional tunnels. It does not appear, however, that the district has an adequate source of revenue to fund the tunnels when they are likely needed, as discussed below.
The Costs of Parallel Tunnels May Exceed the Funds Available from Existing Sources of Revenue. Funding for the parallel tunnels would likely consist of a combination of bonded debt and funds held in reserve from toll revenues. The original facility was constructed from the proceeds of a $200 million bond issue, and construction of the parallel bridges in the mid-1990s was funded by a combination of cash and bonded debt. In interviews with JLARC staff, there was little sup-port among CBBT commissioners or staff for the use of federal and State transportation funds for future capital improvements to the facility. Given the inability of the State to fund existing highway construction priorities, the use of State funds appears unlikely. Therefore, the district’s ability to fund construction of the tunnels is dependent on two factors: the general fund balance (cash), and the capacity to issue debt. Both the general fund balance and the district's bonding capacity are dependent on toll revenues.
To assess the adequacy of CBBT revenues to fund the construction of the parallel tunnels, JLARC staff: (1) estimated the cost of engineering and construction of the tunnels in future years, (2) projected general fund balances and bonding capacity for the district, and (3) compared the estimated costs of construction to the available funding. Since the initial analysis indicated that revenues were insufficient, JLARC staff also evaluated the impact on funding of various increases in tolls and other changes to the toll structure.
The estimation of the future costs to build the tunnels was based on an earlier analysis by the CBBT. In March 2000, the CBBT’s chief engineer completed a preliminary estimate of the costs to construct parallel tunnels for the Thimble Shoal and Chesapeake Channels. The estimate was not based on actual engineering or design data for the tunnels, but was based on the general costs for tunnel construction of a similar design. The estimates were prepared to assess the ability of the district to fund the project by 2010. The estimated cost of the project was $11 million for design and engineering, and $457 million for construction, in 2000 dollars. CBBT staff estimated that the construction costs would likely be $577 million by 2010. Based on that analysis, CBBT staff concluded that construction of the tunnels by 2010 was not feasible with the existing stream of revenues.

Page 45 Chapter III: The Bridge-Tunnel Toll Structure
Using the CBBT's preliminary estimate and the 15-year trend in the U.S. Bureau of Labor Statistics (BLS) producer price index for highway and street construction, JLARC staff projected the cost of design, engineering, and construction for each year through 2025. Engineering costs were estimated to be $14 million by 2012, and construction costs were projected to be approximately $609 million by 2014, the year in which construction would begin and the price would be established by contract.
Projected net revenues through 2025 (Table 8, p. 40) were used by JLARC staff to estimate the CBBT’s general fund balances for each year. The total bonding capacity for each year was estimated by CBBT finance division staff based on the projected funds available for debt service from the JLARC toll revenue projections, a 120 percent bond coverage rate, and a 30-year term on any bonds issued. The amount of bonds that could likely be issued in any given year was reduced by the total of outstanding bond principal for all prior issues.
Table 10 shows the availability of funding for construction of the tunnels in five-year increments through 2025. The table also shows the funding status in 2014, the year construction would need to begin in order for the district to open the tunnels to traffic by 2020. In 2014, the district will likely have insufficient funds avail-able to begin construction of the tunnels, with a shortfall of cash and bonding capacity of about $103 million. With the current revenue stream, sufficient funding may not be available until 2020.
The 24-Hour Round Trip Discount Has Affected Toll Revenues. To assess the impact of the 24-hour round trip discount on traffic and revenues, JLARC staff analyzed passenger car traffic statistics and conducted two surveys of motorists using the discount. The analysis of traffic compared the overall growth in passenger car traffic to the increases in the number of cars qualified to use the round-trip discount for each month after its implementation. Since the CBBT accounts for discount vehicles as a separate toll class, detailed statistics are available from the toll collection system.
Table 10 Funding Available for Construction of Parallel Tunnels
(In $Millions, Current Toll Rates)
Year
General Fund
Balance Total Debt Capacity
Principal Outstanding
Debt Capacity Available
Total Funds
Available
Tunnel Construction
Costs
Funding (Shortage)/
Excess
2002 $ 64.2 $315 $218.7 $ 96.3 $160.5 $468.9 $(308.4) 2010 119.9 390 114.9 275.1 395.0 558.1 (163.1) 2014 220.8 399 113.7 285.3 506.1 608.8 (102.7) 2015 246.8 409 113.2 295.8 542.6 622.2 (79.6) 2020 350.8 449 71.5 377.5 728.3 693.8 34.5 2025 450.5 453 0 453.0 903.5 773.5 130.0
Source: JLARC staff analysis of CBBT financial and other data.

Page 46 Chapter III: The Bridge-Tunnel Toll Structure
The two surveys of motorists were administered by CBBT toll collectors as motorists presented receipts to qualify for the discount. Each motorist was asked whether the current round trip would have been taken if the discount were not available, and whether the trip was for a personal or business purpose. Those motorists who said that the trip would not have been taken without the discount were asked additional follow-up questions related to the number of round trips they completed each month before and after the discount was implemented. The survey was administered 24 hours a day, for the full weeks of August 5 through August 11, 2002, and October 7 through October 13, 2002. Of the 9,235 vehicles that qualified for the discount during the week of August 5, surveys were completed for 7,323 vehicles (79 percent). In October, of 7,792 vehicles qualified for the discount, surveys were completed for 6,483 (83 percent).
Based on both the analysis of monthly traffic and the JLARC survey of motorists, the 24-hour round trip discount toll appears to have largely shifted vehicles from one toll class to another, rather than increasing traffic overall. Table 11 shows the monthly passenger car counts for the period from January through September in 2001 and 2002. The table shows the typical seasonal increase in traffic in the summer months, and the growth from one year to the next. In 2002, traffic growth has exceeded that seen historically. CBBT staff and the district’s traffic engineer believe the increase is the result of substantial reductions in commercial air travel and a shift to more travel by car.
The table also shows the shift of vehicles from the full toll rate to the discount. The surge in traffic in March 2002, when the discount became effective, appears to be partially in response to the discount, but is also as a result of the Easter holiday at the end of the month. For the period from April to September 2002, there was a reduction in the number of vehicles in the full toll class in comparison to the
Table 11 Monthly Passenger Car Traffic for 2000, 2001, and 2002
MonthJanuaryFebruaryMarch April MayJune JulyAugustSeptemberOctoberNovemberDecember
2002 2000 2001 Full Toll Discount Total
129,880 139,189 146,322 146,322 137,198 140,671 154,985 154,985 166,515 165,898 181,395 28,701 210,096 211,942 223,064 190,428 29,473 219,901 226,514 231,623 227,997 32,701 260,698 248,162 259,824 255,272 35,714 290,986 337,256 344,336 326,180 40,599 366,779 312,172 343,565 340,610 39,930 380,540 231,896 237,220 214,670 34,024 248,694 207,141 211,004 N/A N/A N/A 208,130 224,771 N/A N/A N/A 182,890 209,164 N/A N/A N/A
Source: Chesapeake Bay Bridge-Tunnel toll collection system.

Page 47 Chapter III: The Bridge-Tunnel Toll Structure
same period from the year before. This reduction occurred while the total passenger car traffic increased overall. In fact, the general increase in traffic makes it difficult to isolate the actual impact of the discount on traffic.
Therefore, to better understand the traffic statistics, JLARC staff used the results of the two motorist surveys to estimate how much of the increase in traffic in 2002 might be induced by the discount. Based on responses to the motorist survey, between 2.7 and 4.5 percent of traffic using the discount appears to be induced traffic, or new traffic using the facility as a result of the discount. In August 2002, induced traffic amounts to about 1,790 vehicles, or about one-half of one percent of total passenger car traffic. This is only about 4.8 percent of the increase in monthly traffic from August of the prior year. In the winter months the proportion of induced traffic will likely be even lower.
The analysis of traffic and toll data indicates that the discount results in a significant reduction in toll revenue from Class 1 vehicles (passenger cars). Using the JLARC staff projections of monthly traffic in FY 2003, the 24-hour discount will likely result in a loss of revenue of about $2 million annually. This loss occurs be-cause the additional revenue from induced traffic ($176,000) does not offset the loss of revenue from motorists who would have used the facility even without the discount ($2.3 million). As traffic increases over time, the value of the loss increases as well. By FY 2015, for example, the loss totals an estimated $2.5 million annually.
The District Needs to Develop a Long-Range Capital Plan
In 1998, the commission revised its strategic plan, which had been developed originally in 1996. The 1998 plan set out four strategic goals for the district, one of which was to develop a long-range approach and plan for parallel tunnels and other facilities. The commission held a subsequent strategic planning meeting in March 2001, but no revisions to the 1998 plan were ever approved. The commission also never acted on the 1998 goal to develop a long-range plan for parallel tunnels or other future capital requirements. The current debate among staff and commission members regarding the need for parallel tunnels is a result of the commission’s failure to develop such a plan.
In interviews with JLARC staff, several members of the CBBT commission raised concerns about the implementation of the 24-hour round trip discount in the absence of a long-range capital plan. They also expressed concern about the expansion of the discount to vehicles making round trips within 72 hours, a proposal now under consideration by the commission. The specific concern was that the discount could mean that the decision regarding when the parallel tunnels should be built would be driven solely by the availability of funds, rather than by a careful consideration of traffic, safety, and other requirements. While all of the commissioners felt that some form of commuter discount was appropriate, some expressed concern that the commission may have been premature in implementing the current discount without first understanding the capital needs of the district and the long-term impact of the discount on revenues. Several commissioners said that action on the 72-

Page 48 Chapter III: The Bridge-Tunnel Toll Structure
hour discount would be inappropriate without a clear decision from the commission regarding the future construction of the parallel tunnels.
Since the analysis for this report shows that parallel tunnels may be needed by 2020 and that current revenues are likely insufficient to fund such a project, the commission should begin the process to evaluate alternatives to address future capital needs. In pursuing the development of a long-range capital plan, the commission should rely on objective analysis of the need for additional traffic capacity in the tunnels, the costs to build the tunnels, and the long-term financial ability of the district to fund the project. The commission may want to consider retaining independent traffic, engineering, and financial consultants to provide the impartial, objective information it needs.
In developing the long-range capital plan, the commission should develop and evaluate a full range of options related to construction of the parallel tunnels. The options should be evaluated based on objective criteria that address traffic, safety, and other considerations the commission deems most important. Among the alternatives the commission could consider are:
(1) No Build. The commission should consider as a base option the impact on traffic, safety, maintenance, and revenue of not building the tunnels in the next 25 to 35 years. As a part of this base option, the commission should determine how and when general toll reductions could be implemented. For example, based on the JLARC staff projections of revenue, it would appear that a one dollar reduction would be possible by 2005, an additional one dollar reduction could be made by 2007, and additional reductions could be made in 2010 and 2011. The commission could also implement more discount programs to target particular classes of vehicles.
(2) Build When Current Revenues Are Sufficient. The commission should examine the impact on traffic, safety, maintenance, and revenue of delaying construction until the current stream of toll and other revenues provide sufficient cash and bonding capacity to fund the project. Based on analysis completed for this study, the project might not be financially viable until 2020 or later, but a more detailed analysis should be completed by the commission.
(3) Revise the Toll Structure to Advance Construction. The commission should evaluate how increases in tolls and other modifications to the toll structure might provide sufficient revenue to build tunnels based on requirements related to increases in traffic, improved safety, and enhanced maintenance of the existing tunnels. This option should establish a clear target date for construction, and examine revenue alternatives to ensure that adequate funding is available by the target date. To illustrate some of the revenue alternatives that could be considered, the

Page 49 Chapter III: The Bridge-Tunnel Toll Structure
traffic models developed for this study were used to estimate the impact of changes in the tolls on revenues (Table 12). The estimates account for the elasticity of traffic volume for passenger cars and heavy trucks (reductions in traffic due to the increase in price) in evaluating the impact of toll increases.
The district's long-range plan should set out how the commission expects to achieve the specific goals established from among these and other options it evaluates. In addition, while the parallel tunnels may be the primary focus of the plan, it should also incorporate requirements for other capital improvements. For example, it should assess the need for and costs of replacement or renovation of the toll plaza buildings, which is discussed in Chapter IV. Finally, it should include a specific financial plan which ensures that capital projects can be successfully completed.
Recommendation (1). The Chesapeake Bay Bridge and Tunnel Commission should develop a long-range capital plan that includes a specific decision regarding the construction of parallel tunnels for the Thimble Shoal and Chesapeake channels, as well as other capital needs of the district. The long-range plan should be based on a comprehensive analysis of the need for construction due to increases in traffic, improved safety, and other factors established by the commission. The plan should also consider the results of a comprehensive financial analysis which identifies alternatives for funding future capital needs.
Recommendation (2). The Chesapeake Bay Bridge and Tunnel Commission should postpone consideration of any future toll discount pro-grams until a long-range capital improvement plan for the district has been developed. Based on analysis of the impact of the current discount on the ability of the district to meet its capital requirements, it may also want to re-evaluate the long-term feasibility of the 24-hour round trip discount program.

Page 50 Chapter III: The Bridge-Tunnel Toll Structure
Table 12 Alternatives to Fund Tunnel Construction from Increased Tolls
(In $Millions)
Alternative 1: $1 General Toll Increase for All Vehicle Classes
General Total Debt Total Tunnel Funding Fund Debt Principal Capacity Funds Construction (Shortage)/
Year Balance Capacity Outstanding Available Available Costs Excess
2002 $ 64.2 $315 $218.7 $ 96.3 $160.5 $468.9 $(308.4) 2010 136.9 423 114.9 308.1 445.0 558.1 (113.1) 2014 248.4 433 113.7 319.3 567.7 608.8 (41.1) 2015 277.1 443 113.2 329.8 606.9 622.2 (15.3) 2020 395.6 488 71.5 416.5 812.1 693.8 118.3 2025 511.3 494 0 494.0 1,005.3 773.5 231.8
Alternative 2: $1 General Toll Increase for All Vehicle Classes and Discontinue the 24-Hour Return Trip Discount
General Total Debt Total Tunnel Funding Fund Debt Principal Capacity Funds Construction (Shortage)/
Year Balance Capacity Outstanding Available Available Costs Excess
2002 $ 64.2 $315 $218.7 $ 96.3 $ 160.5 $468.9 $(308.4) 2010 154.7 456 114.9 341.1 495.8 558.1 (62.3) 2014 277.0 467 113.7 353.3 630.3 608.8 21.5 2015 308.5 478 113.2 364.8 673.3 622.2 51.1 2020 441.4 525 71.5 453.5 894.9 693.8 201.1 2025 572.7 533 0 533.0 1,105.7 773.5 332.2
Alternative 3: $2 General Toll Increase for All Vehicle Classes
Year
General Fund
Balance
Total Debt
Capacity Principal
Outstanding
Debt Capacity Available
Total Funds
Available
Tunnel Construction
Costs
Funding (Shortage)/
Excess
2002 $ 64.2 $315 $218.7 $ 96.3 $ 160.5 $468.9 $(308.4) 2010 152.3 453 114.9 338.1 490.4 558.1 (67.7) 2014 273.6 463 113.7 349.3 622.9 608.8 14.1 2015 305.0 474 113.2 360.8 665.8 622.2 43.6 2020 436.6 523 71.5 451.5 888.1 693.8 194.3 2025 567.1 531 0 531.0 1,098.1 773.5 324.6
Source: JLARC staff analysis of CBBT revenues and tunnel construction costs.

Page 51 Chapter IV: Toll, Police, and Emergency Operations
IV. Toll, Police, and Emergency Operations
HJR 210 directed that this study include a review of the efficiency and efficacy of Bridge-Tunnel operations, including police and security staffing. Bridge-Tunnel operations includes toll collections, law enforcement, and emergency response. It does not include the maintenance program or general administration of the district, which are discussed in Chapters V and VI of this report. To address the requirement for an evaluation of operations, JLARC staff completed a review of toll operations and staffing, police operations and staffing, emergency crew staffing, facility security, and disaster response. Staffing for toll collections and emergency response was included because those functions are supervised by police officers and are integrated into the overall police organization. Also as a part of the review, JLARC staff assessed the adequacy of operations equipment and facilities to support various toll, police, and emergency functions.
Overall, this review found that Bridge-Tunnel operations are generally effective with regard to toll collections, law enforcement, and emergency response. Appropriate policies and procedures are in use to ensure that toll receipts are collected, secured, and accounted for properly. Police officers appear to be properly trained and are certified by the Department of Criminal Justice Services. Comprehensive policies related to law enforcement have been developed and the district has necessary equipment and vehicles to implement the law enforcement function. The district has also developed an appropriate emergency response function, with staff who appear adequately trained, and with the necessary equipment to respond to accidents, fires, and other emergencies.
However, toll collections staffing could be improved by greater use of part-time positions to better match staffing to workload. The district may also need to be more flexible in its scheduling of work shifts for toll collectors. The Bridge-Tunnel is the only toll facility in Virginia which has not implemented electronic toll collections, but could likely benefit from a system such as Smart Tag. In addition, better use of technology and some modification of procedures would permit the redeployment of emergency crew members to more useful duties while improving security in the two tunnels.
While the district was found to have generally implemented the law enforcement function well, several shortcomings need to be addressed. Since the parallel bridges were opened in 1999, reckless driving involving speeds in excess of 75 miles per hour has become an increasing problem. New strategies to slow traffic to the posted speed may be needed. In addition, facility security may be inadequate given the proximity of military installations and the Bridge-Tunnel’s visibility as a major transportation facility. The district has not trained for or tested its emergency action plan, so the ability of CBBT personnel to respond properly in the event of natural disasters or other major emergencies is unknown. Finally, the toll plaza buildings are inadequate for some police operations, and may need extensive modification or replacement.

Page 52 Chapter IV: Toll, Police, and Emergency Operations
Overview of CBBT Operations
The Chesapeake Bay Bridge and Tunnel District operations division is responsible for several functions, including: (1) toll collections, (2) law enforcement and security, (3) motorist assistance, and (4) response to emergency situations such as fires and accidents. The division is the largest within the staff organization, with 89 employees, or about 54 percent of the district’s total employment. The division is headed by the director of operations, who is also the uniformed chief of police for the district. Figure 9 shows the operations division organization.
Toll Collection. As discussed in Chapter III, the Chesapeake Bay Bridge-Tunnel is a toll facility. Toll collections are made at two plazas, one at each end of the facility. Each toll plaza consists of four toll lanes, staffed with between one and four toll collectors, depending on the volume of traffic. The toll plaza building serves as the base of operations for toll collections, with break rooms and rest facilities for toll collectors, a room for counting and verifying toll collections at the end of each
Source: JLARC staff illustration of CBBT organization chart.
Figure 9 Organization of the Operations Division
Director/Chief of Police
Assistant Director/Police Captain
Police Lieutenant (Shift Supervisor)
4 Positions
Police Sergeant (North Plaza Supervisor)
4 Positions
Master Police Officer 9 Positions
Police Officer 20 Positions
Emergency Crew Worker 26 Positions
Toll Collectors 8 Positions
Secretary
Police Corporal (Personnel/Training)
Master Police Officer
Police Corporal (South Plaza Supervisor)
4 Positions
Clerk Typist
Toll Collectors 8 Positions

Page 53 Chapter IV: Toll, Police, and Emergency Operations
shift, and a vault for holding collections until transferred to the district’s depository bank by armed courier service. Each plaza building also houses a recording room for equipment that video tapes each transaction in the toll lanes for security purposes.
There are currently 16 full-time toll collectors employed by the district. Two hourly collectors are hired for peak traffic during the summer. Collectors work in three shifts, which begin at 8:00 a.m., 4:00 p.m., and 12:00 midnight (employees report 15 minutes prior to each shift to prepare for duty). The toll collectors are supervised by the plaza supervisors, who are the uniformed police officers responsible for toll, police, and emergency operations on a daily basis.
Toll collectors use touch-screen terminals in each booth to complete toll transaction. The system requires that each vehicle be classified by the toll collector in order for the correct toll amount to be determined. As discussed in more detail in Chapter III, the amount of the toll is based on the number of axles for a vehicle. As vehicles leave the toll booth, treadles in the roadway count the number of axles, and discrepancies between the classification at the booth and the axle count generate an exception in the automated system. Each transaction is video taped, so exceptions can be reviewed later for correction. At the end of each shift, toll collectors count receipts for the shift, and the receipts are re-counted and verified by the plaza supervisor. Receipts are held in vaults at each toll plaza until transferred to the bank by armored courier service. The toll collection system also generates standard reports on traffic and revenue which are used by the finance division for verification of receipts, and for financial and statistical analysis.
Law Enforcement and Security. The Chesapeake Bay Bridge-Tunnel is the only transportation facility in Virginia with its own police force. CBBT police officers are certified by the Virginia Department of Criminal Justice Services (DCJS). Officers have full police powers on CBBT property and facilities, and execute the full range of police activities including highway patrol, traffic control, accident and criminal investigations, drug interdiction, motorist assistance, and facility security. Bridge-Tunnel police are the functional equivalent of local police in Virginia cities or towns. Accordingly, CBBT police are authorized to enforce the laws of the Commonwealth and the published rules and regulations of the district, including:
• Maximum and minimum speed limits applicable to motor vehicles using the facility or property under control of the district;
• The types, kinds, and sizes of vehicles which may use the facility;
• The nature, size, type, or kind of material or substance which may be permitted access to the facility;
• Other rules and regulations necessary or expedient in the interest of public safety with respect to use of the facility; and
• The proper collection of tolls to be transacted and all monies deposited according to adopted procedures.

Page 54 Chapter IV: Toll, Police, and Emergency Operations
There are currently 45 uniformed police officers in the CBBT police department. Of that total, four officers are in administrative positions and another 12 serve as supervisors for facility operations. The remaining 29 positions serve as assistants in the toll plazas or in direct law enforcement and security functions. New officers receive basic police training from the City of Chesapeake Police Academy, the City of Virginia Beach Police Academy, or another local academy. In-service training is provided by CBBT officers certified by DCJS as in-service instructors. Firearms and in-service training is conducted at facilities on the Eastern Shore National Wildlife Refuge, located near the CBBT offices in Northampton County.
A police lieutenant is the shift supervisor for all CBBT operations, including toll collections, law enforcement, security, motorist assistance, and emergency response. The shift supervisor is located at the north toll plaza. A police sergeant supervises the north toll plaza and serves as central dispatch for police and emergency operations. Police officers and emergency crews are directed by the north plaza supervisor. The north plaza supervisor also is responsible for a police corporal who is the supervisor of the south toll plaza. Backup for the two plaza supervisors is provided by plaza assistants, who are uniformed police officers. Toll collectors are under the direction of the two plaza supervisors.
During each shift, two to four additional police officers are on patrol on the facility. Patrol officers respond to dispatches from the north plaza, enforce speed and other traffic regulations, investigate accidents with assistance from the shift supervisor, complete security patrols of all CBBT properties, and provide assistance to motorists. Officers assigned to the toll plazas measure over-height trucks and may also be directed to collect tolls. CBBT police also provide escorts for over-sized trucks in order to close the tunnels to other traffic. Officers who issue traffic summonses or make arrests also appear in Northampton County or City of Virginia Beach courts as witnesses. In FY 2002, CBBT police officers issued 5,275 traffic summonses, requiring 1,534 staff hours for appearance and testimony in local courts.
Motorist Assistance and Emergency Response. The third major function of the operations division is emergency response. This function is performed by emergency crew workers who are assigned to the tunnel islands and the toll plazas. These operations division personnel respond with the district’s tow trucks to motor vehicle accidents and break-downs. They are also trained as firefighters and can respond to vehicle fires with district equipment. In FY 2002, emergency crews responded to 112 motor vehicle accidents and provided assistance to 556 motorists.
The emergency crew workers are also responsible for foot patrol of the two tunnels on rotating two hour shifts. Two emergency crew workers are assigned to each tunnel during a shift, and alternate between tunnel patrol and standby with the tow truck. When needed, emergency crew workers assist police officers in certain duties at the toll plazas such as measuring over-height trucks or escorting wide loads. All emergency crew workers are also trained to collect tolls, and are often as-signed to collect tolls in order to provide coverage for collectors on meal or other breaks.

Page 55 Chapter IV: Toll, Police, and Emergency Operations
Toll Operations and Staffing
The evaluation of toll operations for this study focused on two areas of re-view: (1) the adequacy of procedures for the collection and safeguarding of toll receipts and (2) the appropriate level of staffing. While the district has sound policies and procedures for toll collections, some modification of toll staffing may be in order.
The District Has Developed Adequate Procedures for Toll Collections. It appears from this review that the district has developed appropriate policies and procedures for toll operations. Policies and procedures are set out in the operations division manual. Detailed procedures describe requirements for beginning and ending each shift, permitted activities in and around toll booths, breaks for meals and other purposes, use of employee ID cards, and interaction with the public. The manual also outlines in detail the use of the toll collection system, and how to conduct various transactions. These instructions are important since the proper classification of vehicles is necessary in order to charge the correct toll. Policies and procedures for unusual occurrences are also outlined.
The district’s toll collection system has been designed to properly account for the different types of vehicles in the toll structure and produces necessary traffic and revenue reports for management purposes. The system maintains traffic statistics by hour, for each of the 14 vehicle classes in the current toll structure. Toll collectors reported that the touch-screen system is easy to use and is well designed for the CBBT’s toll structure.
Toll Collection Staffing Should Be Restructured to Match Workload. The Chesapeake Bay Bridge-Tunnel currently has four toll lanes in each of the two toll plazas, one in Northampton County and one in Virginia Beach. Depending on the flow of traffic, the district opens one or more of the lanes in each plaza. Because the facility is open at all times, at least one toll lane in each direction is open 24 hours a day, seven days a week. This requirement establishes the minimum level of staffing required for toll collections. Based on the actual number of hours available for work for each toll collector (net of holidays, annual and sick leave, etc.), 9.8 full-time equivalent positions are needed to provide coverage of the necessary shifts for round-the-clock toll collections in one lane in each direction.
To determine the necessary staffing above the minimum, JLARC staff completed a detailed analysis of traffic entering the plazas in each hour for one full week in each of the past 12 months of operation. Hourly traffic statistics were provided to JLARC staff from the CBBT toll collection system for each of 84 days from October 2001 through September 2002. The hourly traffic flows were compared to the number of vehicle transactions per toll collector considered typical and reasonable by CBBT managers – approximately 250 vehicles per lane per hour. That rate assumes a continuous flow of traffic, but not a maximum flow, which on the busiest traffic day of the year approached 304 vehicles per lane per hour. (The maximum rate was not used in the JLARC analysis because it reflects a period of congestion and delay at the toll plazas which would typically be considered unacceptable by the traveling public.) The analysis was completed separately for each month of the past year to

Page 56 Chapter IV: Toll, Police, and Emergency Operations
account for the seasonal variation in traffic, and for each day within the week to account for the variation between week days and weekends.
Figure 10 shows the full-time equivalent positions needed to handle the daily traffic in each month compared to the current number of positions, based on the JLARC staff analysis of hourly traffic over the past year. It appears that toll collection staffing is inadequate during peak summer months. In fact, during some peak traffic days on the weekends in July and August, the CBBT has too few toll lanes to handle the traffic, even if additional staff were available. On the other hand, toll collections staffing appears to be excessive for most of the rest of the year, when traffic is much less than in the peak summer months.
Figure 10 FTE Toll Collections Staffing Needed for Traffic by Month
0.0 2.0 4.0 6.0 8.0
10.0 12.0 14.0 16.0 18.0 20.0
Octobe
r
Novem
ber
Decem
ber
Janu
ary
Febru
ary
Mar
ch
April
May
June
Ju
ly
Augus
t
Septe
mbe
r
Fu
ll T
ime
Eq
uiv
alen
t P
osi
tio
ns
Current FTE Positions
Source: JLARC staff analysis of hourly traffic statistics.
Toll collectors are hired as full-time positions. In order for all 16 of the cur-rent positions to work the actual average of 34.7 hours of available work time (net of leave) each week, a total of 555 shift hours must be scheduled. Based on the actual flow of traffic, the shift hours needed varies from a low of only 348 hours in January, to a high of 569 shift hours in July. As a result, when the Bridge-Tunnel has its lowest traffic in the winter, toll collections staff are used inefficiently, with staff as-signed to shifts when lower traffic volume may not justify it. In the summer, staff are pushed to the limit of the number of transactions that can be handled in each toll lane. To accommodate the heavier traffic load, police officers and emergency personnel are required to collect tolls when collectors are on meal and other breaks, diverting those staff from their assigned duties.
In contrast to the use of full-time positions by the CBBT, other toll facilities in Virginia use a combination of full-time and part-time positions to adjust staffing to workload. The Richmond Metropolitan Authority, for example, employs 49 full-

Page 57 Chapter IV: Toll, Police, and Emergency Operations
time toll attendants and an additional 25 part-time, hourly attendants. The part-time positions ensure sufficient staff are available to cover peak traffic periods each day, and to provide coverage for illnesses and vacations, and to provide relief for collectors on meals and breaks. Similarly, VDOT uses a combination of full-time and part-time collectors for the Powhite Parkway Extension toll facility, with 32 full-time positions, and 25 part-time, hourly positions.
The JLARC staff analysis of toll collections staffing also found that the need for multiple toll lanes often does not match the fixed schedule for shifts of toll collectors. For example, hourly traffic statistics indicate that a second toll lane is not needed until about 10 a.m. on many days, although the toll collectors’ shifts start at 8:00 a.m. In order to provide sufficient coverage for traffic at mid-day, an additional shift assignment may be made when traffic is higher. Likewise, the need for a second or third toll lane may extend for only two or three hours past the scheduled end of a shift. To provide necessary coverage the CBBT either schedules a collector to cover the shift, or uses police officers or emergency crew workers to collect tolls. Both are inefficient uses of staff.
To better match toll collections staffing to workload, the district may need to alter the way it staffs toll collections. Two changes should be considered by the district. First, the CBBT may want to use a combination of full- and part-time toll collectors. The district could use fewer full-time positions to cover the base level of shifts, with a pool of part-time staff to cover peak traffic periods. Part-time staff could also be used as relief collectors for meals and breaks, in order to discontinue the use of police officers for that purpose. To avoid dislocations to existing employees, the CBBT could implement the shift to part-time collectors gradually as attrition frees positions for re-allocation. Second, the district may need to adjust the shift schedules for toll collectors. Since daily increases in traffic occur later than the beginning of toll collector’s shifts, more flexible schedules would permit the district to match shifts to the actual volume of traffic.
Recommendation (3). The Chesapeake Bay Bridge and Tunnel District should restructure staffing for toll collections to better account for the seasonal variation in traffic. The district should consider the use of fewer full-time and more part-time collectors, and more flexible scheduling of shifts to match actual traffic volume. The district should use part-time toll collectors to cover partial shifts, meal breaks, and to provide other re-lief. It should discontinue the use of police officers for toll collections.
Police Operations and Staffing
The JLARC staff review of police operations focused on the adequacy of policies and procedures, training for police officers, adequacy of equipment, and the appropriate level of supervisory, law enforcement, and security staffing. Overall, police policies and procedures were found to be adequate and staffing levels were generally appropriate. However, the district needs to develop strategies to address reckless driving on the facility.

Page 58 Chapter IV: Toll, Police, and Emergency Operations
Police Policies and Procedures Are Comprehensive. The district has appropriate policies and procedures pertaining to police operations. Police policies and procedures are published in the operations division manual issued to every officer at the time of employment. The manual outlines the requirements for employment, a code of ethics for police officers, the oath of office, organization of the division, supervisory authority, rules of conduct, crime prevention and other procedures, the use of firearms, a seat belt policy, and grievance procedures. Rules of conduct cover 24 prohibitions or requirements for officers, ranging from the use of alcohol and drugs to the wearing of uniforms to and from work. The section on crime prevention and other procedures consists of 38 specific items, including the exercise of police authority, arrest procedures, use of radar and breathalyzer equipment, patrol of the facility, use of communications equipment, and high-speed pursuits.
A separate policy on the use and discharge of firearms is also outlined in the operations division manual. For example, policy prohibits the firing of warning shots to stop fleeing suspects or firing at moving vehicles. Requirements for written reports when weapons are used are also described in the policy. The policy also out-lines the permitted use of chemical agents such as pepper spray.
CBBT Police Vehicles and Equipment Are Generally Adequate. In interviews with JLARC staff, police officers and division management reported that equipment was appropriate and well maintained. In particular, police officers re-ported that the maintenance division ensured that vehicles were well maintained and that communications equipment was operational. All of the officers interviewed reported that the weapons issued by the district were adequate.
One concern raised about equipment was the lack of video cameras in patrol cars. When used at traffic stops, video recording provides incentives for officers to comply with division procedures, and also protects officers from false charges of misconduct. Video recording of traffic stops can also provide important evidence in court, such as the behavior of motorists detained for possible DUI violations. Given the small number of police vehicles in the CBBT fleet used for patrol, the cost to in-stall video cameras in each patrol car should not be prohibitive.
Recommendation (4). The Chesapeake Bay Bridge and Tunnel District should install video cameras in police patrol vehicles, and should develop appropriate policies and procedures regarding their use by officers.
The District Needs to Develop Strategies to Slow Traffic to Posted Speeds. One of the clear benefits of the parallel bridges has been a reduction in the number and severity of accidents on the facility. By separating northbound and southbound traffic onto different bridges, the danger of head-on collisions has been eliminated (except in the two miles of tunnel that remain two lanes). As a result, the number of accidents has declined from an average of 43 accidents per year be-tween 1990 and 1998, to an average of 21 per year since the parallel bridges opened in 1999. Fatalities also declined, from an average of three per year to less than one every three years.

Page 59 Chapter IV: Toll, Police, and Emergency Operations
On the other hand, the parallel trestles appear to have resulted in in-creased speeds, which pose a new danger for motorists using the Bridge-Tunnel. This finding is based on a JLARC staff analysis of traffic summonses issued by CBBT police officers before and after the parallel bridges were built. The analysis examined the number of traffic summonses written for reckless driving, which for the CBBT is 75 miles per hour or more, or 20 miles per hour over the posted limit.
In calendar year 1994, the last full year of operation prior to construction of the parallel bridges, CBBT police officers cited 428 motorists for reckless driving. Of those, 31 were for speeds in excess of 90 miles per hour, and only one was for speeds in excess of 100 miles per hour. In contrast, in calendar year 2000, the first full year of operation after the parallel bridges were opened, police wrote 2,030 summonses for reckless driving. Of those, 203 were for speeds in excess of 90 miles per hour, and 36 were for speeds in excess of 100. The highest speed cited that year was 132 miles per hour, almost two and one-half times the legal limit. While total traffic increased 12.8 percent between 1994 and 2000, the number of reckless driving summonses increased 475 percent. Police cited an additional 2,404 motorists for speeding, even after providing a more than generous tolerance above the posted speed limit.
To address the problem of excessive speeds, the district posted signs warning motorists that speed limits would be strictly enforced. The warnings appear to have had little, if any, effect. This could be partially due to the district's practice of providing a generous tolerance above the posted speed, which some motorists may have interpreted as a sign that the warning is not acted on consistently.
While CBBT police may have been diligent in stopping and citing reckless drivers, it appears the district needs to do more to slow drivers inclined to endanger themselves and others. Among the actions that should be considered are enhanced, more visible police patrols; the use of radar/speed signs which warn motorists of their actual speeds in comparison to the posted speed limit; and reduction of the tolerance above the posted speed limit. If initial steps are unsuccessful in reducing speeds to the posted limits, the district may have to consider the use of photo enforcement with prominent notice to motorists that speed limits will be enforced.
Recommendation (5). The Chesapeake Bay Bridge and Tunnel District should develop additional strategies for slowing traffic to the posted speed limits. Among the actions that should be considered are: (1) reduction of the current tolerance above the posted speed, (2) use of radar/speed indicator signs; and (3) more visible police patrols.
Police and Security Staffing Appears Appropriate. Some have raised concerns that the Chesapeake Bay Bridge-Tunnel has too many police officers given the size of the facility. Specifically, the current staffing level of 45 positions has been criticized as excessive. To address this concern, JLARC staff completed an analysis of police staffing. The analysis involved a review of position descriptions, field observation of police operations, interviews with police officers regarding their duties and responsibilities, a review of assignments to duty stations, and a review of annual and other leave taken by officers for a 12-month period. The purpose of the

Page 60 Chapter IV: Toll, Police, and Emergency Operations
analysis was to: (1) determine the number of 24-, 16-, and 8-hour duty stations needed to carry out proper supervision, law enforcement, and security responsibilities, and (2) calculate the number of full-time equivalent positions needed to staff the duty stations. This review found that police staffing appears reasonable, with appropriate levels of supervision for toll, emergency, and law enforcement functions.
The first step in assessing the reasonable level of police staffing was to determine the number of duty stations needed to carry out required supervisory, law enforcement, and security functions. A duty station is a specific assignment during a single shift, such as plaza supervisor or traffic patrol on the facility. It was also necessary to determine whether each duty station needed to be staffed for 24, 16, or eight hours per day. JLARC staff reviewed position descriptions and interviewed police officers to ascertain the full range of responsibilities for various duty stations, and examined actual assignments for selected days. JLARC staff also observed operations in the toll plazas to evaluate the supervisory duties of the shift and plaza supervisors, and the plaza assistants. Hourly traffic volume and activity at the restaurant on the south island of the Thimble Shoal Tunnel were used to determine the number of patrol officers needed for various periods of the day. The results of the analysis are shown in Table 13. Facility-wide, JLARC staff identified the need for 13 police duty stations, including the four command and administration positions. Seven of the duty stations are staffed 24 hours a day, seven days a week, reflecting the around-the-clock operation of the Bridge-Tunnel.
The second step in the analysis is to determine the number of full-time equivalent positions needed to staff the required duty stations. This is accomplished by calculating the total number of staff hours needed for each type of duty station, calculating the number of available hours of work per employee, less various categories of leave, and dividing the hours needed per station by the hours available per employee. The annual hours needed for each type of station is determined by the proportion of hours and days per week for the station relative to a full 24 hour, seven days per week station. A 24 hour, seven day station requires 8,760 hours of work annually. A station to be staffed 16 hours per day, three days per week requires only 28.57 percent as many hours, or 2,502 hours annually. Required hours for various types of duty stations are shown in Table 14.
Table 13 Required Police Duty Stations for the Chesapeake Bay Bridge-Tunnel
Duty Station Hours per Day/Days per Week Number of StationsCommand 8 Hours, 5 Days 2 Personnel and Training 8 Hours, 5 Days 2 Shift Supervisor 24 Hours, 7 Days 1 Plaza Supervisor 24 Hours, 7 Days 2 Plaza Assistant 24 Hours, 7 Days 2 Patrol Officer 24 Hours, 7 Days 2 Patrol Officer 16 Hours, 3 Days 1 Patrol Officer 8 Hours, 4 Days 1
Source: JLARC staff analysis of CBBT police positions and duties.

Page 61 Chapter IV: Toll, Police, and Emergency Operations
Table 14 Hours of Staffing Required for Police Duty Stations
Type of Station Hours Needed for Station (Hours/Days) (Per Year)
24/7 8,760 16/3 2,502 8/5 2,086 8/4 1,669
Source: JLARC staff analysis.
To calculate the available hours of work for each employee assigned to the duty posts, the total hours available is reduced by various “non-productive” hours, such as holidays, annual leave, sick leave, and rest days (weekends or days between duty periods). For police officers, deductions also need to be made for State-mandated training and time spent testifying in court. JLARC staff used actual hours of leave, training, and court attendance for CBBT police officers in FY 2002 to determine the hours available per employee (Table 15). Of 2,920 total hours, 1,675.2 hours are available per officer for staffing of duty stations.
Table 15 Calculation of Hours Available for Police Duty Stations
Category Actual Average Hours in FY 2002
Total Hours
Holidays Annual Leave Sick LeaveRest DaysMilitary Leave Worker’s CompLeave w/o PayOther LeaveTrainingCourt Attendance
Total Reductions
Available Hours
2,920.0
96.0 123.8
68.4 832.0
0.0 2.4 0.0 0.0
86.8 35.4
1,244.8
1,675.2
Source: JLARC staff analysis of CBBT police leave, training, and court attendance.
The analysis of staffing for necessary police duty stations is summarized in Table 16. Based on the current duties of officers, use of leave, requirements for training and court attendance, and level of traffic on the Bridge-Tunnel, the district appears to need a minimum of 43 full-time equivalent police positions. The table demonstrates why some have concluded, incorrectly, that the district has too many police officers. Supervisory positions for the Bridge-Tunnel are uniformed officers.

Page 62 Chapter IV: Toll, Police, and Emergency Operations
These positions are needed to supervise toll collections and emergency response, as well as police operations. Since there are two toll plazas, the need for supervisory positions is increased. As a result, command, support, and supervisory positions account for almost half of the 45 uniformed police positions. The need to provide 24-hour patrol of the facility requires all but two of the remaining positions.
While some minimal reduction in police positions is possible, the current overall level of staffing will be necessary as long as the existing toll collections, emergency response, and law enforcement functions are needed. Moreover, if the district is to address the current situation with excessive speeds, greater patrol visibility may be appropriate. Therefore, no changes in the overall level of police staffing are recommended at this time.
Table 16 FTE Staffing for CBBT Police Duty Stations
Hours Hours Number of Number of Duty Station Type Needed Available Stations FTE Positions Command* 8/5 2,086 1,675.2 2 2.0 Personnel* 8/5 2,086 1,675.2 2 2.0 Shift Supervisor 24/7 8,760 1,675.2 1 5.2 Plaza Supervisor 24/7 8,760 1,675.2 2 10.5 Plaza Assistant 24/7 8,760 1,675.2 2 10.5 Patrol Officer 24/7 8,760 1,675.2 2 10.5 Patrol Officer 16/3 2,502 1,675.2 1 1.5 Patrol Officer 8/4 1,669 1,675.2 1 1.0
Total 43.2
* Each position filled by a single incumbent. Source: JLARC staff analysis of CBBT police staffing.
Emergency Response Operations and Staffing
Emergency crew workers perform several essential functions on the Chesapeake Bay Bridge-Tunnel. They respond to accidents and breakdowns to keep traffic lanes open, and assist motorists where no other assistance would be available. In the absence of any other means to monitor traffic in the tunnels, emergency crew workers patrol the tunnels to ensure safe flow of traffic. They also respond to incidents in the tunnels, which if left unattended could create hazards for the traveling public. The JLARC review of emergency operations focused on staffing, and how the use of technology could eliminate the need for tunnel patrols.
Emergency Crew Staffing Appears Generally Appropriate. Like police officers, the CBBT emergency crew members are assigned to specific duty stations. Four duty stations have been established with split responsibility for responding to accidents and breakdowns, and for patrolling the two tunnels. Two emergency crew workers are assigned to each of the two tunnel islands where tow trucks and fire equipment are housed. On a two-hour rotating schedule, one of the two

Page 63 Chapter IV: Toll, Police, and Emergency Operations
workers patrols the tunnel while the other remains on the island with the emergency response equipment. The duty stations require 24-hour, seven-day coverage.
In addition, at least one emergency crew worker is often assigned to one of the two toll plazas during the daytime shift. This worker typically collects tolls for collectors on breaks, measures over-height trucks, and assists police officers with escorts of over-sized vehicles. Occasionally, a second or third worker may be as-signed to assist with escorts or lane closures for maintenance. All of these duty stations are typically for an eight-hour shift.
An analysis of the full-time equivalent positions required to staff the emergency crew duty stations found that the current level of staffing is generally appropriate. This analysis was similar to that used for police staffing, involving a review of position descriptions, field observation of emergency crew operations, interviews with emergency crew workers regarding their duties and responsibilities, a review of assignments to duty stations, and a review of annual and other leave taken by emergency crew workers for a 12 month period. The purpose of the analysis was to determine the number of 24-, 16-, and 8-hour duty stations needed to carry out emergency response, tunnel patrol, and toll plaza duties. As with the analysis of police staffing, the analysis for emergency crew staffing involved determining the number of duty stations needed, the hours required to staff each station, and the average available hours of work for each emergency crew worker.
The results of the analysis are summarized in Table 17. Based on the cur-rent duties of emergency crew workers, use of leave, and requirements for training, the district appears to need 24 full-time equivalent emergency crew positions, in-stead of the 26 positions in the current organization. Since three of the 26 positions are currently vacant, the district can adjust the authorized number of positions without having to reduce the actual number of emergency workers employed.
Recommendation (6). The Chesapeake Bay Bridge and Tunnel District should reduce the full time equivalent staffing for emergency crew workers to 24 positions.
Use of Video Surveillance in the Tunnels Could Reduce Staffing Requirements. Currently, neither the Thimble Shoal Channel Tunnel nor the Chesapeake Channel Tunnel are equipped with video surveillance cameras. As discussed previously, monitoring of traffic in the tunnels is accomplished by emergency crew workers who patrol the tunnels on two-hour rotating shifts. The operations manual requires that the workers complete at least one full check of the tunnel in a two-hour period. Since only one worker is assigned to patrol each tunnel, the entire one-mile length of a tunnel cannot be visually monitored at one time. From the mid-tunnel booth, workers can monitor much of the tunnel, but neither of the entrances are visible. From either entrance, the mid-tunnel sections and other entrance cannot be monitored. Moreover, the interiors of the tunnels are dirty, loud, and potentially hazardous to employees as the result of moving traffic in an enclosed area.

Page 64 Chapter IV: Toll, Police, and Emergency Operations
Table 17 FTE Staffing for Emergency Crew Duty Stations
Hours Hours Number of Number of Duty Station Type Needed Available Stations FTE Positions Emergency Response 24/7 8,760 1,772.1 2 9.9 Tunnel Patrol 24/7 8,760 1,772.1 2 9.9 Toll. Escort, Other 8/7 2,920 1,772.1 2 3.3 Toll, Escort, Other 8/2 834 1,772.1 2 0.9
Total 24.0
Source: JLARC staff analysis of CBBT emergency crew staffing.
Installation of modern video surveillance cameras would improve the district’s monitoring of traffic by permitting continuous and simultaneous monitoring of the full length of both tunnels. The dispatch of emergency crews and police in response to emergency situations could be within only seconds of such incidents. Cameras with zoom capability and high-resolution lenses would significantly enhance security in the tunnels as well. Video surveillance would also make the hazardous job of patrolling the tunnels unnecessary.
Multiple cameras would be needed in each tunnel, but a single control/monitor room could be placed in one of the ventilation buildings to monitor both tunnels. The district already has plans for the renovation of the tunnel interiors, so the necessary retrofit of cabling, brackets, and other peripheral equipment could be done as a part of that effort. There are also plans to combine the control rooms for the two tunnels in a single location, which could also serve as the location for video monitoring equipment.
Since only one duty station would be needed to monitor tunnel traffic on a 24-hour basis (4.9 FTE positions), approximately five FTE positions could be redeployed to other duties or eliminated. For example, the Hampton Roads Bridge-Tunnel has cameras positioned throughout the tunnels on that facility, and has re-assigned its tunnel patrol personnel to security duty. HRBT monitors tunnel traffic from a single control room located on one of the tunnel islands.
Recommendation (7). The Chesapeake Bay Bridge and Tunnel Commission should adopt a regulation permitting the use of remote video surveillance of facilities and property under the control of the commission.
Recommendation (8). As a part of its renovation of the tunnels, the Chesapeake Bay Bridge and Tunnel District should install video surveil-lance cameras, in order to improve response to incidents, enhance security, and eliminate the need for patrol by emergency crew personnel. Cameras could also be deployed on the bridges to enhance security and to monitor traffic.
Recommendation (9). The Chesapeake Bay Bridge and Tunnel District, after installing appropriate video surveillance equipment in the tun-

Page 65 Chapter IV: Toll, Police, and Emergency Operations
nels, should redeploy personnel who patrol the tunnels to monitor video of the tunnels, and should reduce emergency crew staffing by five full-time equivalent positions.
Security and Disaster Response
The Chesapeake Bay Bridge and Tunnel District has prepared an emergency action plan in recognition of the potential for natural disasters and other emergencies. The preface to that document sets out the clear need for the plan:
The geographic location of the Chesapeake Bay Bridge-Tunnel renders it vulnerable both to natural climatic disasters and technological disasters such as ship collisions, explosions, or sabotage.
The facility is more than a convenient route – it is an essential highway link and a closure can affect the welfare of a significant portion of the Commonwealth of Virginia.
According to the Secure Virginia Panel Report, “The presence of key military facilities within the Commonwealth and their reliance on land and maritime transportation assets increases Virginia’s vulnerability and potential for attack.” The CBBT’s proximity to many of those key military facilities in Hampton Roads may present the district with substantial risk for sabotage. This risk may be further enhanced by the district’s promotional campaigns which promote the facility as an premier engineering achievement.
JLARC staff reviewed the district's security and the emergency action plan based on an evaluation guide developed jointly by the audit agencies of five states and the U.S. General Accounting Office. The guide, Principles for a Comprehensive Security Strategy, An Evaluation Guide for the Transportation Industry, provides a framework for evaluating the security efforts in transportation systems such as the Bridge-Tunnel. It outlines 20 principles necessary for the development of an effective security strategy, including the assessment of risks, the development of countermeasures, and preparation for responding to emergencies (Appendix D). JLARC staff also noted security concerns as part of the on-site reviews of CBBT facilities.
An assessment of security for the Bridge-Tunnel based on the on-site re-views and the security evaluation guide found that the district has not taken prudent steps to protect and secure the facility from potential sabotage. In addition, the current emergency action plan, while recently revised, may not provide employees with sufficient guidance on the proper response to emerging threats. CBBT staff also reported that the district does not conduct periodic training in disaster response, so it is not clear that employees are prepared to respond as anticipated by the plan.
The District Has Not Developed an Adequate Security Strategy. Within a month of the terrorist attacks in New York and Northern Virginia on September 11, 2001, the district issued a written policy on increased readiness for acts

Page 66 Chapter IV: Toll, Police, and Emergency Operations
of terrorism. The policy is an extension of the emergency action plan, with a specific focus on the district’s efforts to prepare for, detect, and respond to a terrorist attack on the facility. The policy outlines how police officers and other employees are to be brought to a heightened level of readiness in the event of a threat or actual attack. The roles and responsibilities of staff are established, along with procedures for notification of civil and military agencies.
While the readiness plan outlines important procedures, and was a good initial response to the emerging terrorist threat, it is not a fully-developed security plan for the district. The development of a comprehensive and effective security strategy involves three major steps: an assessment of risks, development and maintenance of countermeasures, and preparation for response to emergencies. A review of the Bridge-Tunnel's security strategy found that, subsequent to the development of the increased readiness plan, little additional appears to have been done to actually make the facility more secure. For example, no formal risk assessment has been completed by the district. Because risks have not been evaluated, the district has not developed countermeasures appropriate to various threat levels. Among the countermeasures that could be considered are: background checks of contract personnel with access to ventilation buildings and secure areas of the plaza buildings, limiting access to the tunnel islands, plaza buildings, and maintenance facilities; and installation of security cameras in the tunnels and plaza buildings, or more generally on the facility. Which, if any, of these actions might be appropriate has not been properly evaluated by the district.
Several employees expressed the view that nothing could be done to prevent an act of sabotage on the facility. Not surprisingly, then, JLARC staff observed that the physical security of the facility is lacking, with the public having access to tunnel islands and toll plaza operational areas. The presence of CBBT police officers in the toll plazas does likely provide a significant deterrent to criminal activity, such as robberies at the toll booths. But there is minimal police presence on the facility, and only periodic patrol of the tunnels by emergency crew workers. Currently, security for the ventilation buildings consists of ensuring that exterior doors are locked. Security cameras are not used in the tunnels, the exterior of ventilation buildings, or the interior of the toll plaza buildings. Thus, security is entirely dependent on the vigilance of individual employees.
Recommendation (10). The Chesapeake Bay Bridge and Tunnel District should retain the services of a qualified security consultant to develop a plan of action for providing proper security for the toll plazas, ventilation buildings, tunnels, and other assets of the district. The evaluation should assess the risks to various district assets and develop specific countermeasures for each risk identified. To improve security prior to completion of a final security plan, the district should limit access to tunnel is-lands, toll plaza buildings, and maintenance facilities and vehicles.
The Emergency Action Plan Is Incomplete. The district has completed the third element of a security strategy – development of an emergency action plan. The most recent revision of the CBBT emergency action plan provides general guidance in the event of a natural disaster, such as a hurricane, or an accident, such as a

Page 67 Chapter IV: Toll, Police, and Emergency Operations
ship collision with the facility. The plan does a good job of outlining the general responsibilities of the divisions in responding to emergencies, contains a comprehensive directory of contacts in various public safety, emergency, and military organizations, and outlines how the public should be notified of a closure.
However, the plan is silent on emerging threats, such as the intentional re-lease of chemical, biological, or radiological agents. How employees respond to such hazards could be critical in reducing casualties among district employees and users of the facility. It appears that the district has none of the equipment or supplies to respond to such hazards. To address the proper response to sabotage or attack on the facility, the district may want to retain the services of a qualified consultant to better define the nature of risks, assess the need for emergency equipment, develop procedures for response, and outline requirements for training.
District Personnel Do Not Participate in Disaster Training. In the event of a major disaster, district personnel would be called upon to implement the Emergency Action Plan under potentially hazardous and stressful circumstances. Training in advance of such circumstances can increase the likelihood that employees will perform their duties as expected. Periodic training and preparedness exercises can help to identify weaknesses in the action plan, district resources, or staff skills; identify the type of corrective action needed; and help to assess improvements in the district’s readiness.
Despite the importance of training to preparedness for disasters, CBBT staff have not participated in disaster or other emergency action plan training or exercises. This is likely the result of the district’s stated policy that special training for implementation of the emergency action plan is not needed. While the plan states that training is essential, it defers such training to the individual divisions. It goes on to state that normal divisional training for employees should be adequate. As a result, police officers, emergency crew members, and maintenance staff reported that they had not participated in emergency action plan training.
The lack of training could be most problematic for police officers and emergency crew workers, who would likely be the first responders to incidents. The district may want to reconsider its current policy not to conduct periodic training for disaster response, especially with regard to police officers and emergency crew workers.
Recommendation (11). The Chesapeake Bay Bridge and Tunnel District should revise its emergency action plan to include the procedures for the proper management of disasters resulting from sabotage or terrorist attacks involving biological, chemical, or radiological substances. District administrative, police, emergency, and maintenance personnel should complete periodic training for implementation of the Emergency Action Plan. Training should be coordinated with other police, emergency, and military agencies as appropriate.

Page 68 Chapter IV: Toll, Police, and Emergency Operations
Certain Capital Improvements Should Be Considered to Improve Operations
In the JLARC staff examination of CBBT assets, the toll plaza buildings were found to be clean and in good repair. These buildings, one at each at the north and south toll plazas, were constructed in the early 1960s as part of the original facility. They serve as dispatch centers for police and emergency response, and as the operational area for toll collections. Each building has a control room (primarily for police and emergency dispatch), an employee break room, rest rooms, a room for counting toll receipts, a vault, and an equipment room for video recording of toll transactions in the plazas. The north toll plaza building also has office space for the police officers responsible for administrative duties such as shift scheduling and training.
The Toll Plaza Buildings Are Inadequate for Police Operations. While the plaza buildings appeared generally adequate for toll operations, they are inadequate for police operations. There is no office area for the shift supervisor, who is responsible for all toll, emergency, and police operations for the facility. Currently, the shift supervisors use a portion of the control room in the north toll plaza building. Neither plaza building has a locker room for police officers, so lockers have been placed in the small employee break rooms in each building. Since these are public areas, they cannot be used by officers to change clothing before and after shifts. The general layout of the buildings is also a problem, with the vault and workroom for toll collectors accessible only through the control room, and the vaults opening into public view at the entrance to the control rooms. There is also no way for the plaza supervisor to talk to persons entering the building without opening the control room door.
Of particular concern is the lack of secure holding areas for persons placed under arrest by CBBT police officers pending transfer to either the Northampton County or City of Virginia Beach jails. As a result, police officers reported that per-sons under arrest are sometimes held in the toll plaza buildings in the lobby area or the employee break rooms. Officers reported that this can be a serious problem if more than one person is under custody.
Recommendation (12). The Chesapeake Bay Bridge and Tunnel Commission should direct a review of the adequacy of the north and south toll plaza buildings and plaza areas by an independent consultant. The re-view should evaluate the adequacy of the plaza buildings for both toll collections and police operations. Replacement or renovation of the toll plaza buildings should be considered as a part of the development of the long-range capital plan.
Installation of Smart Tag Should Be Considered in Toll Plaza Renovations. In the review of toll staffing, there appeared to be some peak traffic periods when the toll plazas had insufficient lanes to handle the volume of traffic. Even if additional staff had been available during these peak periods, the district would not have been able to reduce the time motorists spent waiting to pay the toll.

Page 69 Chapter IV: Toll, Police, and Emergency Operations
The addition of toll lanes to handle future increases in traffic should be considered as a part of the replacement or renovation of the toll plaza buildings.
In adding toll lanes, the district may want to include electronic toll collection as part of the design. The Bridge-Tunnel is the only toll facility in Virginia that does not use electronic toll collection, known as Smart Tag. Electronic toll collection is typically deployed to move greater volumes of traffic without having to hire additional toll collection staff. Also, since vehicles do not have to completely stop at a toll booth, electronic toll collection can move more vehicles through a toll lane in a given period of time. While the CBBT does not need the Smart Tag system currently to address traffic flow through the toll lanes, it would provide a convenience for motorists already using the system on other Virginia toll facilities.
Smart Tag could be used, in combination with discounts, to promote greater use of the facility by commercial customers, such as trucking companies or other high-volume users. It could also be used in coordination with the electronic toll systems in other states (known as EZ-Pass). In one weekend in June, more than 1,700 vehicles equipped with the EZ-Pass transponder used the Chesapeake Expressway. Many of those vehicles were from states in the northeast corridor, and may well have used the Chesapeake Bay Bridge-Tunnel. Moving out-of-state vehicles from the regular toll lanes during the peak vacation period could help to reduce congestion at the toll plazas. In addition, the district could use EZ-Pass as a marketing point in promotions of the facility in the northeast corridor. The replacement or renovation of the toll plaza areas should accommodate installation of the Smart Tag system.
Recommendation (13). In its renovation or replacement of the toll plaza buildings, the Chesapeake Bay Bridge and Tunnel District should include: (1) additional toll lanes to accommodate future increases in traffic and (2) installation of the Smart Tag electronic toll collection system.

Page 70 Chapter IV: Toll, Police, and Emergency Operations
Page 71 Chapter V: The CBBT Maintenance Program
V. The Bridge-Tunnel Maintenance Program
Maintenance of the Chesapeake Bay Bridge and Tunnel District’s many as-sets is an important function, with costs second only to debt service on the district’s bonds. More than 38 percent of the division’s staffing is devoted to the ordinary maintenance program, which typically constitutes less than half of the total expenditures for maintenance on the facility. Other maintenance expenditures are for major repair projects completed by contractors. In FY 2002, spending on maintenance totaled more than $6.2 million, and maintenance costs for FY 2003 are projected to exceed $12.1 million.
The level of maintenance on the Chesapeake Bay Bridge-Tunnel is related to the facility’s size and complexity, as well as its location at the mouth of the Chesapeake Bay. At 17.6 miles long from shore to shore, it is the longest combination of bridges and tunnels in the world. Since it crosses the bay at the point where the bay empties into the Atlantic Ocean, it is subject to strong currents, high winds, severe storms, and the corrosive effects of a marine environment. Having been in service for 38 years, it also shows the effects of the accumulated use by more than 78.2 million vehicles, including millions of heavy trucks. Without proper maintenance on a continuing basis, the steel, concrete, and asphalt structures would quickly deteriorate from the effects of 38 years of exposure to the elements and use by the traveling public.
For users of the CBBT, the condition – and appearance – of the facility reflects on the district’s commitment to provide a safe and efficient way to cross the Chesapeake Bay. Having paid a $10 toll, users have a right to expect the facility to be safe, clean, and well maintained. This is the important mission of the maintenance division.
In addition, the maintenance program is important in protecting the interests of bondholders. In compliance with the district’s bond resolutions, a consulting engineer assists the in-house staff in identifying maintenance needs and recommends actions to keep the facility in good repair. Over the years, the consulting engineer’s annual inspections have found that the CBBT is well maintained.
The consulting engineer has also made recommendations for various re-pairs, to which the district appears not to have been entirely responsive. Notably, construction of the parallel bridges in the late 1990s appears to have delayed some significant maintenance projects, such as rehabilitation of the tunnel interiors and repairs to trestle bents, among others. The delays in addressing some of the consulting engineer’s findings has left both tunnels with the appearance of being dilapidated, and has exposed employees to several hazards. With the construction of the parallel bridges now complete, the district needs to accelerate completion of some of the maintenance recommendations of the consulting engineer to protect the financial interests of bondholders and to ensure that the facility is safe for users and CBBT employees.

Page 72 Chapter V: The CBBT Maintenance Program
Overview of the CBBT Maintenance Program
The district’s maintenance program has two major components: ordinary maintenance and reserve maintenance. In FY 2002, ordinary maintenance expenditures totaled $2.47 million, of which 87 percent was for the salaries of the in-house maintenance staff. The costs of reserve maintenance projects totaled $3.74 million. Both programs are administered by the CBBT maintenance division.
Ordinary Maintenance. Ordinary maintenance consists of routine re-pairs and upkeep, such as patching potholes on roadway surfaces, repairing faulty electrical or communications equipment, painting ventilation equipment, repairing damaged guardrail, cleaning the interior surfaces of the tunnels, and mowing grass in medians and on other district property. It also includes upkeep of CBBT buildings and structures such as the ventilation buildings, the restaurant and fishing pier, toll lanes, administrative offices, the rest area, and various parking lots. The ordinary maintenance program also includes maintenance and repair of the district’s motor fleet, which includes various trucks for highway maintenance, wreckers and other emergency response vehicles, police cruisers, and cars for administrative staff. Maintenance of the district’s computer hardware, software, and network also is a part of the ordinary maintenance program. Some typical ordinary maintenance activities are shown in Figure 11.
Ordinary maintenance can be preventive or reactive. CBBT maintenance staff are involved in preventive maintenance such as painting metal structures, lubricating moving parts in tunnel equipment and pumps, cleaning circuit boards in
Figure 11 CBBT Ordinary Maintenance Activities
Repairing concrete from the Snooper. Changing the oil in a police cruiser.
Source: JLARC staff photos.

Page 73 Chapter V: The CBBT Maintenance Program
traffic control systems, testing emergency power systems, and servicing navigational aids. Reactive maintenance typically includes patching potholes in asphalt road surfaces, repairing cracks or other deterioration in concrete structures, replacing dam-aged guardrail, re-lamping a bridge light fixture, or repairing an electrical short in an emergency call box.
Reserve Maintenance. Reserve maintenance consists of larger projects, which typically are completed by external contractors hired on competitive bid. In recent years, the reserve maintenance program has included projects such as replacing all of the light fixtures in the tunnels, filling holes around trestle bents caused by scour, replacing the deck on the fishing pier, installing a new toll collection system, and replacing various trucks, police vehicles, and other equipment. Figure 12 shows two recent reserve maintenance projects.
The reserve maintenance program is established under requirements of section 510 of the 1991 bond resolutions. That section creates a reserve maintenance account:
…for the purpose of paying the cost of
(i) unusual or extraordinary maintenance or repairs, maintenance or repairs not recurring annually, and renewals and replacements, including major items of equipment, and
(ii) repairs or replacements resulting from an emergency caused by some extraordinary occurrence….
Reserve maintenance projects are planned on a six-year cycle by maintenance division staff based on in-house assessments and the results of the annual inspection by the consulting engineer, as discussed later in this report. Maintenance
Figure 12 Recent Reserve Maintenance Projects
Light fixture installation in the tunnels. Scour remediation on Trestle C.
Source: Chesapeake Bay Bridge and Tunnel District photographs.

Page 74 Chapter V: The CBBT Maintenance Program
staff consider the six-year plan a working document rather than a long-term capital plan. Thus, it is not approved by the commission, and may be modified by staff as needed. It is updated at least once annually. Projects in the six-year reserve maintenance plan are approved for funding by the CBBT commission on an individual basis when the projects are ready to be advertised for contract bids.
The current six-year reserve maintenance plan, last modified in August 2002, has 63 active or pending projects for the period from July 1, 2002 to June 30, 2008, with a total estimated cost of about $39.7 million. An additional $1.2 million is included for incidental projects over the lifetime of the plan. The current plan also includes approximately $337,000 for the tunnel lighting project that is nearing completion.
The nine reserve maintenance projects with estimated costs in excess of one million dollars are listed in Table 18. These projects involve a major renovation of the Thimble Shoal and Chesapeake Channel Tunnels as well as major repairs to trestle bents for northbound trestle A (the section from Virginia Beach to the first island) and the asphalt roadway surfaces on the trestles. Two of the projects are to address problems with scour around some of the pilings which support the trestles. Scour is the erosion of the bottom of the bay due to water currents, and could, if left unchecked, undercut the support of the trestle bents. The CBBT completes periodic hydrographic surveys to identify areas of scour around bridge and trestle sub-structures so that it can be addressed with reserve maintenance projects. Scour remediation around bents for trestle C is already underway.
The District Completes Required Inspections of Assets
The district completes inspections in compliance with two separate requirements. The first is the federally-mandated bridge inspection program, pursuant to Title 23, Part 650 of the Code of Federal Regulations. The second requirement is from the covenants of the 1991 bond resolutions, which govern all of the district's
Table 18 Nine Reserve Maintenance Projects with Costs More Than $1 Million Each
Project Description Estimated Cost Completed By
Sub-structure Repairs on Trestle A $6,400,000 FY 2005 Scour Remediation for Trestle C $5,809,145 FY 2003 Tunnel Retrofit (Tile, Handrail, Booths) $5,600,000 FY 2005 Mill and Repave Trestles $3,000,000 FY 2008 Tunnel Ceiling Repairs $2,000,000 FY 2006 Scour Remediation (General) $2,000,000 FY 2008 Retrofit Ventilation Controls $1,500,000 FY 2004 Painting of Tunnel Ventilation Systems $1,500,000 FY 2007 Painting of North Channel Bridge (SB) $1,500,000 FY 2007
Source: CBBT Six-Year Reserve Maintenance Plan, August 21, 2002.

Page 75 Chapter V: The CBBT Maintenance Program
outstanding bond issues. These two requirements are addressed through a single inspection process, completed by the district’s consulting engineer.
Federal Requirements for Bridge Inspections. Federal regulations regarding bridge inspections are administered by the Federal Highway Administration (FHWA) of the U.S. Department of Transportation. The FHWA regulations establish the inspection procedures, frequency of inspections, and qualifications of inspection personnel. Reporting requirements are also set out. Under these federal regulations, the district is required to complete inspections of all bridge assets at least once every two years. The underwater components of bridges are to be inspected once every five years. There are no corresponding requirements for inspection of the tunnel segments of the facility. Since the Virginia Department of Transportation (VDOT) is the State agency responsible for reporting to FHWA, the district forwards the results of its inspections to VDOT for inclusion in the statewide bridge inspection data reported to FHWA.
Bond Resolution Requirements for Bridge Inspections. Section 704 of the 1991 Revenue Bond Resolution and the 1991 General Revenue Bond Resolution require the district to retain the services of “an independent engineer or engineering firm or corporation having a nationwide and favorable reputation for skill and experience…” The bond resolutions, in Section 504, require that the district cause the consulting engineer to complete an annual inspection of the facility and report to the commission by April of each year any recommendations for maintenance or repairs. The consulting engineer is also required to determine the insurance to be carried by the district to comply with other provisions of the bond resolutions.
CBBT Implementation of Inspection Requirements. The district has implemented an inspection program that is consistent with federal requirements and ensures that needed maintenance is identified. As required by the bond covenants, the district has retained a consulting engineer to complete annual inspections of the bridges, tunnels, and other assets. Jacobs Civil, Inc., formerly Sverdrup Civil, has served as the consulting engineer since the Bridge-Tunnel opened in 1964. Sverdrup (then Sverdrup & Parcel) was the engineering firm that designed the original facility and supervised its construction. Sverdrup also designed and super-vised the construction of the parallel bridge project completed in 1999.
The current contract with Jacobs was awarded in June 2001 after a competitive procurement for which four engineering firms submitted proposals. A selection committee composed of two members of the commission and three members of the CBBT staff selected Jacobs’ proposal as best qualified. The full commission approved the award at its June 2001 meeting. The contract is for four years, with one four-year renewal. The cost for consulting engineering services under the contract is estimated to be about $545,900 for the first two years.
Since the consulting engineers complete inspections on an annual basis in compliance with bond requirements, the district also is in full compliance with federal bridge inspection requirements which require inspections only once every two years. As required by the federal regulations, the consulting engineers complete underwater inspections of the trestles and bridges on a five-year schedule. Because of

Page 76 Chapter V: The CBBT Maintenance Program
the length of the facility, this is accomplished by inspecting one-fifth of the trestle pilings and bridge piers annually. For example, in 2001, underwater inspections were completed for southbound sections of trestles B, E, and F, the northbound section of trestle D, the northbound North Channel Bridge, and the southbound Fisherman Inlet Bridge.
The annual inspection also exceeds the federal requirements because it includes an examination of the tunnels, ventilation buildings, toll plazas, motor fleet, and other assets of the district. Thus, the requirements of the bond resolutions more directly govern the timing and extent of inspections for the facility.
JLARC staff reviewed the detailed inspection forms completed by inspectors for the 2001 inspection and the annual inspection reports for each year since 1994. The inspection forms document the on-site examination of assets and detail the condition of the structure, as well as any recommended repairs or maintenance. The annual reports are compiled from the individual inspection forms, and provide a narrative of maintenance accomplishments from the prior year and needed work. Based on the review of annual reports since 1994, it appears that the consulting engineer has consistently provided specific guidance to the district on maintenance needs.
The most recent annual report of the consulting engineers, in April 2002, found that “the facility continues to be in generally good condition despite its location and the age of a significant portion of the infrastructure. Maintenance continues to be well planned with a timely response to needs and issues.” The findings for the 2002 report were consistent with those from prior years, concluding that the ordinary maintenance program was doing a reasonably good job of keeping the assets in good repair. JLARC staff independently evaluated the consulting engineer’s findings, as discussed in the next section.
Although the facility was found to be in generally good repair, the consulting engineer also made recommendations for repairs or improvements it considered appropriate. Among the major maintenance recommendations in the 2002 report were (1) repair of many of the 54-inch cylinder piles that support northbound trestle A, (2) repair of the interiors of both tunnels, and (3) repairs to the concrete columns and exterior brick of the tunnel ventilation buildings. The conditions which led to these recommendations are discussed below in the section on the need to accelerate certain reserve maintenance projects.
The Ordinary Maintenance Program Appears Adequate
A JLARC staff review of CBBT bridges, tunnels, and other assets confirmed the accuracy of the district’s contracted annual inspection. JLARC staff completed an on-site assessment of selected assets after reviewing the consulting engineer’s findings from the 2002 report. The staff examination included bents for the northbound and southbound sections of trestle A from the water; ventilation buildings and control rooms; portions of the fresh air duct, exhaust duct, and interior of the Thimble Shoal Tunnel; the interior of the Chesapeake Channel Tunnel; the Sea

Page 77 Chapter V: The CBBT Maintenance Program
Gull Restaurant on island 1; the tunnel portal islands; the north and south toll plaza buildings; maintenance buildings and garages; CBBT administrative offices; and the district’s Little Creek property.
District Assets Appear Generally Well Maintained. The JLARC staff examination of district assets confirmed that the maintenance program keeps the facility in generally good repair. Roadway surfaces are smooth and well maintained, ventilation and pump equipment appeared in good condition, and with a few exceptions, buildings appeared clean and well maintained. In interviews with CBBT commissioners, all considered the maintenance program to be successful in keeping the district’s facilities in good condition.
Staffing for Ordinary Maintenance Appears Appropriate, Except for Too Many Levels of Supervision. All of the ordinary maintenance activities are largely completed by in-house maintenance staff. Currently, the maintenance division has a total of 63 employees, organized into four departments. The technical department is the smallest with only two positions. The technical department is responsible for field and office engineering tasks such as hydrographic, physical, and topographic surveys; inspection of construction and maintenance on CBBT structures; preparation and review of engineering and architectural drawings, plans and invoices; and preparation of maps and charts.
The electronics/communications department has five positions, including the department superintendent and one supervisor. These staff are responsible for installing and maintaining various office, telephone, radio, toll collection, and computer networks and equipment. This includes installation and maintenance of communication gear for police cruisers and in the toll plazas, maintenance of the computerized toll collection system, and preventive maintenance on all of the district’s electronic systems. A JLARC staff review of monthly work accomplishments from February 1998 to June 2002 found that the overall level of staffing in the department appears appropriate. However, two supervisory positions for only three staff appears excessive.
The shops and services department is the largest within the maintenance division with 30 positions. This department is responsible for functions related to highway, bridge, tunnel, and facility maintenance; motor vehicle repairs and maintenance; heating, ventilation, and air conditioning (HVAC) maintenance; carpentry; and custodial services. The highway maintenance crews are responsible for patching roadway surfaces, cleaning and repairing concrete structures, and removing ice and snow, among many other duties. In the JLARC staff on-site visits, CBBT maintenance crews were observed in a number of ordinary maintenance activities. Be-cause maintenance is completed without closing the facility to traffic, staff are required for the set up of lane closures. Other staff are needed to operate equipment such as the Snooper truck, which provides a movable platform for work under CBBT bridge structures. JLARC staff reviewed monthly reports of work accomplishments from 1998 to 2002. Based on the work accomplishments in recent years and the on-site observations, the overall staffing level in the shops and services department appeared reasonable for the work completed. As with the electronics/communications department, however, the shops department appears to have too many supervisors

Page 78 Chapter V: The CBBT Maintenance Program
for the number of employees. There are four levels of supervision for the highway maintenance workers, for example. In most instances, supervisory positions super-vise three or fewer employees.
The electrical/mechanical department is responsible for the operation and maintenance of the tunnel ventilation, lighting, and pumping equipment. The department has 22 positions, including the 10 tunnel operators needed to provide 24-hour, seven-day-a-week staffing for the two tunnel control rooms. The tunnel opera-tors ensure proper air flow in the tunnels to minimize risks associated with carbon monoxide. The tunnel mechanics maintain the various fans, pumps, generators, batteries, cables, and other equipment necessary for the tunnels to remain operational. These staff also sample water discharges into the Chesapeake Bay for environmental monitoring and control. Staffing for tunnel operations appears reason-able. With the current configuration of equipment in the tunnel control rooms on islands 2 and 4, and the need for the control rooms to be staffed 24 hours per day, seven days a week, the number of positions in the electrical/mechanical department appears necessary. However, planned consolidation of tunnel operations in a single control room will permit some reassignment of staff to other functions. As with the other departments, the structure for supervision may need to be reconsidered, be-cause the need for both a superintendent and supervisor appears questionable.
Recommendation (14). The Chesapeake Bay Bridge and Tunnel District should re-examine the organization of the maintenance division to reduce the number of supervisory positions within the departments.
Certain Reserve Maintenance Projects Should Be Accelerated
All of the maintenance and repairs recommended by the consulting engineer in the 2002 report appear to be justified. During the on-site assessment, JLARC staff photographed CBBT assets in need of repairs. Some of the conditions cited in the consulting engineer’s report and photographed by JLARC staff are shown in Figures 13, 14, 16, and 17.
Damage and Deterioration of Trestle A Bents. Figure 13 shows various concrete piles which are part of the substructure for northbound trestle A, which was part of the original structure. The damage and deterioration evident on many pilings is the result of two separate causes. According to the district’s consulting engineer, none of the damage is structural, so it poses no danger to the traveling public. The cracking seen in the first pile section below the bridge deck is the result of the original construction process for trestle A, closest to the shoreline in Virginia Beach (Figure 13a and 13b). Initially, a floating pile-driver was used to hammer the piles into the bottom of the bay. Movement of the pile driver in the water caused the strikes from the hammer to be out of alignment with the piles being driven, resulting in numerous cracks in the upper segment of the piles. At about 2.5 miles out from Virginia Beach, a pile driver with legs to lift it out of the water was used, and the driving was more precise. As a result, there is no damage to the upper piles after approximately 2.5 miles from the Virginia Beach shoreline.

Page 79 Chapter V: The CBBT Maintenance Program
The second cause of damage to bents for northbound trestle A is ship collisions. Over the years, several ships and barges have collided with trestle A, in some cases causing sections of the bridge to collapse. Less severe damage from those collisions was repaired at the time, but has since reappeared as the patches and repairs have aged. Figure 13c shows some of the damage from collisions that has been re-paired, but needs to be addressed with new repairs. Figure 13d shows a crack that has been repaired with epoxy, but has subsequently developed additional cracking.
As noted previously in Table 18, repairs to the bents on northbound trestle A are estimated to cost about $6.4 million dollars, with the work completed by FY 2005. The repairs are expected to be in the form of a “jacket,” in which the entire piling is encased in an epoxy compound. The jacket seals the piling from any additional exposure to the weather and the chemicals used to remove snow and ice from the facility, thus arresting any further deterioration.
Figure 13 Deteriorated and Damaged Bents for Northbound Trestle A
a. Pilings damaged in construction
c. Collision damage previously repaired.
b. Piling damaged in construction.
d. Failed patch with new cracking.
Source: JLARC staff photographs.

Page 80 Chapter V: The CBBT Maintenance Program
Deterioration of Tunnel Interiors. Over the past decade, the interiors of both tunnels have experienced significant deterioration. Much of the damage is cosmetic, involving the loosening of tile which covers the walls and ceilings. An ex-ample is shown in Figure 14. While none of the damage is structural, it results in a very poor appearance in the tunnels. Some of the deterioration is more than cosmetic, however, and could pose a significant safety hazard to both the traveling public and CBBT employees.
The damage is primarily the result of the corrosion of the metal frames and access panel doors located throughout both tunnels. Expansion of the metal as it corrodes has damaged surrounding tile which covers the walls and ceilings. The corroding metal frames have also caused some de-lamination of the underlying concrete wall surfaces to which the tile is attached. This damage is extensive throughout both of the tunnels, and can be observed on almost every exposed metal surface. Should loosened tile fall into the tunnel roadway, it could pose a hazard to the traveling public. The condition of the tunnels could also be hazardous to employees of the district or contractors.
Of particular concern are the pedestrian sidewalk handrails and the metal doors which cover the top and side of large electrical pull boxes located within the structure of the sidewalk on the southbound side of each tunnel. The sidewalks are used by district personnel to patrol the tunnels and by maintenance staff. The handrails are intended to protect employees from falls from the elevated sidewalk.
In one of several on-site reviews of tunnel facilities, JLARC staff found two sections of handrail almost completely rusted through (Figure 15), and were clearly
Figure 14 Damage to Tunnel Tile and Concrete from Corrosion of Metal Boxes
Source: Chesapeake Bay Bridge and Tunnel District photograph.

Page 81 Chapter V: The CBBT Maintenance Program
unable to support the weight of an employee. Because of the hazardous condition this posed to employees, an immediate inspection of the handrails was completed by the district subsequent to the JALRC staff inspection, and some repairs were made.
Some of the metal doors on the pull boxes have become so corroded that CBBT maintenance staff have had to remove them. To make the sidewalk useable with the top panels missing, staff have constructed plywood ramps to cover the opening in the sidewalk (Figure 16). There are several potential problems with the cur-rent condition of the sidewalks and handrails near these pull boxes. First, the open pull boxes expose employees to possible shock hazards. Second, the plywood ramps covering the open pull boxes present a tripping hazard. Third, the deterioration of tile and concrete caused by the metal frames near the attachment of the sidewalk handrail could cause the handrail to fail. The risk associated with this hazard is especially acute because the raised plywood platforms are used in places on the side-walk where the handrail has the greatest potential to fail.
The current handrails used in the CBBT tunnels also do not comply with current occupational safety standards. According to the Virginia Occupational Safety and Health Standards for General Industry, Part 1210.23 (e) (1), the hand-rails are supposed to be 42 inches high, with a mid-rail at approximately halfway between the top rail and the floor or platform. The handrails in the CBBT tunnels are 34 inches high, with no mid-rail. Tunnel renovations will include replacement of the handrails to bring them into compliance with applicable safety standards.
In June of 2002, an incident at the Hampton Roads Bridge-Tunnel (HRBT) illustrated the potential hazard created by current conditions in both the Thimble Shoal and Chesapeake Channel tunnels of the CBBT. In the HRBT incident, the concrete near an electrical pull box in the eastbound tunnel failed when an employee fell against the sidewalk handrail, apparently after being hit by a bottle thrown from
Figure 15 Rusted Handrail in the Chesapeake Channel Tunnel
A rusted handrail stanchion. A handrail rusted completely through.
Source: JLARC staff photographs.

Page 82 Chapter V: The CBBT Maintenance Program
a vehicle. The handrail broke loose from the sidewalk and the employee fell to the tunnel roadway. The injured VDOT employee was found in the roadway by a motorist in the tunnel. An investigation determined that the cause of the handrail failure was the de-lamination of the concrete at the attachment point of the handrail.
To protect the safety of HRBT employees, the tunnel sidewalks were closed to all employees until the handrails were tested in both the eastbound and west-bound tunnels, and certain repairs were completed. To address the tripping hazard posed by the pull box covers located in the sidewalk, VDOT began fabricating re-placement covers with an improved design, and installed them as they became available. Once all of the repairs have been completed, VDOT will begin weekly safety inspections to ensure the safety of personnel using the tunnel sidewalks.
As seen in the photograph in Figure 16a, the attachment points for the handrails in the CBBT tunnels are adjacent to the electrical pull boxes in the side-walk. Moreover, deterioration in the CBBT tunnels appears worse than that seen in the Hampton Roads Bridge-Tunnel, although the condition of the concrete under the tile is unknown. The general condition of the tunnel sidewalks could pose a significant hazard for the CBBT employees who must use them on a daily basis. Accordingly, the district should consider closing the tunnel sidewalks to all employees until it has completed testing and repairs to ensure that the handrails are securely attached to the walls. An improved solution to the missing covers for the pull boxes in the sidewalk should be developed and the raised plywood platforms should be re-moved as soon as practical.
Repairing the damage to the tunnel walls, pull boxes, niches, and handrails will require a more extensive renovation. This will involve removal of the metal structures that have corroded, as well as removal of cracked or broken tile and the underlying concrete surfaces. Metal frames, panel doors, and other components will be replaced with stainless steel or other metals which are not subject to corrosion. Then, the concrete will be repaired and new tile attached to exposed concrete surfaces. These repairs are included in the six-year reserve maintenance plan, to be completed over three years, with completion in FY 2005. The total cost of the re-pairs is estimated by CBBT staff to be about $5.6 million.
Recommendation (15). The Chesapeake Bay Bridge and Tunnel District should, except during emergencies, close the pedestrian sidewalks of both tunnels to all employees until the handrails have been tested for secure attachment to the wall. Repairs to the pull-boxes and other access panels in or under the tunnel sidewalk should be accelerated. The ply-wood ramps covering pull boxes should be removed as soon as practical. The district should implement weekly safety inspections of tunnel side-walks when all of the repairs have been completed.
Other Maintenance Needs. During the JLARC staff on-site review of CBBT assets, maintenance staff pointed out other maintenance and repair needs. While most of the these additional items pose no specific risk to either the public or CBBT employees, they should be addressed as scheduled in the six-year reserve maintenance plan to protect the bondholders’ investment in the facility. Among the

Page 83 Chapter V: The CBBT Maintenance Program
Figure 16 Deteriorated and Missing Pull Box Covers
a. A plywood ramp covers an open electrical pull box.
b. A tunnel sidewalk with the pull box cover in place. Note the concrete de-lamination at the edges. he front cover protrudes from the sidewalk. T
Source: JLARC staff photographs.

Page 84 Chapter V: The CBBT Maintenance Program
needs identified were repairs to the interior and exterior ventilation building walls (Figure 17), replacement of guardrail on the tunnel islands, repaving the tunnel roadways (Figure 18), and additional scour remediation as needed.
CBBT Commission Should Fund Projects for Immediate Attention. All of the maintenance needs illustrated in Figures 13, 14, 16, 17, and 18 were identified by the consulting engineer – in some cases, years ago. For example, the consulting engineer noted in its April 1994 report that:
Each tunnel has isolated areas of cracked and missing tile which has been similarly documented in past year’s inspections. Minor and scattered progression of concrete and tile spalling was observed, particularly around niche frames. As discussed in last year’s report the District has conducted a detailed condition survey of the walls and ceilings of both tunnels, concentrating on the areas around niches with the intention of implementing a future re-habilitation project. Since Sverdrup’s inspection some spalling of concrete and tile has occurred at the South Portal of the Chesapeake Tunnel.
Eight years later, this is the same tile and concrete damage in the tunnels discussed above and shown in Figures 14 and 16.
According to CBBT staff, planning and construction of the parallel bridges delayed several important projects, including refurbishing the interiors of the tunnels, repairing deteriorated and damaged trestle bents, and renovating the exterior and interior walls of the ventilation buildings. While CBBT staff would not confirm it, it appears these high-cost projects were deferred in order to accumulate cash for
Figure 17 Repairs Needed to the Interior and Exterior of the Ventilation Buildings
Damage to an interior concrete support beam in a ventilation building.
Exterior damage on a ventilation building, including displaced cap stone and separated brick.
Source: JLARC staff and Chesapeake Bay Bridge and Tunnel District photographs.

Page 85 Chapter V: The CBBT Maintenance Program
Figure 18 De-lamination of Asphalt Tunnel Roadway
Deterioration of the tunnel roadway surface.
Source: JLARC staff photograph.
the construction of the parallel bridge project. However, all of the needed repairs have now been included in the six-year reserve maintenance plan.
The district has significant funds available to complete needed repairs. The reserve maintenance fund had a balance of approximately $4.5 million at the end of FY 2002, which is insufficient for the projects which should be accelerated. The commission can transfer additional funds from the CBBT general fund to the reserve maintenance fund at any time, however. The FY 2002 balance of the general fund was approximately $65 million, which is available for transfer as needed. Since toll revenues exceed operating costs and debt service, additional funds will be available over the course of the major reserve maintenance projects.
Recommendation (16). The Chesapeake Bay Bridge and Tunnel Commission should accelerate completion of reserve maintenance projects to renovate the tunnel interiors, to repair bents for northbound trestle A, and to repair the exterior and interior walls of the tunnel ventilation buildings.

Page 86 Chapter V: The CBBT Maintenance Program

Page 87 Chapter VI: General Administration and Governance
VI. General Administration and Governance
HJR 210 directed that this study of the future of the Chesapeake Bay Bridge-Tunnel include a review of the management policies, procedures, and practices for the district, including procurement, employment practices, and the salary structure for employees. The resolution also directed that the study include an assessment of the appropriate role for the State in the future of the facility. In response to these requirements, JLARC staff completed a general review of the ad-ministration and governance of the district.
In conducting the review, JLARC staff focused on the district’s status as a political subdivision of the Commonwealth. The district operates independently of the Commonwealth Transportation Board, the Virginia Department of Transportation, and the counties and cities comprising the district’s general area of operation. It is clear from the Acts of Assembly, however, that the district is not a private entity. Rather, the district is a public agency, and is therefore accountable to the people of the Commonwealth, and should conduct its business in a manner consistent with other public agencies. The district’s status as a political subdivision established the boundaries within which the review of policies and practices was completed, and also helped to define the appropriate State role in determining the future of the Chesapeake Bay Bridge-Tunnel.
The review included interviews with members of the General Assembly, CBBT commissioners and staff, staff of other bridge-tunnel and toll facilities, and local governments. In addition, JLARC staff completed reviews of all CBBT policy manuals and written procedures, a comparative analysis of CBBT salaries and fringe benefits, and reviews of the Code of Virginia and the Acts of Assembly. Staff reviewed the minutes of monthly commission meetings from January 2000 to the present, and attended the regular meetings of the CBBT commission from July to October of 2002. JLARC staff also requested that the Virginia Retirement System (VRS) complete a review of the financial impact of enhanced retirement benefits for CBBT police officers.
Overall, this review found that the district is generally well managed, and that the commission has exercised reasonable diligence in its deliberations and actions. Policies and procedures governing a broad array of operational and administrative topics have been developed by the district, and employees appear to be generally knowledgeable about the policies. No significant disparities in salaries or benefits were found, although police officers have not been provided the enhanced benefits of the Local Enforcement Officers Retirement System administered by VRS. On the other hand, the district does not have a formal evaluation process for employees, a significant shortcoming for an organization as large and complex as the CBBT. The commission also has no formal mechanism for assessing the performance of the executive director, limiting its effectiveness as the oversight body for the operation of the district. The commission also needs to enhance public participation in its decision-making process.

Page 88 Chapter VI: General Administration and Governance
Given the general success of the CBBT commission and its staff in funding, operating, and maintaining the Chesapeake Bay Bridge-Tunnel for more than 40 years, there appears to be no need for a change in the State role vis-à-vis the district. That is, the State role in the future of the Chesapeake Bay Bridge-Tunnel should continue to be a limited one, primarily in the form of appropriate authorization for the commission to operate the Bridge-Tunnel as a toll facility.
The CBBT Has Developed Appropriate Administrative Policies
Overall, with the exception of the emergency action plan discussed in Chapter IV and the employee evaluation process discussed in the next section, appropriate policies and procedures have been developed by the district for a broad range of operational and administrative functions. JLARC staff requested from the district and reviewed all policy and procedures manuals, handbooks, and guidelines. In interviews with JLARC staff, employee knowledge of policies and procedures was assessed as well. The following written policies, manuals, or handbooks have been developed by the district:
• Employee Handbook • Operations Division Manual • Employee General Safety Policy Manual • Public Relations Plan • Emergency Action Plan • Purchasing Policy Manual • Investment Policy • Public Comment Policy • Drug and Alcohol Free Workplace Policy • Strategic Plan (1998)
The employee handbook consists of several key policies and procedures, including the district’s mission statement, employment policies such as the sexual harassment policy and the grievance procedure, salary and benefit descriptions, and the work-place violence prevention policy.
The CBBT commission recently raised concerns about the adequacy of personnel policies for the district, noting that there is no personnel policy manual. A review by the commission’s personnel committee of various policies developed over the years found that the district had adopted many of the necessary policies, but that they were not compiled in a comprehensive, easy-to-use reference. The commission has requested that staff work with the district’s legal counsel to prepare a single personnel policy manual. The most significant problem with the district’s administration of the personnel function is its lack of a formal evaluation system for employees. This was cited by the personnel committee in its report to the commission at its October 2002 meeting.
Other policies, manuals, and handbooks reviewed by JLARC staff appeared to be comprehensive, and employees reported in interviews that they had adequate guidance regarding the districts policies and procedures. With regard to procurement, for example, all purchasing is the responsibility of a single employee in the maintenance division. All procurements for the district are reviewed and approved centrally. The purchasing manual includes a copy of the procurement policy adopted by the commission in 1983, as well as the language of the Public Procurement Act; general procedures for purchases; samples of invitations for bid; general specifica-

Page 89 Chapter VI: General Administration and Governance
tions; and samples of other purchasing forms. The manual is updated on a periodic basis, most recently in March of 2001.
The CBBT Does Not Have an Employee Evaluation Process
With 165 employees, across a broad range of occupations, skill levels, and responsibilities, the district faces a significant challenge to evaluate work performance. In addressing the challenge, the district has chosen to decentralize the process, relying on individual supervisors. As a result, it is not clear that employee performance is evaluated on a regular, consistent basis, if at all. To implement an employee performance system and to improve personnel management generally, a new focus on human resources management by the district may be needed.
No Written Evaluations Are Made of Employee Performance. In re-viewing the district’s policies with regard to employment and personnel practices, JLARC staff found that the lack of a formal evaluation process was a significant omission for an organization as large and complex as the CBBT. It is of particular concern because the district employs police officers, emergency crew workers, and toll collectors who have daily contact with the public and exercise considerable discretion in carrying out their duties. In addition, maintenance personnel often work in hazardous situations, typically around traffic, so proper use of safety procedures and equipment is essential. Regular evaluation of these employees is essential to ensure that they complete their assigned tasks safely and effectively.
CBBT managers interviewed by JLARC staff reported that employees are evaluated by their immediate supervisors on a continuing basis, and are provided feedback on their performance as needed. However, the district does not maintain any written records of these evaluations. Without such written documentation, personnel decisions such as dismissals, promotions, or salary actions could be based on matters unrelated to employee performance and merit. Moreover, because there is little guidance to supervisors on how and when to evaluate employee performance, it is unlikely that the informal evaluations are done consistently. While CBBT management were able to produce letters of commendation from the public about employees providing courteous and helpful service, those letters do not substitute for a properly documented evaluation of employees by their supervisors.
The district should develop and implement an employee evaluation process based on written performance expectations developed for each CBBT position. Evaluations should be completed annually for all employees by their direct supervisors, and reviewed by the appropriate division director. Employees should be provided an opportunity to review and respond to the evaluation in writing, and to meet with the supervisor and division director. The process should also include a specific mechanism for an appeal to the executive director of any adverse actions arising from an evaluation. All CBBT supervisory staff should be trained in how to complete evaluations in the new process.
The evaluations should be in writing on standard instruments which measure actual employee performance for the prior 12-month period in comparison to

Page 90 Chapter VI: General Administration and Governance
written performance expectations. Different instruments should be developed for different categories of employees. For example, the instrument for evaluating police officers will need to be different than the one for evaluating toll collectors or maintenance personnel. The written evaluations should be retained as a part of an employee’s personnel record.
Recommendation (17). The Chesapeake Bay Bridge and Tunnel District should implement a formal written performance evaluation process for all employees. Promotions, salary actions, and disciplinary actions should be based on the performance evaluation system. Supervisors should be trained on how to perform employee performance evaluations and how to document employee performance.
There Is No Evaluation of the Executive Director by the Commission. The CBBT commission is ultimately responsible for the effective operation of the Bridge Tunnel. In carrying out its responsibilities, it must rely on the CBBT executive director and his staff. Despite the importance of the relationship between the commission and the executive director, the commission has not traditionally provided the director with any clear expectations for his performance. It also does not have a way to formally evaluate the performance of the executive director.
Some CBBT commissioners raised concerns that the executive director and the staff have not always been responsive to the directions of the commission. In particular, concerns were raised about commissioners having insufficient information about critical decisions coming before the commission, and a lack of follow-up on matters raised by commissioners. Other concerns were raised about the management of the district, such as the lack of a personnel manual and evaluation process. On the other hand, other commissioners complained that the commission micro-manages the operation of the Bridge-Tunnel, involving itself in matters better left to the executive director and the professional staff.
Both of these areas of concern may be related to the uncertain relationship between the commission and the executive director. To address this situation, the commission may want to better define the appropriate roles of the commission and the director. It may also want to develop written performance expectations for the director. Those performance expectations could be used by the commission’s executive committee to complete a written annual evaluation of the executive director.
Recommendation (18). The Chesapeake Bay Bridge and Tunnel Commission should establish written performance expectations for the executive director, and direct its executive committee to prepare a written evaluation of the executive director annually. The evaluation should be based on the specific performance expectations established in advance by the commission.
The District May Need a New Focus on Human Resources Management. Currently, the human resources function for the district is administered in the finance division, with the finance director also serving as the human resources officer. This arrangement appears to have sufficed because hiring, employee evalua-

Page 91 Chapter VI: General Administration and Governance
tion, and other personnel functions have been largely decentralized to the operating divisions. With the implementation of a formal evaluation system, it may be necessary for the district to establish a separate human resources division. Moreover, a separate human resources division could refocus attention on important functions such as benefits administration and equal employment opportunity.
Recommendation (19). The Chesapeake Bay Bridge and Tunnel Commission should consider establishing a human resources division to implement the new employee evaluation system, and to manage personnel functions such as benefits administration, classification and compensation, recruitment, equal employment opportunity, and federal and state regulatory requirements.
CBBT Salaries Are Comparable to Other Public Agencies
The CBBT salary structure for employees consists of 40 pay grades, each with 20 steps. The base salary in July 2001 was $13,163, with the maximum set at $113,945. No position is currently graded lower than grade 4, however, so the lowest base salary is actually $15,044. The highest grade used is 32, with a maximum salary of $79,815. The salaries for the finance director and executive director fall outside of the standard structure, at $94,152, and $141,600, respectively.
The current salary structure was adopted by the CBBT commission after a review by a consultant. In November 1999, the CBBT received the final report of a classification and pay study completed for the district by Municipal Advisors Incorporated. The study evaluated the CBBT classification plan and salary structure in comparison to four local governments and nine bridge, tunnel, and toll agencies. Salary data for 30 benchmark positions was used in the analysis. Since it was completed after opening of the parallel bridges, it should have properly accounted for changes in duties that resulted from the nearly doubling of the size of the facility. The study concluded that salaries of district personnel are in line generally with comparable positions in other public sector agencies. The consultants found that the position descriptions were appropriate and should be adopted as the district’s official classification system and that the existing salary structure was sound. Several cost of living increases have been provided to CBBT employees since the classification and pay study.
CBBT Administrative, Maintenance, and Non-Police Operations Salaries Appear Consistent with Other Agencies. Since the CBBT classification and pay study was completed almost three years ago, JLARC staff undertook a limited comparison of salaries for several positions in the administrative, operational, and maintenance areas. Non-law enforcement positions were compared with similar positions at the Hampton Roads Bridge-Tunnel (VDOT), and the Richmond Metropolitan Authority (RMA). Those comparisons, shown in Table 19, confirmed that salaries are generally in line with other public agencies, although there were some notable variations across the three facilities. For example, the CBBT maximum salary for toll collectors is $28,680, but the RMA has a Senior Toll Attendant position with a maximum of $33,631, or almost $5,000 more than the CBBT. However the

-- --
Page 92 Chapter VI: General Administration and Governance
Table 19 Comparison of Salary Ranges for Selected Positions
Salary Ranges Position CBBT HRBT RMA
Director/Manager $141,600 $45,607 – $78,322 $110,380 – $182,127 Finance Director $94,152 N/A $75,392 – $124,395 Operations Director $52,297 – $79,815 $31,934 – $54,842 $82,931 – $136,836 Maintenance Director $52,297 – $79,815 N/A $62,307 – $102,805 Public Relations Director $47,844 – $73,018 N/A $38,556 – $61,688
Emergency Crew/Patroller $19,648 – $29,985 $17,116 – $29,394 N/A
Maintenance Worker $18,793 – $28,680 $17,116 – $35,127 $19,725 – $30,573
Senior Toll Collector N/A N/A $21,698 – $33,631 Toll Collector $18,793 – $28,680 N/A $17,932 – $27,795
Source: Chesapeake Bay Bridge and Tunnel District, Hampton Roads Bridge-Tunnel, the Richmond Metropolitan Authority, and the Virginia Department of Transportation.
RMA Senior Toll Attendant has short-term supervisory responsibilities, while the CBBT collectors do not. The RMA pay range starts slightly lower than the CBBT range for toll collectors. CBBT salary ranges were also lower for senior administrative positions as well.
CBBT Police Salaries Appear Consistent with Deputy Sheriff Salaries. For CBBT police officers, a comparison was made with the salary scale authorized by the State Compensation Board for deputy sheriffs with law enforcement responsibilities. Specifically, the salary scale as used for the supervisory and duty levels for deputies in Northampton County were the basis for the analysis. Neither the CBBT nor the Compensation Board salaries for deputies is consistently higher than the other across the range of police positions (Table 20). For supervisory personnel at the sergeant and lieutenant levels, the CBBT officers appear to have greater supervisory responsibilities, and this is reflected in the somewhat higher ranges. For patrol officers, the ranges are fairly comparable, with the CBBT having a higher starting salary, and the deputies having a higher ending salary.
Table 20 Comparison of CBBT Police and Northampton Deputy Salary Scales
CBBT Sheriff's Deputy Position Salary Range Position Salary Range Lieutenant $35,038 - $53,474 Chief Deputy (L11) $33,304 - $51,970 Sergeant $32,055 - $48,920 Patrol Sergeant (L9) $27,872 - $43,495 Corporal $28,049 - $42,806 Master Officer $25,661 - $39,161 Master Deputy (L9) $27,872 - $43,495 Police Officer $24,544 - $37,456 Deputy (L7 and L8) $23,329 - $39,792
Source: Chesapeake Bay Bridge-Tunnel, State Compensation Board, and Northampton County Sheriff's Office.

Page 93 Chapter VI: General Administration and Governance
Based on the classification and pay study completed for the district, and the more limited analysis completed for this study, it does not appear that CBBT salaries are inconsistent with the compensation provided by other similar public agencies. For those positions where there are somewhat different ranges, the variation appears to be related to differences in supervisory responsibilities, or the complexity of the operation for which the agency is responsible. There does not appear to be any need for modification to the general salary structure at this time
Employee Benefits Are Generally Appropriate
The CBBT is a political subdivision of the Commonwealth, so employees are eligible for participation in the benefits typically available to public employees in Virginia. The general benefits package for CBBT employees appeared comprehensive and reasonable. On the other hand, CBBT police officers do not receive the enhanced retirement benefits provided to most police officers.
The General Package of Benefits Appears Appropriate. Employee benefits appear adequate and comparable to those for employees of other public agencies. All employees, including law enforcement personnel are members of the regular Virginia Retirement System retirement program. The CBBT pays the employee share of the VRS contribution. Other benefits include social security, annual leave, sick leave, 12 paid holidays, group health insurance, a health insurance credit for retirees, VRS provided life insurance, optional life insurance, deferred compensation, statutory worker’s compensation and unemployment insurance, and a uniform allowance for all uniformed employees (police, emergency crews, toll collectors). The cost of benefits, excluding uniform allowances, is about 46 percent of the district's total payroll. The only benefit available to CBBT employees that is not generally available to other public employees in Virginia is free passage on the Bridge-Tunnel.
Retirement Benefits for Police Officers Could Be Enhanced. An additional difference from the typical benefits provided to employees of political subdivisions is that CBBT police officers have not been provided the enhanced benefits provided by the Local Enforcement Officers Retirement System (LEOS) administered by VRS. Instead, all CBBT employees, including uniformed police officers, participate in the regular Virginia Retirement System retirement plan. Since, 1970, political subdivisions in Virginia have had the option to provide enhanced retirement benefits to uniformed law enforcement officers. The enhanced benefit consists of unreduced retirement at age 50 with 25 years of service, rather than 30 years of service as required in the regular VRS program, as well as a supplement currently valued at about $9,800 annually. The enhanced benefits are intended to recognize the additional stress and hazards faced by police officers in the normal course of their employment.
In a recent analysis of LEOS coverage requested by JLARC staff, VRS determined that 70 of 141 police departments in Virginia with a retirement plan pro-vide this enhanced benefit. In addition, it is available to deputy sheriffs in 60 of the 122 sheriff's offices statewide. However, since all but two of the large police departments in the counties and cities across Virginia provide the enhanced benefit, the

Page 94 Chapter VI: General Administration and Governance
vast majority of police officers (9,532) are covered by LEOS. Thus, the benefit is generally available to law enforcement officers employed by police departments in counties, cities, and towns across the Commonwealth, and to most deputy sheriffs.
At the request of JLARC staff, the Virginia Retirement System had its actuary determine the change in the employer contribution rate for the CBBT if LEOS coverage were provided to uniformed police officers. For FY 2003 and FY 2004, the contribution rate is 3.0 percent of payroll for all covered employees (plus the 5.0 per-cent employee rate paid by the CBBT on behalf of employees). Using member data as of August 2002, and actuarial assumptions for the June 2001 valuation, the VRS actuary determined that the rate would increase by 6.0 percentage points for all covered employees (not just police officers), to 9.0 percent of payroll. The rate is applied to all employees to simplify administration, but the additional cost is the amount equivalent to the actuarial cost of benefits for police only. With a payroll of approximately $5.98 million in FY 2003, the incremental cost for the district to implement LEOS coverage is estimated by JLARC staff to be about $359,000 annually.
Recommendation (20). The Chesapeake Bay Bridge and Tunnel Commission may wish to consider providing uniformed police officers with the enhanced retirement benefits of the Local Enforcement Officers Retirement System administered by the Virginia Retirement System.
The Commission Could Enhance Public Participation in Decision Making
In December 2001, the Chesapeake Bay Bridge and Tunnel Commission adopted policies regarding public comment at its regularly scheduled meetings. The public comment policy appears to have been developed in response to the controversy surrounding the implementation of the 24-hour round trip toll discount. While the commission appears to have accommodated public comment on the toll change and its impact on the Eastern Shore, some opponents of the toll discount continued to complain that they were not given adequate opportunity to participate in the commission's decision-making process.
A review of commission minutes shows that it regularly provides the opportunity for public comment at each of its monthly meetings. However, it has traditionally not held public hearings when modifying the toll structure or regulations regarding the operation of the facility. Since public comment is limited to monthly meetings, held during regular business hours (9:30 a.m., on the second Tuesday of each month), the opportunity for public input may be diminished. Interested per-sons who work may find it difficult to attend the regular meetings during the work-day.
In considering changes to the operation of the facility that could generate significant public concern, the commission may need to do more to facilitate public participation. For example, the commission might want to hold public hearings for all changes in the toll structure or traffic regulations, such as speed limits. To maximize public participation, the commission should consider conducting the hearings in the evening, at convenient locations on the Eastern Shore and in Hampton

Page 95 Chapter VI: General Administration and Governance
Roads. For example, hearings could be held at public schools on the Eastern Shore and in Virginia Beach. The commission should direct the CBBT public relations division to ensure that full and timely notice is made of the purpose, time, and location of the public hearings.
Recommendation (21). The Chesapeake Bay Bridge and Tunnel Commission should adopt the necessary policies and procedures for the use of public hearings to solicit comments on changes in traffic regulations or the toll structure. Public hearings should be conducted in the evening and in convenient locations on the Eastern Shore and in Hampton Roads to facilitate maximum public participation. The commission should ensure that the public receives full and timely notice of the purpose, time, and place of the public hearings.
State Role in the Future of the CBBT
Currently, the State plays a limited role with regard to the Chesapeake Bay Bridge-Tunnel. The Acts of Assembly provide the legal basis for the facility's operation, the Governor appoints the members of the CBBT commission, and VDOT funds approximately $1 million annually in urban street payments to the district. The district also coordinates various activities with State agencies such as the Virginia State Police, the Virginia Marine Resources Commission, and the Virginia Department of Transportation (VDOT). But the CBBT operates independently of VDOT, the Commonwealth Transportation Board, and other State agencies.
There Is No Compelling Reason to Change the State Role. This re-view found that the Bridge-Tunnel is generally well maintained and operated. There is no evidence that either the commission or the staff have discharged their duties other than in the interests of the facility and its users. While this review found the need for some improvements to certain operational and administrative functions, the findings of this report do not point to any failure of the commission to carry out the responsibilities delegated to it by the General Assembly.
It is also clear that the State, through the Commonwealth Transportation Board and the Virginia Department of Transportation, is unlikely to be a significant source of additional funding for either operations or capital improvements. In fact, it appears that the district may be better positioned to use tolls and other existing sources of revenue, including bonded debt, to fund its continuing operational and capital requirements. This study found that toll revenues are more than adequate to cover the costs of operations, maintenance, and current debt service.
CBBT bond issues have always included the disclaimer that the bonds do not constitute a debt, or a pledge of the faith and credit, of the Commonwealth or any political subdivision thereof. Moreover, there is no evidence the commission has acted irresponsibly with regard to its prior use of debt financing. Therefore, approval of debt issuance by the General Assembly, as proposed in House Bill 933 (2002), appears unnecessary.

Page 96 Chapter VI: General Administration and Governance
In the absence of any evidence that the State needs to intervene in the operation of the facility or to provide additional funding, there appears to be no compelling reason for the General Assembly to change the nature of the State role vis-à-vis the Bridge-Tunnel. Accordingly, the primary State role with regard to the Chesapeake Bay Bridge-Tunnel should be limited to providing the statutory frame-work for the CBBT commission and staff to carry out essential functions related to finance, maintenance, and operations.
Toll-Free Operation by VDOT Seems Unrealistic. Chapter 714, §10 of the 1956 Acts of Assembly directs that upon retirement of all debt, the Bridge-Tunnel shall become a part of the State highway system, and be operated by the State Highway Commission (now, the Commonwealth Transportation Commission) on a toll-free basis. While this requirement may have been appropriate at the time of its passage, current circumstances might require its reconsideration.
Two concerns are of particular note. First, it appears unlikely that VDOT would have sufficient funds to operate and maintain the facility without continuation of the tolls. This is especially likely if the CBBT is able to defease its bonds by 2010, instead of by 2025 as scheduled. Second, the need to construct parallel tunnels and other future capital requirements (such as replacement of the original trestles and bridges) is clearly beyond the financial capability of VDOT. On the other hand, the district has proven its ability to operate and maintain the facility, and to fund necessary capital projects with toll revenues and bonded debt. In short, transferring the Chesapeake Bay Bridge-Tunnel to VDOT is a solution without a problem.
Therefore, the district and commission should be retained to operate and maintain the facility in perpetuity. After parallel tunnels have been built and the associated debt retired, minimal “maintenance tolls” should be retained for all vehicle classes to cover the costs for operations, maintenance, and future capital improvements, such as the replacement of aging bridge structures.
Recommendation (22). The Virginia General Assembly may wish to repeal Chapter 714, §10 of the 1956 Acts of Assembly, which transfers the Chesapeake Bay Bridge-Tunnel to the State highway system upon retirement of all bonded debt. The General Assembly may also wish to amend the Acts of Assembly to authorize the Chesapeake Bay Bridge and Tunnel Commission to use tolls to fund operations, maintenance, and future capital improvements.

Page 97 Appendixes
Appendixes
Page
Appendix A: House Joint Resolution No. 210 (2002) …………………….. 99
Appendix B: Eastern Shore Employment Statistics …………………….. 101
Appendix C: Analysis of Traffic Variables …………………………………. 105
Appendix D: Principles for a Comprehensive Security Strategy ……. 113
Appendix E: Agency Responses ……………………………………………….. 115

Page 98 Appendixes

Page 99 Appendix A
Appendix A
HOUSE JOINT RESOLUTION NO. 210
2002 Session
Requesting the Joint Legislative Audit and Review Commission to study the future of the Chesapeake Bay Bridge Tunnel.
WHEREAS, only 67 million commercial and passenger vehicles have crossed the 17.6-mile-long Chesapeake Bay Bridge-Tunnel (CBBT) complex since it opened in 1964; and
WHEREAS, the Chesapeake Bay Bridge and Tunnel Commission operates the CBBT, which spans the Chesapeake Bay at the entrance to Hampton Roads; and
WHEREAS, the CBBT was created to be a mighty stimulus to economic growth and development by connecting the Eastern Shore of Virginia to the metropolitan complex of Hampton Roads; and
WHEREAS, the CBBT is a vital commercial link for the Hampton Roads area and the entire Commonwealth; and
WHEREAS, current traffic over the CBBT has reached only the level originally projected to be reached in 1977; and
WHEREAS, failure to reach traffic projections caused the CBBT by 1976 to hold the dubious distinction of having the largest municipal bond default in the United States; and
WHEREAS, the current rate of traffic increase is approximately three percent per year; and
WHEREAS, the CBBT has the highest toll per mile of any facility in the nation; and
WHEREAS, there is an initiative to reduce the tolls on the CBBT; and
WHEREAS, there is opposition to any toll reductions primarily among Eastern Shore residents who fear that such reductions may lead to an increase in demand for services, strain on infrastructure support, damage to natural resources, and a change in the quality of life on the Eastern Shore; and
WHEREAS, there have been several recent studies that address the issues of CBBT tolls, commerce, and economic growth on the Eastern Shore; and
WHEREAS, it is appropriate for the General Assembly to examine the findings of these studies in order to determine what if any changes should be made by the

Page 100 Appendix A
Commonwealth in order for this vital commercial link to best serve the needs of all Virginia citizens; and
WHEREAS, it is also appropriate for the General Assembly to study the management policies, practices, and operations (e.g. procurement, employment and hiring, salary structure, police and security force manning) of the CBBT Commission since it was created by an Act of the General Assembly but never subjected to review by that body; now, therefore, be it
RESOLVED by the House of Delegates, the Senate concurring, That the Joint Legislative Audit and Review Commission be requested to study the future of the Chesapeake Bay Bridge Tunnel.
In conducting its study, the Joint Legislative Audit and Review Commission shall examine the findings of all recent studies relative to the Chesapeake Bay Bridge and Tunnel and issue recommendations regarding the appropriate state role in determining the future of the CBBT. In its examination, the Commission shall pay attention to the:
1. Appropriate role for the CBBT in the economic growth and development generally in the Commonwealth and especially on the Eastern Shore;
2. Appropriate toll structure to ensure proper maintenance, sustain CBBT operations, meet debt obligations, and plan for needed capital improvements; and
3. Efficiency and efficacy of overall Commission management policy, practices, salary structure, and operations.
All agencies of the Commonwealth shall provide assistance to the Joint Legislative Audit and Review Commission for this study, upon request.
The Joint Legislative Audit and Review Commission shall complete its work by November 30, 2002, and shall submit its written findings and recommendations to the Governor and the 2003 Session of the General Assembly as provided in the procedures of the Division of Legislative Automated Systems for the processing of legislative documents.

Page 101 Appendix B
Appendix B
Eastern Shore Employment Statistics
Total Eastern Shore Employment 1960 to 1970 Accomack County Northampton County
Year Employment Annual Change Employment Annual Change 1960 9,407 5,681 1961 9,523 1.2 % 5,904 3.9 % 1962 9,445 -0.8 5,736 -2.8 1963 9,708 2.8 5,589 -2.6 1964 9,819 1.1 5,572 -0.3 1965 9,932 1.2 5,334 -4.3 1966 9,875 -0.6 5,671 6.3 1967 9,831 -0.4 5,495 -3.1 1968 10,198 3.7 5,188 -5.6 1969 10,369 1.7 5,202 0.3 1970 10,418 0.5 5,285 1.6
Source: JLARC staff analysis of VEC data.
Eastern Shore Manufacturing Employment 1960 to 1970 Accomack County Northampton County
Year Employment
Share of Total
Employment Annual Change Employment
Share of Total
Employment Annual Change
1950 1,233 12.1 1,039 15.1 1960 1,246 13.2 1.1 817 14.4 -21.4 1970 1,734 16.6 39.2 757 14.3 -7.3 10-Year Change
40.6 -27.1
Source: JLARC staff analysis of Virginia Employment Commission data.
Eastern Shore Wholesale and Retail Trade 1960 to 1970 Accomack County Northampton County
Year Employment
Share of Total
Employment Annual Change Employment
Share of Total
Employment Annual Change
1950 1,031 10.1 716 10.4 1960 928 9.9 -10.0 521 9.2 -27.2 1970 1,233 11.8 32.9 713 13.5 36.9 10-Year Change
19.6 -0.4
Source: JLARC staff analysis of Virginia Employment Commission data.

Page 102 Appendix B
Eastern Shore Finance, Insurance, Real Estate and Services Employment 1960 to 1970 Accomack County Northampton County
Year Employment
Share of Total
Employment Annual Change Employment
Share of Total
Employment Annual Change
1950 472 4.6 295 4.3 1960 479 5.1 1.5 426 7.5 44.4 1970 780 7.5 62.8 649 12.3 52.3 10-Year Change
65.3 120.0
Source: JLARC staff analysis of Virginia Employment Commission data.
Eastern Shore Agricultural Employment 1960 to 1970 Accomack County Northampton County
Year Employment
Share of Total
Employment Annual Change Employment
Share of Total
Employment Annual Change
1950 3,263 32.1 2,205 32.0 1960 2,780 29.6 -14.8 1,920 33.8 -12.9 1970 2,137 20.5 -23.1 1,420 26.9 -26.0 10-Year Change
-34.5 -35.6
Source: JLARC staff analysis of Virginia Employment Commission data.
Eastern Shore Government Employment 1950 to 1970 Accomack County Northampton County
Year Employment
Share of Total
Employment Annual Change Employment
Share of Total
Employment Annual Change
1950 1,175 11.6 285 4.1 1960 1,056 11.2 -10.1 443 7.8 55.4 1970 1,665 16.0 57.5 545 10.3 23.0 10-Year Change
41.7 91.2
Source: JLARC staff analysis of Virginia Employment Commission data.

Page 103 Appendix B
Eastern Shore Government Employment 1960 to 1970 Accomack County Northampton County
Year Employment Annual Change Employment Annual Change 1960 1,056 443 1961 1,111 5.2% 443 0.0 % 1962 1,176 5.9% 449 1.4 1963 1,250 6.3% 448 -0.2 1964 1,334 6.7% 452 0.9 1965 1,402 5.1% 472 4.4 1966 1,398 -0.3% 486 3.0 1967 1,523 8.9% 534 9.9 1968 1,597 4.9% 527 -1.3 1969 1,584 -0.8% 523 -0.8 1970 1,665 5.1% 545 4.2 Source: JLARC staff analysis of VEC data.

Page 104 Appendix B

Page 105 Appendix C
Appendix C
Analysis of Traffic Model Variables
The traffic projections produced for the this study were based on a series of regression models and other estimation techniques. The models provide an explanation for the seasonal and long term trends in the observed traffic data. Once the historical set of relationships is measured by the regression model, they can be used to project future traffic volumes. Regression models were used to project the traffic for seven of 16 vehicle classes or subclasses. For vehicle classes in which a regression model could not be used, the mean trend for the most recent period was used. The table below identifies the projection method used for each vehicle class or subclass. The table also identifies the regression model used, and a summary of each of the seven regression models is reproduced on the following seven pages. For vehicle classes projected using a non-regression method, the actual annual value used is shown in the table.
Projection Methods for Chesapeake Bay Bridge-Tunnel Traffic
Vehicle Class Projection Method
Class 1 Regression Model (CARS_02)Class 65 Fraction of Class 1 vehicles (~ 14.9%)Class 2 Regression Model (CARS_3)Class 3 Mean of last 10 years: 1992:06 – 2002:06 (17,676)Class 4 Mean of last 10 years: 1992:06 – 2002:06 (276)Class 8 Mean of last 21 months: 2000:10 – 2002:06 (1,104)Class 9 Regression Model (TRUCK_2)Class 10 Regression Model (TRUCK_3)Class 11 Regression Model (TRUCK_4)Class 12 Regression Model (TRUCK_5)Class 13 Mean of last 150 months: 1990:01 – 2002:06 (2,832)Class 14 Mean of last 21 months: 2000:10 – 2002:06 (576)Class 15 Regression Model (BUS_3)Class 16 Mean of last 38 months: 1999:04 – 2002:06 (420)Class 16E Mean of last 38 months: 1999:04 – 2002:06 (444)Non-revenue Annual Average from 1999 to 2002 (85,044)
.

Page 106 Appendix C

Page 107 Appendix C

Page 108 Appendix C

Page 109 Appendix C
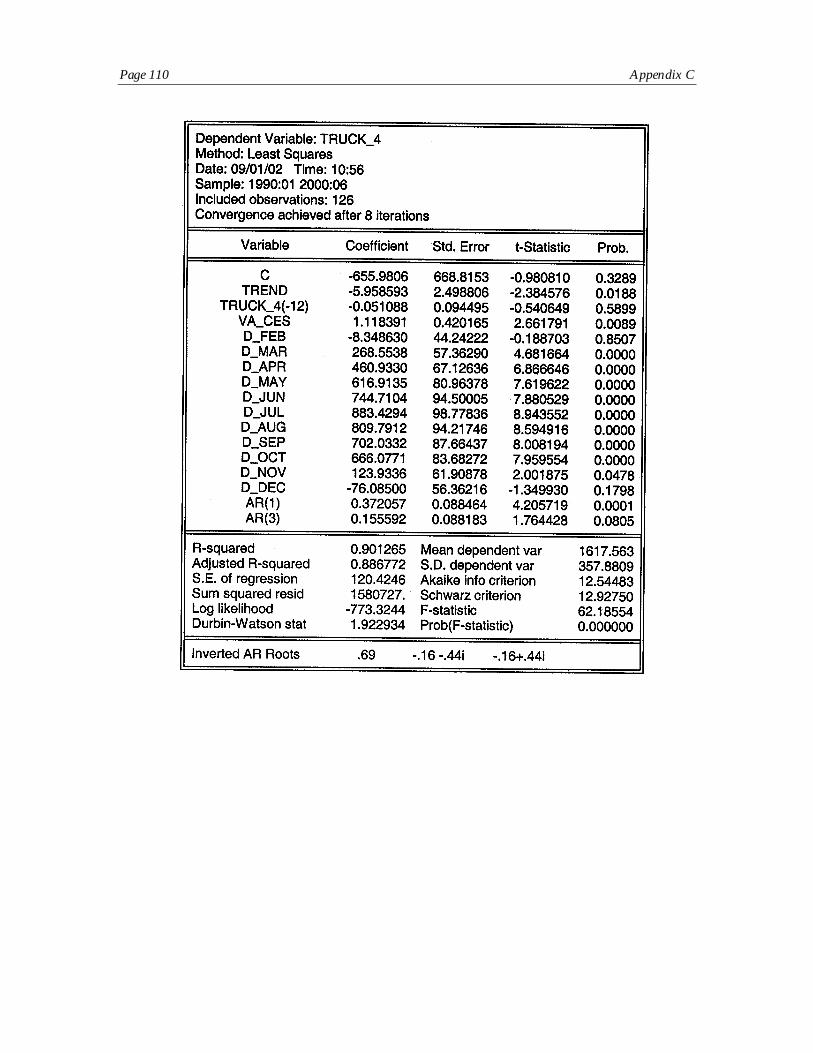
Page 110 Appendix C

Page 111 Appendix C

Page 112 Appendix C

Page 113 Appendix D
Appendix D
Principles for a Comprehensive Security Strategy
Principles for Conducting a Risk Assessment
1. A knowledgeable team should be assigned the responsibility of conducting the risk assessment.
2. A formal and comprehensive assessment plan should be developed.
3. Critical assets should be identified and documented using a systematicmethod.
4. Credible threat information should be actively pursued.
5. The vulnerability of critical assets should be systematically analyzed.
6. A systematic method should be used to estimate the impact of an attack oncritical assets.
7. A systematic method should be used to assess the overall risk level of criticalassets.
8. Risks should be reassessed whenever there are significant changes to the transportation system or its environment.
Principles for Developing and Maintaining Countermeasures
9. Countermeasures should be selected using a systematic process that isdriven by the results of a risk assessment.
10. The performance and cost of countermeasures should be tracked.
11. Countermeasures should be reviewed on a regular basis.
12. Countermeasures should be responsive to threat levels.
13. Awareness training should be included in a facility's security efforts.
14. Countermeasures should be integrated into security operational plans.
15. The facility should host regularly scheduled security meetings.

Page 114 Appendix D
Principles for Emergency Response
16. A qualified team of individuals should be formed to create an emergency response plan
17. The emergency response plan should be comprehensive and in compliance with all regulatory requirements.
18. The emergency response plan should be practiced regularly.
19. The emergency response plan should be reviewed and updated regularly and after each use.
20. A multi-modal communications system should be established.
Source: Principles for a Comprehensive Security Strategy, An Evaluation Guide for the Transportation Industry. State of Louisiana Legislative Auditor.

Page 115 Appendix E
Appendix E
Agency Responses
As part of an extensive data validation process, the major entities involved in a JLARC review are given an opportunity to comment on an exposure draft of the report. Appropriate technical corrections resulting from the oral and written comments have been made in this revision of the report. This appendix contains the written response of the Chesapeake Bay Bridge and Tunnel District.

Page 116 Appendix E


JLARC Staff
DIRECTOR: PHILIP A. LEONE DIVISION I CHIEF: GLEN S. TITTERMARY DEPUTY DIRECTOR: R. KIRK JONAS DIVISION II CHIEF: ROBERT B. ROTZ
SECTION MANAGERS: PATRICIA S. BISHOP, FISCAL AND ADMINISTRATIVE SERVICES JOHN W. LONG, PUBLICATIONS AND GRAPHICS GREGORY J. REST, RESEARCH METHODS
PROJECT TEAM LEADERS: KELLY B. GENT ERIC H. MESSICK LINDA B. FORD KIMBERLY A. SARTE HAROLD E. GREER, III
PROJECT TEAM STAFF: ARIS W. BEARSE TRACEY R. SMITH WENDY N. BROWN LAURA C. WHITELEY ASHLEY S. COLVIN CHRISTINE D. WOLFE GERALD A. CRAVER SANDRA S. WRIGHT JASON W. POWELL
FISCAL ANALYSIS SECTION: WALTER L. SMILEY, SECTION MANAGER KIMBERLY A. SARTE
ADMINISTRATIVE AND RESEARCH SUPPORT STAFF: JOAN M. IRBY ELLEN JACKSON, INTERN
BETSY M. JACKSON WENDY THOMAS, INTERN
PAULA C. LAMBERT
BECKY C. TORRENCE
FORMER JLARC STAFF WHO CONTRIBUTED TO THIS STUDY: DANIEL C. ONEY
Indicates JLARC staff with primary assignment to this project
Recent JLARC Reports
Structure of Virginia’s Natural Resources Secretariat, January 1998Special Report: Status of Automation Initiatives of the Department of Social Services, February 1998Review of the Virginia Fair Housing Office, February 1998Review of the Department of Conservation and Recreation, February 1998State Oversight of Commercial Driver-Training Schools in Virginia, September 1998The Feasibility of Converting Camp Pendleton to a State Park, November 1998Review of the Use of Consultants by the Virginia Department of Transportation, November 1998Review of the State Board of Elections, December 1998Review of the Virginia Department for the Aging, January 1999Review of Regional Criminal Justice Training Academies, January 1999Interim Report: Review of the Health Regulatory Boards, January 1999Interim Report: Review of the Functional Area of Health and Human Resources, January 1999Virginia’s Welfare Reform Initiative: Implementation and Participant Outcomes, January 1999Legislator’s Guide to the Virginia Retirement System, 2nd Edition, May 1999VRS Oversight Report No. 12: Semi-Annual VRS Investment Report, July 1999Preliminary Inquiry, DEQ and VDH Activities to Identify Water Toxic Problems and Inform the Public, July 1999Final Report: Review of the Health Regulatory Boards, August 1999Competitive Procurement of State Printing Contracts, September 1999Review of Undergraduate Student Financial Aid in Virginia’s Public Institutions, October 1999Review of Air Medevac Services in Virginia, October 1999Alternatives to Stabilize Regional Criminal Justice Training Academy Membership, November 1999Review of the Statewide Human Services Information and Referral Program in Virginia, November 1999The Impact of Digital TV on Public Broadcasting in Virginia, November 1999Review of the Impact of State-Owned Ports on Local Governments, December 1999Review of the Use of Grievance Hearing Officers, December 1999Review of the Performance and Management of the Virginia Department of Health, January 2000Virginia’s Medicaid Reimbursement to Nursing Facilities, January 2000Interim Report: Review of the Virginia Housing Development Authority, January 2000Interim Report: Child Support Enforcement, January 2000Interim Special Report: Revolutionary War Veteran Gravesites in Virginia, February 2000Final Report: Review of the Virginia Housing Development Authority, August 2000Technical Status Report: An Overview of Expenditure Forecasting in Four Major State Programs, August 2000Virginia’s Welfare Reform Initiative: Follow-Up of Participant Outcomes, October 2000Final Report: Child Support Enforcement, November 2000Technical Report: The Cost of Raising Children, November 2000Review of the Medicaid Inpatient Hospital Reimbursement System, December 2000Special Inquiry: A Review of Child Support Enforcement and the Judicial Process, December 2000Review of the Virginia Distribution Center, January 2001Review of Construction Costs and Time Schedules for Virginia Highway Projects, January 2001Review of RMA and Powhite Parkway Extension Toll Facility Operations, January 2001Review of VDOT’s Administration of the Interstate Asset Management Contract, January 2001Review of Elementary and Secondary School Funding: Interim Status Report, January 2001Special Report: Preservation of Revolutionary War Veteran Gravesites in Virginia, February 2001Indigent Participation in Medical Research at Virginia’s Medical Schools, July 2001Review of State Aid to Public Libraries, July 20012001 Report to the General Assembly, October 2001Review of the Virginia Small Business Development Center Program, December 2001Equity and Efficiency of Highway Construction and Transit Funding, December 2001Adequacy and Management of VDOT’s Highway Maintenance Program, December 2001Review of Virginia’s System of Capital Punishment, January 2002Interim Report: Review of State Spending, January 2002Review of Selected Programs in the Department of Medical Assistance Services, January 2002Review of Secondary and Elementary School Funding, February 2002Review of State Spending: June 2002 UpdateVRS Oversight Report No. 18: VRS Biennial Status and Semi-Annual Investment Report, July 2002The Future of the Chesapeake Bay Bridge-Tunnel, January 2003
JLARC Home Page: http://jlarc.state.va.us


JLARC Suite 1100
General Assembly BuildingCapitol Square
Richmond, Virginia 23219(804) 786-1258 Fax: 371-0101
http://jlarc.state.va.us