the geographical information system (gis) use on
TRANSCRIPT

Vol. 6(4), pp. 159-176, April, 2014 DOI: 10.5897/JDAE12.164 Article Number: CB5FC8246832 ISSN 2006-9774 Copyright © 2014 Author(s) retain the copyright of this article http://www.academicjournals.org/JDAE
Journal of Development and Agricultural
Economics
Full Length Research Paper
The geographical information system (GIS) use on development of genetically engineered plants: The
world perspective and the USA enterprise (1997 to 2003)
Joyce Gosata Maphanyane
Department of Environmental Science, University of Botswana, Private Bag UB00704, Gaborone, Botswana.
Received 30 November, 2012; Accepted 5 February 2014
The world population will hit the nine billion mark by 2050. Environmentally sustainable agriculture developed in a way that safeguarded the Earth and still could feed all nations is needed. All things being considered, the fact remains that the entire species on Earth share a single interconnected ecosystem. Finding acceptable solutions for the environmental and natural resource management problems and at the same time curbing hunger is the goal. But, it requires analysis of many environmental issues done from cross-cultural, multinational, multidisciplinary, combinations of methods and comparative perspective. It is within this view that a development, analysis and discussion is made on the thorny but highly interesting subject of genetically engineered plants (GEP). It employed data search and literature perusal that helped in the interrogation of GEP world perspective. The geographical information system (GIS) analysis and mapping of the development of genetically modified organisms (GMOs) in USA from 1987 to 2003 was made. The results were suggestions on how knowledge on GMOs could better disseminated for informed worldwide view and curb scepticism based on fears of GMOs perceived risks of impacts which might be imposed on the environment. GMOs started in 1992 and today, USA has taken the lead in 45 States. The same crops planted with modern technology are still grown in areas designated by the Native Americans who used primitive methods that were totally dependent on the natural climatic conditions. Key words: Dominant social paradigm (DSP), anthropocentric, unsustainable resource use, the new environmental paradigm (NEP), NEO-Luddites, Brownlash view, Lomborg school of thought, genetically engineered plants, biotechnology, genetic engineering, genetically modified organisms (GMOs), geographical information systems (GIS), traditional ecological knowledge (TEK). ....
INTRODUCTION Biotechnology is a term used to incorporate many and varied biological discoveries for the development of
industrial processes and the creation of useful organisms and their products. These include the production of foods
E-mail: [email protected], [email protected], Tel: +267 355 2516, +26771220526, +26772878098, +26773499399, +26774146150. Fax: +267 355 2908. Author(s) agree that this article remain permanently open access under the terms of the Creative Commons Attribution License 4.0 International License

160 J. Dev. Agric. Econ. and medicines, the reduction of wastes and the creation of renewable energy sources. All living things are made of tiny 'building blocks' called cells. Each cell contains inherited genetic recipes (genes). A gene is made of a length of Deoxyribonucleic acid (DNA) that has a message encoded in its chemical structure. Genes are the instructions that give organisms their characteristics. Although, the chemicals in DNA are the same for every living organism, the ordering or sequence of the chemicals varies and it is this variation that determines a plant's, animal's or an organism's physical make-up and features. Changes can be made to an organism by changing the sequence; turning off certain genes; or inserting new sequences (a whole gene). The terms genetic engineering (ge), or genetic modification (gm), or gene technology (gt) and/or genetic manipulation all refer to the transferring of single genes between differing plants and animals, or removing a gene from its original position and placing it into a new position in the same organism. The objective and statement of the problem Genetically modified organisms (GMOs) issue is difficult to comprehend by ordinary people; but yet poses a greater challenge to all the citizens of mother Earth. This is because it defied the fundamental fabric on which the mere existence of the entire planet hinges upon; more especially the ecosystems and biodiversity. This is why it had brought about a lot of inconsistent viewpoint. However, as a new scientific endeavour, it needed to be given a chance and this study attempt to do just that. The study analysed, weighted, compared and contrasted GMOs advantages and disadvantages from views coming from different sectors of life, more especially from agriculture. Then, better informed decision could be made about its safety or riskiness.
The aim of this study was three folds. First, it had put forward cross-cultural, multinational, multidisciplinary, combinations of methods and comparative perspective that tackled such a highly scientific, socially challenged complex issue which touched on all aspects of life. Data was collected by various methods that included telephone interviews whenever quick clarification was needed, perusal of written records, surfing the internet and web. The modern technology of geographical information system (GIS) was applied in assimilating and collating the data into digital database format. Then, the database was interrogated; assessed, analysed. The results were used to map the development of genetically engineered plants (GEPs) from 1987 to 2003. These maps were then used as assessment tools of the extent for GEPs’ worldwide land cover/land use.
Second, this study highlighted the concerns about GEPs environmental and human health risks, which might be generated by embracing such a highly complex scientific endeavours without the fundamental knowledge and necessary infrastructure for its safe use. And third,
mitigation procedures put in place by countries in order to minimise such risks was surveyed. The major concerns included lack of laws and insufficient security measures as effective GMOs risks monitoring tools. Also, the reactions by the United Nations (UN) on GEPs through its Food and Agricultural Organization (FAO) branch are alluded to (FOA - Economic and Social Development Department, 1995), (UNCED, 1992), (African Centre for Biosafety, 2012). Background information
Throughout the Human Political and Economic Eras, from the Stone Age to the hunter’s gatherers, through to the primitive farming communities and the Industrial Revolution mankind have been imprudently exploiting the natural resources for their own survival. Towards the end of the last of these first three eras, the Industrial Revolution, the notion was that there was an abundance of resources, and if there was any problem, science will fix it and more discoveries will be made. This dominant social paradigm (DSP) (Kilbourne and Polonsky, 2005), the anthropocentric believe that environmental policy and natural resources management practices ought to be directed towards the production of goods and services to benefit humans has long died off. But, this was not until after a substantial amount of damage had been done. The deterioration of marine fisheries caused by over-fishing was a consequence of population explosion with people needing land to live on and an increased amount of food to feed on. The consequences of these developments were diminishing riparian, seaside and coastal habitats as more and more of these lands were adapted into settlements and bigger nets were being thrown into the waters with increased frequency to catch more fish for food. The nongovernmental organizations (NGO) cries of “save the whales” were echoed from every corner of the planet, in the early 1980s by the Green Peace Movement. Today, the global nature of these threats to the environment is well understood.
The notion of sustainable resource use has taken off as a result of international, national and local scientists having taken the lead. Their endeavours at large are showing that, for the two centuries since the start of the Industrial Revolution, the human population has increased six-fold and economic activity is estimated to have exploded by fifty-fold. Consequently, this had resulted in increased carbon dioxide levels in the atmosphere, which has led to the green house effect. This had damaged the ozone layer and given rise to global warming, which in turn had caused the temperature to rise by about 0.10 to 0.60°C.
The significance of the anxiety about the deteriorating state of the Earth, and the agency to curb its continuing spread is reflected in various United Nations protocols (UN, 1972, 1992, 2002, 2007) and (UNFCCC, 2009) and these are also reflected in world list of protected areas
(Chape, Blyth, Fish, Fox, and Spalding, 2003). The United Nations has relentlessly made calls for sustainable development, environmental protection and the safeguarding of biodiversity and animal habitats. The major concern was the stand of GMO technology in all these. The present Era, the Information Age, had seen the growth of public awareness on the impact mankind was exerting on the environment and interrelationship between the human health, wellbeing, and the world around them. Pressure groups, many environmental lobbyists (African Centre for Biosafety, 2012), and individuals (Cahn, 1995; Van DeVeer and Pierce, 1994; Nap et al., 2003; Vig and Kraft, 2010; Vaughn, 2012), have called for better environmental and conservation laws and policies. They were at loggerheads with the producers and manufacturers who saw these changes as a threat to their companies’ sustainability and valuable profits.
This new environmental paradigm (NEP) (Dunlap, 2008) was a new outlook that comprised such concepts as environmental protection, limits to consumption and economic growth, and a more sceptical view of science and technology. Hence, it was well understood that science is not “Ms Fix It” as it was once thought. So, a lot of questions have been asked when the GMO technology came about many of which not favourable to that course of action. And there have been doubts about it.
However, this study was to the belief that extreme care needed to be taken whenever such ground breaking discoveries like GMO. This is because science is “a two sharp sided needle, which can saw a garment and pierce the tailor’s finger at the same time”. Scientific knowledge often led to general societal progress, but human reason should be the ultimate standard of right and wrong. Of course, scientists must be free to follow the laws of reason in open society, logically ordered objective reality that people came to know about throughout the ages.
Also, this study understood that the scientists needed to include others in their endevours. For example, the traditional ecological knowledge (TEK) which shared much in common with scientific knowledge; although, it was more often than not considered unscientific. This study supported Donovan and Puri’s notion that TEK had been developed on a trial and error basis, a form of hypothesis testing. This communiqué went on to say that although, TEK was not recorded and published, it had nevertheless been transferred by traditional multidimensional methods from one generation to the next (Donovan and Puri, 2004). So, the GMOs science needed to respects traditional knowledge, intuition, spirituality, the senses, human relationships, the work of the hand, the disorderly and unpredictable nature of reality as opposed to mechanistic or refluctionist construct of the world. An all-encompassing science could dispel some of the mistrusts levelled against some of the discoveries such as the GMO technology.
It was known that in rear occasions, personal feelings had influenced the problems scientists chose to make the subject of their study and what conclusion they drew. But, this was not enough reason to view scientific discoveries
Maphanyane 161 as little more than a clever means used to reinforce the authority of powerful’ men and women; or being a NEO-Luddites. People should not fear changes, which comes with the new technology. So, GMOs must be taken with open mind, not only as an endevour that benefits large companies. In view of the arguments which were going on about GMOs, it was wrong for people to take brownlash view, the thinking that most scientist research concerning the environment was badly biased and inclined to overstate risks. It was also wrong as well for those who took the Lomborg school of thought, this was to the contrary; science was not used mainly for destructive purposes like high technology, nuclear power, powerful pesticides and fungicides, leading to the believe that GMOs posed serious threat to health and environment. It was in view of all these notions that this study was carried out. The proposed approach or solution
Biotechnology is not a brand new enterprise; it has long being used by the forefathers in many ways, like traditional fermentation techniques which has been employed for decades in bread, making cheese and beer brewing. It has also been the basis of traditional animal and plant breeding techniques.
For instance hybridisation and the selection of plants and animals with specific characteristics to create, for example, crops which produce higher yields of grain and in animal husbandry, use of artificial insemination to produce best beef animals like the Brahman bull or best dairy animal like the Friesland Cow. What was new about biotechnology today was that researchers had taken a single gene from a plant or animal cell and inserted it in another plant or animal cell that gave the recipients desired characteristic, such as being repellent to specific and targeted insect pests for example the Coleoteran or Lepidopteran resistant, or Glyphosate tolerant plants; herbicides like Imidazolinone tolerant, or Phosphinothrin tolerant or Isoxazole.
These are: tolerant plants; environmental stress as well as quality traits such as improved post harvest storage; flavour such as yield increased; fertility altered, development altered and germination increased, drought tolerant; seed quality altered, cold tolerant; altered amino acid composition; protein altered; maturity altered; senescence altered, male sterile or increased stem strength; nutritional content such as tryptophan level increased; oil profile altered; yield altered, yield increased, phytote reduced; starch metabolism altered, lysine level increased; carbonhydrate metabolism altered, animal feed quality improved; nitrogen metabolism altered, seed size increased or fumonisin degradation, and colour change such as visual marker or kanamycin resistant.
Biotechnology could also be employed to manufacture industrial as well as pharmaceutical compounds as renewable resources with a production system based on solar energy. Examples of those are Anthocyarin
162 J. Dev. Agric. Econ. production seed, gene expression altered, pharmaceutical proteins produced, novel protein produced, industrial enzyme production, recombinase produced, transposon, coloured sectors in leaves, transposon inserted, seed colour altered, anthocyarin sequestration suppressed. Genetic engineering, or gene technology, has revolutionized agriculture, food technology, medicine and environmental management. Its aim was to make a living thing perform a specific useful task. This could be to fight disease, produce more food, or simply to make a flower blue.
Gene technology enables scientists to produce varieties of plants and animals with desirable characteristics in more precise and efficient ways than are possible using conventional breeding techniques. This is because genetic engineering allows the identification of genes, which give organism particular characteristics and transfer these genes into a different living thing. An added characteristic of gene technology is that it allows genes to be transferred between species, something that occurs only rarely in nature. The ability to transfer genes between species means that scientists can select from a larger number of genes for desired characteristics than is possible using traditional breeding.
There are many questions and concerns surrounding biotechnology. In order to find solutions, this study will take an approach of discussing possible answers to the following thirteen questions, in four subcategories that hold particular interest for this paper: Who are the main producers of GMOs, where are they produced, since when and for how long have they been in the market? a) How GEP is planted, by whom, where, when and how much? b) Which are the major GMOs crops of the world? Are there sufficient rules governing the production of GMOs and how effective are those in safeguarding from the risks? a) Are companies subject to any penalties if they break rules governing GMOs? b) Does the fact that genetically modified crops are owned by multinationals mean that these international agribusiness companies could eventually gain total control of the rights of seeds which are the national traditional ecological knowledge and what local farmers stood for generations; providing food for their families? c) Are the productions of GMOs humanitarian driven to alleviate hunger in Africa as the popular media advocates for or are they driven by the economic desire of the international mega agribusiness companies who are eager to take advantage of the Globalisation and monopolise the now worldwide expansion of economic markets?
d) What are the major risks in placing animal genes in plants and vice versa? Are genetically modified (GM) foods safe? a) Can genetically modified foods cause allergies in some people? b) Can genetically modified organisms escape into the environment? c) Who is responsible for regulating GMOs? d) What is the approval process that food companies or agribusiness firms must follow to get GM food products onto the market?
Are the genetically engineered plants grown in the same regions as was followed by the Native American of long time ago?
a) Are the genetically engineered plants grown in the same regions as was followed by the Native American of long time ago? b) Are the crops of cotton, rapeseed, and cotton, planted with modern technology still grown in areas designated by the Native Americans who the primitive methods and followed the natural climatic conditions? c) Suggest the reason for the answer?
MATERIALS AND METHODS The materials and methods for this study were divided into four parts: a) The first part was on data collection which was fundamental to the study information, b) The second part was to analyse these information into three segments. One segment was to answer the worldwide twelve questions listed above. The other two segments are in the form of table. One table was specifically created as the attribute information on the GMOs development and production in the world perspective. The four mostly produced GMOs crops were worked out. And the second table dealt with the USA four mostly produced GEPs, c) The third part was to use the attribute tables above to produce the USA land use/land cover change maps for the four GMOs crops from 1997 to 2003 with GIS applications, d) The fourth part was to apply statistical procedures for the assessment of whether in the USA, there was a significant shift in the areas where particular crops were planted using primitive native America methods to where these crops are grown now with the use of modern biotechnology methods.
Data collection and its analysis First and foremost, data on GMOs was collected. The methods used were data which came from various sources which included written records perusal, internet and web surfing, archival maps and telephone interviews for quick on the sport clarification. The data collection and its analysis was a mammoth task as the researcher had to do an extensive work on reading, data translation and interpretation. That was a challenge indeed as the sheer volume of information on GMOs was just overwhelming. Most of the information for the USA came from the Field Test Releases database: Http://www.isb.vt.edu/, (ISB, 2010). The database for USA

and International Field Tests of GMOs, information system for biotechnology, A National Resource in Agbiotech Information was useful. For other countries, data was sourced from the then current status of transgenic plants and from the latest GMO web news releases (ISAAA, 1991; EC, 2012). Data processing for GMOs crop prevalence and their area of coverage The second step was to sort out this data into dates and then categorized it into divisions by continents, regions, countries, states and counties or districts. Then, the main part came; the data was processed into information by reading and further categorizing it into units of questions the information might answer. At the end, there were three segments created. One segment was on answers to the extent to which biotechnology has developed; the issues on of GM foods; and information about the main producers of GMOs, where they produced, since when and for how long they have been in the market. The two segments were two attribute tables’ one on the world GMOs and the other on the USA GMOs and its developments in different states. The GIS applications and analytical map creation The technique of GIS was used in creating a database attribute files. These were then transformed into a GIS by building topology whereby the two attribute tables were linked to the topographical map of the world and that of USA, respectively. Maps showed trends in the fast growing development of the GMOs technology for the world perspective and for the land use/land cover change (LULCC) for the USA were created for four crops and using five traits. These maps were then used as analytic tools for the interpretation to the development of the GEPs from 1987 to 2003. The data was enhanced into information that could be used for better management of the resources. These maps were used directly as tools to make analysis of GMOs status and to give the results. Statistical procedures employed-land used for specific crops The Native Americans of long ago learned to interact with their environments in order to survive. For the most part, they adapted their ways of living to the geography around them instead of trying to change their surroundings to supply their needs, like it is done today. The Eastern woodlands supplied them with animals, fish, nuts and berries. The southwest was a mostly desert, with mountains and deep canyon. Native Americans could not rely on the few forests and animals available there. So, they raised crops; beans and corn for food and cotton to weave into clothing. In between the eastern woodlands and the desert southwest was the vast grassland of the Great Plains. Here, they relied on the buffalo for food, clothing and shelter. In the Pacific North West they relied on a number of resources.
Today, it is the information age, and GMOs on corn, soybeans, rapeseed and cotton are used. Irony, this study found out that these crops are still planted in the same places they had been grown by the Native Americans. Technology might have changed but the driving forces of climates, which determine which crops grow, were still the same.
The subjects used in this part of the study are the forty-five American states where GEPs are grown. The entire country was divided into its climatic regions, which are 1) Eastern Central (ENCen); 2) Mountains (Mtn), North Eastern (Neng), and Pacific (P); 3) South and Atlantic (Satl) and Western Central (WNCen). The amount of GEPs for each state was given for cotton, rapeseed, corn and soybeans. The GEP was taken as the response variable while
Maphanyane 163 the explanatory variables were the climatic regions, and the four plants of the cotton, the corn, the rapeseed and the soybeans.
The subjects were arranged into columns, first with the state name, then the GMFARMS totals, the climatic regions which are given numeric codes of 1, 2, and 3 as shown above and that was followed by the crops of the corn, cotton, soybeans and rapeseed column.
The question of interest to be answered here was: are the GEPs grown in the same regions as were followed by the Native American of long time ago to grow the same but natural processed crops? And that are the crops of Cotton, rapeseed, and cotton, planted with modern technology still grown in areas designated by the Native Americans who used the primitive methods and followed the natural climatic conditions?
The statistical procedures used were as follows:
i. First step is exploration using matrix of scatterplots; correlation matrix; residual plots after fitting tentative models: First, the cooks distance plot was used to see if any variable is greater than one. Then, the leverage plot was checked, this was followed by the Studentized residual plot and after that the cook’s distance plot was checked, ii. Second step is to employ graphics results and see if transformation is necessary and also if there are any Outliers: The case influence statistic was important because it helped to identify influential observations that may not be revealed graphically and it also divided the overall influence of an observation into what was unusual about its explanatory variable values and what was unusual about its response relative to the fitted model. The outliers were then eliminated. iii. Third step in the statistical procedures was the Extra Sum of Squares: This step was done in order to see if it was necessary to remove the influential variable and if there was any significance. iv. The summary of statistical findings is given: The overall significance of the interactive model is then checked. RESULTS This study found that biotechnology was a complex scientific endevour and many concerns from various angles have been raised about it. The most important fact was that it has revolutionalised agriculture forever and it has the potential to led society to progress by curbing hunger which is eminent given the population rate; it is a fact that more food will be needed. Despite that, some of the concerns given against it are not completely unfounded. One that concern is on food security; whether GMOs were just a ploy to place the patent to all the seeds of all the crops in the world in the hands of a few powerful’ men and women to reinforce their authority. Other concerns are based on human health and environmental wellness risks that might occur. This section tried to find answers to these through its rigorous research. The GMOs main actors and its development The first country to grow the genetically modified organisms (GMOs) was China, which began with one item, the tobacco in 1992; and went up to twelve items in 1999 (Table 1). By that time, the industrial countries grew 82% of the global GEPs by area and the 18% being grown

164 J. Dev. Agric. Econ.
Table 1. World GMOs Spectrum – 1992 to 1999.
S/NO Country/Continent
1992 to 1995 1996 1997 1998 1999 2000 2001 2002 2003
GMO crops soybeans, corn, cotton and canola
No of single items
1 China 1 6 9 12 % GMOs planted
2 Industrial 82 3 Developing 18 4 USA 72 5 Argentina 16 6 Canada 10 7 China 1 8 Australia 1 9 South Africa
10 Mexico 11 Spain 12 France 13 Portugal 14 Rumania 15 Ukraine
World in million hectares 16 1.7 11 27.8 39.9 17 World Economically the sales of GMOs in million US$ 18 84 347 1113 2300
in developing countries of Latin America, Asia and Africa. The main countries growing GEPs were USA, Argentina, Canada and China, they grew 99% of the world total by hectare and the remaining balance of GM crops was grown in eight countries: - Australia, South Africa, Mexico, Spain, France, Portugal, Rumania and Ukraine (Table 1 and Figure 1). There were three European Union (EU) countries growing the GM crops despite the continuing debate about GEP (EC, 2012).
According to ISAAA publications, the global acreage of the GEPs increased from 1.7 million hectares in 1996, to 39.9 million hectares in 1999 (Table 1). This was a substantial 23.5 fold increase in only four years (ISAAA, 1991). Soybean, corn, cotton and canola are the major GEPs on a global basis. In terms of traits; herbicide tolerance was the most prevalent at 71% in 1999, followed by insect resistance at 22%. In 1999, for the first time in the USA, stacked genes for insect tolerance and herbicide tolerance in both corn and cotton occupied 2.9 million hectares (Figures 3 and 4).
Economically the sales of GMOs had increased from US$84 million in 1995, with sales quadrupling in 1996 to US$347 million, tripling in 1997 to $1,113 million, and doubling in 1998 to reach US$2.3 billion (Table 1). In 1999, sales were estimated at US$3 billion (ISAAA, 1991). The GMOs development in the USA In 1986, the Co-ordinated Framework for Regulation
(CFR) of Biotechnology specified the Animal and Plant Health Inspection Service (APHIS) of the United States Department of Agriculture (USDA), the Environmental Protection Agency (EPA) and the Food and Drug Agency (FDA) were confirmed primary government agencies for regulating biotechnology in USA. Acquisitions of licences for GMOs are used as a measure for GMOs development. Although, China had an early start by 1997, USA was by far the world leader in GMOs. Soybeans, corn, cotton and rapeseed were the GEPs most planted. From 1989 about seventeen states acquired licences for planting soybeans with enhanced nutrition (Figure 2).
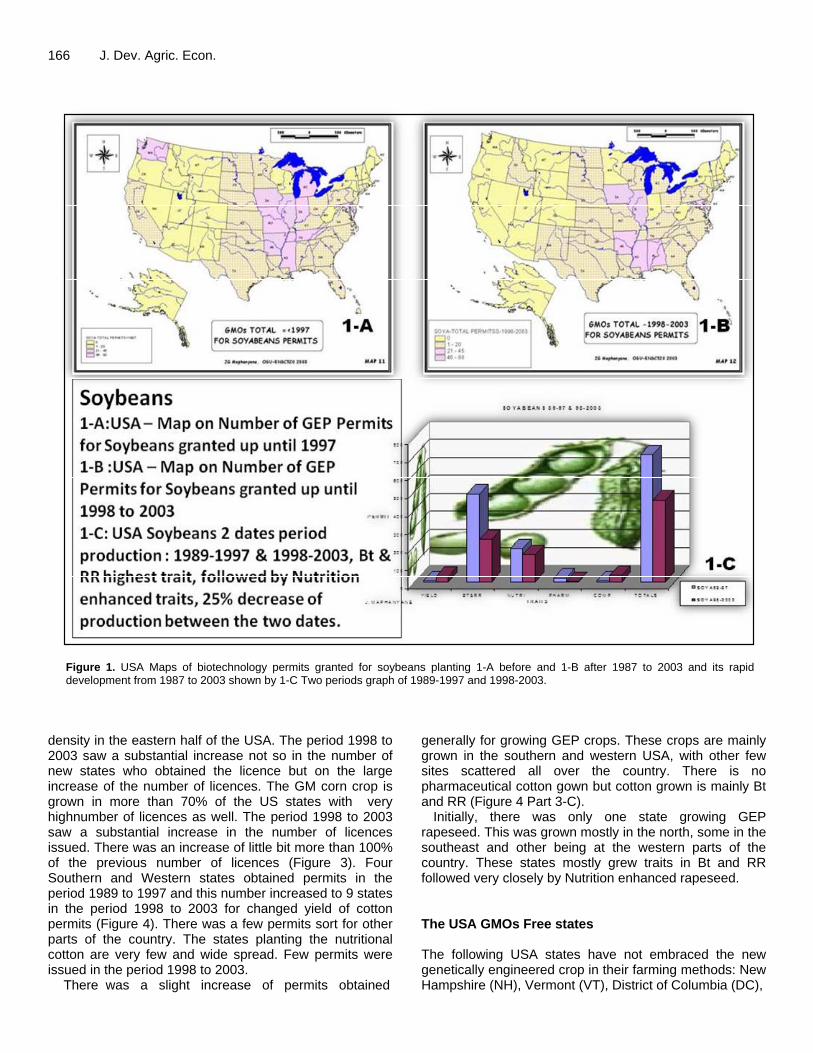
GMOs USA states and the technology development In the next period ranging from 1998 to 2003, almost the same number of permits was acquired mostly by the same states as before with only additional of 7 new states. Almost the whole eastern half of USA was growing GEP soybeans with enhanced nutrition. In the period ranging from 1989 to 1997 almost the whole 50% of the eastern USA, except 10 states at most obtained permission to grow the Bt and RR soybeans. The states of Washington and California in the Pacific Northwest also joined these ranks. In the period ranging from 1989 to 2003 almost 50% of the eastern states obtained permits to plant the Bt and RR Soybeans. In the period 1989 to 1998 only four states obtained permits for the complex and/or the complex soybeans traits (Figure 2 Part 1-C). In the period

Maphanyane 165
Figure 1. Map of the main leaders in biotechnology by 2003 and Graph showing its rapid development from 1987 to 2003.
1998 to 2003, there was a substantial increase in the licences obtained compared to the previous period, 12 states an almost in 75% increase that covered almost all the states in the eastern USA in the period 1989 to 1998. In the period 1989 to 1998, only one state obtained 10 permits for the Pharmaceutical soybeans. In the period 1998 to 2003, permits totalling 3 were obtained, this time for the Pharmaceutical soybeans. The number was four in the period 1989 to 1997 and this number increased to 8 states who obtained licences for changed yield soybeans. All these state are in the Central Eastern parts of the country. In the whole, more GEPs soybeans were grown in the period 1998 to 2003 than in 1998 to 2003. The most traits planted were Bt and RR followed by Nutrition trait (Figure 2).
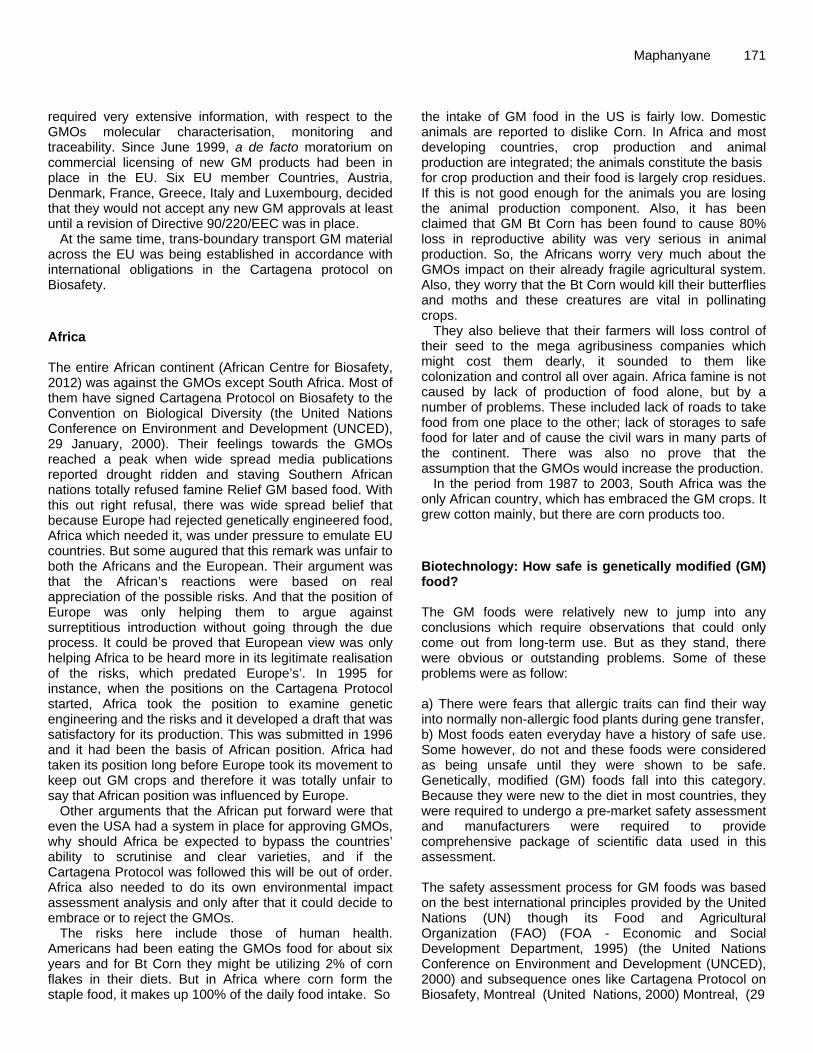
In the period 1989-1897, almost one quarter of the total country states grew corn with enhanced nutritional traits (Figure 3 Part 2-C). Most of it was grown in the eastern half of the USA. The period 1998 - 2003 saw a substantial
increase in the corn with these traits in the same region (Figure 3). In the period 1989 to 1997, all the central states had at least one pharmaceutical licence each, one state in the south and the two states of Pacific North West also obtained permits.
In the period 1989 to 1897, the eastern north quarter of the country were growing classified or complex corn traits, with two states, one in the south and the other in the Pacific North West joining their ranks. The period 1998 to 2003 saw a substantial dwindle in permits for these traits. In the period 1989 to 1897, the eastern north quarter of the country were growing corn with enhanced yield quality traits, with one state in the south and another one in the Pacific North West joining their ranks. The period 1998 - 2003 saw a substantial increase in the number of states producing such traits. Almost 75% of the country was affected.
The number of permits for corn trait of Bt and RR was very high, covering most of the country with the highest
166 J. Dev. Agric. Econ.
Figure 1. USA Maps of biotechnology permits granted for soybeans planting 1-A before and 1-B after 1987 to 2003 and its rapid development from 1987 to 2003 shown by 1-C Two periods graph of 1989-1997 and 1998-2003.
density in the eastern half of the USA. The period 1998 to 2003 saw a substantial increase not so in the number of new states who obtained the licence but on the large increase of the number of licences. The GM corn crop is grown in more than 70% of the US states with very highnumber of licences as well. The period 1998 to 2003 saw a substantial increase in the number of licences issued. There was an increase of little bit more than 100% of the previous number of licences (Figure 3). Four Southern and Western states obtained permits in the period 1989 to 1997 and this number increased to 9 states in the period 1998 to 2003 for changed yield of cotton permits (Figure 4). There was a few permits sort for other parts of the country. The states planting the nutritional cotton are very few and wide spread. Few permits were issued in the period 1998 to 2003.
There was a slight increase of permits obtained
generally for growing GEP crops. These crops are mainly grown in the southern and western USA, with other few sites scattered all over the country. There is no pharmaceutical cotton gown but cotton grown is mainly Bt and RR (Figure 4 Part 3-C).
Initially, there was only one state growing GEP rapeseed. This was grown mostly in the north, some in the southeast and other being at the western parts of the country. These states mostly grew traits in Bt and RR followed very closely by Nutrition enhanced rapeseed. The USA GMOs Free states The following USA states have not embraced the new genetically engineered crop in their farming methods: New Hampshire (NH), Vermont (VT), District of Columbia (DC),

Maphanyane 167
Figure 3. USA Maps of biotechnology permits granted for corn planting 2-A before and 2-B after 1987 to 2003 and its rapid development from 1987 to 2003 shown by 2-C Two periods graph of 1989-1997 and 1998-2003.
Massachusetts (MA), Utah (UT), West Virginia (WV), and Alaska (AK). AK is not farmable in any case, while DC is a City district where farming is limited any way, but NH, VT, MA, UT and WV are totally organic states (Figures 2, 3, 4 and 5). Comparison of Native American farmland with GMOs sites Today, using genetically engineered plants of corn, soybeans, rapeseed and cotton plant traits, they were still
planted in the same places where they had been planted by the Native Americans. It seemed, technology might have changed but the driving forces of climates, which determine which crops grow where. There is convincing evidence that, specific food crops planted depends on the climatic conditions of an area, this includes those using the modern day farming with the genetically engineered plants traits.
The results of the study giving are as follow (Figure 6, Tables 4 and 5): F-stats is 7.6734 and a p-value of 0.0000685 and 95% Confidence Interval: t36 (0.975) = 2.0378.

168 J. Dev. Agric. Econ.
Figure 4. USA Maps of biotechnology permits granted for cotton planting 3-A before and 3-B after 1987 to 2003 and its rapid development from 1987 to 2003 shown by 3-C Two periods graph of 1989-1997 and 1998-2003.
(a) CODE 1.42887 +/- 2.0378* 0.34686 CODE = Climatic Region From 0.722038692 to 2.135701308 (b) CORN 2.01128 +/- 2.0378* 0.00497 CORN = Maize Crop From 2.001152134 to 2.021407866 (c) COT 1.56782 +/- 2.0378* 0.21850 COT = Cotton Crop From 1.1225607 to 2.0130793 (d) SOY 2.04033 +/- 2.0378* 0.01231 SOY = Soybeans Crop From 2.015244682 to 2.065415318 (e) RSED 1.32294 +/- 2.0378)* 0.05723 RSED = Rapeseed Crop. From 1.206316706 to 1.439563294 Important issues for GMO development The success of GMO development and implementation with less risk to the environment are depended on
stringent regulations. North America and European Community paved the general framework for a regulatory system. Many countries are now faced with the challenge to put up in place regulatory systems to ensure safe and effective evaluation of the impact of GEP crops. The United Nations Environmental Program (UNEP) issued international technical guidelines for Safety in biotechnology (UNEP, 1995). The UNEP-Global Environment Facility (GEF) project on the development of National Biosafety Frameworks was designed to assist countries to develop their National Biosafety frameworks so that they can comply with the Cartagena Protocol on Biosafety (UNEP-GEF, 2004). Currently 77 countries have enrolled.
Regulatory assessments are science, risk and case based. The USA regulation focuses primarily on the

Maphanyane 169
Figure 5. USA Maps of biotechnology permits granted for soybeans planting 4-A before and 4-B after 1987 to 2003 and its rapid development from 1987 to 2003 shown by 4-C One period’s graph of 1991-2002.
characteristics of the product, rather than the way in which the production is produced. This USA product-based assessment was the major difference with the philosophy of regulation in the European Union. This process – product difference of philosophy has sparked considerable controversy over recent years.
The USDA-APHIS/EPA regulation of the environmental release was based on the concept of ‘familiarity’ (Organization for Economic Corporation and Development (OECD), 1993). This concept can be considered the ecological counterpart of the concept of ‘substantial equivalence’. Familiarity considers the biology of the plant species, the trait introduced, and the agricultural practices and environment used for crop production. In comparison
with a suitable counterpart, often the parental non-GM crop, the aim is to establish if the GM change presents any new or greater risks relative to that counterpart. If an organism has already been evaluated, future assessments of that organism can be less stringent. The application for environmental release are evaluated on a case by case basis and concern weediness, gene transfer, effects on wildlife, altered disease susceptibility and several related aspects of the GM crop (Bonny, 2003). The GMOs main: reactors and their concerns The reactors in the GMOs are Europe, Africa and Asia.

170 J. Dev. Agric. Econ.
Figure 6. Statistical analysis to establish whether GFP crops of cotton, rapeseed, and cotton, are still grown in areas designated by the Native Americans who the primitive methods and followed the natural climatic conditions.
Western Europe had initially embraced the GMOs, but out of shire pressure from its public and pressure groups they had to suspend the issuing of new permits until their regulatory measures are in place. EU on regulations, laws, security and insecurity For Western Europe, the GM crop industry was regulated by several regulations, directives and amendments thereof, which are assembled in a time-consuming and highly complex interplay between the European Commission (EC), the European Parliament (EP), and relevant Council of Ministers and the individual Member States.
The EU regulations considered GM as something new and special for which existing legislation was not sufficient. The EU regulatory system was process based rather than product based. The way soothing was made determines the regulatory framework. This was thought to contribute to better acceptance of genetic modification, notably in the food sector. It was also attributed to heightened awareness and concern in Europe compared to the North American continent. The major philosophy behind the EU regulation Directive 2001/18/EC was its explicit adaptation of precautionary principle as a guide, rather than or in addition to concepts of familiarity and substantial equivalence (The European Parliament and the Council of the European Union, 2001). This was motivated by the United Nations Cartagena protocol on Biosafety. The EU
required very extensive information, with respect to the GMOs molecular characterisation, monitoring and traceability. Since June 1999, a de facto moratorium on commercial licensing of new GM products had been in place in the EU. Six EU member Countries, Austria, Denmark, France, Greece, Italy and Luxembourg, decided that they would not accept any new GM approvals at least until a revision of Directive 90/220/EEC was in place.
At the same time, trans-boundary transport GM material across the EU was being established in accordance with international obligations in the Cartagena protocol on Biosafety. Africa The entire African continent (African Centre for Biosafety, 2012) was against the GMOs except South Africa. Most of them have signed Cartagena Protocol on Biosafety to the Convention on Biological Diversity (the United Nations Conference on Environment and Development (UNCED), 29 January, 2000). Their feelings towards the GMOs reached a peak when wide spread media publications reported drought ridden and staving Southern African nations totally refused famine Relief GM based food. With this out right refusal, there was wide spread belief that because Europe had rejected genetically engineered food, Africa which needed it, was under pressure to emulate EU countries. But some augured that this remark was unfair to both the Africans and the European. Their argument was that the African’s reactions were based on real appreciation of the possible risks. And that the position of Europe was only helping them to argue against surreptitious introduction without going through the due process. It could be proved that European view was only helping Africa to be heard more in its legitimate realisation of the risks, which predated Europe’s’. In 1995 for instance, when the positions on the Cartagena Protocol started, Africa took the position to examine genetic engineering and the risks and it developed a draft that was satisfactory for its production. This was submitted in 1996 and it had been the basis of African position. Africa had taken its position long before Europe took its movement to keep out GM crops and therefore it was totally unfair to say that African position was influenced by Europe.
Other arguments that the African put forward were that even the USA had a system in place for approving GMOs, why should Africa be expected to bypass the countries’ ability to scrutinise and clear varieties, and if the Cartagena Protocol was followed this will be out of order. Africa also needed to do its own environmental impact assessment analysis and only after that it could decide to embrace or to reject the GMOs.
The risks here include those of human health. Americans had been eating the GMOs food for about six years and for Bt Corn they might be utilizing 2% of corn flakes in their diets. But in Africa where corn form the staple food, it makes up 100% of the daily food intake. So
Maphanyane 171 the intake of GM food in the US is fairly low. Domestic animals are reported to dislike Corn. In Africa and most developing countries, crop production and animal production are integrated; the animals constitute the basis for crop production and their food is largely crop residues. If this is not good enough for the animals you are losing the animal production component. Also, it has been claimed that GM Bt Corn has been found to cause 80% loss in reproductive ability was very serious in animal production. So, the Africans worry very much about the GMOs impact on their already fragile agricultural system. Also, they worry that the Bt Corn would kill their butterflies and moths and these creatures are vital in pollinating crops.
They also believe that their farmers will loss control of their seed to the mega agribusiness companies which might cost them dearly, it sounded to them like colonization and control all over again. Africa famine is not caused by lack of production of food alone, but by a number of problems. These included lack of roads to take food from one place to the other; lack of storages to safe food for later and of cause the civil wars in many parts of the continent. There was also no prove that the assumption that the GMOs would increase the production.
In the period from 1987 to 2003, South Africa was the only African country, which has embraced the GM crops. It grew cotton mainly, but there are corn products too. Biotechnology: How safe is genetically modified (GM) food? The GM foods were relatively new to jump into any conclusions which require observations that could only come out from long-term use. But as they stand, there were obvious or outstanding problems. Some of these problems were as follow: a) There were fears that allergic traits can find their way into normally non-allergic food plants during gene transfer, b) Most foods eaten everyday have a history of safe use. Some however, do not and these foods were considered as being unsafe until they were shown to be safe. Genetically, modified (GM) foods fall into this category. Because they were new to the diet in most countries, they were required to undergo a pre-market safety assessment and manufacturers were required to provide comprehensive package of scientific data used in this assessment. The safety assessment process for GM foods was based on the best international principles provided by the United Nations (UN) though its Food and Agricultural Organization (FAO) (FOA - Economic and Social Development Department, 1995) (the United Nations Conference on Environment and Development (UNCED), 2000) and subsequence ones like Cartagena Protocol on Biosafety, Montreal (United Nations, 2000) Montreal, (29

172 J. Dev. Agric. Econ. January 2000), Nairobi (15 to 26 May 2000), New York (5th June 2000 to 4th June 2001. branch and is carried out by food toxicologists, molecular geneticists, biologists and nutritionists (König et al., 2004). Theoretically, these GM foods were examined before they made their way to the dinner tables of the multitudes. In making an assessment, Food and Technology Boards examined the safety of these new food components separately and fully. They were new in the sense that they may not have previously existed in the food. Significant differences in these properties between the GM food and its conventionally produced equivalent were assessed for potential health effects if any, before they were allowed to be sold for human consumption. In addition, other characteristics of the food such as the levels of nutrients and naturally occurring allergens, toxins and anti-nutrients were considered in detail, as these may be affected by the genetic modification (König et al., 2004).
Two major problems and barriers here were as followers: a) First problem was that manufacturers normally do not disclose all the production information as it was regarded as patent as some of these were regarded as companies’ secrets. b) Second, the rigorous assessment could only be done by countries with regulations in place and also with manpower and scientific know-how to make well informed assessment, otherwise the GM foods are almost impossible to regulate in most countries, especially the developing nations, more so Africa (African Centre for Biosafety, 2012). They relied heavily on outside expertise or even on the manufacturers themselves whose main interests might certainly not the welfare of those poor nations but were on their commodities sales, economic gain and for profit making which were a great disaster, when withstanding the conflicts of interest which could be at play. DISCUSSION AND CONCLUSIONS In conclusion, this project had shown that The GIS was a powerful tool that pulled together facts from a wide variety of sources, and then those facts were used to decide how these available resources should be best managed. The techniques allowed a continuous visual observation of GMOs land cover and monitoring of development of GM agricultural practices from 1987 to 2003 of world and that of the USA GMOs states. These were extraordinary tools without, which, this type of analysis and map making would have taken a very long time to be made. The GIS software used was ARCVIEW, by the ESRI, Redland, USA. The GIS LULCC maps have shown where, when and what type of GMOs were planted for world coverage (Figure 1) and effectively for the USA (Figures 2, 3, 4 and 5). In the USA, GMOs are widely grown throughout the country except for the seven states; New Hampshire (NH),
Vermont (VT), District of Columbia (DC), Massachusetts (MA), Utah (UT), West Virginia (WV), and Alaska (AK); of which AK is not farmable anyway because of its frizzing climate, while DC might be limited by the fact that it is a City district, but NH, VT, MA, UT and WV are truly organic states and GMOs free States. Also, this country’s states had highly embraced the GEP Corn traits, the production of which have increased by almost 275% from 1989 to 1997 to 1998 to 2003 time periods; the production of Bt and RR being the highest trait embraced and corn being the most produced (Figure 3). This is followed by cotton (Figure 4) and soybeans (Figure 2) and canola (Figure 5) being the least produced. The Bt and RR traits came first; followed by the production of Nutrition enhanced traits; then Nutrition corn being the mostly produced, followed by Nutrition soybeans (Figures 2, 3, 4, 5, Tables 2 and 3).
The research recommends that the key to the reduction of risk caused by the GMOs to the environment was for all the countries to develop regulatory measures, which they could observe fully. To this end, there were two schools of thoughts. First, was for the Americans who based GMOs safety on characteristics of the product based. Second, was that for the Europeans, who measured the GMOs by how it was produced. These two ways of handling the GMOs had caused controversy and a rift between the nations of the world. It was clear that the EU was following a more stringent approach while the Americas less so GMO regulatory system was not so rigid
It also stipulates that formulation and management of the GMOs regulation required highly sophisticated techniques, multidisciplinary and highly qualified scientists as well as a sound budget which the poor countries were unable to afford hence they lacked behind in their GMOs development issues. However, the trans-boundaries and the globalisation of the world trade called for the standardization GMOs risk regulations otherwise the countries with strong GMOs laws would be in vain as they could be easily polluted by products from outside. So, all countries needed to work together for the good of all. Also, with the eminent trade globalisation, the Africans fears that the multi agribusiness foreign companies were gearing up to monopolize the world agricultural trade by forcing them to plant GMOs, which would be based on buying seeds from other countries who will be the ones to gain (Table 1). They feel that their priorities were not the GMOs; but were: a) Needed better roads to transfer the food from where they are grown to other parts, b) Food storages were needed to save supplies for the future more especially to use in drought years, c) Even GMOs could be grown with their anticipated high yield, the needs for bigger storage and even much better roads would be needed to carry the supplies to the markets and, d) When they converted to GMOs, how are their naturally growing seeds safeguarded together with their traditional ecological knowledge,

Maphanyane 173
Table 2. USA, State GMOs information on soybeans, corn, cotton and canola.
STATE_ABBR GMFARMS SUB_REGION CODE CORN COTTON SOYBEANS RSEED
ID 138 ENCen 1 56 2 1 20
ME 2 ENCen 1 0 1 0 0
MN 872 ENCen 1 405 0 18 26
MT 6 ENCen 1 1 0 0 4
ND 109 ENCen 1 34 1 5 29
OR 38 ENCen 1 18 0 0 2
SD 362 ENCen 1 172 0 8 2
WA 116 ENCen 1 16 0 39 6
WI 569 MidAtl 1 259 14 8 7
WY 5 MidAtl 1 2 0 0 1
CA 469 Mtn 2 146 62 2 49
CO 158 Mtn 2 69 0 0 20
CT 444 Mtn 2 219 0 3 0
DE 400 Mtn 2 155 2 43 0
IA 2515 Mtn 2 1105 0 150 5
IL 2802 Mtn 2 1235 2 160 8
IN 1117 Mtn 2 513 0 45 1
KY 124 N Eng 2 39 0 23 0
MD 528 N Eng 2 179 6 79 0
NE 1191 N Eng 2 559 0 36 1
NJ 46 N Eng 2 18 0 5 0
NV 88 N Eng 2 44 0 0 0
NY 30 Pacific 2 15 0 0 0
OH 508 Pacific 2 221 0 33 0
PA 316 Pacific 2 146 0 12 0
RI 4 SAtl 2 2 0 0 0
AL 313.0058 SAtl 3 28.0029 88 37 7
AR 424 SAtl 3 33 87 92 0
AZ 274 SAtl 3 33 94 0 20
FL 535 SAtl 3 218 26 20 7
GA 352 SAtl 3 60 79 25 24
HI 3242 SAtl 3 1588 7 26 0
KS 502 SAtl 3 235 0 16 0
LA 256 SAtl 3 35 71 22 0
MI 324 WNCen 3 131 0 25 12
MO 688 WNCen 3 263 30 51 0
MS 690 WNCen 3 69 207 69 0
NC 463 WNCen 3 134 74 22 3
NM 22 WNCen 3 6 3 2 0
OK 92 WNCen 3 23 18 5 0
SC 164 WNCen 3 1 68 11 4
TN 465 WNCen 3 138 52 41 3
TX 692 WNCen 3 164 170 12 0
VA 122 WNCen 3 36 11 14 0 e) If that happens, they would forever dependent on the multi-millions companies with the patent to GEPs seeds.
To address those fears by the Africans, this study
recommends training and technology transfer. At the same time, to safeguard the natural seeds and the traditional ecological knowledge, the African countries

174 J. Dev. Agric. Econ.
Table 3. The five types of gm traits studied in four different crops: - soybeans, cotton, corn and rapeseeds-canola.
Yield quality and altered production: Environmental stress as well as quality traits are: Improved post harvest storage, flavour such as yield increase, fertility altered, development altered and germination increase, drought tolerant, seed quality altered, cold tolerant, altered amino acid composition, protein altered, maturity altered, senescence altered, male sterile or increased stem strength.
Viral resistant (VR), herbicides (HT) and round and ready (RR): Plants that repel specific and targeted insect pests are: Coleoteran, Lepidopteran resistant, Glyphosate tolerant plants; herbicides like Imidazolinone tolerant, Phosphinothrin tolerant, Isoxazole tolerant plants.
Nutritional change content are: Tryptophan level increased, oil profile altered, yield altered, yield increased, phytote reduced, starch metabolism altered, lysine level increased, carbonhydrate metabolism altered, animal feed quality improved, nitrogen metabolism altered, seed size increased or fumonisin degradation; and colour change such as visual marker or kanamycin resistant.
Manufacture industrial as well as pharmaceutical/Medicinal compounds as well as renewable are: Anthocyarin production seed, gene expression altered, pharmaceutical proteins produced, novel protein produced, industrial enzyme production, recombinase produced, transposon, coloured sectors in leaves, transposon inserted, seed colour altered, anthocyarin sequestration suppressed.
Others: This category included both complex mixtures of traits and undisclosed classified details.
need to have repository storage for all their seeds and all the TEK needed to be documented. The African governments needed to do the bio-technology themselves to their own crops so that they do not lose the patent for their countries’ seeds. There had been great upheavals, when the Southern African countries totally refused famine relief GM foods by the USA. It shows how controversial the GMOs can be (African Centre for Biosafety, 2012). Also, another controversy was that, the USA threatened the EU with court case for barring all trade in GMOs.
Another controversy was the Asian countries refusing to accept yellow rice, which was meant to alleviate widespread protein deficiency in those countries. The Asian countries trended with care, as most of them had embraced non-eatable GMOs like cotton, only the Philippines had stated growing GM corn; and all of them have totally rejected the yellow rice. As far as regulatory measures are concerned and the scientific know how, Asia is far ahead of Africa. After all, China has been the first country to grow it commercially, the GM tobacco in 1992 and India now is regarded as being the giant of GM cotton producer. The problems, faced by GMOs producers were loss of trade as many countries opted to be GM free zones, especially in the food sector, as these controversial issues were raised and the majority of ordinary citizens in most countries pushed for no GMOs through pressure groups. In this issue, this research recommended rigorous sensitization of benefits of the GMOs to all stakeholders.
The GMOs on the ecosystem and the biodiversity issues also caused concern. The major causes of concerns include the following: a) The risks that might be caused by the GMOs on the cross pollination with their weed relatives; b) Also the unintentional killing of friendly insects like moths; and c) The unintentional mixture of animal feeds and human food is also being a major concern. So, to that end, this study recommends care when making the regulations to be inclusive and rigorous policing to see that all regulations have to be followed to the letter. Also, pharmaceutical GMOs were the most sensitive, so, the study recommends that a lot of work and stringent regulation were needed to be in place before any country plant or import them as they posed serious health consequences in the long run. This study concurs with the FOA notion that all in all biotechnology had the potential to have a huge impact on all communities worldwide. Its applications were expected to extend to a number of areas which are important in everyday lives, such as health, medicine, food and agriculture. And that as with any new technology, biotechnology and gene technology had potential risks as well as benefits. And for that reason, a comprehensive regulatory system for each country was essential to regulate the use of biotechnology and gene technology before its adaptation (FOA - Economic and

Maphanyane 175
Table 4. Third step in the statistical procedures - the Extra Sum of Squares to see if when the influential variable has been removed there was still any significance, first checked was whether the interactive model was significant.
STATE_ABBR GMFARMS SUB_REGION CODE CORN COTTON SOYBEANS RSEED
ID 138 ENCen 1 56 2 1 20
ME 2 ENCen 1 0 1 0 0
MN 872 ENCen 1 405 0 18 26
MT 6 ENCen 1 1 0 0 4
ND 109 ENCen 1 34 1 5 29
OR 38 ENCen 1 18 0 0 2
SD 362 ENCen 1 172 0 8 2
WA 116 ENCen 1 16 0 39 6
WI 569 MidAtl 1 259 14 8 7
WY 5 MidAtl 1 2 0 0 1
CA 469 Mtn 2 146 62 2 49
CO 158 Mtn 2 69 0 0 20
CT 444 Mtn 2 219 0 3 0
DE 400 Mtn 2 155 2 43 0
IA 2515 Mtn 2 1105 0 150 5
IL 2802 Mtn 2 1235 2 160 8
IN 1117 Mtn 2 513 0 45 1
KY 124 N Eng 2 39 0 23 0
MD 528 N Eng 2 179 6 79 0
NE 1191 N Eng 2 559 0 36 1
NJ 46 N Eng 2 18 0 5 0
NV 88 N Eng 2 44 0 0 0
NY 30 Pacific 2 15 0 0 0
OH 508 Pacific 2 221 0 33 0
PA 316 Pacific 2 146 0 12 0
RI 4 SAtl 2 2 0 0 0
AL 313.0058 SAtl 3 28.0029 88 37 7
AR 424 SAtl 3 33 87 92 0
AZ 274 SAtl 3 33 94 0 20
FL 535 SAtl 3 218 26 20 7
GA 352 SAtl 3 60 79 25 24
HI 3242 SAtl 3 1588 7 26 0
KS 502 SAtl 3 235 0 16 0
LA 256 SAtl 3 35 71 22 0
MI 324 WNCen 3 131 0 25 12
MO 688 WNCen 3 263 30 51 0
MS 690 WNCen 3 69 207 69 0
NC 463 WNCen 3 134 74 22 3
NM 22 WNCen 3 6 3 2 0
OK 92 WNCen 3 23 18 5 0
SC 164 WNCen 3 1 68 11 4
TN 465 WNCen 3 138 52 41 3
TX 692 WNCen 3 164 170 12 0
VA 122 WNCen 3 36 11 14 0 Social Development Department, 1995). Public consultation was an integral part of developing regulatory
systems, and also the development of public policy, as it allowed the community and stakeholders involved in an

176 J. Dev. Agric. Econ.
Table 5. The summary of statistical was created first by checking overall significance of the interactive model by FIT FULL MODEL Findings then by FIT REDUCED MODEL findings as shown.
Source of variation Sum of squares Df. Mean square F-statistics P-value
Regression 2903871.8 5 580774.36 Residual 53.6 31 1.729032258 Total 2903925.4 36
input into these processes. Conflict of Interests The author(s) have not declared any conflict of interests. REFERENCES African Centre for Biosafety (2012). GM Food Aid: Africa denied
CHOICE once again MAY 08, 2012. From http://www.eraction.org/publications/africa_gm_food_aid[1].pdf.
Bonny S (2003). Why are most Europeans opposed to GMOS? Factors explaining rejection in France and Europe. Electr. J. Biotechnol. 6(1).
Cahn MA (1995). Environmental deceptions: The tension between liberalism and environmental policymaking in the United States. Albany, New York: State University of New York Press.
Donovan D, Puri R (2004). Learning from traditional knowledge of non-timber forest products: Penan Benalui and the autecology of aquilaria in Indonesian Borneo. Ecol. Soc. 9(3):3.
Dunlap RE (2008). The NEP scale: From marginality to Worldwide use. J. Environ. Edu. 40(1):3-18.
FOA-Economic and Social Development Department (1995). World Agriculture: Towards 2015/2030. An FAO study. Retrieved 30/11/2012, 2012, from http://www.fao.org/docrep/004/y3557e/y3557e21.htm#topofpage.
ISAAA (1991). International Service for Agri-Biotech Applications. Retrieved 01/11/2012, 2012, from http://www.isaaa.org/inbrief/default.asp.
ISB (2010). Information Systems for Biotechnology. Retrieved 01/11/2012, 2012, from http://www.isb.vt.edu/data.aspx.
Kilbourne WE, Polonsky MJ (2005). Environmental attitudes and their relation to the dominant social paradigm, among University students in New Zealand and Australia. Austr. Mark. J. 3(2).
König A, Cockburn A, Crevel RWR, Debruyne E, Grafstroem R, Hammerling U, Kimber I, KnudsenI, Kuiper HA, Peijnenburg AACM, Penninks AH, Poulsen M, Schauzu M, Wal JM (2004). Safety assessment, detection and traceability, and societal aspects of genetically modified foods European network on safety assessment of genetically modified food crops (ENTRANS FOOD). Food Chem. Toxicol. 42(7):1047-1088.
Nap J-P, Metz PLJ, Escaler M, Conner AJ (2003). The release of genetically modified crops into the environment -Part I. Overview of current status and regulations. Plant J. 33:1-18.
Organization for Economic Corporation and Development (OECD) (1993). Safety and evaluation of foods derived by modern biotechnology concepts and principles. Paris, France: OECD.
The European Parliament and the council of the European Union (2001). Directive 2001/18/EC of the European Parliament and of the Council of 12 March 2001 on the deliberate release into the environment of genetically modified organisms and repealing Council Directive 90/220/EEC. Off. J. Eur. Commun. 106(1):38.
The United Nations Conference on Environment and Development (UNCED) (29 January 2000). Cartagena Protocol on Biosafety, Montreal, Canada: United Nations.
UN (1972). United Nations Stockholm Conference on Human Environment. Paper presented at the United Nations Stockholm Conference on Human Environment Stockholm.
UN (1992). United Nations Global Conference on Environmental and Development. Paper presented at the Earth Summit, Rio de Janeiro.
UN (2002). Report of the world summit on sustainable development. Paper presented at the world summit on sustainable development, Johannesburg, South Africa 26 August to 4th September, 2002.
UN (2007). United Nation Climate Change Conference. Paper presented at the United Nation Earth Summit on Climate Change Conference, held in Bali-Indonesia
UNCED (1992). United Nations Conference on Environment and Development (UNCED), Paper presented at the Earth Summit, Rio De Janeiro, Brazil 3-14 June 1992.
UNEP (1995). International technical guidelines for safety in Biotechnology. Nairobi, Kenya: UNEP.
UNEP-GEF (2004). CZECH Republic final draft National Biosafety Framework as at completion of project. Geneva, Switzerland.
UNFCCC (2009). Report of the conference of the parties on its thirteenth session, held in Bali from 3 to 15 December 2007. Part one: Proceedings paper presented at the United Nation Earth summit on climate change conference, Bali-Indonesia.
Van DeVeer D, Pierce C (1994). The environmental ethics and policy book: philosophy, ecology, economics. Belmont, Califonia: Wadsworth Publishing Company.
Vaughn J (2012). Environmental politics: Domestic and global dimensions (6th ed). New York, NY: Tom Doherty Associates, LLC.
Vig NJ, Kraft ME (2010). Environmental Policy: New Directions for the twenty-first Century (7 ed.). Washington, DC: CQ Press, Sage.