the geometric effect on the evolution of a long bubble in ... geometric effect on the evolution of a...
TRANSCRIPT

The Geometric Effect on the Evolution of a Long Bubble in a Circular
Contraction Tube Followed by an Expansion Tube
G.-C. Kuoa ,C.-H. Hsu
b, C.-C. Chang
c,Y.-H. Hu
a,
W.-L. Liaw
a ,K.-J Wang
d, K.-Y. Kung
e,* , Yute Chen
f
aDepartment of Mechanical Engineering TIIT
bDepartment of Mechanical Engineering CYCU
cDepartment of Mechanical Engineering, Army Academy R.O.C
dDepartment of Industrial Management
National Taiwan University of Science and Technology
e,* Graduate School of Materials Applied Technology
Taoyuan Innovation of Institute Technology fDepartment of Electronic Engineering, Vanung University
*NO.414, Sec.3, Jhongshan E. Rd., Jhongli City, 32091
Taiwan.
Email:[email protected], [email protected]
Phone: 886-3-4361070-6210, FAX: 886-3-4388198.
Abstract: - In this paper, a long bubble elongates through a contraction tube followed by an expansion tube
filled with viscoplastic fluids was studied experimentally and numerically. The effects of both tube geometry
and fluid characteristics on the bubble profiles and fractional converge were evaluated.
In the experimental aspect, the bubble profiles and the fractional converge were obtained by image
processing the photos captured with a high-speed camera. In the numerical analysis aspect, the continuity
equation and momentum equation were converted to the equations in the form of streamline and vorticity. The
differential equations were discretized with the finite difference method. Gauss-Seidel Iteration method with
successive over-relaxation (SOR) were applied in the computation of the viscous fluid flows. The evolution of
the bubble contour predicted by a conservative Level Set Method was applied to this study.
The results showed that the fractional converge of the fluid, the bubble profile and velocity changed due to
the effects of the fluid viscosity, the gas the flow rate and the contraction/ expansion angle of the tube. The
bubble profile, developing along the stream line, was changed by the effects of the inertia force, surface tension
and capillary force, etc. The bubble profiles and the flow fields generated by numerical simulation were applied
to explain the experimental observations. Both experimental observation and numerical simulation results were
in the same trend. A good consistency was shown between our results and the related researches.
Key-Words: - Evolution, Level Set Method, Long Bubble, Streamline, Viscoplastic Fluids, Vorticity.
1 Introduction There are many benefits to manufacture the plastic
parts by gas-assisted injection molding (GAIM).
The parts with better quality are manufactured for
uniform pressure distribution throughout the mold
by using the nitrogen gas. Therefore, GAIM
technique is widely used to manufacture
components for automobiles, home appliances,
communication products, etc.
A shape profile equation, as the water penetrated
the oil in a Hele-Shaw cell, was published by
Saffman & Taylor[1] in 1958. The ratio λ was
defined as the fraction of the channel was occupied
by the bubble. In 1961, Taylor[2] analyzed the fluid
deposition in different-sized circular tubes with
different fluids. A correlated curve of the fractional
coverage to the capillary number was published. In
1980, Pitts[3] reported a theoretical shape equation
of the bubble front for λ < 0.77.
Yamamoto et al.[4] experimentally studied the
effect of Capillary number (Ca) and Weiseenberg
number (Wi) on capillary number for Newtonian
and non- Newtonian fluids.
In 1985, Reinelt and Saffman[5] investigated the
fractional coverage and the flow field of viscous
fluid by using the finite difference method with
composite mesh for both two-dimensional and
axisymmetric cases.
WSEAS TRANSACTIONS on APPLIED and THEORETICAL MECHANICS
G.-C. Kuo, C.-H. Hsu, C.-C. Chang Y.-H. Hu, W.-L. Liaw, K.-J. Wang, K.-Y. Kung, Yute Chen
E-ISSN: 2224-3429 252 Issue 3, Volume 7, July 2012

In 1987, Song et al.[6] studied the numerical
simulation of the flow of upper convected Maxwell
fluid through a planar 4:1 contraction by using type
dependent difference approximation of the vorticity
equation.
In 2010, C. H. Hsu et.al.[7] investigated the
steady-state flow field of a long bubble penetrating
into a region filled with a viscous fluid confined by
two closely located parallel plates.The gradually
moving of the stagnation point in the front of the
bubble tip between two typical flow patterns is
clearly presented. In 1997, Huzyak and Koelling[8]
studied the influence factors of the fractional
coverage for both the Newtonian and viscoelastic
fluids experimentally. They showed that the
thickness of the coating film was affected by the
fluid elasticity of and viscoelastic fluids.
In 2003, Dimakopoulos et al.[9] studied
numerically the transient displacement of a
viscoplastic material from straight or suddenly
constricted cylindrical tubes in 2003. The bubble
shapes and contour lines of velocity, the stress
tensor and the the pressure field was represented. In
2004, they also studied the transient displacement of
viscoelastic fluids by a gas in straight cylindrical
tubes[10]. They showed that the thickness of the
remaining film was affected by the the
viscoelasticity of fluid. The effects of Reynolds
number are more pronounced in the case of a
viscoelastic than a Newtonian liquid.
In 2007, Dimakopoulos et al.[11] studied the
transient displacement of Newtonian and
viscoplastic liquids by highly pressurized air in
cylindrical tubes of finite length with an expansion
followed by a contraction in their cross section.
They found that the distribution of the remaining
material is affected significantly by the geometry of
the tube because the bubble is forced in a very short
distance to suddenly expand and then squeeze
through the contraction. In 2011, C. H. Hsu et.al.[16]
investigated a long bubble-driven fluid flow in a
circular tube by an optical method. The results
showed a good verification of the theoretically
derived contour equation. The deduced penetration
speed indicated that the speed is increasing
downstream caused by the decreasing fluid slug in
the tube. The experimental results showed the
theoretical bubble profile could be introduced to the
simulation study to reduce the calculating time.
Dzan et.al.[17] applied the digitizing technique of
3D design and experienced the length 9 meters
motor skiff and develops precedent of self-reliantly
the manufacture motor skiff, also provides
fiberglass reinforced plastic of straggling parameter
and the improvement direction the vessel 3D design
manufacture.
This study analyzed gas penetration through
viscoelastic fluids in a contraction/expansion tube.
The study parameters in this study are the
characteristics of fluid, the flow rate of the injected
gas and the contraction/expansion angle. First, the
evolution behaviors through viscoelastic fluids of a
long bubble in a contraction/expansion tube are
recorded by a high speed camera. The profile and
speed of the bubble fronts are comapred each other
for some different combination of these three
parameters.
To explain the experimental observations, a
numerical method is also applied to simulate the
stable development of long bubbles penetration
through viscoelastic fluids in a
contraction/expansion tube. By comparing the
results of this study and previous researchers, some
more reasonable explanations on these complex
phenomena can be discussed.
2 Problem Formulation The behavior of a long bubble through the
viscoplastic fluids in a contraction/expansion tube
was studied experimentally and numerically in this
study. We observe and record the bubble evolution
process in a contraction/expansion tube filled with
the viscoplastic fluids experimentally.
We also simulate the flow field and the
promotion process of a long bubble in a
contraction/expansion tube numerically by the finite
difference method coupled with the level set method.
And then we discuss effects of both tube geometry
and fluid characteristics on the bubble profiles and
fractional converge according to the results of
numerical simulation and those of the experimental
observations.
Casico caxera Ex-F1Liquid supply
Liquid reservoir
Liquid reservoirHalogen spotlight
Viewing cell
Ball valuesCheck values
MFC(1000ml/min)
S
Fig. 1 A schematic diagram of the experimental
system.
WSEAS TRANSACTIONS on APPLIED and THEORETICAL MECHANICS
G.-C. Kuo, C.-H. Hsu, C.-C. Chang Y.-H. Hu, W.-L. Liaw, K.-J. Wang, K.-Y. Kung, Yute Chen
E-ISSN: 2224-3429 253 Issue 3, Volume 7, July 2012

Fig. 2 Schematic of experimental tube.
2.1 Experimental Setup Fig. 1 shows the experimental setup for the gas
penetration. It is designed accoreding the
experimental architecture shown by Huzyak et al.[8]
in 1997. Some appropriate amendments was applied
to make it easy to operate and more suitable to
observe and record bubble contours. In this study,
the volume rate of injected gas was controlled by
using a mass flow controller (MFC).
The images of the bubble are captured by a high-
speed camera (CASIO EX-F1) with 6 Mega
pixel/60 frames per second. The light source is a
coaxial light source (LA180-Me). The pressure at
the entrance is 10 kg/cm2. Nitrogen with 99.99%
purity is selected as the injection gas. The volume
rate of injection gas was controlled by using a MFC.
The gas was injected at two volume rates 600ml/min
and 200ml/min.
Fig. 2 shows the experimental tube, which is
made of high-hardness heat-resistant glass. The
dimensions of the tube are L=1000mm, L1=200mm,
L2 =400mm, d2=8mm, d1=4mm. The inclined
angle θ are 15∘, 45∘, 75∘and 90∘, respectively.
The tube was covered by a viewing box dimensions
50mm× 50mm× 1000mm. The viewing cell is filled
with glycerin to reduce the experimental errors
caused by light refraction. A ruler was fixed to the
frame for convenience of calculation of the velocity
of the bubble.
2.1.1 Test Fluid
In this study, the viscoelastic fluid carboxymethyl
(CMC) with 0.5wt% concentration is used. The
definition of Carreau–Yasuda viscosity model[12] is
shown as Eq. (1).
ana /)1(
0 ))(1)((
(1)
where is the measured viscosity, is the applied
shear rate, is the viscosity limit when → 0,
is the viscosity at infinite shear rate, which was
set as the solvent viscosity. The parameter has
units of time, n and a are dimensionless parameters.
The rheological properties tensions of test fluids
were measured by a cone-plate type rheometer
(Gemini HR nano) at 25°C, which is the same
temperature condition for the gas penetration
experiments. The parameters of Carreau–Yasuda
viscosity model for 0.5 wt% CMC solution are
=0.232 Pas, =0.0183 Pas, =0.0002 s,
=0.1908, =0.1404, =0.1/3000.
The surface tension of test fluids with respect to
Nitrogen was measured with a Du Nouy (DST30)
and the density ρ was measured with a density tester
(DA-130N) at 25°C. The density of 0.5 wt% CMC
solution is ρ= 945.07 kg/cm3 and the surface tension
=0.0733 mN/m.
2.1.2 Experimental method
The experimental procedure of this experiment are
summarized as following: The experimental system
shown in Fig. 1 are properly mounted on the optical
platform. The gas is injected into tube filled with
viscolelastic fluids as opening the valve of the inlet
side. In order to make bubbles progress stably in the
tube, the volume rate of the injection gas was
controlled by MFC in this experiment. The profile
of the bubble is captured by a high-speed camera.
The photographs captured by the camera are
processed by an image post-processor written in
Matlab. By using the Level Set Method, the post-
processor can apply the binarization and
skeletonization treatments to the bubble
photographs to eliminate the errors caused by
shadows. The bubble profile information is obtained
plotted shown as Fig. 5.
2.2 Numerical method In this study, we simulate a long bubble elongates
through a circular tube contraction tube followed by
an expansion tube which is filled with viscoplastic
fluids numerically.
In the beginning, the tube is filled with
viscoplastic fluids. The gas is injected into the tube
from the entrance located on the left end of the tube.
A long bubble is formed as the gas steadily expels
the viscous fluid.
2.2.1 Model Representation
The model schematic drawing of the contraction
tube followed by an expansion tube is shown in
Fig.3.
Fig. 3 Schematic of geometric model.
WSEAS TRANSACTIONS on APPLIED and THEORETICAL MECHANICS
G.-C. Kuo, C.-H. Hsu, C.-C. Chang Y.-H. Hu, W.-L. Liaw, K.-J. Wang, K.-Y. Kung, Yute Chen
E-ISSN: 2224-3429 254 Issue 3, Volume 7, July 2012

is the symmetrical axis of the circular tube.
The origin of the cylindrical coordinate system is
located at O, which is the point center of the
entrance cross section. and are axis along the
radial direction and axis along the axial direction,
respectively.
Assume that the angles of the sudden contraction
segment and the sudden expansion segment are . Both the radii of entrance and exit are R
which is a constant. The narrowest radius of this
contraction tube followed by an expansion tube is
0.5R. The geometry of the flow channel can be
defined by the following mathematical equations:
,
tan ,
( ) 0.5 ,
0.5 tan ,
,
A B
B B C
C M
M M P
P D
R z z z
R z z z z z
r z R z z z
R z z z z z
R z z z
(2)
where is the constant inclined angle between
(or ) with the symmetry axis. is the
bubble front profile, i.e. the interface of the gas and
fluid. Az , Bz , Cz , Dz , Mz and Pz are the locations
at A, B, C, D, M and P in Fig. 3, respectively.
The fundamental assumptions of the flow are as
follows:
1. Incompressible laminar flow, second-grade
viscoelastic fluid with finite velocity,
2. Density and other physical properties constant,
3. Fully-developed flow distribution at the
entrance,
4. Neumann flow condition (
) at the exit,
5. Neglect the weight and buoyancy effects,
6. Axisymmetric problem,
7. No-slip condition on the tube wall.
8. The evolution of the interface is expressed in
the conservation form of the level set function
0d
udt
(3)
Where ( ) is the velocity vector. The
function ( , , )r z t is defined as ( , , )r z t = 0 for the
gas phase, ( , , )r z t = 1 for the liquid phase, and
( , , )r z t = 0.5 for the interface between liquid and
gas.
2.2.2 Governing equations
The Rivlin-Ericksen model[13] for a homogeneous,
non-Newtonian, second-grade viscoelastic fluid is
used in the present flow. The model equation is
expressed as follows: 2
1 2 2p 1 1T I A A A (4)
Where T is stress tensor, p is the pressure, is
the dynamic viscosity, and the first and
second normal stress coefficients related to the
material modulus. The symbol I is denoted as an
identity matrix, and the kinematic tensors 1
A and
2A are defined as
( )
( )
T
Td
dt
1
2 1 1 1
A V V
A A A V V A
(5)
Where V is the flow velocity vector and d/dt is
the material time derivative, b is the conservative
body force. Substituted Eq. (4) into the momentum
equations
d
dt V T b
(6)
The definitions of Eq.(7) assumed by Rajagopal
and Fosdick[14] are used to simplify the equations.
2 21 22
1
2 1
4 2P p
1V V A V
(7)
0 ,1 0 , 1 2 0 (8)
Where P represent the total force effects. The
dimensionless variables are defined as
* *, r z
r zR R
* *
0 0
, r zr z
u uu u
U U (9)
* *
0
, t p
t pR
U R
*ReUR
* *
20 0
, U U R
R
* 1
2E
R
where R is the radius of the circular tube, U0 is
the average velocity at the entrance, is the fluid
density, is the fluid viscosity, is the surface
tension between the liquid and the gas, Re* is
Reynolds number, and E* is the elastic number of
the viscoelastic fluid.
The stream function ( ) and vorticity ( ) are
defined as 1 1
, r zu ur z r r
(10)
2 2
2 2
1 1V
r r z r r
(11)
WSEAS TRANSACTIONS on APPLIED and THEORETICAL MECHANICS
G.-C. Kuo, C.-H. Hsu, C.-C. Chang Y.-H. Hu, W.-L. Liaw, K.-J. Wang, K.-Y. Kung, Yute Chen
E-ISSN: 2224-3429 255 Issue 3, Volume 7, July 2012

Substitute dimensionless variables into equations
(6) and (11). The dimensionless stream-vorticity
equations are obtained after some manipulations.
2 2
2
* 2 * 2 * * * * ** *
* * * * * * ** *
* ** * * *
0* *
1 11 Re Re
1 Re Re 0
t z r r r r zr z
E Sz r
(12)
2 2
2 * 2 * ** *
* ** *
10r
r rr z
(13)
where is the source terms with heigh derivatives.
2.2.3 Numerical scheme
A uniform grid system with grid points ( ) ( ) is applied to the discretized
system in this study. The accuracy of stream
function ( ) and vorticity ( ) of the grid system
with 193×17, 385×33, 769×65 and 1153×97 grid
points are compared each other. After repeated
testing, the most appropriate grid resolution is 769×
65 grid points.
The finite difference formulas are obtained from
the terms discretized by FDM with SOR method
mentioned above. The differential terms of the
stream function and the vorticity function are
discretized by a second order central difference
method. The velocity of grids is calculated from the
stream function by a forward difference method.
The discretized system could be shown as:
1 1 1* * * * * * *
, i+1,j i,j+1 i-1,j i,j-1 , ,a +b +c +d f g 1e
K K K K K K K
i j i j i j
(14)
**
2 *
1 1 1a Re
z 2
K
jr r z
*
*
2 *
1 1 1b 1 Re
r 2
K
jz r r
**
2 *
1 1 1c Re
z 2 z
K
jr r
*
*
2 *
1 1 1d 1 Re
r 2 r
K
jz r
22 2
2 2 1e
z rj
r
*
*
2*
1f Re
K
jz r
* *
022 2
2 2 1g Re
z rj
ES
r
1 1 1 1* * * * * *
, 1 1, 1 , 1 1 1, 1 , 1 ,
1
*
,
a +b +c +d +e
1
K K K K K K
K
i j i j i j i j i j i jj
i j
r
(15)
1 1 1 12 2 2 2
1 2 2
1 1 1 1 1 1a , b , c , d
z r 2 r z r 2 r
1 1e
z r
j jr r
where is the over-relaxation factor. k is the
iterative index. i and j are the indices along z-
direction and r-direction respectively. z and r are the
grid sizes along z-direction and r-direction
respectively. And j
r is the j-th grid in r-direction.
The boundary conditions on the surface shown in
Fig. 3 are listed as follows:
(a) The surface , and
* *
i,N i,N-1*
2
2 -
rj
r
(16)
(b) The surface * * * *
i,j i-1,j i,j i,j-1*
2 2
- -
rj
z r
(17)
(c) The surface * * * *
i,j i+1,j i,j i,j-1*
2 2
- -
rj
z r
(18)
(d) The surface * * * *
M,j M-4,j M-3,j M-1,j2 2
* * * *
M,j M-4,j M-3,j M-1,j2 2
(19)
Equations (14) and (15) could be solved
numerically. The value of the over-relaxation factor
is 1.5 for Re*=0. The value of α is adjusted from
0.5 to 0.025 as Re increases from 10 to 400. The
values of ω and ψ are calculated iteratively with an
over-relaxation factor α until the converge criterion
shown as below * *
*
k+1 k
i,j i,j -6
k
i,j
10
(20)
2.2.4 Interface tracking scheme
The discretized equation of Eq. (3) with a uniform
grid ( ) can be written as 1
, ,
1 1 1 1, , , ,
2 2 2 2
1 1k k
i j i j
i j i j i j i jF F G G
t z r
(21)
where t is the time step, and,
k
i j and 1
,
k
i j are
values of ,i jz r at the k-th and (k+1)-th time step,
respectively.
WSEAS TRANSACTIONS on APPLIED and THEORETICAL MECHANICS
G.-C. Kuo, C.-H. Hsu, C.-C. Chang Y.-H. Hu, W.-L. Liaw, K.-J. Wang, K.-Y. Kung, Yute Chen
E-ISSN: 2224-3429 256 Issue 3, Volume 7, July 2012
The flux on the grid ,i jz r is represented as
1,
2
1 , 1,,
2
0.5( )i j
i j i j zi j
F u
1,
2
1 , 1,,
2
0.5( )i j
i j i j zi j
F u
(22)
Where
1,
2i j
zu
and 1
,2
i jzu
are the velocity componts
on the grid ,i jz r .
The normal vector ,i jn , curvature
,i j and
surface tension ,sai j
F on the interface [18] can be
denoted by
,
( )
( )i j
H
H
n
(23)
,
( )
( )i j
H
H
(24)
,sa , ,i j i j i j F n
(25)
where ( ) is the smooth Heaviside function.
0,
1 1( ) 1 sin ,
2
1,
H
(26)
The parameter stands as an effective interface
width. The values of run smoothly from zero to
one on the neighboring interface. The values of
may fill up with either 0 or 1 except the neighboring
interface, which is treated as a narrow-band in finite
terms to assure the high efficiency performance.
An adaptive strategy is applied to determine the
values of time step t in order to avoid the value of
,i j being less than 0 or greater than 1. The values
of 1,
2i j
t F
, 1,
2i j
t F
, 1,
2i j
t G
, and 1,
2i j
t G
are
controlled under the range between 0.2 and 0.4. The
values of are calculated iteratively till the
converge criterion in Eq. (27) is reached for some
specified tolerance .
k+1 k t
(27)
3 Results and discussions In this study, the behavior of a long bubble
through the viscoplastic fluids in a
contraction/expansion tube was studied
experimentally and numerically. The experimental
and numerical results of this study are described
below:
3.1 Experimental Results
In this study, the pressure of inlet nitrogen was
10kg/cm2. Two different nitrogen flow rates
controlled by MFC are set as 600ml/min and
200ml/min.
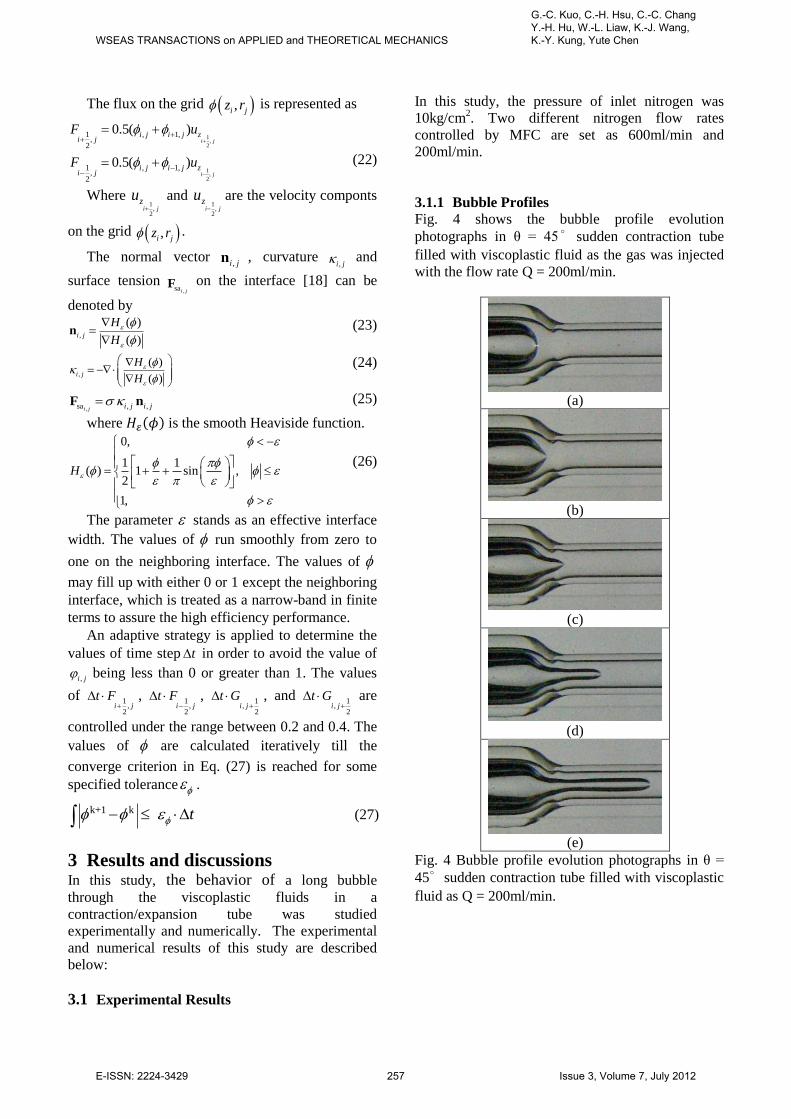
3.1.1 Bubble Profiles
Fig. 4 shows the bubble profile evolution
photographs in θ = 45∘sudden contraction tube
filled with viscoplastic fluid as the gas was injected
with the flow rate Q = 200ml/min.
(a)
(b)
(c)
(d)
(e) Fig. 4 Bubble profile evolution photographs in θ =
45∘sudden contraction tube filled with viscoplastic
fluid as Q = 200ml/min.
WSEAS TRANSACTIONS on APPLIED and THEORETICAL MECHANICS
G.-C. Kuo, C.-H. Hsu, C.-C. Chang Y.-H. Hu, W.-L. Liaw, K.-J. Wang, K.-Y. Kung, Yute Chen
E-ISSN: 2224-3429 257 Issue 3, Volume 7, July 2012
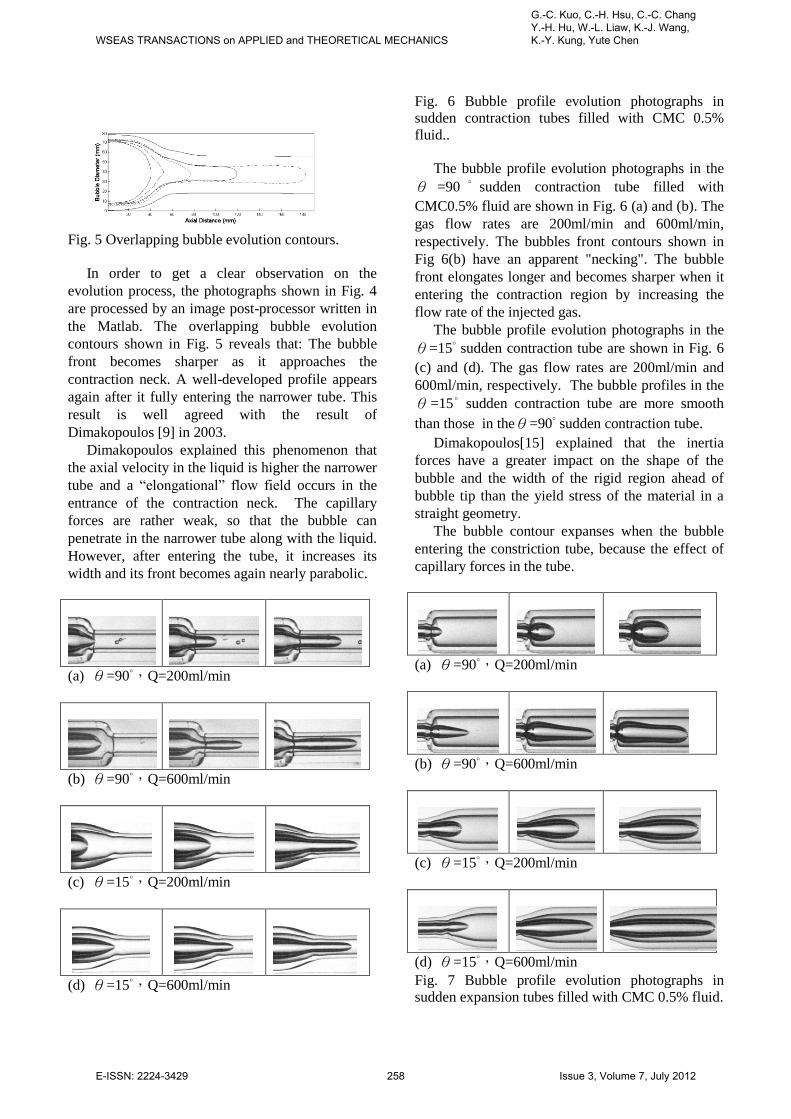
Fig. 5 Overlapping bubble evolution contours.
In order to get a clear observation on the
evolution process, the photographs shown in Fig. 4
are processed by an image post-processor written in
the Matlab. The overlapping bubble evolution
contours shown in Fig. 5 reveals that: The bubble
front becomes sharper as it approaches the
contraction neck. A well-developed profile appears
again after it fully entering the narrower tube. This
result is well agreed with the result of
Dimakopoulos [9] in 2003.
Dimakopoulos explained this phenomenon that
the axial velocity in the liquid is higher the narrower
tube and a “elongational” flow field occurs in the
entrance of the contraction neck. The capillary
forces are rather weak, so that the bubble can
penetrate in the narrower tube along with the liquid.
However, after entering the tube, it increases its
width and its front becomes again nearly parabolic.
(a) θ=90˚,Q=200ml/min
(b) θ=90˚,Q=600ml/min
(c) θ=15˚,Q=200ml/min
(d) θ=15˚,Q=600ml/min
Fig. 6 Bubble profile evolution photographs in
sudden contraction tubes filled with CMC 0.5%
fluid..
The bubble profile evolution photographs in the
θ =90 ˚ sudden contraction tube filled with
CMC0.5% fluid are shown in Fig. 6 (a) and (b). The
gas flow rates are 200ml/min and 600ml/min,
respectively. The bubbles front contours shown in
Fig 6(b) have an apparent "necking". The bubble
front elongates longer and becomes sharper when it
entering the contraction region by increasing the
flow rate of the injected gas.
The bubble profile evolution photographs in the
θ=15˚ sudden contraction tube are shown in Fig. 6
(c) and (d). The gas flow rates are 200ml/min and
600ml/min, respectively. The bubble profiles in the
θ=15 ˚ sudden contraction tube are more smooth
than those in theθ=90˚ sudden contraction tube.
Dimakopoulos[15] explained that the inertia
forces have a greater impact on the shape of the
bubble and the width of the rigid region ahead of
bubble tip than the yield stress of the material in a
straight geometry.
The bubble contour expanses when the bubble
entering the constriction tube, because the effect of
capillary forces in the tube.
(a) θ=90˚,Q=200ml/min
(b) θ=90˚,Q=600ml/min
(c) θ=15˚,Q=200ml/min
(d) θ=15˚,Q=600ml/min
Fig. 7 Bubble profile evolution photographs in
sudden expansion tubes filled with CMC 0.5% fluid.
WSEAS TRANSACTIONS on APPLIED and THEORETICAL MECHANICS
G.-C. Kuo, C.-H. Hsu, C.-C. Chang Y.-H. Hu, W.-L. Liaw, K.-J. Wang, K.-Y. Kung, Yute Chen
E-ISSN: 2224-3429 258 Issue 3, Volume 7, July 2012

The bubble profile evolution photographs in the
θ=90˚ sudden expansion tube filled with CMC0.5%
fluid are shown in Fig. 7(a) and (b). The gas flow
rates are 200ml/min and 600ml/min, respectively.
The bubble profile is close to an ellipse with
stable and symmetrical shape as the flow rate of
injection gas Q=200ml/min. However, the shape of
the bubble profile gets longer and sharper with some
unstable and asymmetric behaviour as the flow rate
of injection gas Q=600ml/min. A more speedy,
narrow and sharp bubble contour is formed in the
tube by increasing the injected gas flow rate. Due to
the changes of fluid viscoelasticity and expansion
angle, the transmission differences of the velocity
field and pressure field may leads to the instability
of the flow field.
Fig. 7(c) and (d) show the bubble profile
evolution photographs in the θ =15 ˚ sudden
expansion tube filled with CMC0.5% fluid. Similar
to Fig. 7 (a), the bubble profile is close to an ellipse
with stable and symmetrical shape as the flow rate
of injection gas Q=200ml/min. The bubble profile
gets longer and sharper with a stable and
symmetrical shape by increasing the flow rate of
injection gas till Q=600ml/min.
In 1980, Pitts showed that when the bubble
velocity increases, the ratio of bubble diameter to
the tube diameter will decrease monotonously to 0.5.
However, Kamisli et al. considered the impact of
bubble velocity as well as surface tension on the
shape of the bubbles in 2006.
Dimakopoulos explained in 2007 that due to the
development of ‘lip’ or ‘corner’ vortices and small
Reynolds numbers on the expanding side of the tube,
the bubble extended distortions on the free surface
near the expansion corner.
As the bubble front passing through the
expansion corner, it is affected by the inertia force
and the surface tension. As the inertia force caused
by the velocity of injected gas is more significant,
the bubble profile elongates along the flow line,
resulting in the development of the slender bubble
profile. In other hands, as the surface tension caused
by the interface of the gas and the viscoelastic fluid
is more significant, it expanses radially to form an
ellipse-like profile.
3.1.2 Velocity of Bubble Front
The velocity of bubble front penetrating through
CMC0.5% fluid inθ=15∘, 45∘and 90∘ sudden
contraction/expansion tubes are shown in Fig. 8.
A common trend of the velocity development in the
sudden contraction/expansion tubes is described as
below: The bubble front accelerates from the
contraction neck (z=20 cm) to the position of
highest velocity (z=45 cm). Subsequently, the
bubble is decelerated till a velocity which is slightly
larger than the exit velocity as the bubble front
reaches the sudden expansion corner (z=60 cm).
For different incident gas flow rates (Q), the
bubble front velocities under Q = 600 mL / min is
significantly higher than those under Q = 200 mL /
min. Fig. 8 also shows that the bubble front velocity
inreases by increasing the sudden contraction /
expansion angle (θ) under the same incident gas
flow rate.
0 20 40 60 80 100
0
20
40
60
80
100
120
140
V (c
m/s
)
z (cm)
θ =15o Q=200
θ =15o Q=600
θ =45o Q=200
θ =45o Q=600
θ =90o Q=200
θ =90o Q=600
Fig. 8 Velocity of Bubble Front in sudden
contraction/expansion tubes filled with CMC0.5%
fluid.
3.1.3 Fractional converge In this paper, the fractional converge (m) of the
liquid is estimated by
. Where Rb is the radius
of bubble and Ro is the radius of inner tube. The
radius of bubble Rb is measured at 1.5Ro
downstream away from the bubble tip according to
the result suggested by Cox showed in 1962.
The fractional converges inθ=15˚, 45˚ and 90˚ sudden contraction/expansion tubes filled with
CMC0.5% fluid are shown in Fig. 9. A common
trend for incident gas flow rate Q=600 ml/min is
described as below: (1) In the interval 10 cm<z<20
cm, as the bubble front approaching the contraction
neck, the fractional converge (m) increases rapidly.
(2) In the interval 20 cm<z<50 cm, as the bubble
front fully entering the contraction tube, m also
increses. (3) In the interval 50 cm<z<60 cm, as the
bubble front approaching the, m deceases rapidly. (4)
In the interval 60 cm<z<90 cm, as the bubble front
WSEAS TRANSACTIONS on APPLIED and THEORETICAL MECHANICS
G.-C. Kuo, C.-H. Hsu, C.-C. Chang Y.-H. Hu, W.-L. Liaw, K.-J. Wang, K.-Y. Kung, Yute Chen
E-ISSN: 2224-3429 259 Issue 3, Volume 7, July 2012
entering fully the expansion tube, m almost keeps a
constant value.
Fig.6(b) shows a slender bubble profile which is
away from the tube wall farther at the contraction
neck inθ=90∘sudden contraction/expansion tubes
for Q=600 ml/min. Therefore, the fractional
converge of the fluid in the wall is larger.
The fractional converge of fluid changes
depending on the effect of the viscosity of the fluid,
the incident gas flow rate and the contraction /
expansion angle.
The fractional converge of fluid increases as the
sudden contraction/expansion angle or the injection
gas flow rate increases.
0 20 40 60 80 1000.15
0.20
0.25
0.30
0.35
0.40
0.45
0.50
0.55
0.60
0.65
m
z (cm)
θ =15o Q=200
θ =15o Q=600
θ =45o Q=200
θ =45o Q=600
θ =90o Q=200
θ =90o Q=600
Fig. 9 Fractional converges inθ=15˚, 45˚ and 90˚
sudden contraction/expansion tubes filled with
CMC0.5% fluid.
Dimakopoulos et al.[15] in 2007 described that
the distribution of the remaining film on the inner
tube wall is non-uniform and only partly follows the
tube geometry: it is thinner in the expanding section
of the tube, thicker in the contracting one. And they
declared that the remaining film thickness depends
on liquid inertia and yield stress.
The fractional converge of fluid changes
depending on the effect of the viscosity of the fluid,
the incident gas flow rate and the contraction /
expansion angle.
Under a constant incident gas flow rate, the
bubble front velocity increases by increasing the
contraction/expansion angle. This will lead to the
decreasing diameter of the bubbles as well as the
increasing fractional converges of fluid.
The bubble front velocity increases by increasing
the incident gas flow. This will also lead to the
decreasing diameter of the bubbles as well as the
increasing fractional converges of fluid.
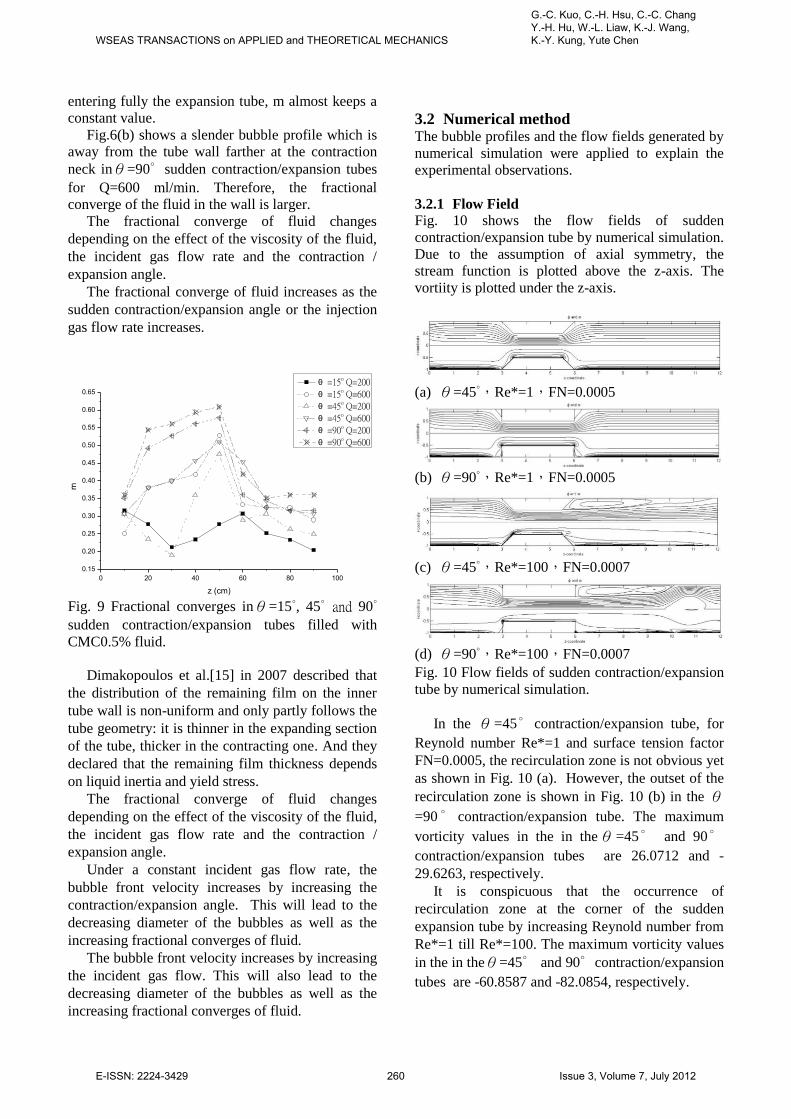
3.2 Numerical method The bubble profiles and the flow fields generated by
numerical simulation were applied to explain the
experimental observations.
3.2.1 Flow Field
Fig. 10 shows the flow fields of sudden
contraction/expansion tube by numerical simulation.
Due to the assumption of axial symmetry, the
stream function is plotted above the z-axis. The
vortiity is plotted under the z-axis.
(a) θ=45˚,Re*=1,FN=0.0005
(b) θ=90˚,Re*=1,FN=0.0005
(c) θ=45˚,Re*=100,FN=0.0007
(d) θ=90˚,Re*=100,FN=0.0007
Fig. 10 Flow fields of sudden contraction/expansion
tube by numerical simulation.
In the θ=45∘contraction/expansion tube, for
Reynold number Re*=1 and surface tension factor
FN=0.0005, the recirculation zone is not obvious yet
as shown in Fig. 10 (a). However, the outset of the
recirculation zone is shown in Fig. 10 (b) in the θ
=90 ∘ contraction/expansion tube. The maximum
vorticity values in the in theθ=45∘ and 90∘
contraction/expansion tubes are 26.0712 and -
29.6263, respectively.
It is conspicuous that the occurrence of
recirculation zone at the corner of the sudden
expansion tube by increasing Reynold number from
Re*=1 till Re*=100. The maximum vorticity values
in the in theθ=45∘ and 90∘contraction/expansion
tubes are -60.8587 and -82.0854, respectively.
WSEAS TRANSACTIONS on APPLIED and THEORETICAL MECHANICS
G.-C. Kuo, C.-H. Hsu, C.-C. Chang Y.-H. Hu, W.-L. Liaw, K.-J. Wang, K.-Y. Kung, Yute Chen
E-ISSN: 2224-3429 260 Issue 3, Volume 7, July 2012

The developments of ‘lip’ or ‘corner’ vortices on
the corner are reported by Dimakopoulos repoted in
2007. The occurrence of recirculation zone and the
developments of ‘corner’ vortices may cause the
instability phenomenon shown in Fig.7(b).
3.2.2 Bubble evolution contours
Fig. 11 shows the contours of bubble penetrating
through the viscoplastic fluids in the
contraction/expansion tubes by numerical method.
Fig. 11 (a) and (b) show the bubble front
contours in the contraction/expansion tubes with θ
=45∘and 90∘as Re*=1,E*=0.0005,FN=0.0005
at time steps (t*): 1000, 1200, 1400, 1600, 1800,
2000, 2200, 2400, 2900, 3400, 3900, 4400 and 4900.
As the bubble front approaching the shrinking
neck, the bubble front deforms into a sharper shape.
The bubble reassumes its well-developed profile
after fully entering the narrower tube. As the bubble
front runing through the expansion throat, it
increases its width and the bubble front becomes
nearly parabolic shown as in Fig. 11 (a) and (b).
These results are agreed with the result of
Dimakopoulos et al.[9] in 2003.
However, the bubble front in the θ= 90∘ tube
expanses more outward than that in theθ=45∘tube,
as the bubble front entering the expansion tube.
After entering the tube, it increases its width and its
front becomes again nearly parabolic, although a
local minimum in thickness remains in the
contraction region.
Fig. 11(c) and (d) show the bubble front contours
in the contraction/expansion tubes with θ=45∘and
90∘as Re*=100,E*=0.0005,FN=0.0005 at time
steps (t*): 200, 240, 280, 320, 360, 400, 440, 480,
580, 680, 780, 880 and 1000.
(a) θ=45˚,Re*=1,FN=0.0005
(b) θ=90˚,Re*=1,FN=0.0005
(c) θ=45˚,Re*=100,FN=0.0005
(d) θ=90˚,Re*=100,FN=0.0005
(e) θ=90˚,Re*=100,FN=0.0007
Fig. 11 Bubble evolution profiles in
contraction/expansion tubes by numerical method.
The effects of surface tension and inertia force
on the shape of bubbles can be verified by
comparing the differences of Fig. 11(d) and (e). The
bubble contour changes from the fingers shape into
an oval shape in the θ=90∘sudden expansion tube,
by increasing the factor of surface tension (FN). The
only difference factor between 11(d) and (e) is the
surface tension factor (FN). Therefore, the surface
tension can be considered as the impact factor.
If the surface tension affects the interface of gas
and fluid more significant, the bubble will expands
radially, and then the bubble contour is closer to the
oval. In the other hand, if the inertia force is more
significant, a slender bubble profile is formed. This
result is consistent with the results of the
experimental observations very well.
4 Conclusion This paper studies the behavior of a long bubble
through the viscoplastic fluids filled in a
contraction/expansion tube was studied
experimentally and numerically. As the bubble front approaching the shrinking
neck, the bubble front deforms into a sharper shape.
And then the bubble reassumes its well-developed
profile after fully entering the narrower tube. As the
bubble front penetrating through the expansion
corner, it increases its width and the bubble front
becomes nearly parabolic.
The bubble front velocity increases by increasing
the contraction/expansion angle under a constant
incident gas flow rate. Moreover, the bubble front
velocity increases by increasing the incident gas
flow. It also leads to the results including the
WSEAS TRANSACTIONS on APPLIED and THEORETICAL MECHANICS
G.-C. Kuo, C.-H. Hsu, C.-C. Chang Y.-H. Hu, W.-L. Liaw, K.-J. Wang, K.-Y. Kung, Yute Chen
E-ISSN: 2224-3429 261 Issue 3, Volume 7, July 2012

decreasing diameter of the bubbles as well as the
increasing fractional converges of fluid.
Therefore, the bubble front shape, bubble front
velocity and fractional converge of fluid changes
depending on the effects of the viscosity of the fluid,
the incident gas flow rate and the contraction /
expansion angle.
Acknowledgement
This research was supported by the Teacher
Research Support Scheme of Taoyuan Innovation of
Institute Technology/ grant no. 101P-001.
References:
[1] P. G. Saffman and F. R. S. Geoffrey Taylor,
The Penetration of a Fluid into a Porous
Medium or Hele-Shaw Cell Containing a More
Viscous Liquid, Proceedings of the Royal
Society of London. Series A, Mathematical and
Physical Sciences, vol. 245, 1958, pp. 312-329.
[2] G. I. Taylor, Deposition of a Viscous Fluid on
the Wall of a Tube, Journal of fluid mechanics,
vol. 10, 1961, pp. 161-165.
[3] E. Pitts, Penetration of gluid into a Hele-Shaw
cell: The Saffman-Taylor experiment, Journal
of fluid mechanics, vol. 97, 1980, pp. 53-64.
[4] Y. Takehiro, Three-dimensional viscoelastic
flows through a rectangular channel with a
cavity, J. Non-Newtonian Fluid Mech, vol. 114,
2003, pp. 13-31.
[5] D. A. Reinelt and P. G. Saffman, The
penetration of a finger into a viscous fluid in
channel and tube, SIAM J. Sci. Stat. Comput.,
vol. 6, 1985, pp. 542-561.
[6] J. H. Song and J. Y. Yoo, Numerical
Simulation of Viscoelastic Flow Through a
Sudden Contraction Using a Type Dependent
Difference Method, J.Non Newtonian Fluid
Mech., vol. 24, 1987, pp. 221-243.
[7] C. H. Hsu, P. C. Chen, K. Y. Kung, G. C. Kuo,
The Gas-assisted Expelled Fluid Flow in the
Front of a Long Bubble in a Channel, WSEAS
TRANSACTIONS on APPLIED and
THEORETICAL MECHANICS, Vol. 4, 2010,
pp.11-21.
[8] P. C. Huzyak and K. W. Koelling, The
penetration of a long bubble through a
viscoelastic fluid in a tube, Journal of Non-
Newtonian Fluid Mechanics, vol. 71, 1997, pp.
73-88.
[9] Y. Dimakopoulos and J. Tsamopoulos,
Transient displacement of a viscoplastic
material by air in straight and suddenly
constricted tubes, Journal of Non-Newtonian
Fluid Mechanics, vol. 112, 2003, pp. 43-75.
[10] Y. Dimakopoulos and J. Tsamopoulos, On the
gas-penetration in straight tubes completely
filled with a viscoelastic fluid, Journal of Non-
Newtonian Fluid Mechanics, vol. 117, 2004, pp.
117-139.
[11] Y. Dimakopoulos and J. Tsamopoulos,
Transient displacement of Newtonian and
viscoplastic liquids by air in complex tubes,
Viscoplastic fluids: From theory to application,
vol. 142, 2007, pp. 162-182.
[12] M. Ohta, et al., Dynamic processes in a
deformed drop rising through shear-thinning
fluids, Journal of Non-Newtonian Fluid
Mechanics, vol. 132, 2005, pp. 100-107.
[13] I. Christie, et al., Flow of a non-Newtonian
fluid between eccentric rotating cylinders,
International Journal of Engineering Science,
vol. 25, 1987, pp. 1029-1047.
[14] K. R. Rajagopal, et al., A note on the falkner-
skan flows of a non-newtonian fluid,
International Journal of Non-Linear Mechanics,
vol. 18, 1983, pp. 313-320.
[15] Y. Dimakopoulos and J. Tsamopoulos,
Transient displacement of Newtonian and
viscoplastic liquids by air in complex tubes,
Journal of Non-Newtonian Fluid Mechanics,
vol. 142, 2007, pp. 162-182.
[16] C. H. Hsu, K. Y. Kung,P. C. Chen, S. Y. Hu,
THE VISUALIZATION OF GAS-ASSISTED
INJECTION LONG BUBBLE IN A TUBE,
Proceedings of the 8th WSEAS International
Conference on Applied Computer and Applied
Computational Science, 2011, pp.163-168.
[17] W.-Y. Dzan, H.-J. Yang, H.-C. Lin, A
Research of Digitizing Ship Design and
Stability Analysis, WSEAS TRANSACTIONS
on APPLIED and THEORETICAL
MECHANICS, Vol. 5, 2010, pp.11-22.
[18] D. Munger, A. Vincent, A Level Set Approach
to Simulate Magnetohydrodynamic Instabilities
in Aluminum Reduction Cells, Journal of
Computational Physics, vol. 217, 2006,
pp.295–311.
WSEAS TRANSACTIONS on APPLIED and THEORETICAL MECHANICS
G.-C. Kuo, C.-H. Hsu, C.-C. Chang Y.-H. Hu, W.-L. Liaw, K.-J. Wang, K.-Y. Kung, Yute Chen
E-ISSN: 2224-3429 262 Issue 3, Volume 7, July 2012