the global flow of aluminum from 2006 through 2025 - usgs
TRANSCRIPT

The Global Flow of Aluminum From 2006 Through 2025
By W.D. Menzie, JJ Barry, D.I. Bleiwas, E.L. Bray, T.G. Goonan, and Grecia Matos
Open-File Report 2010–1256
U.S. Department of the Interior U.S. Geological Survey

U.S. Department of the Interior KEN SALAZAR, Secretary
U.S. Geological Survey Marcia K. McNutt, Director
U.S. Geological Survey, Reston, Virginia: 2010
For more information on the USGS—the Federal source for science about the Earth, its natural and living resources, natural hazards, and the environment— visit http://www.usgs.gov or call 1–888–ASK–USGS. For an overview of USGS information products, including maps, imagery, and publications, visit http://www.usgs.gov/pubprod To order this and other USGS information products, visit http://store.usgs.gov
Suggested citation: Menzie, W.D., Barry, JJ, Bleiwas, D.I., Bray, E.L., Goonan, T.G., and Matos, Grecia, 2010, The global flow of aluminum from 2006 through 2025: U.S. Geological Survey Open-File Report 2010–1256, 73 p., available at http://pubs.usgs.gov/of/2010/1256/.
Any use of trade, product, or firm names is for descriptive purposes only and does not imply endorsement by the U.S. Government.
Although this report is in the public domain, permission must be secured from the individual copyright owners to reproduce any copyrighted material contained within this report.

Contents Executive Summary ....................................................................................................................................................... 1 1. Introduction ............................................................................................................................................................. 3 2. Background and Methods ....................................................................................................................................... 4
2.1. Life Cycle of Aluminum ..................................................................................................................................... 4 2.2. Previous Studies............................................................................................................................................... 6 2.3. Methods of Present Study ................................................................................................................................ 6
3. Findings .................................................................................................................................................................. 9 3.1. Global Mass Flows of Aluminum ...................................................................................................................... 9
3.1.1. Macro-Level Flows of Aluminum—Production ........................................................................................... 9 3.1.1.1. Bauxite ................................................................................................................................................ 9 3.1.1.2. Alumina ..............................................................................................................................................10 3.1.1.3. Aluminum ...........................................................................................................................................11
3.1.2. Micro-Level Flows of Materials Associated with Aluminum Production .....................................................14 3.1.2.1. Bauxite Mining ....................................................................................................................................15 3.1.2.2. Alumina Production (Refining) ............................................................................................................17 3.1.2.3. Aluminum Smelting and Electrolysis ..................................................................................................20
3.1.2.3.1. Aluminum Smelting and Electrolysis—Greenhouse Gas Emissions ............................................30 3.1.2.3.2. Aluminum Smelting and Electrolysis—Generation of PFCs (Anode Events) ...............................34 3.1.2.3.3. Industry Performance Goals ........................................................................................................34
3.1.2.4. Materials Inputs to and Outputs from Secondary Aluminum Production ............................................34 3.1.3. Global Mass Flows of Aluminum—Consumption ......................................................................................36
3.1.3.1. Consumption—Overview ....................................................................................................................36 3.1.3.2. Consumption—End Uses ...................................................................................................................38
3.1.3.2.1. Consumption for Transportation—Light Vehicles.........................................................................40 3.1.3.2.2. Consumption for Transportation—Aircraft ...................................................................................44 3.1.3.2.3. Consumption for Transportation—Railcars ..................................................................................46 3.1.3.2.4. Consumption for Transportation—Final Thoughts .......................................................................46
3.2. Future Global Mass Flows of Aluminum ..........................................................................................................46 3.2.1. Short- to Medium-Term Production Forecasts ..........................................................................................46
3.2.1.1. Bauxite ...............................................................................................................................................47 3.2.1.2. Aluminum ...........................................................................................................................................47
3.2.2. Long-Term Production Forecasts..............................................................................................................48 3.2.2.1. The Model for Forecasting Long-Term Aluminum Consumption ........................................................48
3.2.3. Forecasts ..................................................................................................................................................51 4. Conclusions ...........................................................................................................................................................54
4.1. Methods of Present Study (2.3) .......................................................................................................................54 4.2. Macro-Level Flows (3.1.1) ...............................................................................................................................54 4.3. Micro-Level Flows (3.1.2) ...............................................................................................................................54 4.4. Consumption (3.1.3) ........................................................................................................................................54 4.5. Future Global Mass Flows of Aluminum (3.2) ..................................................................................................55
4.5.1. Short- to Medium-Term Forecasts (3.2.1) .................................................................................................55 4.5.2. Long-Term Forecasts (3.2.2) ....................................................................................................................55 4.5.3. Implications of the Forecasts (3.2.3) .........................................................................................................55
5. References Cited ...................................................................................................................................................57 6. Appendixes ............................................................................................................................................................61
ii

iii
Figures 1. Diagram showing the global flow (life cycle) of aluminum in 2006 .................................................................... 5 2. Diagram showing a typical process flow for bauxite mining .............................................................................16 3. Diagram showing selected materials flows for a World bauxite mine model ....................................................17 4. Diagram showing a typical process flow for alumina refining ...........................................................................19 5. Diagram showing selected materials flows under the European and World alumina refinery models .............20 6. Diagram showing a typical process flow for aluminum smelting ......................................................................21 7. Diagram showing selected materials flows for the anode-making process of model European
and World plants ..............................................................................................................................................22 8. Bar chart showing air emissions for the anode-making process of model European and World plants ...........23 9. Bar chart showing externally recycled waste products for the anode-making process of
model European and World plants ..................................................................................................................24 10. Bar chart showing solid waste (landfill) for the anode-making process of model
European and World plants .............................................................................................................................25 11. Diagram showing selected materials flows for models of European and World aluminum smelters ................26 12. Bar chart showing air emissions for models of European and World aluminum smelters ................................27 13. Bar chart showing emissions to water for models of European and World aluminum smelters. ......................28 14. Bar chart showing externally recycled waste for models of European and World aluminum smelters .............29 15. Bar chart showing solid waste for models of European and World aluminum smelters ...................................30 16. Diagram of sources and distribution of fluorine during aluminum smelting ......................................................32 17. Diagram showing selected material flows for a European secondary aluminum smelter model in 2002 .........35 18. Graph showing aluminum consumption per capita measured against gross domestic product
per capita for the 20 most populous countries in 2006 ....................................................................................38 19. Graph showing percentage of aluminum consumption in electrical end uses against
gross domestic product per capita ...................................................................................................................39 20. Graph showing percentage of aluminum consumption in transportation end uses against
gross domestic product per capita ...................................................................................................................40 21. Graph showing aluminum consumption per capita against purchasing power parity
gross domestic product per capita in 2006 ......................................................................................................50 22. Graph showing aluminum consumption per capita against purchasing power parity
gross domestic product per capita in 2006 ......................................................................................................51
Tables 1. Global production of bauxite in 2006 ...............................................................................................................10 2. Global production of alumina in 2006 ..............................................................................................................11 3. Global production of primary and secondary aluminum in 2006 ......................................................................13 4. Selected metals industry contributions to greenhouse gas emissions in 2006 ................................................33 5. Greenhouse gas emission intensity of primary aluminum operations in 2005 .................................................33 6. Aluminum consumption per capita versus gross domestic product per capita for the 20 most
populous countries in 2006 ..............................................................................................................................37 7. Percentage of aluminum consumption by end use in populous countries with developing
economies and selected high-income countries ..............................................................................................38 8. Vehicle production, aluminum intensity, aluminum use in vehicles, aluminum consumption,
and selected data on aluminum consumption in transportation end uses ........................................................42 9. Comparison of shipments of aluminum to manufacturers of passenger cars and light trucks with the
estimated amount of aluminum contained in automobiles and light commercial vehicles in North America ..................................................................................................................................................43

iv
10. Estimated amount of aluminum used to manufacture forms of transportation other than passenger cars and light trucks for selected countries ......................................................................................................44
11. Estimated aluminum content of Airbus, Boeing, Bombardier, and Embraer aircraft delivered in 2006 ............45 12. Short- to medium-term (1- to 5-year) outlook for bauxite production ...............................................................47 13. Short- to medium-term (1- to 5-year) outlook for aluminum production ...........................................................48 14. Gross domestic product (GDP), population, aluminum consumption, per capita GDP, and aluminum
consumption per capita for the 40 most populous countries in 2006 ...............................................................49 15. Estimated population, purchasing power parity gross domestic product per capita, aluminum
consumption per capita, and aluminum consumption for 2015, 2020, and 2025 .............................................52
Conversion Factors Multiply By To obtain
Length
inch (in.) 2.54 centimeter (cm)
inch (in.) 25.4 millimeter (mm)
foot (ft) 0.3048 meter (m)
mile (mi) 1.609 kilometer (km)
Area acre
square foot (ft2)
square inch (in2)
square mile (mi2)
4,047
0.09290
6.452
2.590
square meter (m2)
square meter (m2)
square centimeter (cm2)
square kilometer (km2)
Volume ounce, fluid (fl. oz)
cubic inch (in3)
cubic foot (ft3)
0.02957
16.39
0.02832
liter (L)
cubic centimeter (cm3)
cubic meter (m3)
Mass ounce, avoirdupois (oz) 28.35 gram (g)
pound, avoirdupois (lb) 0.4536 kilogram (kg)
ton, short (2,000 lb) 0.9072 megagram (Mg) or metric ton (t)
Energy foot-pound (ft·lb) 1.356 joule (J)
horsepower (HP) 746 watt (W)
Temperature in degrees Celsius (°C) may be converted to degrees Fahrenheit (°F) as follows: °F=(1.8×°C)+32.

1
The Global Flow of Aluminum From 2006 Through 2025
By W.D. Menzie, JJ Barry, D.I. Bleiwas, E.L. Bray, T.G. Goonan, and Grecia Matos
Executive Summary This report presents results of an investigation of the global flow of materials related to the
production and use of aluminum in 2006 and makes projections to 2025. The report was prepared in cooperation with the U.S. Environmental Protection Agency for the Organisation for Economic Co-operation and Development, Environmental Policy Committee’s Working Group on Waste Prevention and Recycling. The report addresses the major resource flows and effects of those flows and provides insights on the life cycle of aluminum; it does not address policy issues related to the production and use of aluminum.
The report describes the flow of aluminum for 2006 at a macro level (country and global scales) based mainly on production data for bauxite, alumina, and aluminum gathered by the U.S. Geological Survey (USGS). Compared with findings from previous studies, this report estimates a similar level for the flow of primary aluminum (aluminum made from bauxite). The flow of secondary aluminum (aluminum made from fabrication and post-consumer scrap), however, is lower than that estimated by previous studies; this discrepancy should be further investigated.
The report also describes flows of materials associated with the production of primary and secondary aluminum at the micro level. These materials include both major inputs to bauxite, alumina, and aluminum production and outputs from that production. Outputs of significant environmental concern include red mud that is produced as a result of the production of alumina from bauxite, and greenhouse gases (including CO2 from electricity generation and perfluorocarbons that are produced during electrolysis) that are produced as a result of the smelting of alumina to produce aluminum.
The consumption of aluminum by end-use category in high-income countries compared with that in low- to middle-income countries is analyzed. The leading use of aluminum in many high-income countries is to produce goods in the transportation sector. In low- to middle-income countries, aluminum is used mainly in the production of electrical systems and by the construction industry. Differences in the end uses of aluminum by income have important implications for the recovery of post-consumer scrap because the in-service life of electrical systems and construction uses is much longer than that of many transportation uses.
The report investigates the end uses of aluminum by the transportation sector in some detail. In particular, the report examines the use of aluminum in the manufacture of automobiles and commercial aircraft. Production of these goods generates different amounts of fabrication scrap and the goods have different in-service periods, which are two factors that are important to recovery of aluminum scrap.
Aluminum production and consumption may be considered as the two sides of a single coin for the purposes of materials flow analysis. Consequently, the report presents both short- and medium-term forecasts of aluminum production based on a USGS compilation of planned changes in bauxite and aluminum production capacity on a country-by-country basis and a long-term forecast (to 2025) of aluminum consumption based a new method of analyzing and projecting future aluminum flows. The

2
method combines a model that predicts aluminum consumption from economic growth rates with information about changes in end-use consumption that occur with changes in income to forecast levels of aluminum consumption and to draw inferences about the availability of aluminum scrap.
Based upon announced production plans, the capacity of bauxite mines worldwide is expected to increase to 270 million metric tons (Mt) by 2015 from 183 Mt in 2006, or by almost 48 percent. Future aluminum production capacity based upon announced production plans is expected to reach 61 Mt in 2015 compared with 45.3 Mt in 2006, which is an increase of 35 percent, or almost 3.4 percent per year.
By 2025, aluminum consumption is likely to increase by more that 2.5 times to 120 Mt compared with 45.3 Mt in 2006. This represents a growth rate of 4.1 percent per year. Most of the increased consumption will take place in countries that consumed only modest amounts of aluminum in 2006. China, which consumed about 6.6 kilograms per capita in 2006, is expected to consume 28.7 kilograms per capita in 2025. Russia, Brazil, and India also are expected to increase their aluminum consumption significantly. Consumption in high-income countries is not expected to change significantly on a per capita basis, but total consumption may change modestly owing to changes in population.
To meet the projected consumption of 120 Mt of aluminum, the world would need to produce about 570 Mt of bauxite and about 230 Mt of alumina. This production will generate significant levels of waste even if technological improvements are made to current production processes.
A key question related to this projected increase in consumption is what portion of the consumption will be satisfied by primary aluminum and what portion will be sourced from secondary aluminum, as this will have a considerable influence on the amount of greenhouse gases generated by aluminum production. That portion of secondary aluminum that comes from new scrap is likely to increase proportionately with overall consumption. The data on changing patterns of end use that come with increased income, however, suggest that, at least initially, the proportion of aluminum that is generated from old scrap may decrease as countries undergoing economic growth initially use aluminum to develop new infrastructure, which has a long term of in-service use. Later, recycling of post-consumer scrap could increase.
If the proportion of aluminum production that comes from primary smelters increases, at least until 2025, a reduction in greehhouse gases from aluminum production must come from increases in the efficiency of aluminum smelters or from reduced use of fossil fuels to generate the electricity used in aluminum production.

3
1. Introduction This study was undertaken at the request of the U.S. Environmental Protection Agency to
support the Organisation for Economic Co-operation and Development, Environmental Policy Committee’s Working Group on Waste Prevention and Recycling. The Working Group commissioned case studies of four different materials [wood fibers, plastics, critical metals (those used in electronics), and aluminum] to examine the role that materials flow studies might play in the development of policy to promote sustainable materials management. The Working Group identified four key questions it hopes to address through the case studies— 1. What are the major resource flows and environmental impacts and how are they expected to evolve
in the future? To what extent is natural capital preserved? 2. How can new insights be gained and translated into new measures by taking a life cycle perspective?
To what extent has it been possible to consider the complete materials life cycle? 3. What policy measures have been taken or can be taken to stimulate sustainable environmental,
economic, and social outcomes? 4. To what extents are different actors in society engaged in taking up active ethically based
responsibilities for sustainable outcomes? This study of aluminum addresses the first two questions.

4
2. Background and Methods 2.1. Life Cycle of Aluminum
Aluminum is one of the most important metals used by modern societies. Aluminum’s combination of physical properties results in its use in a wide variety of products, many of which are indispensable to modern life. Because of its light weight and electrical conductivity, aluminum wire is used for long-distance transmission of electricity. Aluminum’s strength, light weight, and workability have led to increased use in transportation systems, including light vehicles, railcars, and aircraft, as efforts to reduce fuel consumption have increased. Aluminum’s excellent thermal properties and resistance to corrosion have led to its use in air conditioning, refrigeration, and heat-exchange systems. Finally, its malleability has allowed it to be rolled and formed into very thin sheets used in a variety of packaging.
Figure 1 is a generalized model of the entire life cycle, or flow, of aluminum. Primary aluminum production begins with the mining of bauxite, which is processed first into alumina and subsequently into aluminum metal. The main wastes from bauxite mining are tailings produced by grinding and washing the bauxite. The processing of bauxite to alumina involves initial chemical processing of the bauxite. The main waste from alumina refining is the production of “red mud,” a waste that is usually disposed of in a landfill. The electrolysis of alumina to produce aluminum involves the use of aluminum fluoride, carbon anodes, and large amounts of electricity. The most significant waste products from the production of aluminum from alumina are air emissions, including perfluorocarbon (PFC) gases and carbon dioxide (CO2) from the production of anodes and electricity.

5
Figure 1. Diagram showing the global flow (life cycle) of aluminum in 2006. Data are in metric tons; emissions are in italics. Modified from Martchek (2007).

6
Following smelting of the alumina to produce aluminum, the metal is poured into several basic shapes. These shapes are then fabricated into semimanufactured goods and then processed into finished goods. Fabrication may involve rolling the metal into sheets, casting the metal into shapes, drawing the metal into wire, or extrusion of the metal to produce different shapes. The amount of waste, or scrap, from fabrication and manufacture varies, depending on individual processes. For example, cutting of aluminum sheet produces significant amounts of scrap whereas casting aluminum parts produces little scrap. Scrap from fabrication and the manufacture of finished goods is generally recycled and is called new scrap. The main end uses, or classes, of aluminum-bearing goods include buildings (construction), durable goods, electrical (power), machinery, packaging, and transportation. Old, or post-consumer, scrap is generated at various rates for different types of goods, depending on the in-service life of the goods and the economics of collecting and recovering aluminum from the good.
2.2. Previous Studies The present report relies upon several seminal studies of U.S. and global aluminum flows.
Martchek (2006) describes a model developed by Alcoa Inc. to provide estimates of the global aluminum flows and system losses from 1950 to 2003. Resource requirements and life cycle flows were estimated by combining aluminum flows with global average life cycle flow data developed from producers through the International Aluminium Institute (IAI). The model shows mass flows for primary and secondary (recycled) aluminum, including material from fabrication and manufacture of finished products; total aluminum in use; and three classes of losses (losses in recycling, material sent to landfills, and material under study). Recycled material is broken into four classes—aluminum skimmed in ingot production, internal scrap generated in the aluminum smelter, new scrap generated by fabricators, and old scrap generated by consumers of final goods. The amount of aluminum in the different types of scrap was estimated by teams of experts using statistical data and technical literature on aluminum production. The model used historic end-use data from regional aluminum associations to estimate future disposition of aluminum production. Martchek (2006) also presents data on past production of greenhouse gases (GHGs) and estimates of future GHG emissions from aluminum production that take into account increased use of recycled (secondary) aluminum and reductions in emissions in the production of primary aluminum.
Martchek (2007) presents updated estimates of global aluminum flows in 2006 and estimates of the amount of GHG emissions generated by the major steps leading to the production of aluminum ingot. IAI presents updated (2005) life cycle data for primary aluminum, including raw materials and energy use, air and water emissions, and solid wastes generated (International Aluminium Institute, 2007).
In recent years, numerous reports on the flow of metals have appeared in the technical literature (see, for example, reports by Graedel and his colleagues at the Center for Industrial Ecology at Yale University). Two reports that are applicable to aluminum flows include those of Hatayama and others (2007) and Chen and others (2009).
2.3. Methods of Present Study The method developed for the Alcoa and IAI studies require some data and capabilities that were
not available for the present study. In particular, this study lacked long-term data on end uses of aluminum in different regions, data on the flow within smelters, and the availability of experts who could estimate recycling rates. These deficiencies placed constraints on the study and required the development of an alternative method to estimate present and future aluminum flows. This study used data for 2006 so that flows common to this study and the IAI model can be compared and so more

7
detailed flows from the Alcoa and IAI studies can be used with this study to obtain a more complete picture of flows associated with aluminum production and use.
The forecast in the present study is based on a model that relates resource consumption (use) to average national income as measured by gross domestic product (GDP) per capita. Previous studies (DeYoung and Menzie, 1999; Menzie, DeYoung, and Steblez, 2001) have shown that industrial consumption of such metals as copper and aluminum is low at low levels of income and high but stable once a threshold income is reached. As countries increase their per capita income, industrial consumption increases rapidly until the threshold is reached. Previous studies also show that the 20 most populous countries typically consume about 70 percent of global production. As a result, this study focuses on high-income populous countries and selected populous countries experiencing rapid economic growth.
This study summarizes global (macro-level) aluminum mass flows in terms of the production of bauxite, alumina, and primary and secondary aluminum, and the apparent consumption of aluminum. All production data, except the estimated secondary aluminum production for Russia, are taken from the aluminum chapter (Bray, 2010a) of volume I of the USGS Minerals Yearbook (MYB) and various country chapters of volume III of the MYB. An estimate of Russia’s secondary aluminum production was made based upon Grishayev and Petrov (2008). Consumption data were taken from various publications of the World Bureau of Metal Statistics (www.world-bureau.com) or were calculated from USGS production data and trade data from the United Nations Comtrade database (comtrade.un.org).
Micro-level flows of materials associated with the production of primary aluminum are presented as a model of materials inputs to and outputs from the production of primary aluminum from bauxite; the model, which was developed by Goonan and Bleiwas, is based upon input and output data from the IAI and the European Aluminium Association (EAA). The model consists of the following three submodels: (1) a model of the inputs to and outputs from bauxite mining, (2) a model of alumina production, and (3) a model of primary aluminum production. The alumina and primary aluminum models cover two cases—a model of world plants and a model of European plants. An additional model examines the inputs to and outputs from the secondary aluminum production process. These models are used to estimate inputs to and outputs from various parts of the bauxite to alumina to aluminum production process and the aluminum remelt production process.
Aluminum consumption per capita and the end uses of aluminum were examined for the following high-income countries and low- and middle-income countries with rapidly growing economies—Argentina, Brazil, China, France, Germany, India, Japan, Mexico, Russia, the United Kingdom, and the United States. End-use data are reported for different classes for different countries. In spite of differences in classification, the end-use data suggest some broad changes in the end uses of aluminum as income increases. The end-use statistics have been compared with light vehicle manufacturing and vehicle aluminum intensity data (Ducker Worldwide LLC, 2008, p. 38) to further specify the use of aluminum. Data on commercial aircraft production and weight were collected for four important aircraft manufacturers—Airbus, Boeing, Bombardier, and Embraer. An estimate that 80 percent of the weight of an aircraft is aluminum was used with these data to estimate the aluminum in use in commercial aircraft. For vehicles and aircraft, scrap that was generated in the process of manufacture was estimated.
Future mass flows of aluminum are estimated by two methods. Short- to medium-term (2008 to 2015) flows were estimated using aluminum outlooks published in the regional summary chapters of volume III of the MYB (Fong-Sam and others, 2009, p. 1.17; Anderson and others, 2010, p. 1.27; Levine and others, 2010, p. 1.35; Mobbs and others, 2010, p. 1.9; Yager and others, 2010, p. 1.18). The outlooks are compilations based upon industry announcements of new or expanded plant capacity.

8
Longer-term flows are estimated using a logistic regression linking aluminum consumption per capita to GDP per capita, which is a measure of income. The model uses the logistic regression, population growth rates, and 10-year forecasts of economic growth for each of the 20 most populous countries to estimate future consumption. Estimates of aluminum consumption are combined with the models of materials inputs and outputs to make status quo estimates of material requirements and the wastes generated.

9
3. Findings 3.1. Global Mass Flows of Aluminum
This report considers material flows related to the production, use, and recycling of aluminum at the macro and micro levels. The macro-level flows include the production from bauxite, alumina, and primary aluminum; the consumption of aluminum by end-use; and the production of secondary aluminum. Micro-level flows of materials associated with the production of primary and secondary aluminum include the inputs to and outputs from the production of bauxite, alumina, primary aluminum, and secondary aluminum. These flows are presented in terms of 1 metric ton (t) of output of each product. Environmental issues related to the production of each product are discussed in terms of the outputs that result in the issue.
3.1.1. Macro-Level Flows of Aluminum—Production Production data on bauxite, alumina, and primary and secondary aluminum production are in
tables 1 through 3, respectively. Data on the location, ownership, and production capacity of the majority of the bauxite, alumina, and aluminum production facilities are in appendixes 1 through 3, respectively. For most facilities, appendixes 1 through 3 reflect their characteristics in 2007.
3.1.1.1. Bauxite
Based upon data in volumes I and III of the MYB, just over 183 million metric tons (Mt) of bauxite was produced in 2006; of this amount, 50 Mt was produced in the Americas; 104 Mt, in Asia; 9.6 Mt, in Europe and Eurasia; and 18.8 Mt, in Africa and the Middle East. Six countries each produced more than 10 Mt of bauxite (Australia, 61.8 Mt; China, 27 Mt; Brazil, 22.8 Mt; Guinea, 16.3 Mt; Jamaica, 14.9 Mt; and India, 13.9 Mt) and together accounted for 85 percent of global production. The distribution of bauxite production reflects the geologic history and climatic factors that favor the formation of bauxite as well as economic factors, such as the cost of production at individual sites.

10
Table 1. Global production of bauxite in 2006. [Data are from USGS Minerals Yearbook 2007, v. I and III]
Region and country Quantity, in metric tons Americas:
Brazil 22,836,000 Guyana 1,479,000 Jamaica 14,865,000 Suriname 4,924,000 Venezuela 5,928,000
Total 50,032,000 Asia:
Australia 61,780,000 China 27,000,000 India 13,940,000 Indonesia 1,502,000 Malaysia 92,000 Pakistan 7,000 Vietnam 30,000
Total 104,351,000 Europe and Eurasia:
Bosnia and Herzegovina 854,000 France 168,000 Greece 2,163,000 Hungry 538,000 Kazakhstan 4,860,000 Russia 1,000,000
Total 9,583,000 Africa and the Middle East:
Ghana 886,000 Guinea 16,300,000 Iran 500,000 Mozambique 11,000 Sierra Leone 1,072,000 Tanzania 5,000
Total 18,774,000 World total 182,740,000
3.1.1.2. Alumina Global alumina production in 2006 was 74 Mt; of this amount, 20.9 Mt was produced in the
Americas; 35.1 Mt, in Asia; 16.2 Mt, in Europe and Eurasia; and 0.8 Mt, in Africa and the Middle East. Six countries produced more than 4 Mt of alumina—Australia, 18.3 Mt; China, 13.7 Mt; Brazil, 6.8 Mt; Russia, 6.4 Mt; the United States, 4.7 Mt; and Jamaica, 4.1 Mt—and they accounted for about 72 percent of global alumina production. Not all alumina is used to produce aluminum; about 10 percent of alumina is used to produce refractory and other chemical products. Thus, about 67 Mt of alumina was available for aluminum production. That four of the six leading alumina producers are also among the six leading bauxite producers follows from the transportation advantage obtained by colocating alumina production facilities near bauxite mines and thereby avoiding the cost of transporting the waste material associated with the bauxite.

11
Table 2. Global production of alumina in 2006. [Data are from USGS Minerals Yearbook 2007, v. I and III]
Region and country Quantity, in metric tons Americas:
Brazil 6,793,000 Canada 1,281,000 Jamaica 4,100,000 Suriname 2,153,000 United States 4,700,000 Venezuela 1,892,000
Total 20,919,000 Asia:
Australia 18,312,000 China 13,700,000 India 2,800,000 Japan 330,000
Total 35,142,000 Europe and Eurasia:
Azerbaijan 363,000 Bosnia and Herzegovina 394,000 France 200,000 Germany 850,000 Greece 775,000 Hungry 270,000 Ireland 1,800,000 Italy 1,090,000 Kazakhstan 1,515,000 Montenegro 237,000 Romania 622,000 Russia 6,399,000 Spain 1,000,000 Ukraine 1,672,000
Total 16,187,000 Africa and the Middle East:
Guinea 545,000 Iran 250,000
Total 795,000 World total 73,043,000
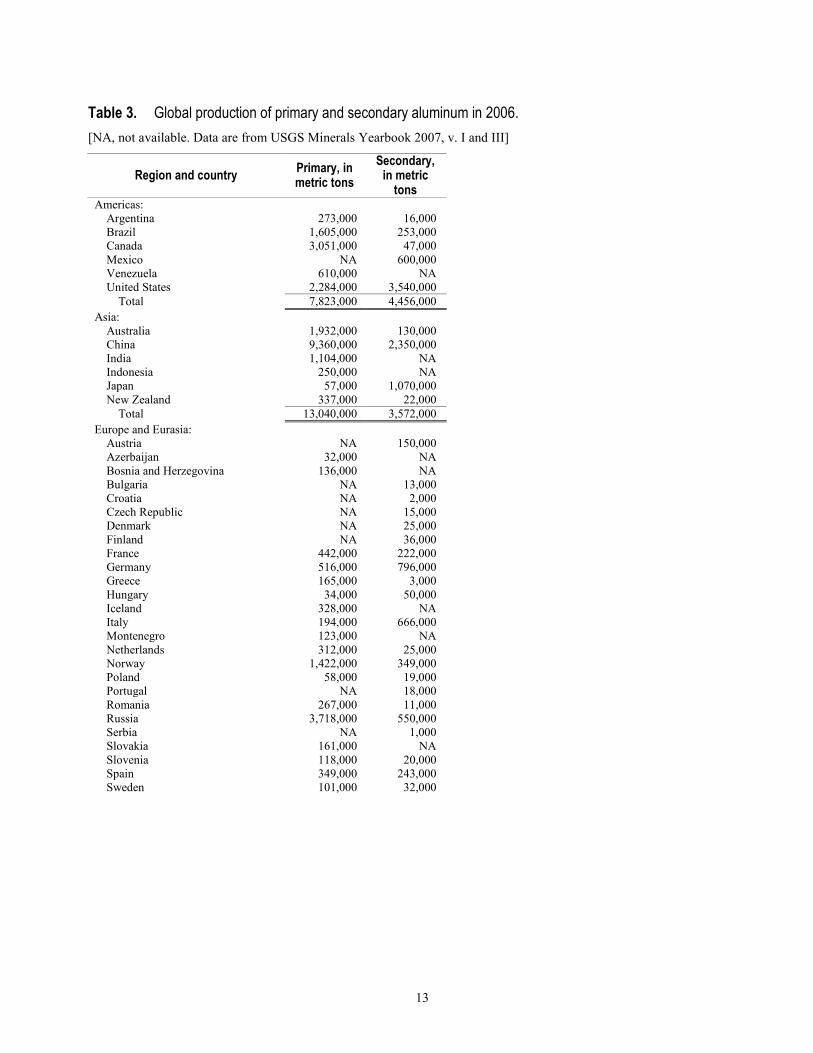
3.1.1.3. Aluminum Global production of aluminum in 2006 was about 45.9 Mt; 34 Mt was primary aluminum
produced by processing bauxite to alumina and then smelting the alumina to produce aluminum, and 11.8 Mt was secondary aluminum that was recovered from new scrap generated in the aluminum production process and old or post-consumer scrap. The Americas produced 7.82 Mt of primary aluminum; Asia, 13.0 Mt; Europe and Eurasia, 9.4 Mt; and Africa and the Middle East, 3.86 Mt. Eight countries produced at least 1 Mt of primary aluminum—China, 9.36 Mt; Russia, 3.72 Mt; Canada, 3.05 Mt; the United States, 2.28 Mt; Australia ,1.93 Mt; Brazil, 1.61 Mt; Norway, 1.42 Mt; and India, 1.10 Mt. Together, these eight countries accounted for about 72 percent of global primary aluminum production. Five of the six leading producers of primary aluminum were also among the six leading producers of alumina. Canada, which does not produce bauxite and was not one of the six leading producers of alumina, was the third ranked producer of primary aluminum. Abundant hydroelectricity led to the location of aluminum smelters in Canada. Aluminum smelting is energy intensive, and changes in the price and availability of energy result in the location of new smelters in areas with cheap

12
and available energy. The availability of abundant supplies of natural gas has led to the development of significant aluminum smelters in Bahrain and the United Arab Emirates in recent years. Both countries produced more than 850,000 t of aluminum in 2006. New aluminum smelters are being built in Iceland, such as the Fjardaal smelter, because of the availability of abundant electricity generated from hydropower and geothermal power. The imposition of carbon taxes or carbon emissions pricing could significantly affect the location of aluminum smelters as companies move facilities to countries with abundant, cheaper energy. The closure of several aluminum smelters in the United States in recent years has been, in large part, a response to increased energy costs.
Of the secondary aluminum output, the Americas produced 4.46 Mt; Asia, 3.57 Mt; and Europe and Eurasia, 3.77 Mt. Production of secondary aluminum in Africa and the Middle East was negligible. Based upon USGS data, the six leading producers of secondary aluminum in 2006 accounted for 79 percent of global production of secondary aluminum. The United States produced 3.54 Mt; China, 2.35 Mt; Japan, 1.07 Mt; Germany, 0.8 Mt; Italy, 0.66 Mt; and Mexico, 0.6 Mt.
Data on global aluminum flows for 2006 are shown in figure 1, which is modified from Martchek (2007). The main modification has been in the end-use classes; the classes used in figure 1 correspond to USGS usage and contains the classes—construction, durable goods, electrical (power), machinery, packaging, transportation, and other. The classes used in Martchek (2007) follow European usage—building, engineering and cable, packaging, transportation, and other. Some countries keep a separate class for fabricated metal, which includes aluminum used in steelmaking. The classes electrical and machinery are particularly important for accounting for aluminum use in countries that are building infrastructure and developing a manufacturing sector.
Figure 1 shows global bauxite production inflows in 2006 as 179.5 Mt, which is very similar to the USGS estimate of 183.5 Mt, and calculates alumina flows as 65.5 Mt compared with the 67 Mt estimated in section 3.1.1.2. Figure 1 also shows primary metal production of 34 Mt, which is essentially the same as the production statistics in the MYB. Figure 1 also shows flows of 34.8 Mt of recovered metal, 18.4 Mt from metal recovered as scrap from fabrication operations, 8.6 Mt recovered from losses during the process of manufacturing goods, and 7.8 Mt of material collected after use by consumers. The 18.4 Mt of material “recycled” within the smelter facilities does not get counted in government statistics, and many governments do not separately report material recycled from the processes of manufacturing goods and material recovered after its use by consumers. The total amount of material recovered from both manufacturing and post-consumer use, identified as secondary aluminum in government statistics, is estimated to be 16.4 Mt by the IAI but 11.8 Mt by the USGS. The IAI data suggest that almost one-half of secondary aluminum is from post-consumer material. Statistics on secondary aluminum production in the United States indicate that 35 percent of secondary aluminum comes from post-consumer material (Papp, 2009, p. 61.2). All secondary aluminum reported for members of the European Union (EU27), the European Free Trade Association (EFTA), and Japan together with the old scrap (post-consumer) portion of secondary aluminum for the United States amounts to only 5.4 Mt of material. Clearly, efforts to harmonize these data are warranted.
13
Table 3. Global production of primary and secondary aluminum in 2006. [NA, not available. Data are from USGS Minerals Yearbook 2007, v. I and III]
Region and country Primary, in metric tons
Secondary, in metric
tons Americas:
Argentina 273,000 16,000 Brazil 1,605,000 253,000 Canada 3,051,000 47,000 Mexico NA 600,000 Venezuela 610,000 NA United States 2,284,000 3,540,000
Total 7,823,000 4,456,000 Asia:
Australia 1,932,000 130,000 China 9,360,000 2,350,000 India 1,104,000 NA Indonesia 250,000 NA Japan 57,000 1,070,000 New Zealand 337,000 22,000
Total 13,040,000 3,572,000 Europe and Eurasia:
Austria NA 150,000 Azerbaijan 32,000 NA Bosnia and Herzegovina 136,000 NA Bulgaria NA 13,000 Croatia NA 2,000 Czech Republic NA 15,000 Denmark NA 25,000 Finland NA 36,000 France 442,000 222,000 Germany 516,000 796,000 Greece 165,000 3,000 Hungary 34,000 50,000 Iceland 328,000 NA Italy 194,000 666,000 Montenegro 123,000 NA Netherlands 312,000 25,000 Norway 1,422,000 349,000 Poland 58,000 19,000 Portugal NA 18,000 Romania 267,000 11,000 Russia 3,718,000 550,000 Serbia NA 1,000 Slovakia 161,000 NA Slovenia 118,000 20,000 Spain 349,000 243,000 Sweden 101,000 32,000

14
Table 3. Global production of primary and secondary aluminum in 2006.—Continued [NA, not available. Data are from USGS Minerals Yearbook 2007, v. I and III]
Region and country Primary, in metric tons
Secondary, in metric
tons Europe and Eurasia—Continued:
Switzerland 40,000 190,000 Tajikistan 414,000 NA Ukraine 113,000 130,000 United Kingdom 360,000 198,000 Uzbekistan NA 3,000
Total 9,403,000 3,767,000 Africa and the Middle East:
Bahrain 860,000 NA Cameroon 87,000 NA Egypt 252,000 NA Ghana 80,000 NA Iran 205,000 NA Kenya NA 2,400 Mozambique 564,000 NA South Africa 895,000 NA Turkey 60,000 NA United Arab Emirates 861,000 NA
Total 3,864,000 2,400 World total 34,130,000 11,797,000
3.1.2. Micro-Level Flows of Materials Associated with Aluminum Production The preceding section of this paper addresses macro-level flows of aluminum to understand the
production of aluminum goods and associated manufacturing wastes (primary scrap) and the generation of post-consumer wastes or scrap. This section of the paper focuses on the materials required to produce aluminum and the wastes generated in the production process; it is excerpted and modified from a draft manuscript by Goonan and Bleiwas, which presents models of the inputs to and outputs from the production of alumina from bauxite and of primary aluminum from alumina.
The IAI, the EAA, and others have been developing information on part of the aluminum life cycle through an Aluminum Sector Addendum, which addresses the Greenhouse Gas Protocol (for accounting and reporting) developed by the World Business Council for Sustainable Development in concert with the World Resources Institute. The IAI and EAA reports are the primary data sources for the information presented here.
The materials flows discussed in the sections that follow cover the primary production of aluminum, including bauxite mining (open pit), alumina production (Bayer process) and electrolytic smelting (Hall-Héroult process), and the production of secondary aluminum. Materials flow data in this report are taken from a 2008 report by the EAA, which developed two models (one for European plants and another for plants worldwide) for the various steps of the process to produce aluminum from bauxite. This report provides information about the steps used in primary aluminum production and is addressed to those interested in the generation of GHGs, red mud, and other effluvia associated with primary aluminum production. The inclusion of two models allows for the comparison of reductions in wastes that may be achieved just from adopting currently available technologies on a wider basis. Other opportunities for reducing air emissions by adopting enhanced technologies are discussed later in this section.

15
3.1.2.1. Bauxite Mining The aluminum industry consumes nearly 90 percent of the bauxite mined; the remainder is used
in abrasives, cement, ceramics, chemicals, metallurgical flux, refractory products, and miscellaneous products (Bray, 2010b). There are three main types of bauxite ore. They include trihydrate, which consists chiefly of gibbsite, Al2O3•3H2O; monohydrate, which consists mainly of boehmite, Al2O3•H2O; and mixed bauxite, which consists of gibbsite and boehmite. The proportion of trihydrate and monohydrate ores in this type of bauxite differs from deposit to deposit as do the type and amount of impurities, such as clay, iron oxide, silica, and titania. Clay, free silica, iron hydroxide, and silt are also common constituents of bauxite ore. The alumina content of bauxite ores ranges from 31 to 52 percent, averaging about 41 percent on a production-weighted basis (International Aluminium Institute, 2009b). This study addresses the flow of metallurgical-grade bauxite ores used to produce aluminum. These ores typically have a minimum Al2O3 content of 50 to 55 percent with a texture that ranges from powdery clay to indurated (hardened by cementation) masses.
Bauxite mining operations generally require a large support network, which often requires significant capital and operating costs. The great majority of the world’s bauxite ores are extracted by open-cut methods. Before mining of the ores can commence, it is usually necessary to remove overburden and to preserve the topsoil for post-mining rehabilitation. Most mines require the removal of 1 or 2 meters (m) of overburden (International Aluminium Institute, 2009b; Royal Boskalis Westminster NV, 2010). Bauxite ore bodies vary from 2 to 20 m in thickness (International Aluminium Institute, 2009b). The aerial extent can be highly variable.
Diesel-powered bulldozers, backhoes, front-end loaders, excavators, and haulage trucks are the principal tools used to remove and haul overburden and ore. The amount of equipment and the size of the equipment are dictated to a large extent by the mining environment (wet or dry, for example), stripping ratio, scale of production or capacity, and distance to shipment points. Additional equipment and materials required for the mining operation include roads, support vehicles, repair facilities, town site (houses, hospital, schools, and so forth), energy and freshwater production and distribution, communication systems, parts, and supplies. Rail and port facilities may be necessary, depending upon the location of the mine.
Some bauxite ores can be shipped directly to an alumina refinery without treatment because they are of sufficient grade and purity. Other ores may require added steps, such as size reduction and moisture content reduction prior to shipping. At some sites, the ore grade may be increased by removal of clays and other impurities by washing, wet screening, cycloning, and (or) sorting. Flotation is sometimes used to reduce the silica content of an ore. Blending of ores may also be used to maintain grade uniformity to meet specifications. Wastes (mostly clays) produced from processing are transported to and stored in tailings ponds. Ore that is to be transported appreciable distances to refineries is often dried to reduce shipping costs.
A small open pit bauxite mine may have an annual capacity of roughly 500,000 t of ore whereas the annual capacity of the largest mines approximates 23 Mt. Annual capacities of 3 Mt to 15 Mt of ore characterize most of the world’s open pit bauxite operations. Bauxite mines operate for long periods of time; some as long as 100 years or more. Presently, the amount of land being opened for new or expanded bauxite mining equals the amount of post-mining land being rehabilitated, such that the total land use for bauxite mining worldwide would equal approximately one-half of the land area of Manhattan Island (New York City). The greatest difference between pre- and post-mining land use is a tradeoff between farming (11 to 12 percent) and native forest (49 to 60 percent) (International Aluminium Institute, 2009b). Figure 2, which shows the bauxite mining process flow, is based on a description of bauxite mining at the Alcoa-owned Juruti Mine in Brazil (Alcoa Inc., 2009).

16
The EAA has modeled the typical world bauxite mine. Figure 3 shows the generalized materials flows associated with world bauxite mining (European Aluminium Association, 2008). Inputs and outputs per metric ton of bauxite mined are measured in kilograms (gross), metric tons (gross), and cubic meters. The model presented in figure 3 does not include materials included in overburden or mine waste.
Figure 2. Diagram showing a typical process flow for bauxite mining. Data are from Alcoa Inc. (2009).

Figure 3. Diagram showing selected materials flows for a World bauxite mine model. Data are from European Aluminium Association (2008, p. 23). kg, kilogram; kWh, kilowatthour; m3, cubic meter; t, metric ton.
17
3.1.2.2. Alumina Production (Refining)
Virtually all alumina commercially produced from bauxite is obtained by a process patented by Karl Josef Bayer (Austria) in 1888. The Bayer process involves the following steps: • Digestion.—Bauxite is ground and slurried into a caustic soda (NaOH), which is then pumped into
large pressure tanks called digesters. The sodium hydroxide reacts with the alumina minerals to form soluble sodium aluminate (NaAlOH).
• Clarification.—The solution from the digestion step is depressurized and processed through cyclones to remove coarse sand. The remaining fluid is processed in thickeners where flocculants are added to agglomerate solids, which are removed by cloth filters. These residues (red mud) are washed, combined, and discarded, and the clarified solution (containing the NaAlOH) is passed to the next step.
• Precipitation.—The solution from the clarification step is seeded with alumina seed (very small) crystals to aid precipitation of larger agglomerated alumina crystals. The product-sized crystals are separated from the small crystals (recycled as seed) and are washed to remove entrained caustic residue. The agglomerates are moved to the next step.

18
• Calcination.—The agglomerates of NaAlOH are placed in rotary kilns or stationary fluidized-bed calciners at temperatures that can exceed 960ºC (1,750 ºF), which drives off the chemically combined water, leaving a residue of commercial-grade alumina (Plunkert, 2006; Pontikes, 2005a).
Figure 4 shows the process flow for alumina refining (CiDRA Minerals Processing, Inc., 2010). Materials flows within the Bayer process are dependent on the grade of the bauxite being
processed and the amount and character of the nonalumina minerals contained in the bauxite. Figure 5 shows selected materials flows for a model “European” and “World” alumina refinery in 2005 (European Aluminium Association, 2008).
Figure 5 presents the inputs to and outputs from alumina production per metric ton of alumina as kilograms (gross), metric tons (gross), and cubic meters of the various materials. In 2005, the amount of bauxite required for a model European and World alumina refinery to produce 1 t of alumina was 2.2 t and 2.7 t, respectively, which indicates that, on average, European smelters were processing higher grade bauxite than the rest of the world. Red mud production from these models followed this trend reciprocally—that is, 706 kilograms per metric ton (kg/t) for the European model, and 1,142 kg/t for the World model (European Aluminium Association, 2008). Reduction of red mud waste by processing higher grade bauxite is not likely to represent a strategy for long-term sustainable production of aluminum because average grades of metals produced typically decline with time, as higher grade deposits are produced before lower grade ones.
The most important output from the Bayer process after alumina is red mud. The composition of red mud worldwide varies as follows: Fe2O3, 30 to 60 percent; Al2O3, 10 to 20 percent; SiO2, 3 to 50 percent; Na2O, 2 to 10 percent; CaO, 2 to 8 percent; and TiO2, trace to 25 percent. Red mud is a highly complex material and its ultimate chemistry depends on the nature of the original bauxite ore. It is highly alkaline and contains a variety of elements and mineral species in small sizes and contains as much as 50 percent water (Pontikes, 2005b).
In the past, red mud has been disposed of at sea or contained in lined lake-size containment compounds (Pontikes, 2005c). While these practices still are used, research is ongoing to find better ways to recycle and reuse red mud—for example, as building materials (bricks, and roofing and flooring tiles), catalysts, ceramics, fillers, fertilizers, lightweight aggregates, metallurgical fluxes, and in the recovery of other metals (Pontikes, 2005d–e). In 2008, alumina refining worldwide produced about 93.2 Mt of red mud, of which 83.9 Mt was attributable to aluminum production. The reuse of red mud offers an opportunity to develop new industries based upon the wastes from alumina production.

19
Figure 4. Diagram showing a typical process flow for alumina refining. From CIDRA Minerals Processing, Inc. (2010), used with permission.

20
Figure 5. Diagram showing selected materials flows under the European and World alumina refinery models. European model data are in plain black text, and World model data are in underlined red italic text. Data are from European Aluminium Association (2008, p. 24).
3.1.2.3. Aluminum Smelting and Electrolysis
Primary aluminum is produced by the electrolysis of alumina dissolved in molten fluoride salt. The process was independently invented in 1886 by Charles Martin Hall (United States) and Paul Louis Toussaint Héroult (France) and underwent continual improvement over the years. In the Hall-Héroult electrolytic reduction cell, alumina and aluminum fluoride are the material feedstocks. The carbon in anodes, which are either prebaked (in 90 percent of operations) or Söderberg-type (in 10 percent of operations), are consumed by reaction with the oxygen in the alumina to form carbon dioxide, which is ultimately released to the atmosphere. Figure 6 shows the process flows for aluminum smelting (Beck, 2008; European Aluminium Association, 2008). Ancillary to the aluminum reduction cell process is anode manufacturing, which generates additional emissions of concern.

21
Figure 6. Diagram showing a typical process flow for aluminum smelting. Copied by permission from the Electrochemistry Encyclopedia (http://electrochem.cwru.edu/encycl/) on March 1, 2010; the original material is subject to periodic changes and updates.
Anodes are critical to aluminum reduction. They carry the electric charge (which drives the reaction) to the cryolite (the alumina solvent) in the reduction cell, and they provide the carbon (which causes the anode to be continuously consumed) for the reduction reaction that strips the oxygen from the alumina and removes it to the atmosphere as carbon dioxide. There are two primary technologies used to produce anodes for the Hall-Héroult process—Söderberg and prebake. Söderberg anodes begin as semiliquid constructions that are continuously fed into the molten cryolite bath. Prebaked anodes are preformed and hardened in gas-fired ovens at high temperatures. Prebaked anodes are then fed into the cryolite bath. The major difference is that the Söderberg anode hardens with heat generated from the electrolytic process as it descends into the cryolite bath, and the prebaked anode is hardened before use in the electrolytic cell. The newest and largest aluminum smelters generally use prebaked anodes, which are more efficient.
To produce a prebaked anode, petroleum coke and pitch are blended together and baked in ovens. Anode manufacturing generates additional materials flows. Figures 7 through 10 show selected materials flows for the anode-making process of model European and World plants in 2005 (European Aluminium Association, 2008). Figure 7 shows the inputs and outputs to produce 1 t of anode. European anode plants require 3 percent more thermal energy than World anode plants and 12 percent more electricity; however, the European plants produce slightly less air (fig. 8) and water emissions and significantly less solid wastes (fig. 9). European anode plants recycle slightly more refractory materials and slightly less steel than World plants but significantly more other solid wastes (fig. 10).

22
Figure 7. Diagram showing selected materials flows for the anode-making process of model European and World plants. European model data are in plain black text, and World model data are in underlined red italic text. Data are from European Aluminium Association (2008, p. 24). NA, not available; kg, kilogram; kWh, kilowatthour; m3, cubic meter; t, metric ton; TJ, terajoule. Greenhouse gases are discussed separately in the text.

23
Figure 8. Bar chart showing air emissions for the anode-making process of model European and World plants. Gaseous fluoride and fluoride particles are expressed as contained fluorine. NOx, nitrous oxide; NO2, nitrogen dioxide; PAH, polycyclic hydrocarbon; SO2, sulfur dioxide.

24
Figure 9. Bar chart showing externally recycled waste products for the anode-making process of model European and World plants.

25
Figure 10. Bar chart showing solid waste (landfill) for the anode-making process of model European and World plants.
In the European and World models of the aluminum smelting process, the salient input flows to produce 1 t of anode are, respectively,737 kg and 681 kg of petroleum coke, 173 kg and 171 kg of pitch, 2.7 terajoules (TJ) and 2.6 TJ of fuel energy, and about 145 kilowatthours (kWh) and 129 kWh of electricity (figs. 7 through 10). The corresponding output flows (exclusive of GHGs) of significance are, respectively, 1.5 kg and 2.0 kg of SO2 and 5.3 kg and 24.5 kg of various materials to landfill storage. Of primary environmental concern is the generation of GHG (CO2).
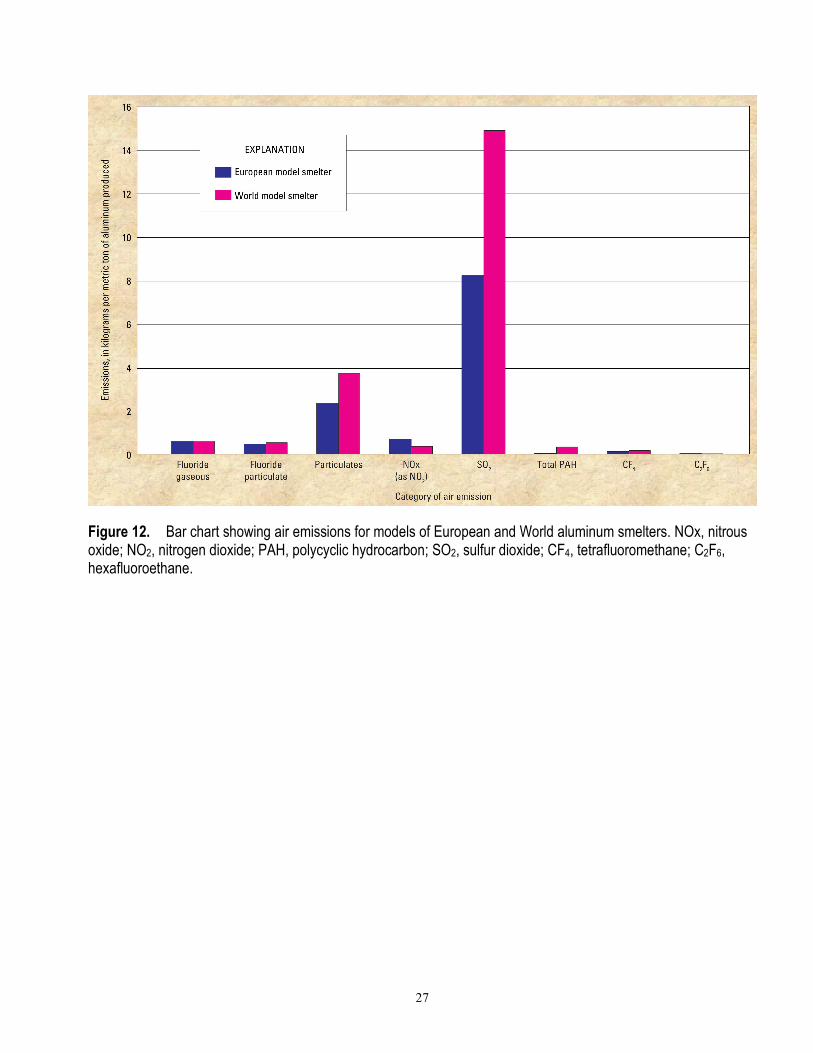
The principal inputs to the aluminum smelting process are alumina, aluminum fluoride (AlF2), carbon (as anodes), and electricity. The principal outputs are aluminum metal, CO2, and some solid wastes. In the European and World models of the aluminum smelting process (Hall-Héroult process), the salient input flows to produce 1 t of aluminum metal are, respectively, 1.93 t and 1.92 t of alumina, about 428 kg and 435 kg of anode paste, and about 14,914 kilowatthours (kWh) and 15,289 kWh of electricity (figs. 11 through 15). In 1930, about 25 megawatthours per metric ton of aluminum was required (Rosenqvist, 2004, p. 449). The corresponding output flows (exclusive of GHGs) of significance are, respectively, 8.2 kg and 14.9 kg of SO2, about 1.1 kg and 3.4 kg of fluorine to air (0.6 kg and 0.3 kg to water), and 28.5 kg and 33.2 kg of various materials to landfill storage.

26
Figure 11. Diagram showing selected materials flows for models of European and World aluminum smelters. European model data are in plain black text, and World model data are in underlined red italic text. Data are from European Aluminium Association (2008, p. 27). kg, kilogram; kWh, kilowatthour; t, metric ton. Greenhouse gases are discussed separately in the text.
27
Figure 12. Bar chart showing air emissions for models of European and World aluminum smelters. NOx, nitrous oxide; NO2, nitrogen dioxide; PAH, polycyclic hydrocarbon; SO2, sulfur dioxide; CF4, tetrafluoromethane; C2F6, hexafluoroethane.

28
Figure 13. Bar chart showing emissions to water for models of European and World aluminum smelters. F, fluorine.

29
Figure 14. Bar chart showing externally recycled waste for models of European and World aluminum smelters.

30
Figure 15. Bar chart showing solid waste for models of European and World aluminum smelters.
3 . 1 . 2 . 3 . 1 . A l u m i n u m S m e l t i n g a n d E l e c t r o l y s i s — G r e e n h o u s e G a s E m i s s i o n s
A greenhouse gas (GHG) is an atmospheric gas that is believed to contribute to climate change by increasing the ability of the atmosphere to trap heat. Different species of such gases have differing abilities to trap heat. Global warming potential (GWP) is a measure of the relative effectiveness of a GHG to affect climate. The heat-trapping ability of 1 t of CO2 is the common standard, and emissions are expressed in terms of CO2 equivalent (CO2e).
The burning of fossil fuels for energy production, transportation, and industrial activities is among the human activities that can contribute CO2 and other GHG emissions to the atmosphere. Aluminum smelting is one of the industrial activities under study because the process emits significant quantities of carbon dioxide and some PFC gases.
Although PFCs emitted from aluminum smelters are not considered toxins or ozone-depleting gases (Simmonds and others, 2002), they are considered to be GHGs. PFCs are of particular concern because they have a greater GWP per unit of emission than CO2. It has been estimated that 1 t of tetrafluoromethane (CF4) has the equivalent GWP of 6,500 t of CO2 and that 1 t of hexafluoroethane (C2F6) has the equivalent GWP of 9,200 t of CO2 (U.S. Environmental Protection Agency, 2006; International Aluminium Institute, 2009c). Aluminum smelting and the manufacturing of electronic chips are the largest known anthropogenic sources of PFCs (Aslam and others, 2003; U.S. Environmental Protection Agency, 2006). Figure 16 shows the flows of fluorine within the aluminum smelting process. Available information is insufficient to calculate all the flow quantities; however, they are represented in the diagram as either a number reported for the World model smelter, or as “kg,”
31
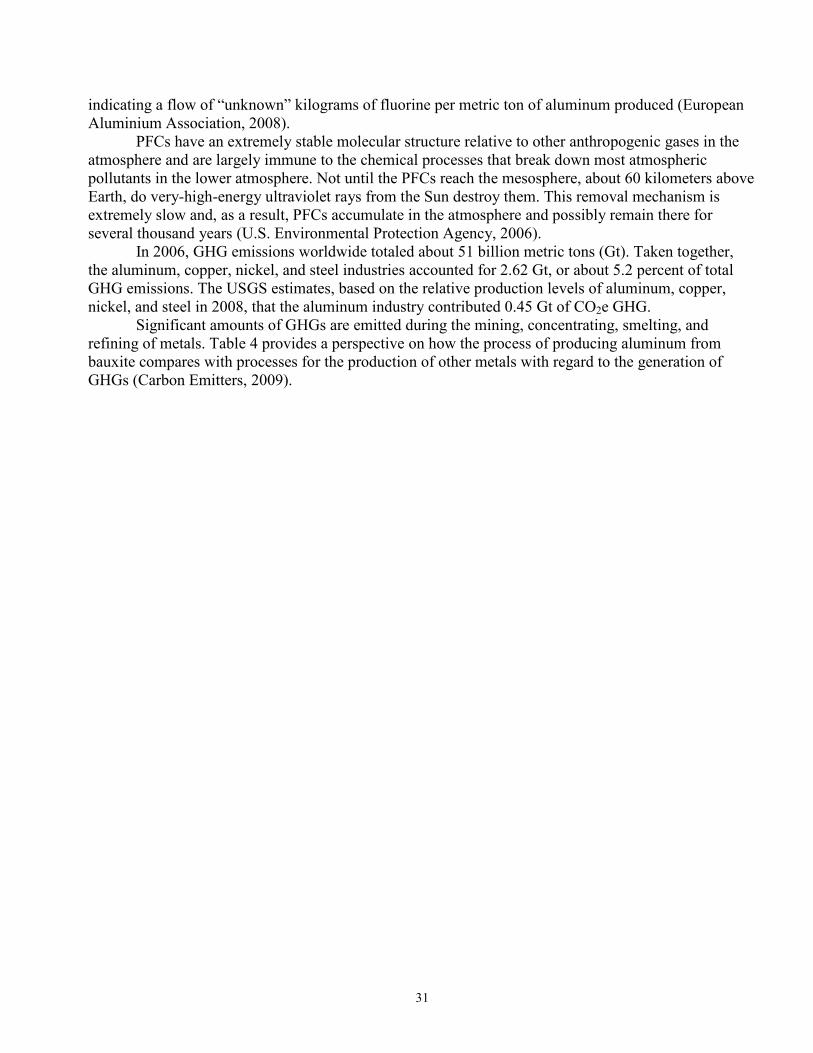
indicating a flow of “unknown” kilograms of fluorine per metric ton of aluminum produced (European Aluminium Association, 2008).
PFCs have an extremely stable molecular structure relative to other anthropogenic gases in the atmosphere and are largely immune to the chemical processes that break down most atmospheric pollutants in the lower atmosphere. Not until the PFCs reach the mesosphere, about 60 kilometers above Earth, do very-high-energy ultraviolet rays from the Sun destroy them. This removal mechanism is extremely slow and, as a result, PFCs accumulate in the atmosphere and possibly remain there for several thousand years (U.S. Environmental Protection Agency, 2006).
In 2006, GHG emissions worldwide totaled about 51 billion metric tons (Gt). Taken together, the aluminum, copper, nickel, and steel industries accounted for 2.62 Gt, or about 5.2 percent of total GHG emissions. The USGS estimates, based on the relative production levels of aluminum, copper, nickel, and steel in 2008, that the aluminum industry contributed 0.45 Gt of CO2e GHG.
Significant amounts of GHGs are emitted during the mining, concentrating, smelting, and refining of metals. Table 4 provides a perspective on how the process of producing aluminum from bauxite compares with processes for the production of other metals with regard to the generation of GHGs (Carbon Emitters, 2009).

32
Figure 16. Diagram of sources and distribution of fluorine during aluminum smelting. Available information was insufficient to calculate all the flow quantities and a standalone “kg” is used to indicate a flow of “unknown” kilograms of fluorine per metric ton of aluminum produced. AlF3, aluminum fluorine; kg, kilogram; PFC, perfluorocarbon.

33
Table 4. Selected metals industry contributions to greenhouse gas emissions in 2006. [Data are from Carbon Emitters (2009). CO2e, carbon dioxide equivalent]
Metal industry Production,
in million metric tons
Greenhouse gas
emission, in billion metric tons of CO2e
Share of world
greenhouse gas
emissions, in percent
Share of fossil fuel
greenhouse gases, in percent
Aluminum 33 0.41 0.8 1.2 Copper 13.5 0.04 0.1 0.1 Nickel 1.4 0.04 0.1 0.1 Steel 1,250 2.13 4.2 6.3
Aluminum production generates not only PFCs during anode events (discussed separately below) but also large quantities of CO2 from the use of electricity that is generated from the combustion of hydrocarbons, fuel, and process-generated reduction reactions. The World Business Council and the World Resource Institute have suggested a GHG reporting protocol that accounts for GHG generation on a corporate basis. GHGs attributable to imported materials and energy flows are accounted to the ex-corporate generator—for example, the GHG generated by hydrocarbon-originated electricity that is imported (across the corporate fence, for example, a public utility) would be considered as “indirect” with respect to the subject corporation (International Aluminium Institute, 2003).
Martchek (2007) calculated (based on a model of the global aluminum industry) the CO2e emissions for the several steps of global aluminum production through semifabrication. Table 5 presents those results. Martchek estimated that the intensity of GHG emissions for the global aluminum industry (mining through semifabricated aluminum shipments) decreased to 8.2 t of CO2e per metric ton of semifabricated aluminum shipped in 2005 from 11.0 t of CO2e per metric ton of semifabricated aluminum shipped in 1990, and projected that the level will be 6.1 t of CO2e per metric ton of semifabricated aluminum shipped in 2032. Drivers for the historic and expected improvement include increased recycling and lower emissions from primary aluminum smelters owing to technology improvements (Martchek, 2007).
Table 5. Greenhouse gas emission intensity of primary aluminum operations in 2005. [Unless specified otherwise, units are in kilograms (kg) of carbon dioxide equivalent per metric ton of aluminum (CO2e/t_Al). Perfluorocarbons (PFCs) are weighted higher than CO2 for global warming potential (GWP); in terms of GWP, 1 metric ton (t) of carbon tetrafluoride (CF4) is equivalent to 6,500 t of CO2, and 1 t of hexafluoroethane (C2F6) is equivalent to 9,200 t of CO2. NA, not available; XX, not applicable. Data are from Martchek (2007)]
Contributor Production step
Mining Refining Anodes Smelting Mining through smelting Quantity Percentage of
CO2e/t_Al Electricity NA 58 63 5,147 5,268 57.0 Fuels 16 754 135 133 1,038 11.2 Perfluorocarbons NA NA NA 960 960 10.4 Process NA NA 388 1,582 1,970 21.3
Total 16 812 586 7,822 9,236 XX Percentage of total 0.17 8.79 6.34 84.69 XX XX
34
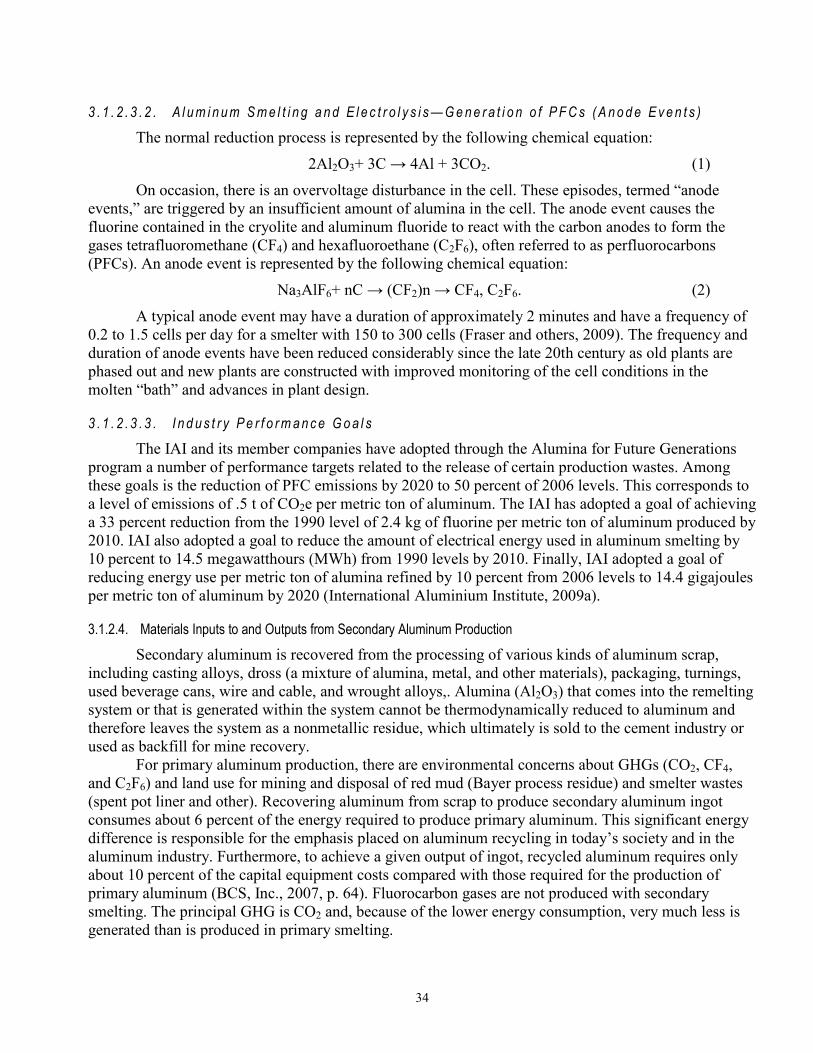
3 . 1 . 2 . 3 . 2 . A l u m i n u m S m e l t i n g a n d E l e c t r o l y s i s — G e n e r a t i o n o f P F C s ( A n o d e E v e n t s )
The normal reduction process is represented by the following chemical equation:
2Al2O3+ 3C → 4Al + 3CO2. (1)
On occasion, there is an overvoltage disturbance in the cell. These episodes, termed “anode events,” are triggered by an insufficient amount of alumina in the cell. The anode event causes the fluorine contained in the cryolite and aluminum fluoride to react with the carbon anodes to form the gases tetrafluoromethane (CF4) and hexafluoroethane (C2F6), often referred to as perfluorocarbons (PFCs). An anode event is represented by the following chemical equation:
Na3AlF6+ nC → (CF2)n → CF4, C2F6. (2)
A typical anode event may have a duration of approximately 2 minutes and have a frequency of 0.2 to 1.5 cells per day for a smelter with 150 to 300 cells (Fraser and others, 2009). The frequency and duration of anode events have been reduced considerably since the late 20th century as old plants are phased out and new plants are constructed with improved monitoring of the cell conditions in the molten “bath” and advances in plant design.
3 . 1 . 2 . 3 . 3 . I n d u s t r y P e r f o r m a n c e G o a l s
The IAI and its member companies have adopted through the Alumina for Future Generations program a number of performance targets related to the release of certain production wastes. Among these goals is the reduction of PFC emissions by 2020 to 50 percent of 2006 levels. This corresponds to a level of emissions of .5 t of CO2e per metric ton of aluminum. The IAI has adopted a goal of achieving a 33 percent reduction from the 1990 level of 2.4 kg of fluorine per metric ton of aluminum produced by 2010. IAI also adopted a goal to reduce the amount of electrical energy used in aluminum smelting by 10 percent to 14.5 megawatthours (MWh) from 1990 levels by 2010. Finally, IAI adopted a goal of reducing energy use per metric ton of alumina refined by 10 percent from 2006 levels to 14.4 gigajoules per metric ton of aluminum by 2020 (International Aluminium Institute, 2009a).
3.1.2.4. Materials Inputs to and Outputs from Secondary Aluminum Production Secondary aluminum is recovered from the processing of various kinds of aluminum scrap,
including casting alloys, dross (a mixture of alumina, metal, and other materials), packaging, turnings, used beverage cans, wire and cable, and wrought alloys,. Alumina (Al2O3) that comes into the remelting system or that is generated within the system cannot be thermodynamically reduced to aluminum and therefore leaves the system as a nonmetallic residue, which ultimately is sold to the cement industry or used as backfill for mine recovery.
For primary aluminum production, there are environmental concerns about GHGs (CO2, CF4, and C2F6) and land use for mining and disposal of red mud (Bayer process residue) and smelter wastes (spent pot liner and other). Recovering aluminum from scrap to produce secondary aluminum ingot consumes about 6 percent of the energy required to produce primary aluminum. This significant energy difference is responsible for the emphasis placed on aluminum recycling in today’s society and in the aluminum industry. Furthermore, to achieve a given output of ingot, recycled aluminum requires only about 10 percent of the capital equipment costs compared with those required for the production of primary aluminum (BCS, Inc., 2007, p. 64). Fluorocarbon gases are not produced with secondary smelting. The principal GHG is CO2 and, because of the lower energy consumption, very much less is generated than is produced in primary smelting.

35
Boin and Bertram (2005) reported on the efforts of 15 European Union members to construct a model for secondary aluminum in Europe—European Scrap Smelting Unit Model (ESSUM). In 2002, ESSUM showed that producing 1 t of aluminum metal alloy required 936 kg of scrap, 81 kg of turnings, 33 kg of alloys, 33 kg of dross, 16 kg of oxide, and 2 kg of salt (fig. 17).
Figure 17. Diagram showing selected material flows for a European secondary aluminum smelter model in 2002. Data are from European Aluminum Association (2008). kg, kilogram; kWh, kilowatthour; t, metric ton.
Scrap for processing in secondary smelters can come from many sources and can be of various types. One convenient means to categorize scrap generation is by life cycle stage, which would include production (smelting), fabrication (making usable shapes of various alloys for further processing), manufacturing (machining shapes to make parts for assemblies), and end-of-life (recovery of old scrap from economic sectors). Scrap can also be assigned to different processing modes. Remelters usually operate flux-free furnaces that treat clean, identified, and essentially new scrap generated from fabrication and manufacturing operations. Remelters make specific alloys, usually for wrought products. Refiners deal with dross (skimmings) foundry scrap, and much of the end-of-life scrap. Refiners make foundry alloys and deoxidation alloys for the steel industry.
The difference in the generation of gas between primary and secondary aluminum smelting is significant. One investigator estimated GHG emissions (from the production of alumina through the

36
casting of primary aluminum) within the EU27 to be about 11 Mt of CO2e whereas secondary remelting and refining generated 0.88 Mt and 0.96 Mt of CO2e, respectively. The substitution of secondary for primary aluminum product can significantly reduce GHG emissions (Fraunhofer Institute for Systems and Innovations Research, 2009).
Secondary aluminum processing is heavily dependent on natural gas consumption. Furnaces that use natural gas can generate NOx, which is a precursor to ozone (Metals Advisor, 2010). Life cycle analysis could be used to measure NOx and to develop strategies to reduce emissions.
3.1.3. Global Mass Flows of Aluminum—Consumption
3.1.3.1. Consumption—Overview IAI has summarized the disposition of aluminum as a total in finished products (40.4 Mt in
2006) and as net additions to products in use (24.4 Mt in 2006), which are distributed among the following end uses: • buildings (32 percent) • engineering and cable (28 percent) • packaging (1 percent) • transportation (28 percent), including automobiles (16 percent) • other (11 percent)
This section examines the apparent consumption of aluminum for the 20 most populous countries to show how aluminum consumption varies among countries. The next section will examine consumption by end use.
Consumption of aluminum can be measured at different points in the cycle of material use. Consumption can be measured either as the quantity of material that goes into goods manufactured within the country (industrial consumption) or as the quantity of material in goods consumed by inhabitants of the country (final consumption). Industrial consumption can be easily estimated as the amount of aluminum produced in the country plus imports of aluminum less exports of aluminum. Final consumption is much more difficult to measure as it requires at a minimum knowledge of the goods consumed and their aluminum content.
Previous studies (DeYoung and Menzie, 1999; Menzie, DeYoung, and Steblez, 2001) have shown that industrial consumption per capita in a country is related to the average national income level of the country as measured by GDP per capita. Table 6 presents data on and figure 18 is a plot of the aluminum consumption per capita versus the GDP per capita in 2006 for the 20 most populous countries (which are, in order of population, China, India, the United States, Indonesia, Brazil, Pakistan, Bangladesh, Russia, Nigeria, Japan, Mexico, Philippines, Vietnam, Germany, Ethiopia, Egypt, Turkey, Iran, Thailand, and France). Together these countries consumed 30.3 Mt of aluminum in 2006, or about two-thirds of global production. In general, countries with a GDP per capita of less than $5,000 consume less than 5 kg of aluminum per capita; countries with a GDP per capita between $5,000 and $15,000 consume between 5 and 10 kg of aluminum per capita; and countries with per capita incomes of greater than $25,000 consume between 15 and 35 kg of aluminum per capita. The change in per capita consumption that accompanies an increase in income is dramatic and is an important factor in understanding the likely future consumption of aluminum both at a country level and globally.

37
Table 6. Aluminum consumption per capita versus gross domestic product per capita for the 20 most populous countries in 2006. [GDPpp, gross domestic product purchasing power parity; GDP/c pp, gross domestic product per capita purchasing power parity. GDPpp data are from the International Monetary Fund World Economic Outlook Data Base (October 2009); population data are from the U.S. Census Bureau International Data Base (March 2010); aluminum consumption data are from USGS Minerals Yearbook 2007, v. I and III]
Country Population, in millions
GDPpp, in billion dollars
Aluminum consumption, in thousand metric
tons
GDP/c pp, in dollars
Aluminum consumption per
capita, in kilograms per capita
China 1,304 $8,220 8,648 $6,300 6.63 India 1,108 3,770 1,080 3,400 0.97 United States 298 12,500 9,173 42,000 30.74 Indonesia 232 858 288 3,700 1.24 Brazil 192 1,610 1,044 8,400 5.45 Pakistan 166 399 34 2,400 0.21 Bangladesh 150 315 24 2,100 0.16 Russia 142 1,520 1,047 10,700 7.37 Nigeria 140 140 11 1,000 0.08 Japan 128 3,910 3,393 30,700 26.61 Mexico 107 1,080 725 10,100 6.75 Philippines 95 486 26 5,100 0.28 Vietnam 85 256 88 3,000 1.03 Germany 82 2,460 2,619 29,800 31.78 Ethiopia 77 62 0 800 0.00 Egypt 74 326 110 4,400 1.48 Turkey 74 582 433 7,900 5.88 Iran 65 526 168 8,100 2.59 Thailand 65 537 407 8,300 6.29 France 63 1,900 945 30,000 14.92

38
Figure 18. Graph showing aluminum consumption per capita measured against gross domestic product per capita for the 20 most populous countries in 2006.
3.1.3.2. Consumption—End Uses This section presents statistics on the end uses of aluminum for selected populous countries,
including Argentina, Brazil, China, France, Germany, India, Japan, Mexico, Russia, the United Kingdom, and the United States. Table 7 presents data on the percentage of aluminum consumption for various end uses in these countries. The data are available for different years and use somewhat different end-use classifications, which limit the conclusions that can be drawn from the data.
Table 7. Percentage of aluminum consumption by end use in populous countries with developing economies and selected high-income countries. [XX, not applicable. Data are from Boltramovich, Dudarev, and Gorelov (2003, p. 126), Indian Bureau of Mines (2008), and Associação Brasileira do Alumínio (undated)]
End use Developing economies
Argentina (2008)
Brazil (2008)
China (2009)
India (2007) Mexico Russia
Construction 21.4 11.3 40 13 6 7 Transportation 22 25.8 18 18 38 19 Electrical (power) 15.7 11.6 12 31 21 18 Durable goods 6.9 8.7 11 12 9 10 Packaging 19.3 28.7 9 11 6 3 Machinery and equipment 4.7 4 8 6 12 40 Fabricated metal 6.3 XX XX XX XX XX Others 4.1 9.9 2 9 8 3

39
Table 7. Percentage of aluminum consumption by end use in populous countries with developing economies and selected high-income countries.—Continued [XX, not applicable. Data are from Boltramovich, Dudarev, and Gorelov (2003, p. 126), Indian Bureau of Mines (2008), and Associação Brasileira do Alumínio (undated)]
High-income countries
France (2004)
Germany (2006)
United Kingdom
(2006)
Western Europe (2006)
Japan (2006)
United States (2006)
Construction 21 16.0 30 25 13.2 13.0 Transportation 36 44.1 21 36 40.5 38.0 Electrical XX 6.0 XX XX 4.5 5.0 Durables XX 4.6 XX XX XX 7.0 Packaging 10 9.3 21 17 10.2 26.0 Machinery XX 8.4 XX XX 3.9 7.0 Engineering 31 XX 28 14 XX XX Fabricated metal XX 5.6 XX XX 11.6 XX Other 2 6.0 XX 8 16.1 4.0
Nevertheless, the data when combined with data on the GDP per capita do suggest that several important changes in the consumption of aluminum occur as income increases. First, the data show that aluminum consumption for electrical end uses decreases with increasing income (fig. 19). Second, the data show that aluminum consumption for transportation end uses increases with rising income (fig. 20).
Figure 19. Graph showing percentage of aluminum consumption in electrical end uses against gross domestic product per capita.
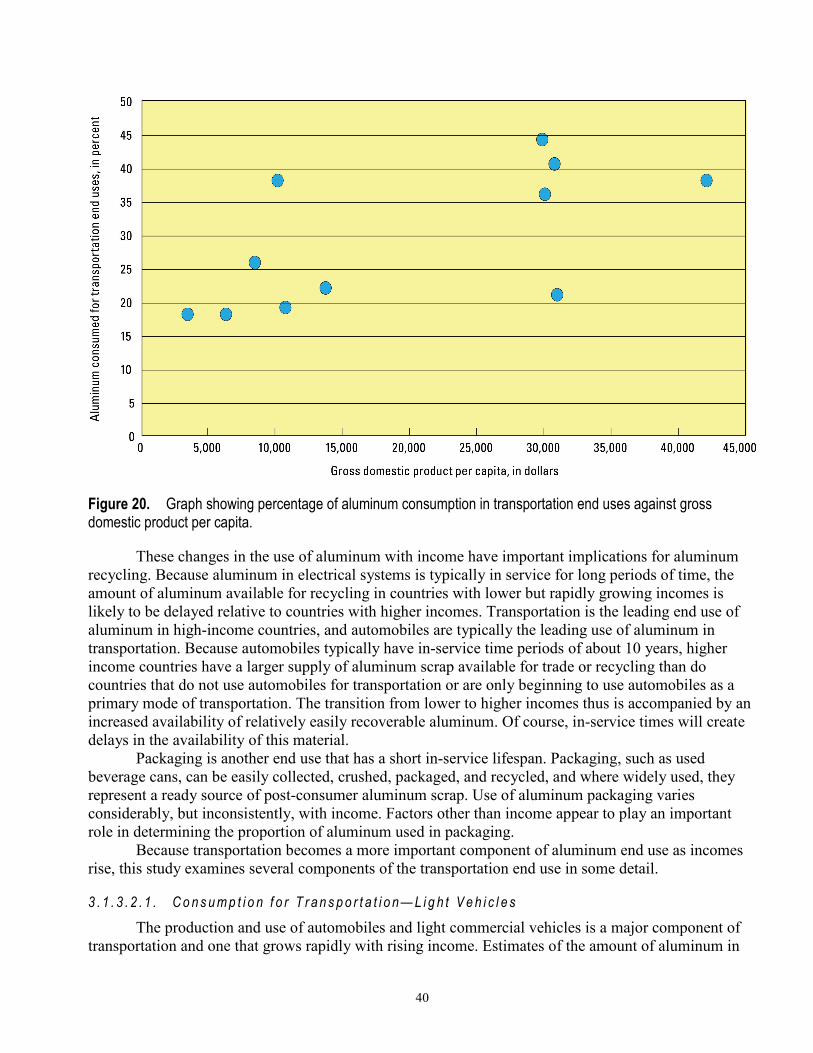
40
Figure 20. Graph showing percentage of aluminum consumption in transportation end uses against gross domestic product per capita.
These changes in the use of aluminum with income have important implications for aluminum recycling. Because aluminum in electrical systems is typically in service for long periods of time, the amount of aluminum available for recycling in countries with lower but rapidly growing incomes is likely to be delayed relative to countries with higher incomes. Transportation is the leading end use of aluminum in high-income countries, and automobiles are typically the leading use of aluminum in transportation. Because automobiles typically have in-service time periods of about 10 years, higher income countries have a larger supply of aluminum scrap available for trade or recycling than do countries that do not use automobiles for transportation or are only beginning to use automobiles as a primary mode of transportation. The transition from lower to higher incomes thus is accompanied by an increased availability of relatively easily recoverable aluminum. Of course, in-service times will create delays in the availability of this material.
Packaging is another end use that has a short in-service lifespan. Packaging, such as used beverage cans, can be easily collected, crushed, packaged, and recycled, and where widely used, they represent a ready source of post-consumer aluminum scrap. Use of aluminum packaging varies considerably, but inconsistently, with income. Factors other than income appear to play an important role in determining the proportion of aluminum used in packaging.
Because transportation becomes a more important component of aluminum end use as incomes rise, this study examines several components of the transportation end use in some detail.
3 . 1 . 3 . 2 . 1 . C o n s u m p t i o n f o r T r a n s p o r t a t i o n — L i g h t V e h i c l e s
The production and use of automobiles and light commercial vehicles is a major component of transportation and one that grows rapidly with rising income. Estimates of the amount of aluminum in

41
light vehicles can be calculated using statistics on vehicle production published by the International Organization of Motor Vehicle Manufacturers (OICA) (2007) and data on the intensity of use of aluminum in vehicles (Ducker Worldwide, LLC, 2008, p. 38). Ducker Worldwide, LLC (2008, p. 10) has published data on the aluminum content of vehicles by region or country for 2009 for North America, the European Union, Japan, a world average, the Republic of Korea, China, India and other Asia, Russia and other Europe, South America, and the Middle East. The company has published data for both 2006 and 2009 for North America, the European Union, and Japan (Ducker Worldwide, LLC, 2008, p. 10).
These data suggest that in 2006, aluminum use per vehicle was about 4 percent lower than in 2009. Therefore, the 2009 regional aluminum intensities were adjusted. Table 8 includes these adjusted (calculated) aluminum intensity data, along with vehicle production data, the estimated amount of aluminum used in light vehicles, aluminum consumption in 2006, and estimated aluminum consumption in transportation end uses. The calculated aluminum content of vehicles is the product of the number of vehicles and the estimate of the aluminum intensity of vehicles. The estimated consumption of aluminum is from the World Bureau of Metal Statistics. The estimated aluminum consumption in transportation end uses is based on World Bureau of Metal Statistics data and the transportation end-use percentages. About 69 million light vehicles were manufactured in 2006 containing approximately 7.8 Mt of aluminum for an average content of 113 kilograms per vehicle. Vehicles manufactured in North America contained the most aluminum, averaging 143 kilograms per vehicle, and vehicles manufactured in Africa and the Middle East contained the least aluminum, averaging 66 kilograms per vehicle.

42
Table 8. Vehicle production, aluminum intensity, aluminum use in light vehicles, aluminum consumption, and selected data on aluminum consumption in transportation end uses. [XX, not applicable. Production data are from International Organization of Motor Vehicle Manufacturers (2007). Estimated data are rounded to no more than three significant digits]
Country Total
vehicles produced
Aluminum intensity, in
kilograms per vehicle
Aluminum used in light vehicles, in metric tons
Aluminum consumption in 2006, in metric
tons
Estimated aluminum
consumption in transportation end
uses, in metric tons
Argentina 432,101 67 28,951 145,600 32,000 Australia 330,900 78 25,810 439,600 XX Austria 274,932 118 32,442 419,700 XX Belgium 918,056 118 108,331 466,900 XX Brazil 2,611,034 67 174,939 1,044,400 269,000 Canada 2,572,292 143 367,838 1,030,800 XX China 7,188,708 96 690,116 8,648,100 1,560,000 Czech Republic 854,907 118 100,879 129,600 XX Egypt 91,518 66 6,040 109,500 XX Finland 32,770 76 2,491 72,500 XX France 3,169,219 118 373,968 944,700 340,000 Germany 5,819,614 118 686,714 2,619,000 1,150,000 Hungary 190,823 118 22,517 224,800 XX India 2,019,808 78 157,545 1,079,500 194,000 Indonesia 297,062 78 23,171 288,000 XX Iran 904,500 66 59,697 168,400 XX Italy 1,211,594 118 142,968 1,686,100 XX Japan 11,484,233 110 1,263,266 3,392,600 1,370,000 Malaysia 502,973 78 39,232 193,400 XX Mexico 2,045,518 143 292,509 724,700 275,000 Netherlands 159,454 118 18,816 146,400 XX Poland 714,600 118 84,323 227,000 XX Portugal 227,325 118 26,824 111,500 XX Republic of Korea 3,840,102 104 399,371 1,153,200 XX Romania 213,597 118 25,204 246,500 XX Russia 1,508,358 76 114,635 1,047,000 199,000 Serbia 11,182 76 850 109,500 XX Slovakia 295,391 118 34,856 25,500 XX Slovenia 150,320 118 17,738 112,200 XX South Africa 587,719 66 38,789 264,000 XX Spain 2,777,435 118 327,737 862,800 XX Sweden 333,168 118 39,314 138,400 XX Taiwan 303,221 78 23,651 561,700 XX Thailand 1,194,426 78 93,165 407,000 XX Turkey 987,780 66 65,193 433,000 XX Ukraine 295,260 76 22,440 39,500 XX United Kingdom 1,648,388 118 194,510 566,500 119,000 United States 11,263,986 143 1,610,750 9,173,000 3,490,000 Uzbekistan 110,000 78 8,580 XX XX Others 531,606 108 57,413 XX XX Total 69,222,975 XX 7,803,584 XX XX
The data on the aluminum content of vehicles give an estimate of the amount of material from this source that was added to total aluminum in use in 2006. When compared with the IAI global flow for 2006, these data indicate that light vehicles accounted for almost 20 percent of the aluminum in finished products and the percentage of aluminum in total products in automotive uses was 16 percent (Martchek, 2007). An estimate of the amount of aluminum that was used to manufacture the vehicles

43
can be made by comparing shipments of aluminum to vehicle manufacturers in North America to the amount of aluminum contained in light vehicles manufactured in North America (table 9). These data indicate that, for every metric ton of aluminum in the vehicle, 1.046 t of aluminum was used to make the vehicle.
When the estimated aluminum content in light vehicles is compared with aluminum consumption and with estimates of aluminum consumption in the transportation end use (table 8), some inconsistencies are apparent. For example, the calculated aluminum content of vehicles for Slovakia exceeds the estimated aluminum consumption of the country in 2006. Also, the calculated aluminum content of vehicles exceeds the estimated aluminum content of transportation end uses for France and Mexico by about 6.5 percent and for the United Kingdom by 64 percent (table 10). Because Mexico is not a major manufacturer of aircraft, ships, or rail transportation, the difference may not indicate a major estimation problem. The large differences for France and the United Kingdom, however, are more serious. France manufactures aircraft in addition to vehicles, which would add to the size of the difference between aluminum reported in the end-use statistics versus aluminum calculated by estimating aluminum use by different modes of transportation. The estimated percentage of aluminum in transportation end uses for France is not unusual compared with the other high-income countries. The United Kingdom manufactures aircraft and builds ships in addition to light vehicles. The estimated percentage of aluminum consumption in transportation end uses for the United Kingdom (21 percent) is the lowest for high-income countries by a significant amount. When compared with the amount of aluminum calculated for light vehicles and not estimated for other modes of transportation, the low estimate for the transportation end use in the United Kingdom appears to be in error.
Table 9. Comparison of shipments of aluminum to manufacturers of passenger cars and light trucks with the estimated amount of aluminum contained in automobiles and light commercial vehicles in North America.
Aluminum shipments for passenger vehicles and light trucks in North America, in metric tons 2,375,000 Aluminum contained in automobiles and light commercial vehicles manufactured in North America, in metric tons:
Canada 367,838 Mexico 292,509 United States 1,610,750
Total 2,271,100 Estimated scrap generated in manufacture, in metric tons 103,900 Percentage of shipments to scrap 4.4 Factor to estimate scrap from aluminum in vehicles 0.046
Comparison of aluminum used in the manufacture of vehicles with aluminum in transportation end uses in countries where vehicles are the main mode of transportation manufactured are in closer agreement (table 10). For example, transportation end-use data (about 32,000 t) for Argentina, which manufactures vehicles but not aircraft or ships, agree closely with the amount of aluminum that would be used in the manufacture of vehicles (about 30,000 t). Light vehicles account for 85 percent of the aluminum in transportation end uses in India, which has a small shipbuilding sector. Because the other countries with estimated aluminum consumption for transportation end uses have more complex transportation manufacturing sectors, analysis of the aluminum used in the manufacture of other modes of transportation will be necessary to further test the validity of the end-use data.
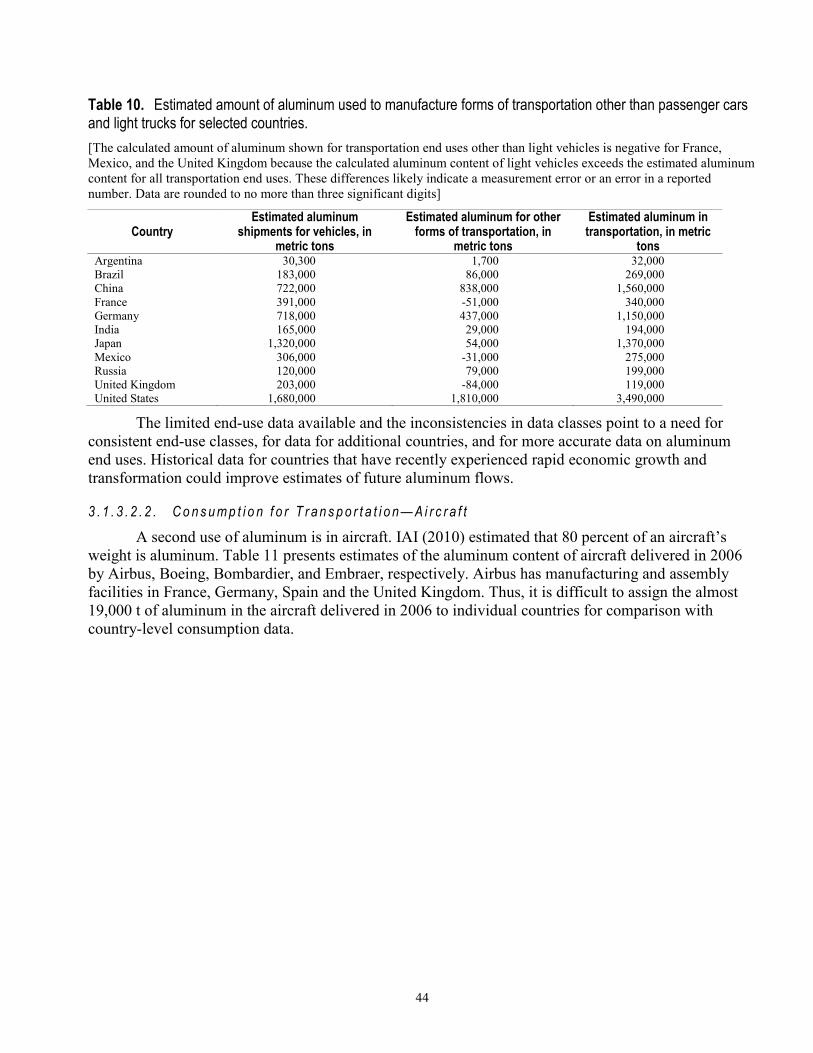
44
Table 10. Estimated amount of aluminum used to manufacture forms of transportation other than passenger cars and light trucks for selected countries. [The calculated amount of aluminum shown for transportation end uses other than light vehicles is negative for France, Mexico, and the United Kingdom because the calculated aluminum content of light vehicles exceeds the estimated aluminum content for all transportation end uses. These differences likely indicate a measurement error or an error in a reported number. Data are rounded to no more than three significant digits]
Country Estimated aluminum
shipments for vehicles, in metric tons
Estimated aluminum for other forms of transportation, in
metric tons
Estimated aluminum in transportation, in metric
tons Argentina 30,300 1,700 32,000 Brazil 183,000 86,000 269,000 China 722,000 838,000 1,560,000 France 391,000 -51,000 340,000 Germany 718,000 437,000 1,150,000 India 165,000 29,000 194,000 Japan 1,320,000 54,000 1,370,000 Mexico 306,000 -31,000 275,000 Russia 120,000 79,000 199,000 United Kingdom 203,000 -84,000 119,000 United States 1,680,000 1,810,000 3,490,000
The limited end-use data available and the inconsistencies in data classes point to a need for consistent end-use classes, for data for additional countries, and for more accurate data on aluminum end uses. Historical data for countries that have recently experienced rapid economic growth and transformation could improve estimates of future aluminum flows.
3 . 1 . 3 . 2 . 2 . C o n s u m p t i o n f o r T r a n s p o r t a t i o n — A i r c r a f t
A second use of aluminum is in aircraft. IAI (2010) estimated that 80 percent of an aircraft’s weight is aluminum. Table 11 presents estimates of the aluminum content of aircraft delivered in 2006 by Airbus, Boeing, Bombardier, and Embraer, respectively. Airbus has manufacturing and assembly facilities in France, Germany, Spain and the United Kingdom. Thus, it is difficult to assign the almost 19,000 t of aluminum in the aircraft delivered in 2006 to individual countries for comparison with country-level consumption data.
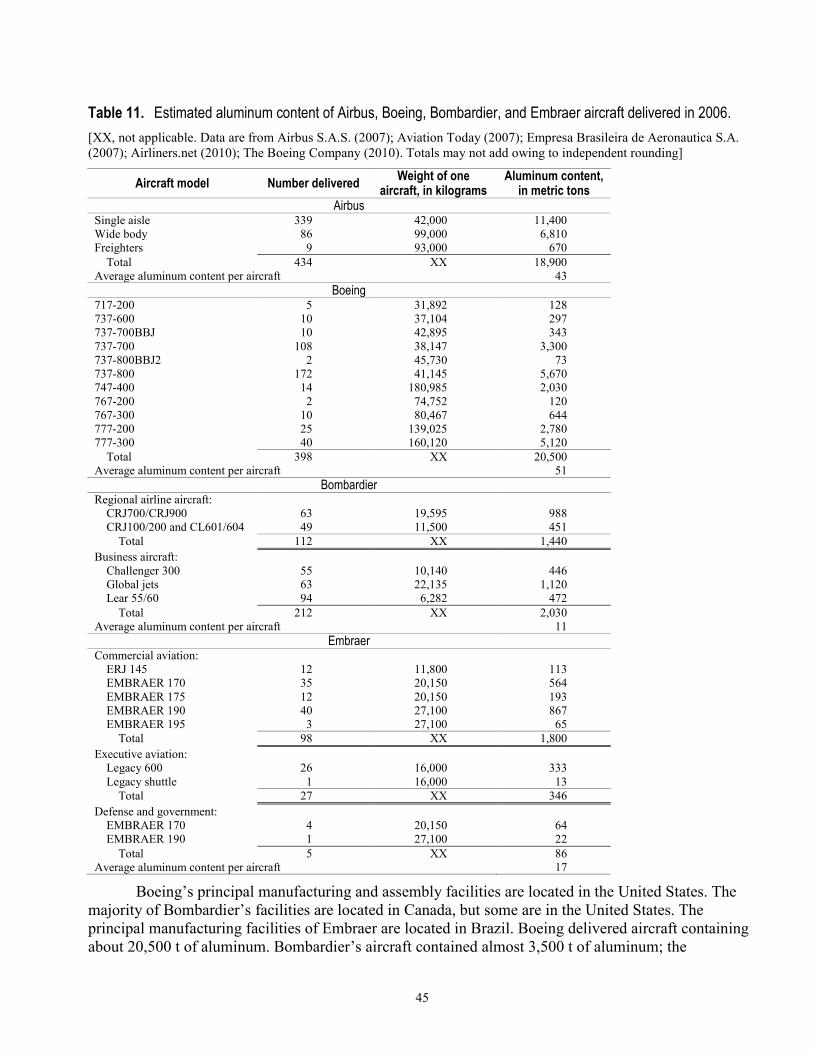
45
Table 11. Estimated aluminum content of Airbus, Boeing, Bombardier, and Embraer aircraft delivered in 2006. [XX, not applicable. Data are from Airbus S.A.S. (2007); Aviation Today (2007); Empresa Brasileira de Aeronautica S.A. (2007); Airliners.net (2010); The Boeing Company (2010). Totals may not add owing to independent rounding]
Aircraft model Number delivered Weight of one aircraft, in kilograms
Aluminum content, in metric tons
Airbus Single aisle 339 42,000 11,400 Wide body 86 99,000 6,810 Freighters 9 93,000 670
Total 434 XX 18,900 Average aluminum content per aircraft 43
Boeing 717-200 5 31,892 128 737-600 10 37,104 297 737-700BBJ 10 42,895 343 737-700 108 38,147 3,300 737-800BBJ2 2 45,730 73 737-800 172 41,145 5,670 747-400 14 180,985 2,030 767-200 2 74,752 120 767-300 10 80,467 644 777-200 25 139,025 2,780 777-300 40 160,120 5,120
Total 398 XX 20,500 Average aluminum content per aircraft 51
Bombardier Regional airline aircraft:
CRJ700/CRJ900 63 19,595 988 CRJ100/200 and CL601/604 49 11,500 451
Total 112 XX 1,440 Business aircraft:
Challenger 300 55 10,140 446 Global jets 63 22,135 1,120 Lear 55/60 94 6,282 472
Total 212 XX 2,030 Average aluminum content per aircraft 11
Embraer Commercial aviation:
ERJ 145 12 11,800 113 EMBRAER 170 35 20,150 564 EMBRAER 175 12 20,150 193 EMBRAER 190 40 27,100 867 EMBRAER 195 3 27,100 65
Total 98 XX 1,800 Executive aviation:
Legacy 600 26 16,000 333 Legacy shuttle 1 16,000 13
Total 27 XX 346 Defense and government:
EMBRAER 170 4 20,150 64 EMBRAER 190 1 27,100 22
Total 5 XX 86 Average aluminum content per aircraft 17
Boeing’s principal manufacturing and assembly facilities are located in the United States. The majority of Bombardier’s facilities are located in Canada, but some are in the United States. The principal manufacturing facilities of Embraer are located in Brazil. Boeing delivered aircraft containing about 20,500 t of aluminum. Bombardier’s aircraft contained almost 3,500 t of aluminum; the

46
proportion of aircraft built in the United States is unstated. Embraer delivered aircraft containing 2,200 t of aluminum in 2006.
It is not clear how much aluminum was used to build the aircraft as no data on shipments to aircraft manufacturers were available for the study. Data from Boeing (undated), however, indicate that the company offered 18,700 t of aluminum scrap for sale in 2006. If the Boeing’s ratio of scrap plus aluminum in product to aluminum in product (approximately 2) is typical of other aircraft manufacturers, it suggests that 2 t of aluminum must be purchased for every ton of aluminum in the final product. Thus, vehicles and aircraft account for only 1.8 Mt of the 3.5 Mt of aluminum used for transportation end uses in the United States. In Brazil, about 4,400 t of aluminum was used to manufacture aircraft. Together, vehicles and aircraft account for 187,000 t of the 269,000 t of aluminum used in transportation end uses in Brazil.
3 . 1 . 3 . 2 . 3 . C o n s u m p t i o n f o r T r a n s p o r t a t i o n — R a i l c a r s
Based on data from FreightCar America, Inc. (2007), we estimate that about 410,000 t of aluminum was contained in railcars manufactured in the United States in 2006. Again, the amount of aluminum required to manufacture the rail cars is unknown, but if the ratio is similar to that calculated for aircraft, the amount of aluminum accounted for by light vehicles, civilian aircraft, and railcars in the United States would be about 2.5 Mt of the 3.5 Mt calculated from the transportation end use.
3 . 1 . 3 . 2 . 4 . C o n s u m p t i o n f o r T r a n s p o r t a t i o n — F i n a l T h o u g h t s
The data on the aluminum content of manufactured products seems to be reasonably accurate. For some of the products considered above, however, part of the aluminum could be aluminum alloy containing up to 10 percent alloying metals, such as copper and zinc. The amount of alloy used is unknown, and therefore no adjustment has been made to the calculated aluminum contents of products. If the aluminum contents are accurate, scrap ratios calculated for vehicles and aircraft could be conservative. Shipment data would be useful in resolving these issues.
Finally, data on the in-service times for the transportation systems would be useful for estimating the volumes of post-consumer scrap that are likely generated. Vehicles appear to have in-service times of 10 to 15 years. Based upon data from Jet Information Services (undated), aircraft appear to have in-service times of about 25 years. Jet Information Services (undated) also contains information on the number of aircraft removed from active inventory from 1965 to 2000 for aircraft manufactured by Western firms. In 2000, about 225 aircraft were removed from active inventory. Not all aircraft removed from active inventory are scrapped, but it appears that most are. If 75 percent of the aircraft were scrapped, then aluminum from about 170 aircraft was added to post-consumer scrap. Using the per aircraft aluminum content for Airbus and Boeing, which are the two largest Western aircraft manufacturers, this would generate between 7,300 and 8,700 t of post-consumer aluminum scrap.
3.2. Future Global Mass Flows of Aluminum This section of the report examines future mass flows of aluminum for the short to medium term
(to 2015) and for the longer term (2015 to 2025).
3.2.1. Short- to Medium-Term Production Forecasts For the short to medium term (from the present to 5 years hence), outlooks have been developed
based upon projected trends that could affect existing production facilities, planned expansions of existing facilities, and planned new facilities that operating companies, consortia, or Governments have

47
projected to come online within indicated timeframes. The outlooks are not forecasts of what production will be but rather what the industry is likely to be able to produce given announced industry intentions.
3.2.1.1. Bauxite The outlooks for the production of bauxite in Africa, the Middle East, the Americas, Asia, and
Europe and Eurasia presented in table 12 are based on those in the summary chapters of MYB 2007 (Fong-Sam and others, 2009; Anderson and others, 2010; Levine and others, 2010; Mobbs and others, 2010; Yager and others, 2010). The summary chapters contain outlooks for individual bauxite-producing countries. African production is forecast to increase to 24 Mt in 2015 from 20 Mt in 2006; production from the Middle East is forecast to increase by almost 29 percent per year to 4.9 Mt in 2015 from 0.5 Mt in 2006. Aluminum production in the Americas is expected to reach 60 Mt in 2015, which is up from 50 Mt in 2006. Asia is expected to produce 160 Mt of bauxite, which represents an increase of almost 5 percent per year from 104 Mt. Bauxite production in Europe and Eurasia is expected to increase to 18 Mt in 2015 from 8.7 Mt in 2006. In total, global bauxite production is expected to increase by 4.4 percent per year to 270 Mt in 2015 from 183 Mt in 2006.
Table 12. Short- to medium-term (1- to 5-year) outlook for bauxite production. [Data are in thousand metric tons. Totals may not add owing to independent rounding. Data are from USGS Minerals Yearbook 2007, v. III]
Region 2011 2013 2015 Africa 18,000 21,000 24,000 Americas 59,000 58,000 60,000 Asia and the Pacific 140,000 150,000 160,000 Europe and Eurasia 16,000 17,000 18,000 Middle East 1,600 4,900 4,900
World total 235,000 250,000 270,000
3.2.1.2. Aluminum The outlooks for the production of aluminum in Africa, the Middle East, Asia, and Europe and
Eurasia presented in table 13 are taken directly from four summary chapters of MYB 2007 (Fong-Sam and others, 2009; Levine and others, 2010; Mobbs and others, 2010; Yager and others, 2010); the outlooks for the Americas are based upon those presented in Anderson and others (2010) but have been modified to include data for the United States. If economic conditions warrant, there is expected to be sufficient industry capacity to produce 55 Mt of aluminum worldwide in 2011, 60 Mt in 2013, and 61 Mt in 2015. This represents an average rate of increase of 2.6 percent per year. The regions with the largest projected rates of increase are Africa (8.4 percent) and the Middle East (2.8 percent). The increase in Africa is expected to take place mainly in South Africa. The increase will be contingent upon the availability of sufficient power; South Africa has experienced power shortages in recent years. The increases in the Middle East are projected to spread across more countries, with Iran, Saudi Arabia, and the United Arab Emirates all slated for increases in aluminum production capacity. Bauxite production is expected to increase by almost 3 percent from 2011 to 2015 with production increases slated for Australia, Brazil, China, Guinea, India, Saudi Arabia, Sierra Leone, and Vietnam.
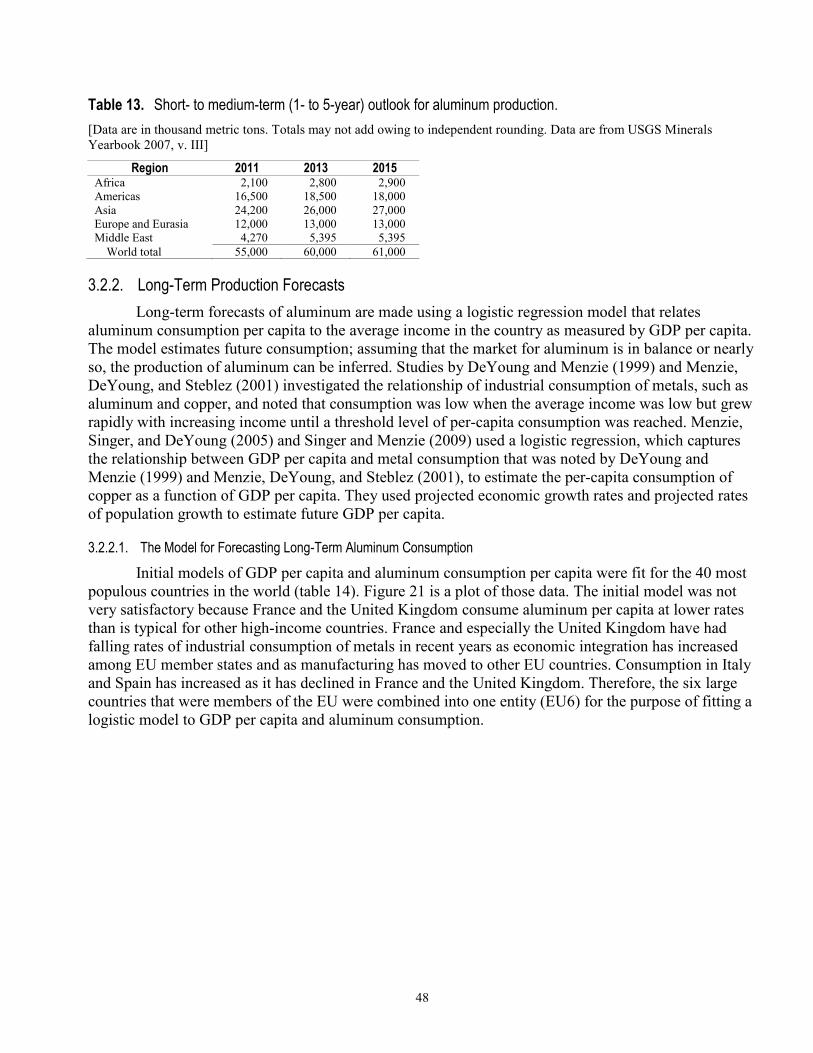
48
Table 13. Short- to medium-term (1- to 5-year) outlook for aluminum production. [Data are in thousand metric tons. Totals may not add owing to independent rounding. Data are from USGS Minerals Yearbook 2007, v. III]
Region 2011 2013 2015 Africa 2,100 2,800 2,900 Americas 16,500 18,500 18,000 Asia 24,200 26,000 27,000 Europe and Eurasia 12,000 13,000 13,000 Middle East 4,270 5,395 5,395
World total 55,000 60,000 61,000
3.2.2. Long-Term Production Forecasts Long-term forecasts of aluminum are made using a logistic regression model that relates
aluminum consumption per capita to the average income in the country as measured by GDP per capita. The model estimates future consumption; assuming that the market for aluminum is in balance or nearly so, the production of aluminum can be inferred. Studies by DeYoung and Menzie (1999) and Menzie, DeYoung, and Steblez (2001) investigated the relationship of industrial consumption of metals, such as aluminum and copper, and noted that consumption was low when the average income was low but grew rapidly with increasing income until a threshold level of per-capita consumption was reached. Menzie, Singer, and DeYoung (2005) and Singer and Menzie (2009) used a logistic regression, which captures the relationship between GDP per capita and metal consumption that was noted by DeYoung and Menzie (1999) and Menzie, DeYoung, and Steblez (2001), to estimate the per-capita consumption of copper as a function of GDP per capita. They used projected economic growth rates and projected rates of population growth to estimate future GDP per capita.
3.2.2.1. The Model for Forecasting Long-Term Aluminum Consumption Initial models of GDP per capita and aluminum consumption per capita were fit for the 40 most
populous countries in the world (table 14). Figure 21 is a plot of those data. The initial model was not very satisfactory because France and the United Kingdom consume aluminum per capita at lower rates than is typical for other high-income countries. France and especially the United Kingdom have had falling rates of industrial consumption of metals in recent years as economic integration has increased among EU member states and as manufacturing has moved to other EU countries. Consumption in Italy and Spain has increased as it has declined in France and the United Kingdom. Therefore, the six large countries that were members of the EU were combined into one entity (EU6) for the purpose of fitting a logistic model to GDP per capita and aluminum consumption.

49
Table 14. Gross domestic product (GDP), population, aluminum consumption, per capita GDP, and aluminum consumption per capita for the 40 most populous countries in 2006.
Country Population, in millions
GDP, in million
dollars
Aluminum consumption,
in million metric tons
GDP per capita,
in dollars
Aluminum consumption per capita,
in million metric tons China 1,300 $2,630 8,650 $6,300 6.63 India 1,110 887 1,080 3,400 0.98 United States 298 13,200 9,170 42,000 30.70 Indonesia 232 364 288 3,700 1.24 Brazil 192 1,070 1,040 8,400 5.45 Pakistan 166 129 34 2,400 0.21 Bangladesh 150 65 24 2,100 0.16 Russia 142 979 1,050 10,700 7.37 Nigeria 140 115 11 1,000 0.08 Japan 128 4,370 3,390 30,700 26.60 Mexico 107 840 725 10,100 6.75 Philippines 95 117 26 5,100 0.28 Vietnam 85 61 88 3,000 1.03 Germany 82 2,900 2,620 29,800 31.80 Ethiopia 77 74 0 800 0.00 Egypt 74 107 110 4,400 1.48 Turkey 74 392 433 7,900 5.88 Iran 65 212 168 8,100 2.59 Thailand 65 206 407 8,300 6.29 France 63 2,230 945 30,000 14.90 Congo (Kinshasa) 62 19 0 800 0.00 United Kingdom 61 2,370 567 30,900 9.35 Italy 58 1,850 1,690 28,400 29.00 Republic of Korea 49 888 1,150 20,400 23.50 South Africa 48 257 264 12,100 5.51 Burma 47 13 0 1,600 0.00 Ukraine 47 106 39 6,800 0.84 Colombia 42 136 77 7,100 1.83 Spain 40 1,230 863 25,200 21.40 Argentina 40 213 146 13,700 3.68 Sudan 39 36 1 2,100 0.02 Tanzania 39 14 0 700 0.00 Poland 39 342 227 12,700 5.88 Kenya 36 23 13 1,200 0.36 Algeria 33 115 6 7,200 0.18 Canada 33 1,280 1,030 32,900 31.50 Morocco 30 65 12 4,300 0.40 Uganda 29 10 0 1,700 0.01 Peru 28 93 2 6,100 0.07 Nepal 28 9 0 1,500 0.00

50
Figure 21. Graph showing aluminum consumption per capita against purchasing power parity gross domestic product per capita in 2006.
Figure 22 shows a plot of the EU6 and the other 34 populous countries’ aluminum consumption per capita versus GDP per capita and the logistic equation and curve fit to the data. All the parameters of the equation are significantly different from zero at a 5 percent confidence level and the curve provides a reasonable approximation of the data, albeit with significant error. The error indicates that items beyond income affect aluminum consumption per capita. The model of consumption is essentially projective based upon assumed rates of economic growth. Nevertheless, the model is likely to give a reasonable status quo projection of aluminum consumption into the future.

51
Figure 22. Graph showing aluminum consumption per capita against purchasing power parity gross domestic product per capita in 2006 [includes the six largest member states of the European Union (EU6)]. For the logistic regression, aluminum consumption per capita was calculated from the following equation:
− −+ ( 0.00021*( 17,000))29.41 ,
1 xe
where x is the gross domestic product per capita.
3.2.3. Forecasts Table 15 presents forecasts for 2015, 2020, and 2025 for the population, GDP per capita,
aluminum consumption per capita, and aluminum consumption for the 20 most populous countries in 2006. Growth rates are based on the average of the past 10 years. The table also uses the ratio of the aluminum consumption in the 20 most populous countries to global aluminum production to estimate world aluminum consumption. If it is assumed that aluminum production is equal to aluminum consumption, then the estimates can be used to examine a number of implications of the model.

52
Table 15. Estimated population, purchasing power parity gross domestic product per capita, aluminum consumption per capita, and aluminum consumption for 2015, 2020, and 2025. [GDPpp/c, purchasing power parity gross domestic product per capita; Al/c, aluminum consumption per capita; XX, not applicable]
Country
2015 2020 2025
Population, in millions
GDPpp/c, in dollars
Al/c, in kilograms
Aluminum consumption, in thousand metric tons
Population, in millions
GDPpp/c, in dollars
Al/c, in kilograms
Aluminum consumption, in thousand metric tons
Population, in millions
GDPpp/c, in dollars
Al/c, in kilograms
Aluminum consumption, in thousand metric tons
China 1,400 13,900 8.86 12,400 1,430 21,800 20.90 29,900 1,450 34,600 28.70 41,700 India 1,290 5,350 1.82 2,360 1,370 7,100 2.60 3,560 1,430 9,520 4.17 5,970 United States 332 49,300 29.40 9,750 346 54,800 29.40 10,200 359 61,200 29.40 10,600 Indonesia 244 5,000 1.70 414 254 5,850 2.02 513 263 6,870 2.48 654 Brazil 203 10,300 4.86 986 209 11,600 6.14 1,280 214 13,200 7.94 1,700 Pakistan 206 3,000 1.12 230 226 3,490 1.24 280 246 4,100 1.40 345 Bangladesh 175 2,790 1.07 187 186 3,350 1.20 223 195 4,080 1.40 273 Russia 138 18,600 16.20 2,230 135 25,500 24.90 3,360 132 34,900 28.70 3,790 Nigeria 176 1,470 0.80 142 193 1,880 0.88 169 210 2,420 0.98 207 Japan 126 37,100 29.00 3,650 124 41,700 29.30 3,630 121 47,100 29.40 3,550 Mexico 116 12,200 6.75 784 120 13,700 8.58 1,030 123 15,500 11.20 1,370 Philippines 102 6,570 2.34 238 110 7,410 2.77 305 117 8,480 3.42 400 Vietnam 94 5,030 1.71 160 98 6,740 2.42 237 102 9,080 3.84 392 Germany 81 36,100 28.90 2,350 80 40,300 29.20 2,350 79 45,100 29.30 2,330 Ethiopia 96 1,090 0.74 71 108 1,300 0.78 84 120 1,560 0.82 98 Egypt 92 5,510 1.88 173 99 6,550 2.33 230 105 7,850 3.02 317 Turkey 80 12,300 6.86 549 84 15,700 11.50 965 87 20,200 18.60 1,620 Iran 80 10,300 4.80 382 84 12,500 7.05 590 87 15,300 10.90 947 Thailand 70 11,900 6.44 450 71 14,900 10.30 735 73 18,700 16.30 1,180 France 64 35,500 28.80 1,840 65 38,600 29.10 1,890 66 42,000 29.30 1,930 Total for selected
countries 39,300 61,500 79,300
World total 58,700 91,900 119,000
53
The model is quite simple and does not provide associated confidence limits or address possible affects of important variables, such as price and substitution. Errors associated with the long term are necessarily large as errors are typically multiplicative, enlarging upon previous errors. Prices are a nonlinear function of the balance between the supply and demand for a commodity. Because mine and plant capacities at the various steps in the aluminum production process are capital intensive and benefit from economies of scale, mine and plant capacities are typically added, or enlarged, in large increments that require time to build. As a result, supply is relatively inelastic with regards to increases in demand beyond the point of installed capacity. Therefore, forecasting prices is very difficult even for the near term. Evaluation of substitution requires comparison of price and performance measures for competing materials, such as composite materials. An evaluation of such materials is beyond the scope of this study.
World aluminum consumption, which was 45.3 Mt in 2006, is estimated to be 59 Mt in 2015, 92 Mt in 2020, and 120 Mt in 2025. Most of the increases are estimated to occur in low- and middle-income countries. Notably, the BRIC countries (Brazil, Russia, India, and China), which accounted for 26 percent of world consumption in 2006, are expected to account for 31 percent of world consumption in 2015, 42 percent of world consumption in 2020, and 45 percent of world consumption in 2025. Consumption by the United States, Japan, Germany and France, which was 16.1 Mt in 2006 (36 percent of world consumption), is estimated to be 18 Mt in 2025 (15 percent of world consumption).

54
4. Conclusions A number of important conclusions can be reached based upon this study. The conclusions are
organized by the section of the report on which they are based to allow easy access to information related to the formation of the conclusions.
4.1. Methods of Present Study (2.3) A focus on changes in mineral consumption as countries experience economic growth and a rise
in income (GDP per capita) can yield important insights into dynamic material flows.
4.2. Macro-Level Flows (3.1.1) Macro-level flows estimated by this study for bauxite production, alumina production, and
primary aluminum production are similar to those calculated by the IAI for 2006. Secondary aluminum production estimated by this study was significantly lower than that
estimated by the IAI for 2006. In addition, the ratio of post-consumer to total scrap estimated by the USGS (Papp, 2009) for the United States differs significantly from the IAI estimate of that ratio for the world.
4.3. Micro-Level Flows (3.1.2) The European model of alumina refineries and aluminum smelters presented in this section of
the report demonstrates that the application of existing technologies could reduce byproduct wastes produced as a result of aluminum production.
Ongoing research is identifying uses for some wastes such as “red mud.” These uses could significantly reduce some wastes from aluminum production.
Reduction of GHGs from aluminum production is under the control of two groups. PFCs and CO2 generated from fuel use and reduction processes are under the control of the producer of the aluminum. GHGs generated to produce the electricity used by aluminum producers are under the control of the owners of the electrical grid.
4.4. Consumption (3.1.3) In high-income countries, such as Germany, Japan, and the United States, aluminum
consumption per capita is either growing very slowly or is not growing. In a few countries in the European Union, such as France and the United Kingdom, economic integration and relocation of industries have led to a decrease in aluminum consumption.
Aluminum consumption per capita increases rapidly to about 20 kilograms per person from 2 kilograms per person as per-capita income increases to $20,000 from $5,000.
The end uses to which aluminum is put appear to differ significantly between high-income countries and low- and middle-income countries. In low- and middle-income countries, the main uses of aluminum are in electrical systems and construction. In high-income countries, the leading use of aluminum is in transportation. Inconsistent end-use classifications, however, limit the quantification of these differences.
Because of the long in-service times of electrical systems and buildings and other construction, recycling of significant amounts of post-consumer scrap is unlikely to begin in the countries that are currently experiencing rapid economic growth until 2020 to 2025.

55
Recycling rates of used beverage cans can be high in low- and middle-income countries owing to the availability of low wages for labor; however, the amount of material going into packaging is relatively small in these countries.
As shown for light vehicles, production data for goods can be combined with intensity of use data to estimate material in use. When these data are combined with estimates of aluminum shipments and the in-service life of the good, it is possible to estimate the contribution of that type of good to new and post-consumer scrap. For example, the manufacture of light vehicles generates relatively small volumes of new aluminum scrap from fabricators and manufacturers. In contrast, commercial aircraft manufacturing generates almost 1 t of new scrap for each ton of material in an aircraft.
4.5. Future Global Mass Flows of Aluminum (3.2)
4.5.1. Short- to Medium-Term Forecasts (3.2.1) Based upon announced production plans, the capacity of bauxite mines is expected to increase to
270 Mt by 2015 from 183 Mt in 2006. This represents an almost 48 percent increase over 2006. Major increases in mine capacity are expected in Australia, China, Brazil, India, Saudi Arabia, Russia, and Guinea, in order of the size of the capacity increase.
Future aluminum production capacity based upon announced production plans is expected to reach 61 Mt in 2015 from 45.3 Mt in 2006. This represents an increase of almost 3.4 percent per year. The largest increases are expected to take place in China, Brazil, the United Arab Emirates, Canada, India, South Africa, Saudi Arabia, and Qatar, in order of the size of the capacity increase.
4.5.2. Long-Term Forecasts (3.2.2) Based on a model relating consumption to income, aluminum consumption by 2025 is likely to
be 120 Mt compared with 45.3 Mt in 2006. This represents a growth rate of 4.1 percent per year. Most of the increased consumption will take place in countries that consumed only modest amounts of aluminum in 2006. China, which consumed about 6.6 kg per capita in 2006, is expected to consume 28.7 kg per capita in 2025. Russia, which consumed 7.4 kg per capita in 2006, is expected to consume 28.7 kg per capita in 2025, and Brazil, which consumed 5.5 kg per capita in 2006, is expected to consume 7.9 kg per capita in 2025. Brazil’s consumption is based on a relatively modest projection that its rate of economic growth will be only 3 percent per year; recent data indicate that Brazil’s future rate of growth could be greater than 3 percent. India, which consumed 1.8 kg per capita in 2006, is expected to consume 4.2 kg per capita in 2025. Consumption in high-income countries is not expected to rise significantly on a per-capita basis, but total consumption may increase modestly owing to population increases.
4.5.3. Implications of the Forecasts (3.2.3) To meet a consumption of 120 Mt of aluminum, the world will need to produce about 570 Mt of
bauxite and about 230 Mt of alumina. This production will generate significant levels of wastes even if technological improvements are made to current production processes.
A key question related to this increased consumption will be what portion of the consumption is satisfied by primary aluminum and what portion is from secondary aluminum, as this will have a considerable influence on the amount of GHGs generated by aluminum production. That portion of secondary aluminum that comes from new scrap is likely to increase proportionately with overall consumption. The data on changing patterns of end use with increased income suggest, however, that at

56
least initially, the proportion of aluminum that is generated from old scrap may decrease as countries undergoing economic growth initially use aluminum mainly to add to infrastructure that has long terms of in-service use. Later, as these countries continue to experience economic growth, they are likely to increase the amount of aluminum they consume in transportation end uses. As this takes place, recycling of post-consumer scrap will rise but the timing of the increase will be governed by the mix of transportation and the in-service terms of individual modes of transportation. China and India are increasing their use of vehicles at a very rapid rate; if the in-service terms of the vehicles are 10 to 12 years, then post-consumer scrap from this increase is not likely to appear until sometime between 2020 and 2025. Rates of recycling of used beverage cans are typically high in low- to middle-income countries; however, the amount of material recovered is likely to remain modest as the volume of such material will remain at low levels for most of the period of the forecast.
If the proportion of aluminum production that comes from primary smelters increases, at least until 2025, a reduction in GHGs must come from increases in the efficiency of aluminum smelters or in reduced use of fossil fuels for generation of the electricity used in aluminum production. The magnitude of the increases in aluminum consumption suggests that both gains in efficiency and switching of fuel sources will need to be substantial just to maintain emissions at the current level.

57
5. References Cited Airbus S.A.S., 2007, Airbus 2006 results: Airbus S.A.S. press release, January 17, accessed
June 15, 2010, at http://www.airbus.com/en/presscentre/pressreleases/press-release/ ?tx_ttnews%5Bswords%5D=2006%20results&tx_ttnews%5Btt_news%5D=440&tx_ttnews%5BbackPid%5D=1765&cHash=3abca17aca.
Airliners.net, 2010, Aircraft technical data and specifications: Airliners.net, accessed June 15, 2010, at http://www.airliners.net/aircraft-data/.
Alcoa Inc., 2009, Alcoa unloads first bauxite shipment from Juruti in Alumar refinery, in São Luís–MA: Alcoa Inc. press release, October 9, accessed March 10, 2009, at http://www.alcoa.com/brazil/en/news/releases/2009_10_09.asp?initSection=1000.
Anderson, S.T., Bermúdez-Lugo, Omayra, Gurmendi, A.C., Perez, A.A., Wacaster, Susan, Wallace, G.J., and Wilburn, D.R, 2010, The mineral industries of Latin America and Canada, in Area reports—International—Latin America and Canada: U.S. Geological Survey Minerals Yearbook 2007, v. III, p. 1.1–1.34, accessed June 15, 2010, at http://minerals.usgs.gov/minerals/pubs/country/2007/ myb3-sum-2007-latin-canada.pdf.
Aslam, M., Khalil, K., Rasmussen, R.A., Culbertson, J.A., Prins, J.M., Grimsrud, E.P., and Shearer, M.J., 2003, Atmospheric perfluorocarbons: Environmental Science and Technology, v. 37, no. 19, October, p. 4358–61. (Also available at http://dx.doi.org/10.1021/es030327a.)
Associação Brasileira do Alumínio, [undated], Domestic consumption of aluminum products by end use—2008: Associação Brasileira do Alumínio, accessed October 15, 2010, at http://www.abal.org.br/english/industria/estatisticas_consdomsetor.asp.
Aviation Today, 2007, Bombardier deliveries down, t-props up: Aviation Today, February 27, accessed June 15, 2010, at http://www.aviationtoday.com/ran/topstories/ Bombardier-Deliveries-Down-T-Props-Up_8971.html.
BCS, Inc., 2007, U.S. energy requirements for aluminum production—Historical perspective, theoretical limits and current practices: U.S. Department of Energy, February, accessed April 23, 2010, at http://www1.eere.energy.gov/industry/aluminum/pdfs/al_theoretical.pdf.
Beck, T.R., 2008, Electrolytic production of aluminum, in Nagy, Zoltan, ed., Electrochemistry encyclopedia: Cleveland, Ohio, Ernest B. Yeager Center for Electrochemical Sciences (YCES) and the Chemical Engineering Department, Case Western Reserve University, available at http://electrochem.cwru.edu/encycl/art-a01-al-prod.htm.
Boin, U.M.J., and Bertram, M., 2005, Melting standardized aluminum scrap—A mass balance model for Europe: Journal of Metals, v. 57, no. 8, August, p. 26–33.
Boltramovich, Sergey, Dudarev, Grigory, and Gorelov, Vladimir, 2003, The melting iron curtain—A competitive analysis of the Northwest Russian metal cluster: Helsinki, Finland, The Research Institute of the Finnish Economy, Taloustieto Oy, 138 p.
Bray, E.L., 2010a, Aluminum, in Metals and minerals: U.S. Geological Survey Minerals Yearbook 2008, v. I, p. 5.1–5.19, accessed October 14, 2010, at http://minerals.usgs.gov/minerals/pubs/ commodity/aluminum/myb1-2008-alumi.pdf.
Bray, E.L., 2010b, Bauxite and alumina, in Metals and minerals: U.S. Geological Survey Minerals Yearbook 2008, v. I, p. 10.1–10.11, accessed October 14, 2010, at http://minerals.usgs.gov/minerals/ pubs/commodity/bauxite/myb1-2008-bauxi.pdf.
Carbon Emitters, 2009, Do nickel producers emit a lot of carbon?: Carbon Emitters, written blog commun., November 26, accessed February 22, 2010, at http://www.carbonemitters.org/.

58
Chen, Weiqiang, Shi, Lei, Qian, Li, 2009, Substance flow analysis of aluminium in mainland China for 2001, 2004, and 2007—Exploring its initial sources, eventual sinks and the pathways linking them: Resources, Conservation and Recycling, v. 64, issue 9, July, p. 557–570.
CiDRA Minerals Processing, Inc., 2010, CiDRA minerals processing—Alumina refining process solutions: Wallingford, Conn., CiDRA Minerals Processing, Inc. brochure, 4 p., accessed February 2, 2010, at http://www.cidra.com/document_library/BI0349_Alumina_Brochure.pdf.
DeYoung, J.H., Jr., and Menzie, W.D., 1999, The changing uses of mineral information—A government perspective, in Otto, James, and Hyo-Sun, Kim, eds., Proceedings of the workshop on the sustainable development of non-renewable resources toward the 21st century, New York, N.Y., October 15–16, 1998: New York, United Nations Development Programme, p. 111–127.
Ducker Worldwide, LLC, 2008, 2009 update on North American light vehicle aluminum content compared to the other countries and regions of the world—Phase II: Troy, Mich., Ducker Worldwide, LLC presentation, 96 slides, accessed at http://aluminumintransportation.org/downloads/ Ducker%20International%20Final%20Report%202009%20-%20II.pdf.
Empresa Brasileira de Aeronáutica S.A., 2007, Embraer reports fourth-quarter 2006 deliveries and total company backlog; São José dos Campos, Brazil, Empresa Brasileira de Aeronáutica S.A. press release, January 15, 7 p. (Also available at http://www.embraer.com.br/institucional/download/ 2_002-Ins-VPF-Deliveries_4Q2006-I-06.pdf.)
European Aluminium Association, 2008, Environmental profile report for the European aluminium industry: European Aluminium Association, April, 12 p., accessed February 4, 2010, at http://www.eaa.net/upl/4/en/doc/EAA_Environmental_profile_report_May08.pdf.
Fong-Sam, Yolanda, Kuo, C.S., Shi, Lin, Tse, Pui-Kwan, Wacaster, Susan, Wilburn, D.R., and Wu, J.C., 2009, The mineral industries of Asia and the Pacific, in Area reports—International—Asia and the Pacific: U.S. Geological Survey Minerals Yearbook 2007, v. III, p. 1.1–1.34. (Also available at http://minerals.usgs.gov/minerals/pubs/country/2007/myb3-sum-2007-asia-pacific.pdf.)
Fraser, P., Trudinger, C., Dunse, B., Krummel, P, and Steele, P., 2009, PFC emissions from Australian & global aluminum production: 2009 ESRL Global Monitoring Annual Conference, Boulder, Colorado, May 13-14, 2009, Presentation, 27 p., accessed February 4, 2010, at http://www.esrl.noaa.gov/gmd/publications/annmeet2009/presentations/4-Fraser.pdf.
Fraunhofer Institute for Systems and Innovations Research, 2009, Methodology for the free allocation of emission allowances in the EU ETS post 2012—Sector report for the aluminum industry: Study Contract: 07.0307/2008/515770/ETU/C2, Ecofys project no. PECSNL082164, 21 p., accessed May 7, 2010, at http://ec.europa.eu/environment/climat/emission/pdf/bm/BM study - Aluminium.pdf.
FreightCar America, Inc., [undated], Coal and coke cars: FreightCar America, Inc., accessed February 2, 2010, at http://www.freightcaramerica.com/Coke-Coal-Railcars.htm.
FreightCar America, Inc., 2007, Annual report for 2006: Chicago, Ill., FreightCar America, Inc., 69 p. Grishayev, S.I., and Petrov, I.M., 2008, The ratio of primary and secondary raw material in non-ferrous
metal production in Russia: Mineral Resources of Russia, v. 5, p. 17–23. Hatayama, Hiroki, Yamada, Hiroyuki, Daigo, Ichiro, Matsuno, Yasunari, Adachi, Yoshihiro, 2007,
Dynamic substance flow analysis of aluminum and its alloying elements: Materials Transactions, v. 48, no. 9, p. 2518–2524.
Indian Bureau of Mines, 2008, Indian Minerals Yearbook 2007: Nagpur, India, Indian Bureau of Mines, 1,038 p.
International Aluminium Institute, 2003, The aluminum sector greenhouse gas protocol—Greenhouse gas emissions monitoring and reporting by the aluminum industry: International Aluminium Institute, October, 65 p., accessed February 2, 2010, at http://www.world-aluminium.org/cache/fl0000127.pdf.

59
International Aluminium Institute, 2007, Life cycle assessment of aluminum—Inventory data for the primary aluminum industry, year 2005 update: London, United Kingdom, International Aluminium Institute, 42 p.
International Aluminium Institute, 2009a, Aluminium for future generations—2009 update: International Aluminium Institute, 7 p., accessed February 2, 2010, at http://www.world-aluminium.org/cache/fl0000303.pdf.
International Aluminium Institute, 2009b, Fourth sustainable bauxite mining report—IV2008: International Aluminium Institute, 16 p., accessed February 25, 2010, at http://www.world-aluminium.org/cache/fl0000292.pdf.
International Aluminium Institute, 2009c, Results of the 2008 anode effect survey—Report on the aluminum industry’s global perfluorocarbon gases emissions reduction programme: International Aluminium Institute, August 24, 44 p., accessed February 4, 2010, at http://www.world-aluminium.org/cache/fl0000300.pdf.
International Aluminium Institute, 2010, About aluminum—Applications and products—Transportation—Aerospace: International Aluminium Institute, accessed February 4, 2010, at http://www.world-aluminium.org/About+Aluminium/Applications+and+Products/ Transportation/Aerospace/.
International Organization of Motor Vehicle Manufacturers, 2007, 2006 production statistics: International Organization of Motor Vehicle Manufacturers, accessed October 15, 2010, at http://www.oica.net/category/production-statistics/2006-statistics/.
Jet Information Services, Inc., [undated], World jet inventory—Aviation statistics: Jet Information Services, Inc., accessed June 15, 2010, via http://www.jetinventory.com/.
Levine, R.M., Brininstool, Mark, Anderson, S.T., Newman, H.R., Perez, A.A., Wallace, G.J., and Wilburn, D.R., 2010, The mineral industries of Europe and Central Eurasia, in Area reports—International—Europe and Central Eurasia: U.S. Geological Survey Minerals Yearbook 2007, v. III, p. 1.1–1.49, accessed June 15, 2010, at http://minerals.usgs.gov/minerals/pubs/country/2007/ myb3-sum-2007-europe-eurasia.pdf.
Martchek, Kenneth, 2006, Modelling more sustainable aluminium: International Journal of Life Cycle Assessment, v. 11, no. 1, p. 34–37. (Also available at http://dx.doi.org/10.1065/lca2006.01.231.)
Martchek, Kenneth, [2007], Aluminum mass flow modeling and emissions projections: International Aluminium Institute presentation, 17 slides. (Also available at https://www.iea.org/work/2007/ aluminium/martchek.pdf.)
Menzie, W.D., DeYoung, J.H., Jr., and Steblez, W.G., 2001, Some implications of changing patterns of mineral consumption: U.S. Geological Survey Open-File Report 03–382, accessed June 15, 2010, at http://pubs.usgs.gov/of/2003/of03-382/of03-382.html.
Menzie, W.D., Singer, D.A., and DeYoung, J.H., Jr., 2005, Mineral resources and consumption in the 21st century, chap. 2 of Simpson, R.D., Toman, M.A., and Ayres, R.U., eds., Scarcity and growth revisited—Natural resources and the environment in the new millennium: Washington, D.C., Resources for the Future, p. 33–53.
Metals Advisor, 2010, Aluminum competitive issues—Environmental issues: Metals Advisor, accessed May 7, 2010, at http://www.energysolutionscenter.org/heattreat/metalsadvisor/aluminum/ industry_overview/competitive_issues/environmental_issues.htm.
Mobbs, P.M., Wallace, G.J., Wilburn, D.R., Taib, Mowafa, and Yager, T.R., 2010, The mineral industries of the Middle East, in Area reports—International—Africa and the Middle East: U.S. Geological Survey Minerals Yearbook 2007, v. III, p. 42.1–42.12 (Also available at http://minerals.usgs.gov/minerals/pubs/country/2007/myb3-sum-2007-middle-east.pdf.)

60
Nagy, Zoltan, ed., 2010, Electrochemistry enclyclopedia: Ernest B. Yeager Center for Electrochemical Sciences and the Chemical Engineering Department, Case Western Reserve University, accessed October 15, 2010, at http://electrochem.cwru.edu/encycl/.
Papp, J.F., 2009, Recycling—Metals, in Metals and minerals: U.S. Geological Survey 2007, v. I, p. 61.1–61.6. (Also available at http://minerals.usgs.gov/minerals/pubs/commodity/recycle/ myb1-2007-recyc.pdf .)
Plunkert, P.A., 2006, Aluminum recycling in the United States in 2000: U.S. Geological Survey Circular 1196-W, 11 p., accessed February 2, 2010, at http://pubs.usgs.gov/circ/c1196w/. (Supersedes USGS Open-File Report 2005–1051.)
Pontikes, Y., 2005a, Red mud—Production: Red Mud Project, July 13, accessed March 8, 2010, at http://www.redmud.org/Production.html.
Pontikes, Y., 2005b, Red mud—Characteristic: Red Mud Project, May 2, accessed March 8, 2010, at http://www.redmud.org/Characteristics.html.
Pontikes, Y., 2005c, Red mud—Disposal: Red Mud Project, April 22, accessed March 8, 2010, at http://www.redmud.org/Disposal.html.
Pontikes, Y., 2005d, Red mud—Applications: Red Mud Project, March 14, accessed March 8, 2010, at http://www.redmud.org/Applications.html.
Pontikes, Y., 2005e, Red mud—Industrial uses: Red Mud Project, March 14, accessed March 8, 2010, at http://www.redmud.org/Industrial_Uses.html.
Rosenqvist, Terkel, 2004, Principles of extractive metallurgy: Trondheim, Norway, Tapir Academic Press, 506 p.
Royal Boskalis Westminster NV, 2010, The Berbice River project: Royal Boskalis Westminster NV project data sheet, 2 p., accessed March 3, 2010, at http://www.boskalis.nl/ media/downloads/nl_NL/Projecten/Zuid%20Amerika/berbice_river_jan_2010_lr.pdf.
Simmonds, P.G., Greally, B.R., Olivier, S., Nickless, G., Cooke, K.M.., and Dietz, R.N., 2002, The background atmospheric concentrations of cyclic perfluorocarbon tracers determined by negative ion-chemical ionization mass spectrometry: Atmospheric Environment, v. 36, issue 13, May, p. 2147–2156, accessed February 4, 2010, at http://dx.doi.org/10.1016/S1352-2310(02)00194-2.
Singer, D.A., and Menzie, W.D., 2009, Patterns in industrial copper consumption [abs.]: Geological Society of America Abstracts with Programs, v. 41, no. 7, p. 610.
The Boeing Company, 2010, Orders and deliveries: The Boeing Company, accessed June 15, 2010, at http://active.boeing.com/commercial/orders/index.cfm.
U.S. Environmental Protection Agency, 2006, High GWP gases and climate change: U.S. Environmental Protection Agency, accessed February 3, 2010, at http://www.epa.gov/highgwp/ scientific.html.
U.S. Geological Survey, 2010a, Area reports—International: U.S. Geological Survey Minerals Yearbook 2007, v. III, 1,013 p.
U.S. Geological Survey, 2010,, Metals and minerals: U.S. Geological Survey Minerals Yearbook 2007, v. III, 1,070 p.
Yager, T.R., Bermúdez-Lugo, Omayra, Mobbs, P.M., Newman, H.R., Wallace, G.J., and Wilburn, D.R., 2010, The mineral industries of Africa, in Area reports—International—Africa and the Middle East: U.S. Geological Survey Minerals Yearbook 2007, v. III, p. 1.1–1.26. (Also available at http://minerals.usgs.gov/minerals/pubs/country/2007/myb3-sum-2007-africa.pdf.)

61
6. Appendixes Appendix 1. Global bauxite mines in 2007. [km, kilometer; e, estimated; NA, not available]
Major operating company Location Annual capacity1
Australia Baddington open pit bauxite mine {Worsley Alumina Pty. Ltd., manager
[BHP Billiton Ltd., 86%; Japan Alumina Associates (Australia) Pty. Ltd., 10%; Sojitz Alumina Pty. Ltd., 4%]}
50 km northeast of Collie, Western Australia 13,200
Gove open pit bauxite mine (Rio Tinto Alcan, 100%) Gove Peninsula, Northern Territory 8,000 Huntly open pit bauxite mine (Alcoa World Alumina Australia, 100%) 80 km south of Perth, Western Australia 20,000 Weipa-Andoom open pit bauxite mine [Comalco Ltd., operator (Rio Tinto
plc, 100%)] Weipa, Queensland 18,200
Willowdale open pit bauxite mine [Comalco Ltd., operator (Rio Tinto plc, 100%)]
130 km south of Perth, Western Australia 8,600
Azerbaijan Permian deposit Nakhichevan region NA
Bosnia and Herzegovina A.D. Boksit Milici Mine at Milici 1,500 Energoinvest Vlasenica
Jajce Bosanska Krupa Posusje Listica Citluk
2,000
Brazil Alcan Alumínio Poços de Caldas (Alucaldas) (Alcan Alumínio do Brasil S.A.,
100%) Pocos de Caldas, Minas Gerais State (mine) 1,000
Alcoa Alumínio S.A. (Alcoa Inc., 54%; BHP Billiton, 36%; Alcan Aluminum Ltd., 10%)
Pocos de Caldas, Minas Gerais State (mine) 400
Alumar Consortium S.A. (Alcoa Alumínio S.A., 100%) Juriti bauxite mine, Para State 4,000 Companhia Brasileira de Alumínio (CBA) (Votorantim Group, 100%) Mira Mine 5,000 CBA Pocos de Caldas, Minas Gerais State (mine) 1,000 Consortium Paragominas S.A. [Vale S.A., 48.7%; Mineração Rio do Norte
S.A. (MRN), 24.6%; Nippon Amazon Aluminum Co., 12.2%; Companhia Brasileira de Alumínio (CBA), 5.7%; others, 8.8%]
Jabuti, Para State (mine) 5,400
Mineração Rio do Norte S.A. (MRN) (Vale S.A., 40%; BHP Billiton plc, 14.8%; Alcoa Inc., 13.2%; Alcan Empreendimentos Ltda., 12%; Companhia Brasileira de Alumínio (CBA), 10%; Norsk Hydro Comercio e Industria, 5%; Reynolds Aluminio do Brasil, 5%)
Papagalo, Para State (mine) 2,000
MRN Trombetas, Para State (mine) 2,000 MRN Oriximina, Para State (mine) 14,500 Vale do Rio Doce and partners Paragominas II 4,500
China Aluminum Corp. of China Guangxi Huayin2 2,100 Aluminum Corp. of China Nanchuan, Chongquing3 2,000
Dominican Republic Sierra Bauxita Dominicana S.A. Pedernales region (under development) NA
Ghana Ghana Bauxite Co. Ltd. (Alcan Aluminum Ltd., 80%, and Government, 20%) Bauxite mine at Awaso 1,000

62
Appendix 1. Global bauxite mines in 2007.—Continued [km, kilometer; e, estimated; NA, not available]
Greece
Delphi-Distomon S.A.; Hellenic Bauxites of Distomon S.A. (Aluminium de Grèce S.A.)
Delphi-Distomon mine, Voiotia and Fokida 500
Eleusis Bauxites Mines, S.A. Plant in Aghia Marina Plant in Drama Plant in Itea Mine near Drama Mine near Itea Mine in Fthiotis and Fokida
400
S&B Industrial Minerals, S.A. (Eliopoulos-Kyriakopoulos Group) Mine at Fokida Plant at Fokida Plant at Itea
2,000
Guinea Alumina Company of Guinea (United Company RUSAL, 100%) Friguia Mine, Fria 2,800 Compagnie des Bauxites de Guinée (CBG) [Government, 49%, and Halco
Mining Inc., 51% (Halco Mining was a consortium formed by Alcoa Inc., 45%; Alcan Inc., 45%; and Dadco Group, 10%)]
Kamsar Sangaredi
14,000
Compagnie des Bauxites de Kindia (CBK) (United Company RUSAL, 100%) Debele Mine, Kindia 3,000 Guyana
Aroaima Bauxite Co. (United Company RUSAL, 90%, and Government, 10%)
Kwakwani, East Berbice District2 2,000
Omai Bauxite Mining Inc. (Bosai Mining Co. Ltd., 70%, and Government of Guyana, 30%)
Omai Bauxite Mine and Processing Plant located close to Linden on the Demerara River about 100 kilometers south of Guyana’s capital city of Georgetown2
1,500
Hungary Magyar Aluminium Ltd. (MAL) (owns and operates Bakony Bauxite Mines
Ltd.) Bakony District, extending roughly 100
kilometers northeast along Lake Balaton 1,500
India Bharat Aluminium Co. Ltd. (Indian Government, 49%, and Sterlite Industries
Ltd., 51%) Amarkantak Mine, Madhya Pradesh 200
Gujarat Mineral Development Corp. (Gujarat State government, 100%) Kutch Mine, Gujarat Saurashtra Mine, Gujarat
500
Hindalco Aluminium Co. Ltd. (Birla Group, 33%; foreign investors, 26%; private Indian investors, 23%; financial institutions, 18%)
Mines in Lohardaga District, Jharkhand 750
Hindalco Industries Utkal3 3,000 Indian Aluminium Co. Ltd. [Indian interests, 60.4%, and Alcan Aluminium
Ltd. (Canada), 39.6%] Kolhapur district mines, Maharashtra 600
Indian Aluminium Co. Ltd. Mines in Lohardaga District, Jharkhand 200 Minerals & Minerals Ltd. (Indian Government, 100%) Mines in Richuguta, Palamau District,
Jharkhand 200
National Aluminium Co. Ltd. (Indian Government, 100%) Mines in Panchpatmali Hills, Koraput District, Orissa
4,800
Indonesia PT Antam Tbk (Government, 65%) Kijang, Bintan Island, Riau2 1,300
Italy Sardabauxiti S.p.A. (Cogein S.p.A., 40%; Comtec S.p.A., 40%; Icofin Co.,
20%) Mine at Olmedo, Sardinia 350

63
Appendix 1. Global bauxite mines in 2007.—Continued [km, kilometer; e, estimated; NA, not available]
Jamaica Jamaica Aluminum Company (Jamalco) (Alcoa World Alumina and
Chemicals, 50%, and Government, 50%) Bauxite mine, Manchester NA
St. Ann Bauxite Company Ltd. (Falconbridge Ltd., 50%, and Century Aluminum Inc., 50%)
Bauxite mine, Discovery Bay4 4,500
West Indies Alumina Company (WINDALCO) (Glencore International AG, 93%, and Government, 7%)
Bauxite mine, Russell Place NA
West Indies Alumina Company (WINDALCO) (Glencore International AG, 93%, and Government, 7%)
Bauxite mine in Schwallenburgh, Ewarton NA
Kazakhstan Turgayskiy and Krasnooktyabrskiy bauxite mining complexes Central Kazakhstan 5,000
Malaysia Johore Mining and Stevedoring Co. Sdn. Bhd. (Alcan Ltd. of Canada, 61%,
and local investors and others, 39%) Teluk Rumania, Johor Sg. Rengit, Johor
400
Montenegro Niksic Bauxite Mines (Central European Aluminum Co.) Kutsko Brdo2 700
Mozambique E.C. Meikles (Pty) Ltd. Monte Snuta2 e12
Romania Ministry of Industry Oradea-Dobresti Mining Complex, near
Hungarian border 350
Russia Komi Aluminum (SUAL Group) Sredne-Timan 3,000 North-Urals mining company (SUAL Group) Severoural'sk Region NA Severnaya Onega Mine (RUSAL) Severnaya Onega Mine, Northwest Region 800 South-Urals mining company (SUAL Group) South Ural Mountains NA
Sierra Leone Sierra Mineral Holdings I Ltd. (Titanium Resources Group Ltd.) SML Mine, 150 kilometers southeast of
Freetown 1,200
Suriname Suriname Aluminum Co. (Suralco) (Alcoa, Inc., 55%, and BHP Billiton Ltd.,
45%) Kaaimangrasie Mine, open pit mine, located 38
kilometers southeast of Paramaribo (operations started in July 2006)2
2,000
Suralco Klaverblad Mine, open pit mine, 23 kilometers southeast of Paramaribo (to commence in May 2007)2
2,000
Turkey Albuck Madencilik San. ve Tic. A.Ş. Mine near Çırpı, Muğla Province NA Albuck Madencilik San. ve Tic. A.Ş. Mine near Mihalıççık, Eskişehir Province NA Eti Alüminyum A.Ş. (Cengiz Holding) Mines near Madenli, which is located about 25
kilometers south of Seydişehir, Konya Province
500
Venezuela C.V.G. Bauxilum C.A. (Corporación Venezolana de Guayana, 100%) Los Pijiguaos, Bolivar State2 6,000 1In thousand metric tons per year. 2Data are for 2008. 3Data are for 2009. 4Combined capacity for Ewarton and Kirkvine.

64
Appendix 2. Global alumina refineries in 2007. [Unless otherwise noted, locations are for alumina. e, estimated; km, kilometer; NA, not available]
Major operating company Location Annual capacity1
Australia Gladstone alumina refinery [Queensland Alumina Ltd., operator (Rio Tinto
Alcan, 80%, and Rusal, 20%)] Gladstone, Queensland2 3,850
Gove alumina refinery [Alcan Gove Pty Ltd. (Rio Tinto Alcan, 100%)] Nhulunbuy, Gove, Northern Territory2 3,800 Kwinana alumina refinery (Alcoa World Alumina Australia, 100%) Kwinana, Western Australia2 2,100 Pinjarra alumina refinery (Alcoa World Alumina Australia, 100%) Pinjarra, Western Australia2 4,200 Treibacher Schleifmittel AG Plant at Villach3 100 Wagerup alumina refinery (Alcoa World Alumina Australia, 60%, and
Western Mining Corp., 40%) Waroona, Western Australia2 2,600
Worsley alumina refinery [Worsley Alumina Pty. Ltd., manager (BHP Billiton Ltd., 86%, and Japan Alumina Associates (Australia) Pty Ltd., 10%]
20 km northwest of Collie, Western Australia2 3,700
Yarwun alumina refinery (Rio Tinto Alcan, 100%) Gladstone, Queensland2 1,400 Azerbaijan
Gyandzha refinery Ganca 100 Bosnia and Herzegovina
Aluminij d.d. Mostar Plant at Mostar 280 Ukio Banco Investment Group Plants at Birac-Zvornik 600
Brazil Alcan Alumínio do Brasil S.A. [Alcan Aluminum Ltd., 100%] Saramenha, Minas Gerais State (smelter and
refinery) 150
Alumar Consortium S.A. (Alcoa Inc., 54%; BHP Billiton, 36%; Alcan Aluminum Ltd., 10%)
Sao Luis, Maranhao State (refinery)4 3,500
Alumínio do Norte do Brasil S.A. (Alunorte) (Vale S.A., 80%, and Norsk Hydro Comercio e Industria, 20%)
Barcarena, Para State (refinery) 7,400
Companhia Brasileira de Alumínio (CBA) (Votorantim Group, 100%) Sorocaba, Sao Paulo State (refinery) 500 Companhia Geral do Minas (Aluminum Co. of America, 79%, and others,
21%) Pocos de Caldas, Minas Gerais State (refinery) 275
Consortium Paragominas S.A. [Vale S.A., 48.7%; Mineração Rio do Norte S.A. (MRN), 24.6%; Nippon Amazon Aluminum Co., 12.2%; Companhia Brasileira de Alumínio (CBA), 5.7%; others, 8.8%]
Jabuti, Para State (alumina) 1,200
Canada Rio Tinto Alcan (Rio Tinto Group, 100%) Refinery in Vaudreuil, Quebec5 55 Rio Tinto Alcan Refinery in Vaudreuil, Quebec5 18 Rio Tinto Alcan Refinery in Vaudreuil, Quebec6 1,300

65
Appendix 2. Global alumina refineries in 2007.—Continued [Unless otherwise noted, locations are for alumina. e, estimated; km, kilometer; NA, not available]
China Bingzhou Weiqiao Aluminum Co. Shandong, Zouping7 1,600 Chongqing Dingtai Tuoyuan Alumina Co. Chongqing7 150 East Hope (Sanmenxia) Aluminum Co. Ltd. Henan, Sanmenxia4 2,100 Guanxiangxia Aluminum Co. Ltd. Hebei, Yicheng7 200 Guizhou Aluminum Plant [Aluminum Corporation of China (Chinalco)] Guizhou, Guiyang7 1,200 Luoyang Wanji Xiangjiang Aluminum Co. Ltd. Henan, Luoyang7 800 Nanchuan Pioneer Alumina Co. Chongqing7 200 Pingdingshan Huiyuan Chemical Co. Henan, Pingdingshan7 300 Pingguo Aluminum Co. [Aluminum Corporation of China (Chinalco)] Guangxi, Pingguo7 1,200 Shandong Aluminum Plant [Aluminum Corporation of China (Chinalco)] Shandong, Zibo 1,500 Shandong Huayu Alumina Co. Ltd. (Shandong Chiping Xinfa Aluminum
and Electricity Group) Shandong, Chiping7 1,800
Shanxi Aluminum Plant [Aluminum Corporation of China (Chinalco)] Shanxi, Hejin6 2,200 Shanxi Luneng Jinbei Aluminum Co. Ltd. Shanxi, Yuanping7 1,000 Yangquan Coalmine Aluminum (Sanmenxia) Co. Ltd. Henan, Sanmenxia4 1,600 Yixiang Aluminum Co. (Henan Yima Coal Group) Henan, Mainchi7 600 Zhengzhou Aluminum Plant [Aluminum Corporation of China (Chinalco)] Hunan, Zhongzhou7 2,600 Zhongzhou Aluminum Plant [Aluminum Corporation of China (Chinalco)] Hunan, Zhongzhou7 3,000
France Aluminium Pechiney (Alcan Inc., 97.95%) Plant at Gardanne8 200
Germany Almatis GmbH (Dubai International Capital LLC) Plant at Ludwigshafen NA Aluminium Oxid Stade GmbH (DADCO Alumina & Chemicals Ltd.,
100%) Plant at Stade e1,000
Martinswerk GmbH (Albemarle Corporation, 100%) Plant at Bergheim 350 Nabaltec GmbH Plant at Schwandorf 120
Greece Aluminium de Grèce S.A. (AdG) (Mytilineos Holdings S.A., 53%) Agios Nikolaos, Voiotia 750
Guinea Alumina Company of Guinea (United Company RUSAL, 100%) Friguia plan, Fria 640
Hungary Magyar Aluminium Ltd. (MAL) Ajka Timfoldgyar plant, about 120 km southwest
of Budapest, near Lake Balaton 400
MAL Almasfuzito Timfoldgyar plant near the Czech Republic border, 63 km northwest of Budapest
240
MAL Moson-Magyarovar plant, in northwestern corner of Hungary, about 12 km from Austrian and Czech Republic borders
30

66
Appendix 2. Global alumina refineries in 2007.—Continued [Unless otherwise noted, locations are for alumina. e, estimated; km, kilometer; NA, not available]
India Bharat Aluminium Co. Ltd. (Indian Government, 49%, and Sterlite
Industries Ltd., 51%) Korba Refinery, Chhattisgarh 200
Hindalco Industries Ltd. (Birla Group, 33%; foreign investors, 26%; private Indian investors, 23%; financial institutions, 18%)
Renukoot Refinery, Uttar Pradesh 450
Indian Aluminium Co. Ltd. [Indian interests, 60.4%, and Alcan Aluminium Ltd. (Canada), 39.6%]
Belgaum Refinery, Karnataka4 350
Indian Aluminium Co. Ltd. [Indian interests, 60.4%, and Alcan Aluminium Ltd. (Canada), 39.6%]
Muri Refinery, Jharkhand7 450
Madras Aluminium Co. Ltd. (Sterlite Industries Ltd., 80%, and others, 20%) Mettur Refinery, Tamil Nadu 80 National Aluminium Co. Ltd. (Indian Government, 100%) Dhamanjodi Refinery, Orissa4 2,100 Utkal Alumina International Ltd. (Hindalco Industries Ltd., 100%) Koraput Refinery, Orissa 1,500
Iran Iran Alumina Co. (Government) About 15 km northeast of Jajarm 280
Ireland Aughinish Alumina plc (Glencore International AG) Aughinish Island, County Limerick 1,500
Italy Eurallumina S.p.A. (UC Rusal, 56.2%) Plant at Portoscuso, Sardinia 1,000
Jamaica Alumina Partners of Jamaica (ALPART) (Kaiser Aluminum Corp., 65%,
and Hydro Aluminium Jamaica, 35%) Refinery, Nain, St. Elizabeth4 1,700
Jamaica Aluminum Company (Jamalco) (Alcoa World Alumina and Chemicals, 50%, and Government, 50%)
Refinery at Halse Hall, Clarendon, 70 km west of Kingston4
2,240
West Indies Alumina Company (WINDALCO) (Glencore International AG, 93%, and Government, 7%)
Kirkvine Works refinery, Manchester 625
West Indies Alumina Company (WINDALCO) (Glencore International AG, 93%, and Government, 7%)
Ewarton Works refinery, Saint Catherine9 600
Kazakhstan Pavlodar aluminum plant [Eurasian Nautral Resources Corp. (ENRC)] Pavlodar 1,250
Montenegro Kombinat Aluminijuma Podgorica (KAP) (Central European Aluminum
Co., 59%) Podgorica6 280
Romania Alum S.A. (99.4% controlled, directly or indirectly, by Vimetco NV) Plant at Tulcea, Danube Delta 500 Cemtrade Oradea (Part of CEAC Group) Plant at Oradea, near Hungarian border 250
Russia Achinsk (RUSAL) Plant at Achinsk 900 Bogoslovsk (SUAL Group) Bogolovsk aluminum smelter 1,050 Boksitogorsk (RUSAL) Boksitogorsk plant 200 Pikalyovo (SUAL Group) Pikalyovo plant10 300 Uralsk (SUAL Group) Uralsk plant7 1,000

67
Appendix 2. Global alumina refineries in 2007.—Continued [Unless otherwise noted, locations are for alumina. e, estimated; km, kilometer; NA, not available]
Spain Aluminio/Alúmina Española S.A. (Alcoa Inc., 60%, and Alumina Ltd.,
40%) Alumina plant at San Ciprian, Lugo7 1,500
Suriname Suriname Aluminum Co. (Suralco) (Alcoa, Inc., 55%, and BHP Billiton
Ltd., 45%) Refinery at Paranam, producing metallurgical-
grade alumina7 2,200
Turkey Eti Alüminyum A.Ş. (Cengiz Holding) Refinery at Seydişehir, Konya Province 200
Ukraine Mykolayiv refinery Mykolayivs'ka Oblast'4 1,700 Zaporozh'ye (Dneprovsk) refinery Zaporiz'ka Oblast' 245
United States Alcoa, Inc. Point Comfort, Tex. 2,300 Noranda Aluminum Gramercy, La. 1,250 Ormet Corp. Burnside, La. 600 Sherwin Alumina (Glencore International) Corpus Christi, Tex. 1,600
Venezuela C.V.G. Bauxilum C.A. (Corporación Venezolana de Guayana) Ciudad Guayana, Bolivar State4 2,000 1In thousand metric tons per year. 2Alumina refinery. 3Fused alumina. 4Data are for 2009. 5Specialty-grade alumina. 6Smelter-grade alumina. 7Data are for 2008. 8Metallurgical alumina. 9Capacity in thousand dry metric tons per year. 10Permanently closed in 2008.

68
Appendix 3. Global aluminum smelters in 2007. [Unless otherwise noted, locations are for aluminum. e, estimated; km, kilometer; NA, not available]
Major operating company Location Annual capacity1
Argentina Aluar Aluminio Argentino S.A.I.C. (private, 100%) Abasto, Buenos Aires Province2
Puerto Madryn, Chubut Province2 460
Australia Bell Bay aluminum smelter (Rio Tinto Alcan, 100%) Bell Bay, Tasmania 160 Boyne Island aluminum smelter [Boyne Smelters Ltd., operator (Rio Tinto
Alcan, 64%; Sumitomo Light Metal Industries Ltd., 17%; Ryowa Development Pty. Ltd., 12%; Kobe Steel Ltd., 5%; Sumitomo Chemical Co. Ltd., 2%)
Boyne Island, Queensland 550
Kurri Kurri aluminum smelter (Hydro Aluminium Kurri Kurri Pty. Ltd., 100%)
Kurri Kurri, near Newcastle, New South Wales
165
Point Henry aluminum smelter (Alcoa of Australia, 100%) Point Henry, Victoria2 225 Portland aluminum smelter [Alcoa of Australia, 55%, manager; China
International Trust Investment Co. (China's state-owned company), 22.5%; Marubeni Australia Pty. Ltd., 22.5%]
Portland, Victoria2 388
Tomago aluminum smelter [Tomago Aluminium Co. Pty. Ltd., operator (Gove Aluminium Finance Ltd., 36.05%; Rio Tinto Alcan, 51.55%; Hydro Aluminium, 12.40%)]
Tomago, New South Wales 525
Azerbaijan Sumgait smelter Sumqayit 60
Bahrain Aluminium Bahrain B.S.C. (Alba) (Bahrain Mumtalakat Holding Co., 77%;
SABIC Industrial Investments, 20%; Breton Investments, 3%) Sitra (primary and secondary) 850
Bosnia and Herzegovina Aluminij d.d. Mostar Smelter at Mostar 150
Brazil Albras-Alumínio Brasileiro S.A. (Albras) [Vale S.A., 51%, and Nippon
Amazon Aluminio Co. (NAAC), 49%] Vila do Conde, Para State (smelter) Belém, Para State (smelter)
455
Alcan Alumínio do Brasil S.A. [Alcan Aluminum Ltd., 100%] Saramenha, Minas Gerais State (smelter and refinery)
100
Alcan Empreendimentos Ltda. (Alcan Alumínio do Brasil S.A., 100%) Lamininacao de Pindamonhangaba, Sao Paulo State (smelter)
280
Alcoa Alumínio S.A. (Alcoa Inc., 54%; BHP Billiton, 36%; Alcan Aluminum Ltd., 10%)
Sao Luiz, Maranhao State (smelter) 239
Alumar Consortium S.A. (Alcoa Inc., 53.66%; BHP Billiton, 46.34%) Sao Luis, Maranhao State (smelter) 1,000 Alumínio do Brasil Nordeste S.A. (Alcan Aluminum Ltd., 100%) Aratu, Bahia State (smelter) 120 Companhia Brasileira de Alumínio (CBA) (Votorantim Group, 100%) Sorocaba, Sao Paulo State (smelter) 400 Companhia Geral do Minas (Aluminum Co. of America, 79%, and others,
21%) Pocos de Caldas, Minas Gerais State (smelter) 95
Aluvale (Vale S.A., 100%) Santa Cruz, Rio de Janeiro State (smelter) 95 Cameroon
Compagnie Camérounaise de l'Aluminium (Alcan Inc., 46.7%) Plant at Edea 95

69
Appendix 3. Global aluminum smelters in 2007.—Continued [Unless otherwise noted, locations are for aluminum. e, estimated; km, kilometer; NA, not available]
Canada Alcoa Ltd. (Alcoa Inc., 100%) Smelter in Baie-Comeau, Quebec 438 Aluminerie Alouette Inc. (Rio Tinto Alcan, 40%; Aluminium Austria Metall
Québec, 20%; Hydro Aluminum, 20%; Société générale de financement du Québec, 13.33%; Marubeni Québec Inc., 6.67%)
Smelter in Sept-Iles, Quebec 572
Aluminerie Lauralco Inc. (Alcoa Inc., 100%) Deschambault, Quebec 254 Aluminiere de Bécancour Inc. (Alcoa Inc., 75%, and Rio Tinto Alcan, 25%) Smelter in Becancour, Quebec 407 Rio Tinto Alcan (Rio Tinto Group, 100%) Smelter in Alma, Quebec 415 Rio Tinto Alcan (Rio Tinto Group, 100%) Smelter in Arvida, Jonquiere, Quebec 166 Rio Tinto Alcan (Rio Tinto Group, 100%) Smelter in Beauharnois, Quebec3 52 Rio Tinto Alcan (Rio Tinto Group, 100%) Smelter in Grande-Baie, Quebec 207 Rio Tinto Alcan (Rio Tinto Group, 100%) Smelter in Kitimat, British Columbia 277 Rio Tinto Alcan (Rio Tinto Group, 100%) Smelter in Laterriere, Quebec 228 Rio Tinto Alcan (Rio Tinto Group, 100%) Smelter in Shawinigan, Quebec 99
China Baiyin Aluminum Plant Gansu, Baiyin 150 Baotou Aluminum Plant Nei Mongol, Baotou 250 Bingzhou Weiqiao Aluminum Co. Shandong, Zouping 250 Chalco Zunyi Aluminum Co. Ltd. Guizhou, Zunyi 130 East Hope Aluminum Plant Nei Mongol, Baotou 330 Fushun Aluminum Plant Liaoning, Fushun 190 Guizhou Aluminum Plant [Aluminum Corporation of China (Chinalco)] Guizhou, Guiyang 400 Hanjiang Danjiangkou Aluminum Co. Ltd. Hubei, Danjiangkou 110 Henan Shenhuo Aluminum-Electricity Co. Ltd. Henan, Yongcheng 200 Henan Wanji Aluminum Co. Ltd. Henan, Luoyang 180 Henan Zhongfu Industry Co. Ltd. Henan, Gongyi 180 Henan Zhongmai Mianchi Aluminum Plant Henan, Mianchi 400 Huaze Aluminum and Power Co. Ltd. Shanxi, Hejin 400 Hunan Chuanquan Aluminum Co. Ltd. Hunan, Taoyuan 210 Jiaozuo Wanfang Aluminum Co. Ltd. Henan, Jiaozuo 420 Lanzhou Aluminum Plant Gansu, Lanzhou 210 Liancheng Aluminum Plant Gansu, Lanzhou 235 New Orient Aluminum Co. Ltd. Shanxi, Taiyuan 75 Pingguo Aluminum Co. (Chinalco) Guangxi, Pingguo 380 Qiaotou Aluminum Co. Electrolysis Branch Qinghai, Datong 350 Qinghai Aluminum Smelter (Chinalco) Qinghai, Xining 560 Qinghai West Mining Baihe Aluminum Co. Ltd. Qinghai, Xining 112 Qingtongxia Aluminum Plant Ningxia, Qingtongxia 580 Sanmenxia Tianyuan Aluminum Co. Ltd. Henan, Sanmenxia 110 Shandong Aluminum Plant (Chinalco) Shandong, Zibo 120 Shandong Chiping Xinfa Aluminum and Power Group Shandong, Chiping 360 Shandong Nanshan Industry Co. Ltd. Shandong, Longkou 280 Shangqiu Aluminum Smelter Henan, Shangqiu 180 Shanxi Guanlu Aluminum Co. Ltd. Shanxi, Yuncheng 210 Taishan Aluminum-Power Co. Ltd. Shandong, Fecheng 125

70
Appendix 3. Global aluminum smelters in 2007.—Continued [Unless otherwise noted, locations are for aluminum. e, estimated; km, kilometer; NA, not available]
China—Continued Tongchuan Xingguang Aluminum Co. Ltd. Shaanxi, Tongchuan 250 Yichuan Yugang Longquan Aluminum Co. Henan, Yichuan 600 Yinhai Aluminum Co. Ltd. Guangxi, Laibin 125 Yunnan Aluminum Plant Yunnan, Kunming 500 Zhengzhou Aluminum Plant (Chinalco) Henan, Zhengzhou 60 Zouping Aluminum Co. Ltd. Shandong, Zouping 150
Egypt Aluminium Co. of Egypt (Egyptalum) (Government, 80%, and private
interests, 20%) Nag Hammadi 230
France Aluminium Dunkerque (Alcan Inc., 97.95%) Dunkerque, Calais du Nord 250 Aluminium Pechiney (Alcan Inc., 97.95%) Saint-Jean-de-Maurienne, Savoie Province 120 Aluminium Pechiney Nogueres, Pyrenees, Atlantiques Province 115 Aluminium Pechiney Lannemezan, Hautes-Pyrenees Province4 63 Aluminium Pechiney Auzat, Arieege Province (closed) 50
Germany Aluminium Norf GmbH [Novelis Inc. (Hindalco Industries Ltd., 100%),
50%, and Hydro Aluminium Deutschland GmbH, 50%] Lippenwerk at Lünen (secondary) 1,500
Corus Aluminium Voerde GmbH (Tata Steel Ltd., 100%) Primary smelter at Voerde, North Rhine-Westphalia
90
Hamburger Aluminium-Werk GmbH (HAW) (Trimet Aluminium AG, 100%)
Primary smelter at Hamburg 133
Hydro Aluminium Deutschland GmbH (Norsk Hydro ASA, 100%) Rheinwerk primary smelter at Neuss 230 Trimet Aluminium AG Smelter at Essen-Borbeck 175
Ghana Volta Aluminum Co. Ltd. (Valco) (Government, 90%, and Alcoa Inc., 10%) Aluminum smelter at Tema 200
Greece Aluminium de Grèce S.A. (AdG) (Mytilineos Holdings S.A., 53%) Agios Nikolaos, Voiotia 160
Hungary INOTAL Aluminium Processing Ltd. Inota plant, near Varpalota, 75 km southwest
of Budapest (primary)5 35
Iceland Century Aluminum Co. Grundartangi 260 Icelandic Aluminium [ISAL], (Alusuisse-Lonza Holding Ltd., 100%) Straumsvik 162
India Bharat Aluminium Co. Ltd. (Indian Government, 49%, and Sterlite
Industries Ltd., 51%) Korba Smelters, Chhattisgarh 350
Hindalco Industries Ltd. (Birla Group, 33%; foreign investors, 26%; private Indian investors, 23%; financial institutions, 18%)
Hirakud Smelter, Orissa6 155
Hindalco Industries Ltd. Renukoot Smelter, Uttar Pradesh2 345 Indian Aluminium Co. Ltd. [Indian interests, 60.4%, and Alcan Aluminium
Ltd. (Canada), 39.6%] Alupuram Smelter, Kerala 20
Indian Aluminium Co. Ltd. Belgaum Smelter, Karnataka 70 Madras Aluminium Co. Ltd. (Sterlite Industries Ltd., 80%, and others, 20%) Mettur Smelter, Tamil Nadu 40 National Aluminium Co. Ltd. (Indian Government, 100%) Angul Smelter, Orissa6 460

71
Appendix 3. Global aluminum smelters in 2007.—Continued [Unless otherwise noted, locations are for aluminum. e, estimated; km, kilometer; NA, not available]
Indonesia PT Indonesia Asahan Aluminum (Nippon Asahan Aluminum Co. Ltd., 59%,
and Government, 41%) Kual Tanjun, North Sumatra 250
Iran Almahdi Aluminium Corp. [Iranian Mines and Mining Industries
Development and Renovation Organization (IMIDRO),3 59.34%, and International Development Corp., 20.78%]
Bandar Abbas2 260
Iran Aluminium Co. [Iranian Mines and Mining Development and Renovation Organization (IMIDRO)]
Arak 155
Italy Alcoa Italia S.p.A. Smelters at Fusina, near Venice 44 Alcoa Italia S.p.A. (Alcoa Inc., 100%) Smelters at Porto Vesme, Sardinia 159
Montenegro Kombinat Aluminijuma Podgorica (KAP) (Central European Aluminum Co.,
59%) Podgorica (primary) 120
Mozambique Mozambique Aluminum SARL (BHP Billiton Ltd., 47%) Mozal smelter at Beluluane 563
Netherlands Corus Group Smelter at Delfzijl (primary) 100 Pechiney Nederland NV (Alcan Inc., 85%) Plant at Flushing (Vlissingen) (primary) 230 Pechiney Nederland NV (Alcan Inc., 85%) Plant at Flushing (Vlissingen) (billet) 213
New Zealand Tiwai Point smelter [New Zealand Aluminium Smelters Ltd. (Rio Tinto
Alcan, 79.36%, and Sumitomo Chemical Co., 20.64%)] Southland, Invercargill 350
Nigeria Aluminum Smelter Co. of Nigeria, Ltd. (ALSCON) (United Company
RUSAL, 77.5%) Smelter at Ikot Abasi7 193
Norway Elkem Aluminium ANS (Elkem A/S, 50%, and Alcoa Inc., 50%) Smelter at Farsund (Lista)8 96 Elkem Aluminium ANS (Elkem A/S, 50%, and Alcoa Inc., 50%) Smelter at Mosjoen8 190 Hydro Aluminium ANS (Norsk Hydro A/S, 70%) Plant at Holmestrand8 176 Hydro Aluminium ANS (Norsk Hydro A/S, 70%) Smelter at Ardal8 233 Hydro Aluminium ANS (Norsk Hydro A/S, 70%) Smelter at Hoyanger8 60 Hydro Aluminium ANS (Norsk Hydro A/S, 70%) Smelter at Karmoy8 290 Hydro Aluminium ANS (Norsk Hydro A/S, 70%) Smelter at Sunndal8 360 Sor-Norge Aluminium A/S (Alusuisse Group, 50%, and Hydro Aluminium
ANS, 49%) Smelter at Odda 50
Poland Aluminum Konin-Impexmetal S.A. Smelter at Konin (primary) 55
Romania Alro S.A. (87% controlled, directly or indirectly, by Vimetco NV) Slatina, 120 km west of Bucharest (primary) 300

72
Appendix 3. Global aluminum smelters in 2007.—Continued [Unless otherwise noted, locations are for aluminum. e, estimated; km, kilometer; NA, not available]
Russia Bogoslovsk (SUAL Group) Bogoslovsky plant (primary)2 190 Bratsk (RUSAL) Bratsk plant (primary) 950 Irkutsk (SUAL Group) Irkutsk plant (primary)2 460 Kandalaksha (SUAL Group) Kandalaksha plant (primary) 75 Khakaz (RUSAL) Khakaz plant (primary)2 370 Krasnoyarsk (RUSAL) Krasnoyarskiy plant (primary)2 1,000 Nadvoitsy (SUAL Group) Nadvoitsy plant (primary) 75 Novokuznetsk (RUSAL) Novokuznetsk plant (primary)2 330 Sayansk (RUSAL) Sayansk plant (primary)2 520 Uralsk (SUAL Group) Uralsk plant (primary) 150 Volgograd (SUAL Group) Volgograd plant (primary) 175 Volkhov (SUAL Group) Volkhov plant (primary) 20
Slovakia ZSNP Aluminum Works (Slovalco a.s.) Ziar, Central Slovakia 195
Slovenia Talum d.d. Kidričevo Smelter at Kidricevo 120
South Africa BHP Billiton Ltd. Bayside smelter at Richards Bay 180 BHP Billiton Ltd. Hillside smelter at Richards Bay 700
Spain Alcoa Inespal S.A. (Alcoa Inc., 100% Electrolytic plant at Aviles 93 Alcoa Inespal S.A. (Alcoa Inc., 100%) Electorlytic plant at La Coruña 87 Aluminio/Alúmina Española S.A. (Alcoa Inc., 60%, and Alumina Ltd., 40%) Electrolytic plant at San Ciprian, Lugo 228
Sweden Granges AB (Glencore International AG, 100%) Sundsvall smelter at Kubikenborg 100
Switzerland Novelis Inc. (Hindalco Industries Ltd., 100%) Plant at Sierre9 168
Tajikistan Tajik aluminum plant (TadAZ) Tursunzade 517
Turkey Eti Alüminyum A.Ş. (Cengiz Holding) Smelter at Seydişehir, Konya Province 65
Ukraine Zaporozh'ye (Dneprovsk) smelter Zaporiz'ka Oblast' (primary) 120
United Arab Emirates Dubai Aluminum Company Ltd. (Investment Corporation of Dubai, 100%) Jebel Ali, Dubai 950
United Kingdom Anglesey Aluminium Metal Ltd. (Rio Tinto Corp., 51%, and Kaiser
Aluminum and Chemical Corp., 49%) Holyhead, Gwynedd, Wales (primary)3 144
British Alcan Aluminium Ltd. Locchaber Smelter, Fort William, Scotland (primary)
41
British Alcan Aluminium Ltd. Lynemouth Smelter, Northumberland, England (primary)
169

73
Appendix 3. Global aluminum smelters in 2007.—Continued [Unless otherwise noted, locations are for aluminum. e, estimated; km, kilometer; NA, not available]
United States Alcoa Alcoa, Tenn. (primary) 215 Alcoa Evansville, Ind. (primary) 309 Alcoa Ferndale, Wash. (primary) 278 Alcoa Massena (east), N.Y. (primary) 130 Alcoa Massena (St. Lawrence), N.Y. (primary) 125 Alcoa Rockdale, Tex. (primary) 267 Alcoa Wenatchee, Wash. (primary) 184 Alcoa/Century Mount Holly, S.C. (primary) 224 Century Aluminum Hawesville, Ky. (primary) 244 Century Aluminum Ravenswood, W. Va. (primary) 170 Glencore Columbia Falls, Mt. (primary) 168 Noranda New Madrid, Mo. (primary) 250 Ormet Hannibal, Ohio (primary) 265 Rio Tinto Alcan Sebree, Ky. (primary) 196
Venezuela C.V.G. Aluminio del Caroní, S.A. (Corporación Venezolana de Guayana and
others) Ciudad Guayana, Bolivar State 210
C.V.G. Venezolana de Aluminio C.A. (Corporación Venezolana de Guayana, 80%, and Showa Denko K.K., Kobe Steel Ltd., Sumitomo Chemical Co. Ltd., Mitsubishi Materials Corp., Mitsubishi Aluminum Co., and Marubeni Corp., 20%)
Ciudad Guayana, Bolivar State 430
1In thousand metric tons per year. 2Data are for 2009. 3Permanently closed in 2009. 4Permanently closed in 2008. 5Closed. 6Data are for 2008. 7Under rehabilitation. 8Soderberg pots closed. 9Permanently closed in 2006.