the global market for mineral fertilisers with ...for mineral fertilisers with consideration of the...
TRANSCRIPT

no 16.1Warsaw 2011
The global market
for mineral fertilisers
with consideration
of the changes
in the prices of direct
energy carriers
and raw materials
Arkadiusz Zalewski
W
n2011arsaw W
16.1o

The global market
for mineral fertilisers
with consideration
of the changes
in the prices of direct
energy carriers
and raw materials


The global market
for mineral fertilisers
with consideration
of the changes
in the prices of direct
energy carriers
and raw materials
Arkadiusz Zalewski
Warsaw 2011

This publication was prepared as a contribution to the research on the following subject Monitoring of agri-food markets under changing economic conditions within the framework of the research task Monitoring and assessment of changes on global agricultural markets The purpose of this paper is to analyze the changes that have taken place in the world market of mineral fertilizers in 2000-2010 in the area of demand, supply, foreign trade and their impact on prices, as well as direct links with the energy market, raw material market for production of mineral fertilizers and agricultural commodity markets. Reviewer Professor Jan Pawlak Translated by Agit T�umaczenia
Proofreader Joanna Gozdera Technical editor Leszek �lipski Cover Project AKME Projekt Sp. z o.o. ISBN 978-83-7658-214-6 Instytut Ekonomiki Rolnictwa i Gospodarki �ywno�ciowej – Pa�stwowy Instytut Badawczy 00-950 Warszawa, ul. �wi�tokrzyska 20, skr. poczt. nr 984 tel.: (22) 50 54 444 faks: (22) 50 54 636 e-mail: [email protected] http://www.ierigz.waw.pl

Table of contents
Introduction .............................................................................................................................. 7
1. The production and foreign trade in raw materials used for the production of mineral fertilisers ............................................................................................................................... 8 1.1. Ammonia........................................................................................................................................ 8 1.2. Natural gas ................................................................................................................................... 11 1.3. Phosphorites................................................................................................................................. 15 1.4. Phosphoric acid............................................................................................................................ 17 1.5. Potassium salt............................................................................................................................... 17
2. Mineral fertiliser production............................................................................................. 20 2.1. Nitrogenous fertiliser production................................................................................................ 23 2.2. Phosphoric fertiliser production.................................................................................................. 25 2.3. Potassium fertiliser production ................................................................................................... 26
3. Mineral fertiliser foreign trade ......................................................................................... 29 3.1. Nitrogenous fertiliser international trade.................................................................................... 30 3.2. Phosphoric fertiliser international trade ..................................................................................... 32 3.3. Potassium fertiliser international trade....................................................................................... 34
4. Mineral fertiliser consumption ......................................................................................... 36 4.1. Factors influencing global mineral fertiliser consumption ....................................................... 36 4.2. Global mineral fertiliser consumption........................................................................................ 38 4.3. Mineral fertiliser consumption in selected countries................................................................. 39 4.4. The consumption of mineral fertilisers for the most important cultivation ............................. 43 4.5. The balance of mineral fertilisers in selected countries ............................................................ 43
5. Mineral fertiliser prices ..................................................................................................... 45 5.1. The prices of raw materials for fertiliser production................................................................. 45 5.2. The global market prices of mineral fertilisers .......................................................................... 47 5.3. The prices of the most important mineral fertilisers.................................................................. 50 5.4. The prices of mineral fertilisers in selected countries ............................................................... 51 5.5. The prices of direct energy carriers and sea freight................................................................... 53
Summary................................................................................................................................. 63

7
Introduction
Since the beginning of the nineties, the Institute of Agricultural and Food Economics has been monitoring the market for mineral fertilisers1. Recent years have seen a rise in the impact of the global market on the domestic market, which caused an unusual rise in fertiliser prices during the years 2007-2008. Poland is an important player on the fertiliser market, as it is an importer of many raw materials for its production, mainly for the needs of the domestic market, and an exporter of produced fertiliser surpluses. This has created the need to analyse the changes within the global market. The presented report is the first in a series of reports monitoring the changes in the global mineral fertiliser market, which in future years will be made annually. This is being induced not only by the impact of the global market on domestic prices, but also by the new challenges faced by the agriculture sector, such as the preservation of food production growth for the continuously-growing global population, and the increase in the agricultural share in the solution of global energy and climate problems.
The objective of the report is to present the vital issues impacting on the supply and demand situation on the global mineral fertiliser market, particularly the factors which collectively caused the prices of mineral fertilisers in 2008 to rise by as much as several hundred percent in comparison to previous years. The answer to the following question is also attempted: how did the strong economic growth of the developing coun-tries (mainly China, India, Brazil and Russia) influence the mineral fertiliser market?
The time span of the first report will cover the years 2000-2010, since this was a period of significant changes in the field of global production, consumption and global trade. The report also presents the most significant market participants from both the sides of supply and demand. The first chapter discusses the market for raw materials which are used for the production of mineral fertilisers, focussing on the strong con-centration and control of the supply of many raw materials by the most significant ex-porters. Chapters two and three present the production and foreign trade in produced mineral fertilisers for specific market segments. Chapter four discusses the global scale of mineral fertiliser consumption, indicating the significant differences between the developed and the developing countries. Chapter five presents the trends of changes in the prices of fertilisers and the raw materials utilised in the process of their production, as well as other factors with indirect impact on the prices of mineral fertilisers, includ-ing the prices of petroleum and sea freight.
1 In the scope of the annually-published report on the means of production market.
8
1. The production and foreign trade in raw materials used for the production of mineral fertilisers
1.1. Ammonia
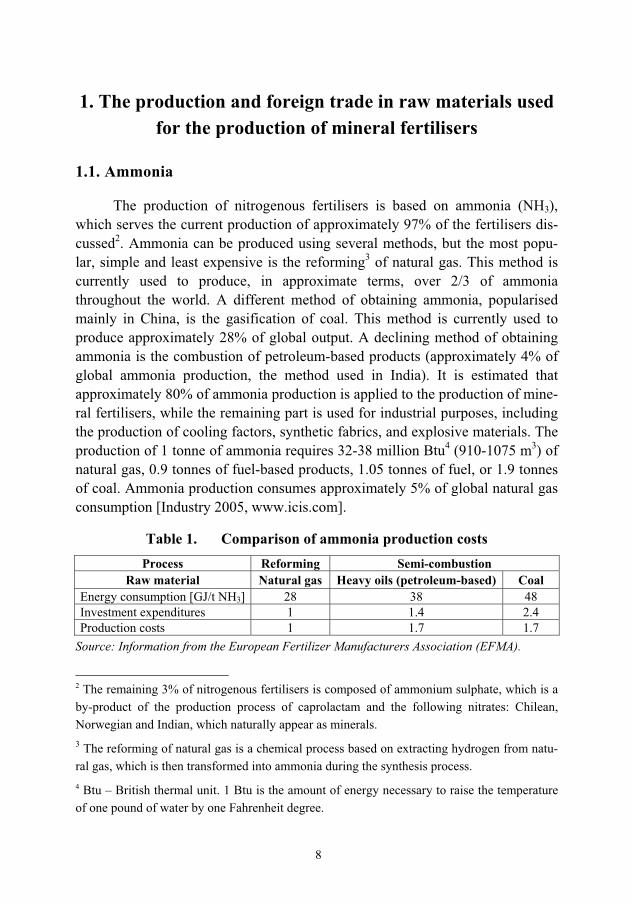
The production of nitrogenous fertilisers is based on ammonia (NH3), which serves the current production of approximately 97% of the fertilisers dis-cussed2. Ammonia can be produced using several methods, but the most popu-lar, simple and least expensive is the reforming3 of natural gas. This method is currently used to produce, in approximate terms, over 2/3 of ammonia throughout the world. A different method of obtaining ammonia, popularised mainly in China, is the gasification of coal. This method is currently used to produce approximately 28% of global output. A declining method of obtaining ammonia is the combustion of petroleum-based products (approximately 4% of global ammonia production, the method used in India). It is estimated that approximately 80% of ammonia production is applied to the production of mine-ral fertilisers, while the remaining part is used for industrial purposes, including the production of cooling factors, synthetic fabrics, and explosive materials. The production of 1 tonne of ammonia requires 32-38 million Btu4 (910-1075 m3) of natural gas, 0.9 tonnes of fuel-based products, 1.05 tonnes of fuel, or 1.9 tonnes of coal. Ammonia production consumes approximately 5% of global natural gas consumption [Industry 2005, www.icis.com].
Table 1. Comparison of ammonia production costs Process Reforming Semi-combustion
Raw material Natural gas Heavy oils (petroleum-based) Coal Energy consumption [GJ/t NH3] 28 38 48 Investment expenditures 1 1.4 2.4 Production costs 1 1.7 1.7
Source: Information from the European Fertilizer Manufacturers Association (EFMA).
2 The remaining 3% of nitrogenous fertilisers is composed of ammonium sulphate, which is a by-product of the production process of caprolactam and the following nitrates: Chilean, Norwegian and Indian, which naturally appear as minerals. 3 The reforming of natural gas is a chemical process based on extracting hydrogen from natu-ral gas, which is then transformed into ammonia during the synthesis process. 4 Btu – British thermal unit. 1 Btu is the amount of energy necessary to raise the temperature of one pound of water by one Fahrenheit degree.

9
On the basis of information from the International Fertilizer Industry As-sociation (IFA), global ammonia production in 2010 was 159 million tonnes, and rose within 10 years by 22%; the growing production trend slowed down during the years 2008-2009, but another production rise has been observed since 2010. Ammonia production in 2010 involved slightly over 80% of production capacities, which are currently estimated at 195 million tonnes. Until 2015, there are plans to increase ammonia production capacity to 230 million tonnes, mainly in countries with access to relatively cheap natural gas (i.e. China, Venezuela, Qatar, Trinidad and Tobago, Saudi Arabia, Oman), through the construction of new ammonia production installations and the expansion of the existing ones [www.fertilizer.org].
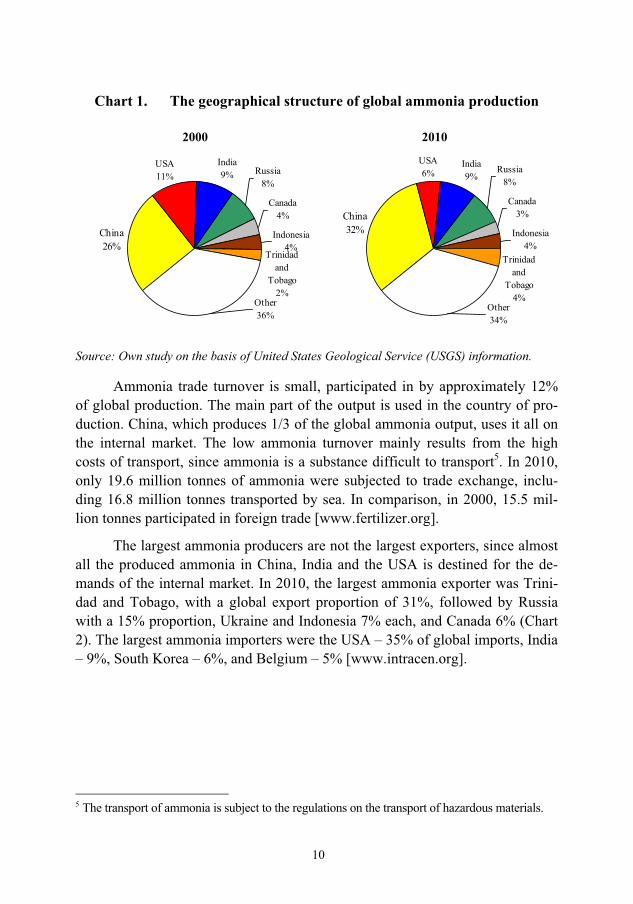
Ammonia production is dispersed among approximately 70 countries, but the main production segment is concentrated in several countries with enormous reserves of natural gas and coal, which also have the lowest prices. The largest ammonia producer is China, which produced over 32% of global output in 2010. The proportion of the other leading producers is much smaller, and presents it-self as follows: from 8-9% (India and Russia) to 4-6% (the USA, Indonesia, Tri-nidad and Tobago). The total proportion of the 5 largest ammonia producers is almost 60% (Chart 1). Among the largest ammonia producers during the past 10 years, production growth was recorded in China – 50%, Russia – 20%, and India – 16%, while the USA saw a production drop of 33% [www.fertilizer.org, www.minerals.usgs.gov].
10
Chart 1. The geographical structure of global ammonia production
2000
India9% Russia
8%
Canada4%
Indonesia4%
Other36%
Trinidad and
Tobago2%
China26%
USA11%
2010
India9%
Russia8%
Canada3%
Indonesia4%
Other34%
Trinidad and
Tobago4%
China32%
USA6%
Source: Own study on the basis of United States Geological Service (USGS) information.
Ammonia trade turnover is small, participated in by approximately 12% of global production. The main part of the output is used in the country of pro-duction. China, which produces 1/3 of the global ammonia output, uses it all on the internal market. The low ammonia turnover mainly results from the high costs of transport, since ammonia is a substance difficult to transport5. In 2010, only 19.6 million tonnes of ammonia were subjected to trade exchange, inclu-ding 16.8 million tonnes transported by sea. In comparison, in 2000, 15.5 mil-lion tonnes participated in foreign trade [www.fertilizer.org].
The largest ammonia producers are not the largest exporters, since almost all the produced ammonia in China, India and the USA is destined for the de-mands of the internal market. In 2010, the largest ammonia exporter was Trini-dad and Tobago, with a global export proportion of 31%, followed by Russia with a 15% proportion, Ukraine and Indonesia 7% each, and Canada 6% (Chart 2). The largest ammonia importers were the USA – 35% of global imports, India – 9%, South Korea – 6%, and Belgium – 5% [www.intracen.org].
5 The transport of ammonia is subject to the regulations on the transport of hazardous materials.

11
The main ammonia trading centre is located in the Yuzhniy port on the Black Sea. From here, ammonia from Russia and Ukraine is exported mainly to the USA and European states. Large amounts of ammonia are also exported from Trinidad and Tobago to the USA, from Canada to the USA, from the Near East to India, and from Indonesia to South Korea [www.yara.dk].
Chart 2. The global structure of ammonia exports volume
2001
Ukraine12%
Indonesia7%
Malaysia7%
Canada6%
Other29%
Trinidad and
Tobago21%
Russia18%
2010
Ukraine7%
Indonesia7%
Canada6%
Other34%
Trinidad and
Tobago31%
Russia15%
Source: Own study on the basis of World Trade Organisation (WTO) information.
1.2. Natural gas6
Natural gas is the basic and least expensive raw material in ammonia pro-duction. The proportion of the cost of natural gas in ammonia production, de-pending on the production method, is between 72 and 85% [Huang 2007].
Global reserves7 of natural gas are currently estimated at over 187 trillion m3, but they are systematically growing with new discoveries. At the beginning of the eighties, they were estimated at 81 trillion m3, i.e. over twice as low as currently. Glo-bal reserves of natural gas are growing, with fluctuations, at an average rate of approximately 2.9% per year. The highest growth in the quantity of recognised natural gas reserves during the past quarter-century was in 1989, in the current Russia, when the estimates were expanded by over 8 trillion m3, i.e. over 12% of global reserves.
6 Created on the basis of British Petroleum information – www.bp.com/statisticalreview. 7 These reserves are part of the reserves exploitable under present technical and economic conditions. These reserves form the total quantity of given energy raw materials within the Earth’s crust assessed as possible to obtain.

12
The largest reserves of natural gas in 2010 were possessed by the Russian Federation – 24% of global reserves, as well as Near East countries Iran – 16% and Qatar – 15%. The USA, Saudi Arabia and Turkmenistan possess signifi-cantly smaller beds – 4% of global reserves, and are followed by the United Arab Emirates and Nigeria – 3%.
In recent years, the market for unconventional gas, i.e. mainly produced from shale, has been developing dynamically. Shale gas is extracted mainly in the USA, which have globally-unique technologies allowing the economically-justified exploitation of the said gas. Currently, approximately 10% of USA-produced gas comes from shale, and its reserves in the USA alone are estimated at over 200 trillion m3 [www.efixpolska.com].
3.2 trillion m3 of natural gas was produced in the world in 2010, one-third more than 10 years before. The production of natural gas is dominated by certain countries, including Russia, which mainly supplies European clients and the USA, which use the gas for internal consumption. In 2010, the largest propor-tion of the global production of natural gas was possessed by the USA – 19%, Russia – 18%, and Canada – 5% (Chart 4).

13
Chart 3. Confirmed natural gas deposits (trillion m3) in 2010
2,0
2,2
2,4
2,8
2,9
3,1
3,2
4,5
5,3
5,5
6,0
7,7
8,0
8,0
25,3
29,6
44,8
0 5 10 15 20 25 30 35 40 45 50
Norway
Egypt
Malaysia
China
Australia
Indonesia
Iraq
Algeria
Nigeria
Venezuela
United Arab Emirates
United States
Saudi Arabia
Turkmenistan
Qatar
Iran
Russia
Source: Information from the British Petroleum (BP) Statistical Review of World Energy.
Chart 4. The global structure of natural gas extraction
2000
Great Britain
5%
Algeria4%
Canada8%
Indonesia3%
Other36%
USA22%
Russia22%
2010
Qatar4%
Iran4%
Canada5%
Norway3%
Other44%
China3%
USA19%
Russia18%
Source: Own study on the basis of BP Statistical Review of World Energy information.
14
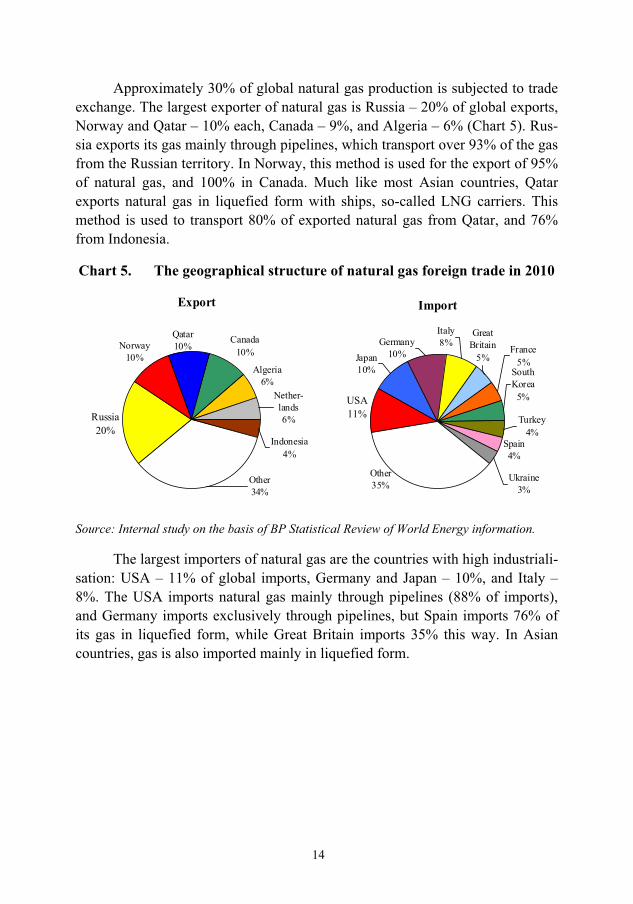
Approximately 30% of global natural gas production is subjected to trade exchange. The largest exporter of natural gas is Russia – 20% of global exports, Norway and Qatar – 10% each, Canada – 9%, and Algeria – 6% (Chart 5). Rus-sia exports its gas mainly through pipelines, which transport over 93% of the gas from the Russian territory. In Norway, this method is used for the export of 95% of natural gas, and 100% in Canada. Much like most Asian countries, Qatar exports natural gas in liquefied form with ships, so-called LNG carriers. This method is used to transport 80% of exported natural gas from Qatar, and 76% from Indonesia.
Chart 5. The geographical structure of natural gas foreign trade in 2010
Export
Canada10%
Algeria6%
Norway10%
Russia20%
Indonesia4%
Other34%
Nether-lands6%
Qatar10%
Import
Spain4%
Other35%
Ukraine3%
Great Britain
5%
Italy8%Germany
10% France5%
Turkey4%
South Korea
5%USA11%
Japan10%
Source: Internal study on the basis of BP Statistical Review of World Energy information.
The largest importers of natural gas are the countries with high industriali-sation: USA – 11% of global imports, Germany and Japan – 10%, and Italy – 8%. The USA imports natural gas mainly through pipelines (88% of imports), and Germany imports exclusively through pipelines, but Spain imports 76% of its gas in liquefied form, while Great Britain imports 35% this way. In Asian countries, gas is also imported mainly in liquefied form.
15
1.3. Phosphorites8
The main initial raw materials for the production of phosphoric fertilisers are phosphorites, difficult-to-dissolve sedimentary rocks, usually apatites, form-ing beds in various parts of the globe. After extraction, the phosphorites are ex-ported to countries with high industrialisation, where they are subjected to fur-ther processing, aimed at obtaining phosphoric acid (H3PO4), which in turn is used to produce phosphoric fertilisers. The process of transforming phosphorites into phosphoric acid also applies one of the strongest acids, e.g. sulphuric acid (H2SO4). Over 80% of phosphorites are used to produce artificial fertilisers, but they also have a broad application in the chemical industry, e.g. in the produc-tion of detergents.
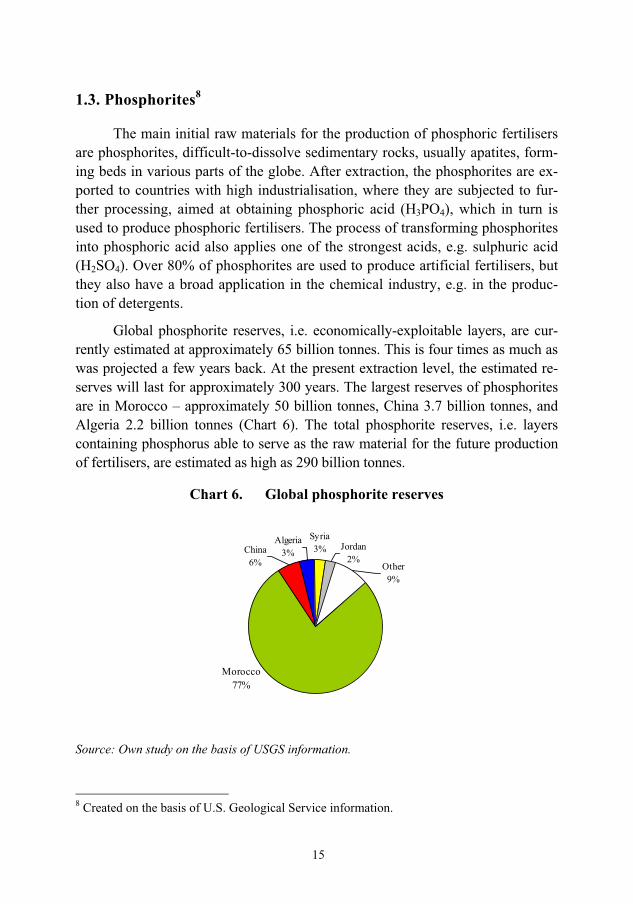
Global phosphorite reserves, i.e. economically-exploitable layers, are cur-rently estimated at approximately 65 billion tonnes. This is four times as much as was projected a few years back. At the present extraction level, the estimated re-serves will last for approximately 300 years. The largest reserves of phosphorites are in Morocco – approximately 50 billion tonnes, China 3.7 billion tonnes, and Algeria 2.2 billion tonnes (Chart 6). The total phosphorite reserves, i.e. layers containing phosphorus able to serve as the raw material for the future production of fertilisers, are estimated as high as 290 billion tonnes.
Chart 6. Global phosphorite reserves
Jordan2%
Syria3%China
6%
Morocco77%
Other9%
Algeria3%
Source: Own study on the basis of USGS information.
8 Created on the basis of U.S. Geological Service information.

16
The global production of phosphorites in 2010 amounted to almost 178 million tonnes, and has risen by over 30% within the past 10 years. The largest producers are not the countries possessing the largest phosphorite beds. The coun-try leading the production of this raw material is China, which sees the extraction of almost 40% of global production (Chart 7). In recent years, the extraction of phosphorites in China has been dynamically rising. During the last 10 years, ex-traction in that country has risen by over three times, and over twice over the past five years. Since 2006, China has surpassed the former leader – the United States. At the present time, China and Morocco control over 2/3 of global phosphorite extraction. In Morocco, which possesses the largest phosphorite beds, the produc-tion of this raw material amounted to 26 million tonnes, much like in the USA, but in contrast to the USA, Moroccan phosphorite production has had a slow growth trend. In the USA, phosphorite extraction is systematically dropping, since the reserves of this raw material are being depleted. The estimated depletion of the total phosphorite reserves in the USA (North Carolina, Florida) will take place in approximately 30 years [Korzeniowska, Robaczyk 2011].
Chart 7. The geographical structure of phosphorite production
2000
Tunesia6%
Russia8%
Morocco16%
Jordan4%
Other18%
Brazil4%
China15%
USA29%
2010
Tunesia4%
Russia6%
Morocco15%
Jordan3%
Other17%
Brazil3%
China37%
USA15%
Source: Own study on the basis of USGS information.
A small quantity of phosphorites is exported. The proportion of trade ex-change in the global production of phosphorites in recent years failed to exceed 20%. The largest exporter of phosphorites is Morocco, with almost 40% of glo-bal exports. The largest importers are India and the countries of Western Europe.

17
The global extraction capacities are currently assessed at over 200 million tonnes; however they are projected to grow to over 250 million tonnes by the year 2015. The growth in the production capacities will take place through the expansion of the already-existing, and the construction of new installations, mainly in Africa.
1.4. Phosphoric acid
Phosphoric acid H3PO4 is produced during the process of phosphorite trans-formation and serves mainly for the production of phosphoric fertilisers, but is also applicable in the food (supplements to carbonated beverages), pharmaceuti-cal and metallurgic industries.
In 2010, the global production of phosphoric acid amounted to 37 million tonnes of P2O5, growing by almost 1/3 during the past ten years. The production of phosphoric acid is concentrated in countries with phosphorite beds. The largest current producer of phosphoric acid is China, with over 30% of global production, as well as the USA and Morocco. In recent years, the phosphoric acid foreign trade has failed to exceed 13% of production. The largest exporters of phosphoric acid are Morocco, USA, RSA, Tunisia and Jordan, which handle almost 80% of global exports. The main importer is India, which receives almost 50% of the global phosphoric acid trade. Significant importers also include Pakistan, the Netherlands, France and Brazil [www.fertilizer.org].
Global phosphoric acid production capacities are estimated at almost 50 million tonnes, which will grow to approximately 58 million tonnes within the next five years. New production capacities will be created thanks to investments in China, Morocco, Saudi Arabia, Tunisia and Jordan.
1.5. Potassium salt
The basic raw material for the production of potassium fertilisers is potas-sium chloride (KCl), commonly known as potassium salt. The most important minerals containing potassium chloride include sylvite, carnallite and kainite. There are currently three basic technologies of exploiting potassium salt beds-classic mining, washing salt from abyssal beds with water, and extraction from surface sediment or salt water. The classic method of potassium salt bed exploita-tion predominates in the production of the raw material, and does not depart from the methods applied in the extraction of hard coal. Potassium salt is used mainly in the production of potassium fertilisers, but also in the pharmaceutical and chemical industries [Grzebisz 2004].
18
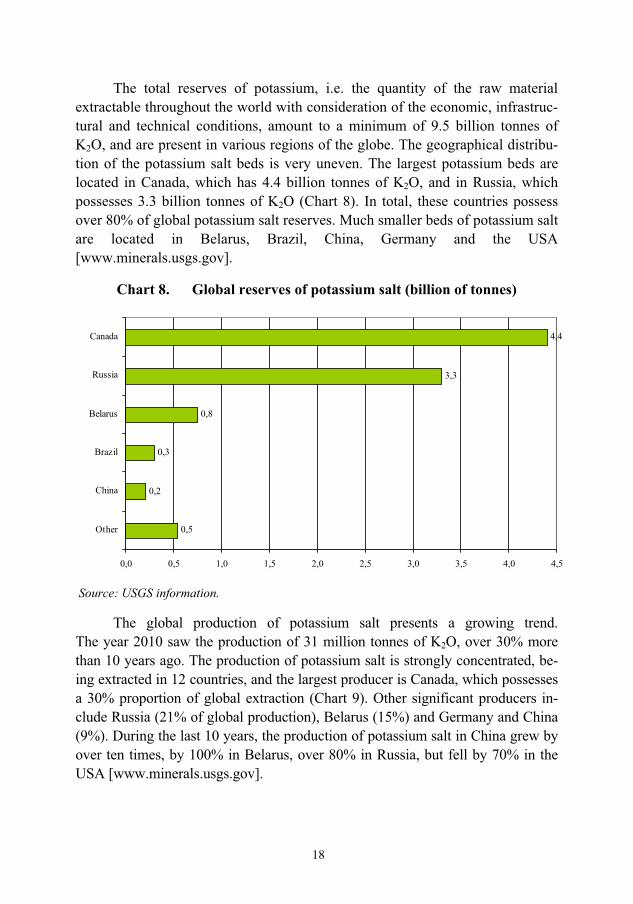
The total reserves of potassium, i.e. the quantity of the raw material extractable throughout the world with consideration of the economic, infrastruc-tural and technical conditions, amount to a minimum of 9.5 billion tonnes of K2O, and are present in various regions of the globe. The geographical distribu-tion of the potassium salt beds is very uneven. The largest potassium beds are located in Canada, which has 4.4 billion tonnes of K2O, and in Russia, which possesses 3.3 billion tonnes of K2O (Chart 8). In total, these countries possess over 80% of global potassium salt reserves. Much smaller beds of potassium salt are located in Belarus, Brazil, China, Germany and the USA [www.minerals.usgs.gov].
Chart 8. Global reserves of potassium salt (billion of tonnes)
0,5
0,2
0,3
0,8
3,3
4,4
0,0 0,5 1,0 1,5 2,0 2,5 3,0 3,5 4,0 4,5
Other
China
Brazil
Belarus
Russia
Canada
Source: USGS information.
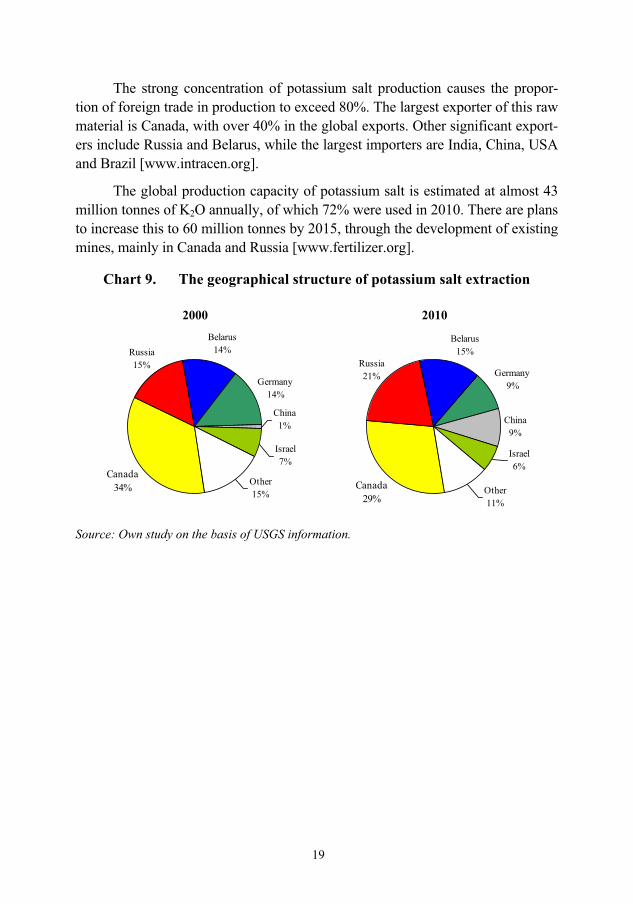
The global production of potassium salt presents a growing trend. The year 2010 saw the production of 31 million tonnes of K2O, over 30% more than 10 years ago. The production of potassium salt is strongly concentrated, be-ing extracted in 12 countries, and the largest producer is Canada, which possesses a 30% proportion of global extraction (Chart 9). Other significant producers in-clude Russia (21% of global production), Belarus (15%) and Germany and China (9%). During the last 10 years, the production of potassium salt in China grew by over ten times, by 100% in Belarus, over 80% in Russia, but fell by 70% in the USA [www.minerals.usgs.gov].
19
The strong concentration of potassium salt production causes the propor-tion of foreign trade in production to exceed 80%. The largest exporter of this raw material is Canada, with over 40% in the global exports. Other significant export-ers include Russia and Belarus, while the largest importers are India, China, USA and Brazil [www.intracen.org].
The global production capacity of potassium salt is estimated at almost 43 million tonnes of K2O annually, of which 72% were used in 2010. There are plans to increase this to 60 million tonnes by 2015, through the development of existing mines, mainly in Canada and Russia [www.fertilizer.org].
Chart 9. The geographical structure of potassium salt extraction
2000Belarus
14%
Germany14%
China1%
Israel7%
Other15%
Canada34%
Russia15%
2010
Belarus15%
Germany9%
China9%
Israel6%
Other11%
Canada29%
Russia21%
Source: Own study on the basis of USGS information.

20
2. Mineral fertiliser production9
The global production of finished mineral fertilisers in 2009 amounted to 164 million tonnes, counted as pure component, and was higher by almost 13% than in the year 2000, but at the same time 8% lower in comparison with the record year of 2007. The largest production growth recorded during the years of 2004-2007 was the result of the rapidly-growing demand for fertilisers in developing countries, particularly China, India and Brazil. During this period, the mineral fertiliser sector developed very dynamically, and many enterprises operating on the market took actions aimed at increasing production capaci-ties. However, the second half of 2008 saw a collapse in the demand for fertil-isers, mainly phosphoric and potassium, which affected the drop of fertiliser production already by the end of 2008 and in the following years. Only 2010 brought a livening of the global fertiliser production.
The years 2000-2009 saw a significant change in the geographical struc-ture of mineral fertiliser production. In 2000, the proportion of economically developed countries in the production of mineral fertilisers was 53%, while of developing countries it was 47%. During the next nine years, the production of fertilisers was moved to regions with lower production costs. Due to these changes, the production of fertilisers in developed countries dropped by 16%, but rose by 45% in developing countries (Chart 10). In consequence, the pro-portion from developed countries dropped to 40%, and the proportion from de-veloping countries rose to 60%.
9 Created on the basis of International Fertilizer Industry Association information.

21
Chart 10. Mineral fertiliser production in developed
and developing countries (NPK millions of tonnes)
50
60
70
80
90
100
110
120
2000 2001 2002 2003 2004 2005 2006 2007 2008 2009 2010*
Developed countriesDeveloping countries
* assessment of IAFE-NRI Source: Own study on the basis of IFA information.
In many regions, the lack of convenient access to raw materials limits the development of the fertiliser industry, due to e.g. the cost of transport. The concentration of mineral fertiliser production is growing. In 2009, the five largest producers had 65% of global production, while the figure was 59% in 2000. The largest proportion of mineral fertiliser production is possessed by China, with a total production proportion of almost 33% in 2009, which had been only 20% in 2000 (Chart 11). Over the nine years, China increased pro-duction by 82% (Chart 12). The 2009 proportion from India and the USA amounted to approximately 10% each; during the discussed period, production in India grew by 11%, and dropped by 5% in the USA. The next most signifi-cant countries in global mineral fertiliser production are Russia and Canada, with proportions respectively of 8 and 5%. During the examined period, fertil-iser production in Russia grew by 7%, while Canada saw a production drop of as much as 40%. In Canada, 2008 mineral fertiliser production was maintained within 12-14 million tonnes per year, however, 2008 saw a drop in mineral fer-tiliser production by 43% in comparison to the previous year. The production drop resulted from the limitation on potassium fertiliser production and was caused by the reduction in global demand for potassium fertilisers.

22
Chart 11. The geographical structure of mineral fertiliser production
2000
Canada9%
Russia8%USA
12%
Indonesia2%
Other33%
Germany4%
China21%
India11%
2009
Canada5%
Russia8%
USA10%
Indonesia2%
Other32%
Germany2%
China31%
India10%
Source: Own study on the basis of IFA information.
Chart 12. Changes in mineral fertiliser production during the years 2000-
2009 (%)
-41,6
-41,3
-16,6
7,3
10,8
11
12,6
17,9
26,4
28,7
81,9
87,1
-3,9
-60 -40 -20 0 20 40 60 80 100
Germany
Canada
Belarus
USA
Russia
Brazil
India
Total production
Indonesia
Israel
Pakistan
China
Egypt
Source: Own study on the basis of IFA information.
23
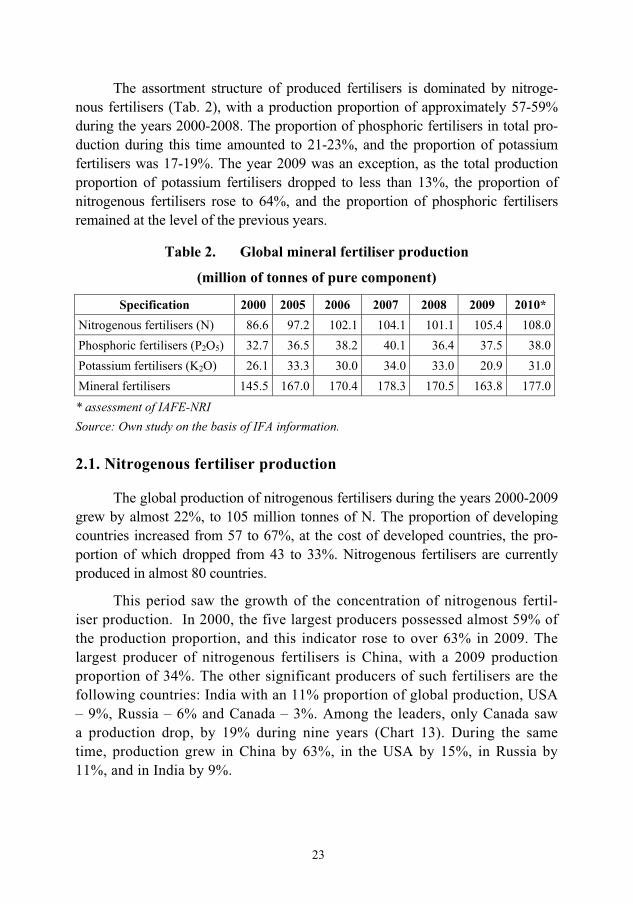
The assortment structure of produced fertilisers is dominated by nitroge-nous fertilisers (Tab. 2), with a production proportion of approximately 57-59% during the years 2000-2008. The proportion of phosphoric fertilisers in total pro-duction during this time amounted to 21-23%, and the proportion of potassium fertilisers was 17-19%. The year 2009 was an exception, as the total production proportion of potassium fertilisers dropped to less than 13%, the proportion of nitrogenous fertilisers rose to 64%, and the proportion of phosphoric fertilisers remained at the level of the previous years.
Table 2. Global mineral fertiliser production
(million of tonnes of pure component)
Specification 2000 2005 2006 2007 2008 2009 2010* Nitrogenous fertilisers (N) 86.6 97.2 102.1 104.1 101.1 105.4 108.0Phosphoric fertilisers (P2O5) 32.7 36.5 38.2 40.1 36.4 37.5 38.0Potassium fertilisers (K2O) 26.1 33.3 30.0 34.0 33.0 20.9 31.0Mineral fertilisers 145.5 167.0 170.4 178.3 170.5 163.8 177.0
* assessment of IAFE-NRI Source: Own study on the basis of IFA information.
2.1. Nitrogenous fertiliser production
The global production of nitrogenous fertilisers during the years 2000-2009 grew by almost 22%, to 105 million tonnes of N. The proportion of developing countries increased from 57 to 67%, at the cost of developed countries, the pro-portion of which dropped from 43 to 33%. Nitrogenous fertilisers are currently produced in almost 80 countries.
This period saw the growth of the concentration of nitrogenous fertil-iser production. In 2000, the five largest producers possessed almost 59% of the production proportion, and this indicator rose to over 63% in 2009. The largest producer of nitrogenous fertilisers is China, with a 2009 production proportion of 34%. The other significant producers of such fertilisers are the following countries: India with an 11% proportion of global production, USA – 9%, Russia – 6% and Canada – 3%. Among the leaders, only Canada saw a production drop, by 19% during nine years (Chart 13). During the same time, production grew in China by 63%, in the USA by 15%, in Russia by 11%, and in India by 9%.

24
Chart 13. Changes in nitrogenous fertiliser production during the years
2000-2009 (%)
-22,5
-19,0
-11,8
2,3
9,0
11,0
14,3
15,0
21,7
26,3
26,7
62,7
75,4
84,4
92,8
-6,5
-40 -20 0 20 40 60 80 100
Germany
Canada
Poland
Netherlands
Ukraine
India
Russia
Indonesia
USA
Total production
Pakistan
Saudi Arabia
China
Iran
Qatar
Egypt
Source: Own study on the basis of IFA information.
Furthermore, an increasingly significant role in the production of nitro-genous fertilisers is played by several developing countries, mainly from the Near East region, where the production of nitrogenous fertilisers grew by even as much as several dozen percent during the last decade. In these coun-tries, which possess relatively cheap raw materials for production of nitroge-nous fertilisers and low labour costs, the production is less expensive than in developed countries. These countries include Egypt, Pakistan, Indonesia, Qa-tar, Iran and Saudi Arabia.

25
The structure of nitrogenous fertiliser production is dominated by single-component fertilisers, which compose 85% of the global production. The most significant fertiliser in this group is urea [CO(NH2)2], with a production propor-tion exceeding 50%. Other significant nitrogenous fertilisers include: ammonia nitrate (NH4NO3), calcium nitrate [Ca(NO3)2], ammonium sulphate [(NH4)2SO4] and nitrate-urea solution (RSM).
2.2. Phosphoric fertiliser production
In 2009, the global production of phosphoric fertilisers amounted to almost 38 million tonnes of P2O5 and was higher by 15% in comparison to the year 2000, but lower by 6% than the record year of 2007. The production of phosphoric fer-tilisers is strongly concentrated. Despite the fact that phosphoric fertilisers are produced in approximately 60 countries, 76% of the 2009 production fell to the five most important producers, i.e. 10 percentage points more than in 2000. In over half of the countries producing phosphoric fertiliser, the production quantity does not exceed 100 thousand tonnes of P2O5 per year and is almost fully dedi-cated to the demands of the internal market.
The phosphoric fertiliser production proportion of developing countries rose from 52% in 2000 to 68% in 2009, while the proportion of developed coun-tries dropped from 48% to 32%. The largest producer of phosphoric fertilisers in 2009 was China, with a 38% proportion of global production. During the exam-ined period, the phosphoric fertiliser production in this country was developing very dynamically and grew by 113% (Chart 14). In 2000, the USA was the global leader, with a 22% proportion of phosphoric fertiliser production, but it lost the position of the largest phosphoric fertiliser producer to China in 2002. The current proportion of the USA in phosphoric fertiliser production dropped to 14%, be-cause of a 28% production drop caused by reduced phosphorite extraction. India’s proportion of global production is 12%, Russia’s 7%, Brazil’s 5%, and Mo-rocco’s, which is the largest phosphorite producer, slightly over 3%. Significant production growth during the examined period was also recorded in Brazil (by 21%) and in India (by 17%).

26
Chart 14. Phosphoric fertiliser production in selected countries
(million of tonnes)
0
2
4
6
8
10
12
14
16
2000 2001 2002 2003 2004 2005 2006 2007 2008 2009 2010*
China USA
India Russia
Brazil Morocco
* IAFE-NRI assessment Source: Own study on the basis of IFA information.
Phosphoric fertilisers are produced mainly in the form of multi-component fertilisers, and their proportion of the total production of phosphoric fertilisers exceeds 70%. The most common phosphoric fertiliser is ammonium phosphate, the total production proportion of which amounts to approximately 50%. The sin-gle-component fertilisers are mainly superphosphates: the more common simple superphosphate, as well as triple superphosphate.
2.3. Potassium fertiliser production
The global potassium fertiliser production in 2009 amounted to 21 million tonnes of K2O, which was the lowest production level of this fertiliser group since 1993. The almost 37% drop of production in 2009 resulted from the drastic drop in the global demand for potassium fertilisers, in particular in China, USA, Brazil and the European Union. Until 2007, the potassium fertiliser production system-atically grew. The most potassium fertilisers were produced in 2007, over 34 mil-lion tonnes of K2O, in comparison to 26 million tonnes in 2000.
The potassium fertiliser production has the strongest concentration in com-parison to other groups of mineral fertilisers. The total production proportion of the five largest potassium fertiliser producers during the years 2000-2008 was at an average of 82%, and dropped to 75% in 2009, due mainly to the drastic reduc-tion of production by the largest producer.

27
The leader of the potassium fertiliser production is Canada, which pos-sesses the largest beds of potassium salt in the world. The 2009 proportion of Canada of global production was 21%, and exceeded 30% in previous years (Chart 15). Russia is also an important potassium fertiliser producer, and its pro-portion of global production rose from 14% in 2000 to 18% in 2009. The Chinese market developed dynamically, as the potassium fertiliser production rose ten times in nine years, and China’s proportion of global production rose from 1% in 2000 to 13% in 2009. Significant roles in potassium fertiliser production are also played by Belarus, Israel and Germany, the global production proportion of which in 2009 was respectively 12%, 12% and 8%.
During the years 2000-2008, the global potassium fertiliser production grew by 26%, and the largest, eight-time production growth was recorded in China. During this period, Russia increased its production by 60%, Belarus by 47%, Israel by 22% and Canada by 15%. Germany saw a production drop by 4%.
Chart 15. The geographical structure of potassium fertiliser production
2000
China1%
Belarus13%
Israel7%
Germany13%
Other17%
Canada35%
Russia14%
2009
China13%
Belarus12%
Israel12%
Germany9%
Other16%Canada
20%
Russia18%
Source: Own study on the basis of IFA information.
The largest drop in production in 2009 was recorded in Canada (by 58%), Belarus (by 50%), Germany (by 46%) and Russia (by 38%). The pro-duction rose in China (by 25%) and Israel (by 16%). The production was slowed down in Canada, Russia and Belarus, the causes of which included the reduced export to Brazil and China, where the consumption of this fertiliser group dropped, while China dynamically developed its own fertiliser industry and pos-sessed a high level of reserves.

28
Potassium fertilisers are mainly produced in the form of potassium salt, i.e. potassium chloride (KCl). The multi-component fertilisers, e.g. potassium nitrate (KNO3), potassium sulphate (K2SO4), or complex fertilisers constitute a small supplement.

29
3. Mineral fertiliser foreign trade10
International trade plays a significant role in the forming of the global min-eral fertiliser market. The allocation of raw materials used for the production of mineral fertilisers entails a slightly quicker global growth of trade exchange than progressing diversification of the production. Fertiliser trade is primarily con-ducted by sea and constitutes approximately 5% of the total volume of seaport transshipments.
The proportion of trade exchange in the global fertiliser production during the years 2000-2008 amounted to approximately 40% and dropped to 35% in 2009, mainly due to the limitation of potassium fertiliser trade. The volume of global export presented a slight growing trend and maintained itself within 60-66 million tonnes NPK annually, with exception of 2007, when it rose to 74 million tonnes.
The largest proportion of global fertiliser trade is possessed by nitrogenous and potassium fertilisers – approximately 40% each – while phosphoric fertilisers possess 20%. The year 2009 was an exception, as the proportion of nitrogenous fertilisers rose to 50%, and that of potassium fertilisers dropped to 30%.
The largest exporter of mineral fertilisers is Russia, with a proportion of to-tal export, which rose from 16 to 18% during the years 2000-2009 (Chart 16). Canada is also a large exporter, but its proportion dropped to 9% in 2009 from 16-17% during the years 2000-2008. The export of mineral fertilisers from China rose dynamically to a 7% proportion of global export, up from only 2% in 2000. Other significant exporters include the USA and Germany, with a global export proportion of respectively 10 and 4%.
The geographical structure of import during the years 2000-2009 saw great changes, caused mainly by the significant development of production and in-creased consumption in China and India. In the year 2000, the largest exporters of mineral fertilisers were the USA and China, with a total import proportion of 15 and 11%. The dynamic growth of the demand for mineral fertilisers in India made this country the largest importer in the world in 2008, with a 16% proportion of 2009. During this period, the proportion of the USA in global import remained at the level of 14-15%, while the proportion of China dropped from 11 to only 3%, mainly due to the development of the domestic production potential.
10 Created on the basis of International Fertilizer Industry Association information.

30
Chart 16. The geographical structure of mineral fertiliser exports
2000
Canada17%
China2%
Germany6%
Belarus5%
Other42%
Egypt1%
Russia16%
USA11%
2009Canada
9% China7% Germany
4%Belarus
4%
Other45%
Egypt3%
Russia18%
USA10%
Source: Own study on the basis of IFA information.
Chart 17. The geographical structure of mineral fertiliser imports
2000
Brazil8%
France6%
Vietnam3% Thailand
2%
Other51%
China11%
India4%
USA15%
2009Brazil
9% France4%
Vietnam3%Thailand
3%
Other47%
China3%
India16%
USA15%
Source: Own study on the basis of IFA information.
3.1. Nitrogenous fertiliser international trade
The proportion of trade exchange in nitrogenous fertiliser production dur-ing the years 2000-2009 was maintained within 27-28%. The volume of nitroge-nous fertiliser export grew from 24 million tonnes of pure component in 2000 to 29 million tonnes in 2009, with the highest value in 2007 – 31 million tonnes.
The concentration of nitrogenous fertiliser export in the country arrange-ment is diminishing, and the proportion of the five largest exporters in total export

31
during the examined period was within 42-48%. The nitrogenous fertiliser export structure underwent significant changes. In 2000, the largest nitrogenous fertiliser exporters were Russia (18% proportion), USA (8%), Ukraine (8%), Canada (7%) and Netherlands (4%). In 2009, Russia remained as the leader, with a 16% export proportion, while the Netherlands and Canada were squeezed out by such coun-tries as China and Egypt. Russia exports nitrogenous fertilisers mainly to Brazil. During the 9 years, nitrogenous fertiliser exports from China and Egypt grew over by four times. Besides Russia, the largest exporters in 2009 were China (8% pro-portion), Egypt (6%), Ukraine (6%) and USA (5%). Exports from Near East countries are also developing dynamically, and they are competing on the global market with success. Besides Egypt, these countries include Qatar and Saudi Ara-bia. As assessed, the largest exporter of nitrogenous fertilisers in 2010 was still China, while the main customer for Chinese nitrogenous fertilisers was India.
Chart 18. The geographical structure of nitrogenous fertiliser exports
2000Egypt
2%
Other48%
Ukraine8% USA
8% Saudi Arabia
4%
Qatar3%
Canada7%
Russia18%
China2%
2009Egypt
6%
Other44%
Ukraine6% USA
5%Saudi
Arabia5%
Qatar5%
Canada5%
Russia16%
China8%
Source: Own study on the basis of IFA information.
The volume of nitrogenous fertiliser import grew during the years 2000-2009 from 24 to 29 million tonnes of N, and the highest level was reached in 2007 – 30 million tonnes. The proportion of the five most important global im-porters fell at rates between 34% and 44%. The biggest nitrogenous fertiliser importer is the USA, but its share of imports dropped from 17% in 2000 to 13% in 2009, mainly due to the increased production of their fertiliser group. The USA imports nitrogenous fertilisers mainly from Canada. In 2000, the biggest nitrogenous fertiliser importers also included France (7% proportion), as well as Brazil, Germany and Vietnam (5% each). In 2009, the USA was followed on the list of the biggest nitrogenous fertiliser importers by India, with 12% (Chart 19).

32
India increased its imports during the years 2000-2009 by over 20 times, and as of 2006 is the second biggest importer. The group of biggest importers also inc-ludes Brazil (6% share) as well as France and Thailand (5% each).
Chart 19. Nitrogenous fertiliser imports (millions of tonnes)
0
1
2
3
4
5
6
2000 2001 2002 2003 2004 2005 2006 2007 2008 2009 2010*
USA IndiaBrazil FranceThailand
* IAFE-NRI assessment Source: Own study on the basis of IFA information.
3.2. Phosphoric fertiliser international trade
In 2009, approximately 1/3 of the produced phosphoric fertilisers were in-volved in trade exchange, while the figure in 2000 was 37%. The dropping propor-tion of trade exchange in the production of phosphoric fertilisers during the years 2000-2009 resulted from the growing production with a stable trade turnover.
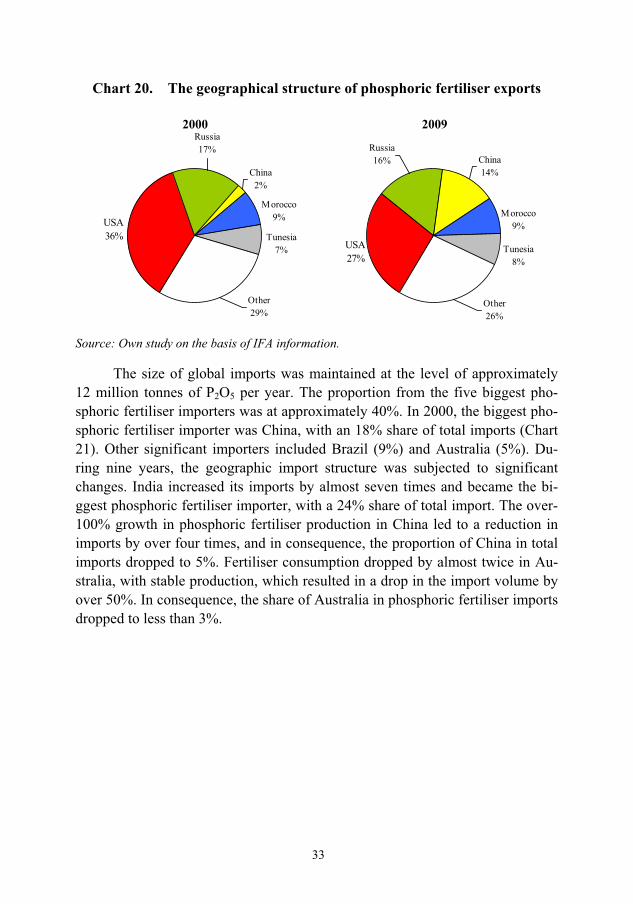
The volume of phosphoric fertiliser exports was approximately 12 million tonnes of P205 per year. Phosphoric fertiliser exports are dominated by the USA, Russia, China, Morocco and Tunisia (Chart 20). During the examined years, the total phosphoric fertiliser export proportion from these five countries exceeded 70%. In 2000, the USA’s share – the biggest exporter � was 36%, but dropped to 27% within nine years. Russia’s share was maintained at the level of 17%, while China’s grew from 2 to 14%. During the examined period, China recorded a more than double growth in phosphoric fertiliser production. From being an importer, it became a net exporter, and the export volume grew almost by six times.
33
Chart 20. The geographical structure of phosphoric fertiliser exports
2000
China2%
Morocco9%
Tunesia7%
Other29%
USA36%
Russia17%
2009
China14%
Morocco9%
Tunesia8%
Other26%
USA27%
Russia16%
Source: Own study on the basis of IFA information.
The size of global imports was maintained at the level of approximately 12 million tonnes of P2O5 per year. The proportion from the five biggest pho-sphoric fertiliser importers was at approximately 40%. In 2000, the biggest pho-sphoric fertiliser importer was China, with an 18% share of total imports (Chart 21). Other significant importers included Brazil (9%) and Australia (5%). Du-ring nine years, the geographic import structure was subjected to significant changes. India increased its imports by almost seven times and became the bi-ggest phosphoric fertiliser importer, with a 24% share of total import. The over-100% growth in phosphoric fertiliser production in China led to a reduction in imports by over four times, and in consequence, the proportion of China in total imports dropped to 5%. Fertiliser consumption dropped by almost twice in Au-stralia, with stable production, which resulted in a drop in the import volume by over 50%. In consequence, the share of Australia in phosphoric fertiliser imports dropped to less than 3%.

34
Chart 21. Phosphoric fertiliser imports (millions of tonnes)
0
1
2
3
4
2000 2001 2002 2003 2004 2005 2006 2007 2008 2009 2010*
India Brazil
China Vietnam
* IAFE-NRI assessment Source: Own study on the basis of IFA information.
3.3. Potassium fertiliser international trade
The proportion of trade exchange in potassium fertiliser exchange during the years 2000-2009 fell by between 85 and 90%. The production of these fertilis-ers is located in three countries (Canada, Russia, Belarus), which consume rela-tively small amounts of fertilisers and export over 90% of their production.
Potassium fertiliser exports grew from 23 million tonnes of K2O in 2000 to 27 million tonnes in 2008. In 2009, due to the collapse in demand, particularly for potassium fertilisers, production and turnover significantly dropped. Global ex-ports amounted to less than 15 million tonnes. The proportion of the five biggest exporters grew from 81% in 2000 to 88% in 2008. In 2009, this indicator dropped to 80%, mainly due to the drastic reduction in distribution by the biggest exporter, Canada, which mainly supplies the American and Brazilian markets. The export proportion of Canada during the examined period was at approximately 35%, and dropped to 25% in 2009 (Chart 22). The potassium fertiliser export proportion of Russia grew from 14% in 2000 to 21% in 2009. Russia’s strategic partners in the potassium fertiliser trade are India and China, where the demand for this fertiliser group continues to grow dynamically.

35
Chart 22. The structure of potassium fertiliser foreign trade in 2009
Export
Belarus12%
Germany11%
Israel10%
Other21%
Canada25%
Russia21%
Import
Brazil12%
China5%
Indonesia3%
Other34%
USA28%
India18%
Source: Own study on the basis of IFA information.
Potassium fertiliser imports grew from 23 million tonnes of K2O in 2000 to 27 million tonnes in 2008, and fell to 18 million tonnes in 2009. The importation of potassium fertilisers is strongly concentrated. The proportion of the five biggest importers exceeds 60%. In 2000, the biggest importer was the USA, with a 21% of total imports. That year, the proportion from China was 15%, while Brazil’s was 11%. During the next nine years, the situation slightly changed. The USA remained the biggest importer, and its share of total imports grew to 28%. China limited its imports by four times, and its import proportion dropped to 5%. This was influenced by the reduced demand for this fertiliser group and the dynamically-growing domestic production. The global potas-sium fertiliser import proportion of India grew significantly, up to 18%. The demand for potassium fertilisers in India grew even in 2009, when the con-sumption of fertilisers, particularly potassium, in most countries dropped. Hence the assumption that India’s role as a global importer of potassium fertil-isers will grow.

36
4. Mineral fertiliser consumption11
The consumption of mineral fertilisers is one of the indicators of the evaluation of agricultural management intensity [Igras 2006]. The level of mineral fertilisation is determined by many factors. The most significant include the fol-lowing: general agricultural prosperity, the financial condition of farms, the prof-itability of agricultural production (the correlation of fertiliser prices to agricul-tural product prices), the mineral component content in soil, and the applied man-agement system (sustainable, intensive or organic). Fertilisation also has an envi-ronmental and health aspect (excessive consumption of mineral fertilisers).
4.1. Factors influencing global mineral fertiliser consumption
The growth in mineral fertiliser consumption mainly results from the need to intensify agricultural production, caused by the dynamically-growing global demand for agricultural raw materials. The pressure on the growth of agricultural production results from many factors; however the most important include the rapid rate of growth of the global population, the prosperity of the communities of the developing countries and the related growth in meat consumption, the grow-ing consumption of agricultural products for alternative purposes (as biofuels) and climate catastrophes, causing significant losses in the harvests of cultivable plants.
Over the past 60 years, the global population grew almost three times, while the arable land increased by approximately 12%. As a result, the arable land per capita dropped from almost 0.5 ha in 1950 to 0.2 ha in 2009 [www.faostat.fao.org].
The continuous growth in the global population (very dynamic after 1950) with an almost unchanged arable land, forced the production of increasingly lar-ger harvests of cultivable plant harvests. The pressure on the growth in agricul-tural production causes continuous increases in the doses of mineral fertilisers, since the belief is that the volume of produced harvests is mostly influenced by fertilisation. According to Niewiadomski [see: Grabi�ski 2001], 50% of yield increase is achieved due to fertilisation, and the significance of the biological progress in harvest forming is rising. Since 1950, the global consumption of mi-neral fertilisers grew by almost 12 times, from 14.5 million tonnes of NPK to 172 million tonnes during the 2010/11 season, which entailed an almost three-times growth in cereal yield [www.faostat.fao.org]. 11 Created on the basis of International Fertilizer Industry Association information.
37
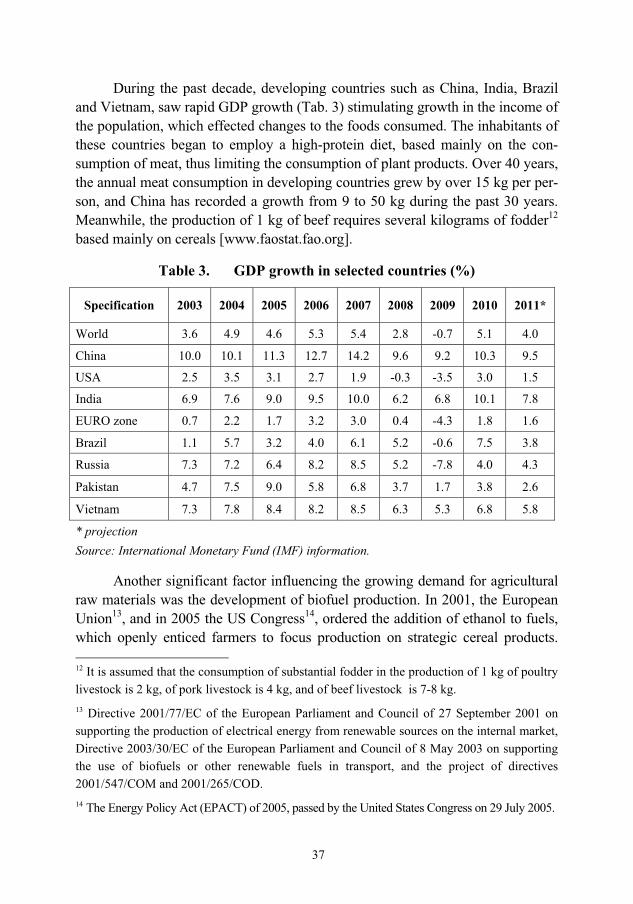
During the past decade, developing countries such as China, India, Brazil and Vietnam, saw rapid GDP growth (Tab. 3) stimulating growth in the income of the population, which effected changes to the foods consumed. The inhabitants of these countries began to employ a high-protein diet, based mainly on the con-sumption of meat, thus limiting the consumption of plant products. Over 40 years, the annual meat consumption in developing countries grew by over 15 kg per per-son, and China has recorded a growth from 9 to 50 kg during the past 30 years. Meanwhile, the production of 1 kg of beef requires several kilograms of fodder12 based mainly on cereals [www.faostat.fao.org].
Table 3. GDP growth in selected countries (%)
Specification 2003 2004 2005 2006 2007 2008 2009 2010 2011*
World 3.6 4.9 4.6 5.3 5.4 2.8 -0.7 5.1 4.0
China 10.0 10.1 11.3 12.7 14.2 9.6 9.2 10.3 9.5
USA 2.5 3.5 3.1 2.7 1.9 -0.3 -3.5 3.0 1.5
India 6.9 7.6 9.0 9.5 10.0 6.2 6.8 10.1 7.8
EURO zone 0.7 2.2 1.7 3.2 3.0 0.4 -4.3 1.8 1.6
Brazil 1.1 5.7 3.2 4.0 6.1 5.2 -0.6 7.5 3.8
Russia 7.3 7.2 6.4 8.2 8.5 5.2 -7.8 4.0 4.3
Pakistan 4.7 7.5 9.0 5.8 6.8 3.7 1.7 3.8 2.6
Vietnam 7.3 7.8 8.4 8.2 8.5 6.3 5.3 6.8 5.8
* projection Source: International Monetary Fund (IMF) information.
Another significant factor influencing the growing demand for agricultural raw materials was the development of biofuel production. In 2001, the European Union13, and in 2005 the US Congress14, ordered the addition of ethanol to fuels, which openly enticed farmers to focus production on strategic cereal products. 12 It is assumed that the consumption of substantial fodder in the production of 1 kg of poultry livestock is 2 kg, of pork livestock is 4 kg, and of beef livestock is 7-8 kg. 13 Directive 2001/77/EC of the European Parliament and Council of 27 September 2001 on supporting the production of electrical energy from renewable sources on the internal market, Directive 2003/30/EC of the European Parliament and Council of 8 May 2003 on supporting the use of biofuels or other renewable fuels in transport, and the project of directives 2001/547/COM and 2001/265/COD. 14 The Energy Policy Act (EPACT) of 2005, passed by the United States Congress on 29 July 2005.
38
Since 2000, biofuel production has begun to grow rapidly, and has increased by over five times in comparison to 2000. The factor influencing this growth was mainly the high prices of petroleum on global markets. Currently, almost 30% of American corn harvests are intended for the production of biofuels; this figure was only 10% in 2002. Therefore, despite the fact that that the area of corn is sig-nificantly growing due to rising demand, the quantity of corn intended for con-sumption continues to drop. It is assessed that over 3% of mineral fertilisers are currently used to fertilise plants dedicated to biofuels, mainly bioethanol from corn in the USA and from sugarcane in Brazil, as well as biodiesel from rape in Europe [Wilk 2008, www.fertilizer.org].
4.2. Global mineral fertiliser consumption
Global mineral fertiliser consumption during the 2010/11 season was 172 million tonnes calculated into pure component, and was 27% higher in compari-son to the 2000/01 season. The annual consumption growth rate was almost 2.5%; until the 2007/08 season, it grew very systematically, while the 2008/09 season saw a large, almost 8%, drop in consumption, but the 2009/10 season was the be-ginning of over 5% annual growths (Chart 23). The consumption drop during the 2008/09 season was caused mainly by the high prices of mineral fertilisers and reduced agricultural production profitability. During successive seasons, the prices of mineral fell, which entailed a growth in the fertilisation level.

39
Chart 23. The annual rate of global mineral fertiliser consumption
changes (%)
2,5 2,73,7 3,8
1,8
4,0 3,6
-7,6
5,5 5,0
-8,0
-6,0
-4,0
-2,0
0,0
2,0
4,0
6,0
2001/02 2002/03 2003/04 2004/05 2005/06 2006/07 2007/08 2008/09 2009/10 2010/11
Source: Own study on the basis of IFA information.
Over the ten years, the global consumption of nitrogenous fertilisers grew the most, by 28%, while the consumption of phosphoric and potassium fertilisers grew by respectively 26 and 24%. Therefore, the assortment structure of mineral fertiliser consumption during the examined period did not undergo significant changes. The growth in nitrogenous fertiliser consumption and the drop in potas-sium fertiliser consumption were almost unnoticeable. Nitrogenous fertilisers comprised 60% of total consumption, phosphoric 24%, and potassium 16%.
Table 4. Global mineral fertiliser consumption (million of tonnes NPK)
Specification 2000/01 2005/06 2006/07 2007/08 2008/09 2009/10 2010/11*Nitrogenous fertilisers 80.8 93.2 97.4 100.7 98.4 101.6 103.7Phosphoric fertilisers 32.4 37.1 38.1 38.5 33.6 38.3 40.9Potassium fertilisers 22.2 25.8 26.9 29.0 23.4 24.0 27.5Total fertilisers 135.4 156.1 162.4 168.2 155.4 163.9 172.1
* IFA assessment Source: IFA information.
4.3. Mineral fertiliser consumption in selected countries
Mineral fertiliser consumption growth is recorded primarily in developing countries. During the ten years, the consumption in these countries grew by 35%, while developed countries recorded a 6% drop. Currently 70% of global mineral fer-tiliser consumption falls to developing countries; ten years ago, this figure was 63%.

40
China is a country with the biggest consumption of mineral fertilisers, and its proportion of global consumption amounted to 30% during the 2009/10 sea-son, as compared to 25% during the 2000/01 season (Chart 24). During this pe-riod, the proportion from India grew from 14 to 12%. Other countries playing a significant role in the consumption of mineral fertilisers include Brazil, Pakistan, Indonesia and France, but the total fertiliser consumption proportion of none of these countries exceeds 6%.
During the discussed period, high growth in mineral fertiliser consumption was recorded primarily in Indonesia (by 72%), India (by 58%), Pakistan (by 47%), China (by 42%) and Brazil (by 24%). In the USA, consumption remained practically unchanged, while France recorded a consumption drop (by 30%).
Chart 24. The geographical structure of mineral fertiliser consumption
2000/01
USA14%
Brazil5%
Pakistan2%
Indonesia2%
Other37%
France3%
China25%
India12%
2009/10
USA12%
Brazil6%
Pakistan3%
Indonesia3%
Other29%
France2%
China29%
India16%
Source: Own study on the basis of IFA information.
The over-twenty-percent growth in mineral fertiliser consumption dur-ing the past ten years, with a practically unchanged agricultural land, caused unitary global consumption of mineral fertilisers to grow from 28 to 33 kg NPK/ha AL. The biggest consumption growths were recorded in developing countries with high potential to increase the intensiveness of agricultural pro-duction. The unitary consumption of mineral fertilisers in these countries grew from 20 to 27 kg NPK/ha AL, while in developed countries it dropped from 76 to 73 kg NPK/ha AL.
41
The trend of decreasing the level of mineral fertilisation is particularly visi-ble in the states of the European Union, which have programmes aimed at pro-moting organic farming and integrated agricultural production. Furthermore, the high level of mineral fertilisation, which has been maintained for many years, en-tailed a degradation in the agricultural habitat and pollution of the environment, e.g. the eutrofication of water reservoirs, in many EU states, hence the reason why these countries drive towards the limitation of mineral fertiliser consumption.
In China, the unit consumption of NPK rose by 44% to 94 kg/ha AL, in India by 61% to 147 kg/ha AL, and in Pakistan by 53% to 168 kg/ha AL (Chart 25). At the same time, many developed countries, particularly those in Western Europe, saw a drop in fertiliser consumption, which is a consequence of pro-environmental and pro-health politics driving towards the limitation of chemicalisation in agriculture and the promotion of ecological and integrated agriculture. As a result, during the 10 years, fertiliser consumption in France dropped by 28%, in Germany and Great Britain by 21%, in Spain by 30%, and in Italy by 25%. However the fertilisation level in the European Union remains high, close to an average of 80 kg NPK/ha of AL. A high fertilisation level is also present in the countries of Eastern and Southeast Asia. In the United States and Canada, the fertilisation level is not high, since it results from the extensive nature of agriculture, as well as the problem of surplus food. There are still re-gions such as Africa, where the average mineral fertiliser consumption does not exceed several kilograms per 1 ha AL. This is mainly related to weak economic development, insufficiently developed agricultural infrastructure, inadequate agricultural technical equipment and unfavourable environmental conditions.

42
Chart 25. Mineral fertiliser consumption in selected countries
(kg NPK/ha AL)
3
5
7
12
17
11
28
37
45
72
50
54
108
108
65
138
85
161
91
209
110
148
153
274
6
6
11
15
15
24
34
42
47
50
53
80
81
86
94
100
110
128
147
165
168
175
184
215
0 50 100 150 200 250
Nigeria
Ethiopia
Russia
Peru
Mexico
Ukraine
Brazil
Canada
USA
Spain
Turkey
Indonesia
Italy
G. Britain
China
France
Poland
Germany
India
Netherlands
Pakistan
Bangladesh
Malaysia
Japan
2009/10
2000/01
Source: Own study on the basis of IFA and FAO information.

43
4.4. The consumption of mineral fertilisers for the most important cultivation
The main role in the structure of utilising mineral fertilisers for specific cultivation is played by cereals, which consume half of all mineral fertilisers used globally. The fertilisation of wheat and corn both consumed 15% of the global fertiliser mass, rice 14%, oil plants 10%, sugar cultivation 5%, and fruit and vegetables 17%.
The country distribution of the consumption of mineral fertilisers for spe-cific cultivation is very diverse and dependent on the structure of cultivation wi-thin a given region. In China, only 4% of the fertiliser mass is assigned to wheat fertilisation, but 18% of the fertiliser mass falls to rice cultivation and 34% to the cultivation of fruit and vegetables. In India, 19% of mineral fertilisers are used for wheat cultivation, while rice fertilisation consumes 29%. In the USA, 46% of fertilisers are used for corn, and 17% for oil plants (soybean). In Brazil, corn fertilisation consumes 22% of the fertiliser mass, while 29% is consumed by oil plant (soybean) cultivation. In the European Union, over 40% of fertilisers are used for cereals, and 10% for oil plants (rape).
4.5. The balance of mineral fertilisers in selected countries
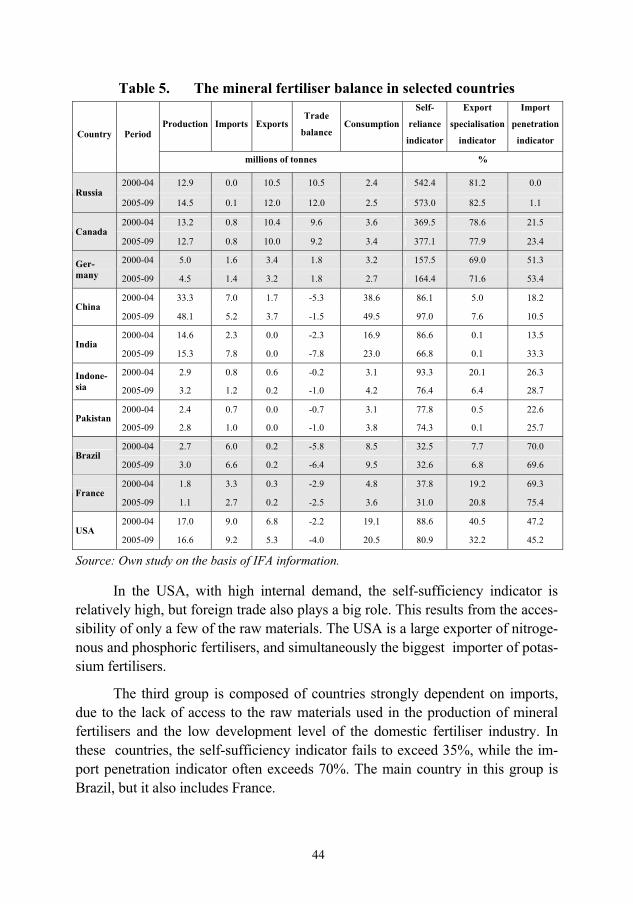
The countries possessing natural reserves of raw materials used to pro-duce mineral fertilisers are generally self-sufficient in the production of min-eral fertilisers, and are able to assign their production surplus for export. These countries include Russia, Canada and Germany. The self-sufficiency indicator of these countries exceeds 100%, while the export specialisation indicator ex-ceeds 70% (Tab. 5).
The next group is composed of countries with high internal demand for fertilisers, which strive to self-sufficiency. Based on own or imported raw ma-terials, the production of fertilisers in these countries is almost entirely as-signed for the demands of the internal market, while exports play a marginal role. This group includes China, India, Pakistan, and Indonesia. However, pro-duction in India, Pakistan and Indonesia within the past ten years has failed to keep up with the rapidly-growing demand. As a result, the fertiliser production self-sufficiency indicator dropped, while the import penetration indicator grew. In China, production grew faster than internal consumption, which caused a growth in the self-sufficiency indicator. The surplus was exportable, while imports were radically limited.
44
Table 5. The mineral fertiliser balance in selected countries
Production Imports ExportsTrade
balance Consumption
Self-
reliance
indicator
Export
specialisation
indicator
Import
penetration
indicator Country Period
millions of tonnes %
2000-04 12.9 0.0 10.5 10.5 2.4 542.4 81.2 0.0 Russia
2005-09 14.5 0.1 12.0 12.0 2.5 573.0 82.5 1.1
2000-04 13.2 0.8 10.4 9.6 3.6 369.5 78.6 21.5 Canada
2005-09 12.7 0.8 10.0 9.2 3.4 377.1 77.9 23.4
2000-04 5.0 1.6 3.4 1.8 3.2 157.5 69.0 51.3 Ger-many 2005-09 4.5 1.4 3.2 1.8 2.7 164.4 71.6 53.4
2000-04 33.3 7.0 1.7 -5.3 38.6 86.1 5.0 18.2 China
2005-09 48.1 5.2 3.7 -1.5 49.5 97.0 7.6 10.5
2000-04 14.6 2.3 0.0 -2.3 16.9 86.6 0.1 13.5 India
2005-09 15.3 7.8 0.0 -7.8 23.0 66.8 0.1 33.3
2000-04 2.9 0.8 0.6 -0.2 3.1 93.3 20.1 26.3 Indone-sia 2005-09 3.2 1.2 0.2 -1.0 4.2 76.4 6.4 28.7
2000-04 2.4 0.7 0.0 -0.7 3.1 77.8 0.5 22.6 Pakistan
2005-09 2.8 1.0 0.0 -1.0 3.8 74.3 0.1 25.7
2000-04 2.7 6.0 0.2 -5.8 8.5 32.5 7.7 70.0 Brazil
2005-09 3.0 6.6 0.2 -6.4 9.5 32.6 6.8 69.6
2000-04 1.8 3.3 0.3 -2.9 4.8 37.8 19.2 69.3 France
2005-09 1.1 2.7 0.2 -2.5 3.6 31.0 20.8 75.4
2000-04 17.0 9.0 6.8 -2.2 19.1 88.6 40.5 47.2 USA
2005-09 16.6 9.2 5.3 -4.0 20.5 80.9 32.2 45.2
Source: Own study on the basis of IFA information.
In the USA, with high internal demand, the self-sufficiency indicator is relatively high, but foreign trade also plays a big role. This results from the acces-sibility of only a few of the raw materials. The USA is a large exporter of nitroge-nous and phosphoric fertilisers, and simultaneously the biggest importer of potas-sium fertilisers.
The third group is composed of countries strongly dependent on imports, due to the lack of access to the raw materials used in the production of mineral fertilisers and the low development level of the domestic fertiliser industry. In these countries, the self-sufficiency indicator fails to exceed 35%, while the im-port penetration indicator often exceeds 70%. The main country in this group is Brazil, but it also includes France.

45
5. Mineral fertiliser prices15
The prices of mineral fertilisers are closely correlated with the prices of ag-ricultural raw materials, particularly cereal prices. The growth in the prices of ag-ricultural raw materials causes the increased profitability of agricultural produc-tion and influences the growing demand for means of production, particularly mineral fertilisers, which in turn, often results in higher prices.
The prices of mineral fertilisers also depend on the cost of the raw materials used for their production. The prices of natural gas determine the prices of ni-trogenous fertilisers , the prices of phosphorites influence the prices of phosphoric fertilisers and the prices of raw salt affect the prices of potassium fertilisers. The price level of raw materials used in the production of mineral fertilisers is often influenced by the concentration of their extraction or production, as well as their dependence on imports.
The level of fertiliser prices is also determined by the supply and demand situation and other market factors and regulations in individual regions of the world.
5.1. The prices of raw materials for fertiliser production
Ammonia
In the past, ammonia prices were mainly dependent on the demand for this product, but in recent years the fluctuations of natural gas prices caused ammonia prices to become more dependent on gas prices. This results from the high pro-portion of natural gas costs in the total cost of ammonia production – between 72 and 85%.
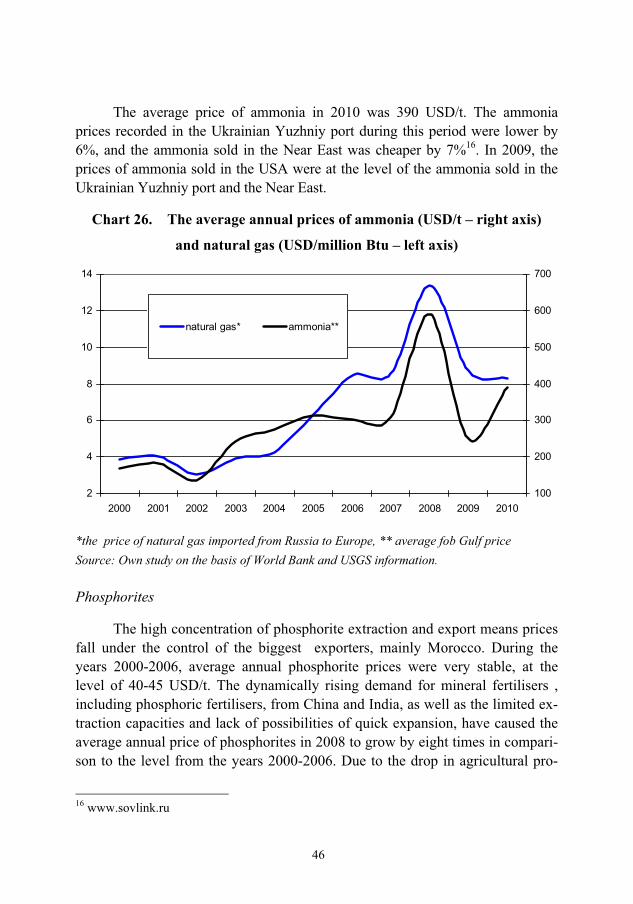
During the years 2000-2010, the average annual ammonia price recorded on the USA stock market rose by up to 130% (Chart 26). The highest price level was recorded in 2008, when the price of ammonia was 3.5 times as high as in the year 2000. For comparison, during this period, the price of natural gas in the USA more than doubled, and rose by 3.5 times in Europe. Ammonia prices are not subject to such strong regional diversity as those of natural gas. The lower ammonia production costs in regions with relatively cheap natural gas allow ammonia and ammonia-based fertilisers to be sold at lower prices [www.minerals.usgs.gov].
15 Created on the basis of World Bank information.
46
The average price of ammonia in 2010 was 390 USD/t. The ammonia prices recorded in the Ukrainian Yuzhniy port during this period were lower by 6%, and the ammonia sold in the Near East was cheaper by 7%16. In 2009, the prices of ammonia sold in the USA were at the level of the ammonia sold in the Ukrainian Yuzhniy port and the Near East.
Chart 26. The average annual prices of ammonia (USD/t – right axis)
and natural gas (USD/million Btu – left axis)
2
4
6
8
10
12
14
2000 2001 2002 2003 2004 2005 2006 2007 2008 2009 2010100
200
300
400
500
600
700
natural gas* ammonia**
*the price of natural gas imported from Russia to Europe, ** average fob Gulf price Source: Own study on the basis of World Bank and USGS information.
Phosphorites
The high concentration of phosphorite extraction and export means prices fall under the control of the biggest exporters, mainly Morocco. During the years 2000-2006, average annual phosphorite prices were very stable, at the level of 40-45 USD/t. The dynamically rising demand for mineral fertilisers , including phosphoric fertilisers, from China and India, as well as the limited ex-traction capacities and lack of possibilities of quick expansion, have caused the average annual price of phosphorites in 2008 to grow by eight times in compari-son to the level from the years 2000-2006. Due to the drop in agricultural pro-
16 www.sovlink.ru

47
duction profitability and the economic crisis, the reduction in the demand for phosphorites and phosphorite-based fertilisers caused the phosphorite prices to significantly drop; but they never dropped to the level from before the drastic price rises began at the start of 2007. In 2010, the average annual price of phos-phorites was 3 times lower when compared to 2008, but simultaneously 3 times higher when compared to 2000.
Potassium salt
The biggest influence on the level of global potassium salt prices is made by the trade politics of the two biggest producers, who are also the biggest ex-porters. The prices imposed by Russia and Canada influence the prices of other potassium salt exporters. During the years 2000-2004, the prices of potassium salt were maintained at approximately 120 USD/t.
The growing demand from China and India have caused the prices of po-tassium salt to rise since 2005, and reach the level of 570 USD/t in 2008. In 2009, potassium salt prices continued to rise, reaching an average annual level of 630 USD/t, while the prices of other mineral fertilisers and raw materials used for their production suddenly dropped. The maintenance of a high level of potassium salt prices is the result of strong market control by the two biggest exporters, Canada and Russia, which increased supply at a slower rate than in the case of nitrogenous and phosphoric fertilisers. Furthermore, despite the global collapse of the demand for potassium fertilisers, the demand from the biggest importer of potassium salt, India, remained at a very high level and actually grew.
The large potassium salt reserves in Canada and Russia, as well as the slowdown in imports by China, which previously imported large amounts of po-tassium salt, caused the global market prices in 2010 to drop to the level of ap-proximately 330 USD/t. The price drop was also influenced by the increased sup-ply of potassium salt on global markets, which resulted from the completion of the investments implemented in Germany, Chile, Argentina and Brazil.
5.2. The global market prices of mineral fertilisers
During the years 2000-2002, the global market prices of mineral fertilisers were stable. The systematically-growing demand for mineral fertilisers was fully satisfied by the slowly-growing production. The index of changes in mineral fer-tiliser prices recorded by the World Bank during this period dropped by 6%.

48
Since 2003, the demand for mineral fertilisers has continued to rise under the influence of the increased demand for fertilisers from developing countries. At the same time, the prices of natural gas began to rise, which caused the growth in the costs of producing fertilisers based on ammonia produced from natural gas, i.e. mainly urea and ammonium phosphate. The growth in natural gas prices caused significant rises for fertilisers containing nitrogen, and in consequence, the index of mineral fertiliser price changes grew by approximately 20% each year during the years 2003-2005. In 2006, the prices of natural gas stabilised, which caused a slowdown in the prices of mineral fertilisers, which rose by only 3%.
The years 2007-2008 recorded drastic rises in mineral fertiliser prices. In 2007, the fertiliser price grew by as much as 42%, and the following year by an-other 136%. Such large rises in fertiliser prices resulted from the accumulation of several factors.
The high prices of oil plants and cereals during the 2006/07 and 2007/08 seasons imposed great pressure on increasing the efficiency of plant produc-tion. The high plant product prices resulted from the small harvests of oil plants and cereals during the 2006/2007-2007/2008 seasons, causing a signifi-cant drop in global reserves. The growth in raw material prices was also caused by the activity of speculative capital. This situation coincided with the rapidly-growing global demand for oilseeds and cereals for both human consumption and fodder, mainly from developing countries such as China, India and Brazil. The industrial demand for plant products intended for biofuel production also grew, since the global market petroleum prices reached record levels during this period. This situation allowed the maintenance of the prices of oilseeds and cereals at a relatively high level, and increased demand for mineral fertilis-ers was expected to continue in successive years. These conditions were fa-vourable to the dynamic development of mineral fertilisers , the production po-tential rose and the extraction of raw materials necessary for the production of artificial fertilisers grew [Zalewski 2009].
However, the reaction of supply to the sudden demand growth was delayed due to the lack of the ability to quickly expand the production capacities and ex-traction of mining raw materials necessary for fertiliser production, which influ-enced the sudden growth in the prices of raw materials, and in consequence of mineral fertilisers. The prices of sea freight, pertaining mostly to the transport of potassium salt, ammonium phosphate, phosphoric acid, phosphorites and urea, also rose, the reasons of which included the growth in prices of direct energy car-riers. The rise in sea freight prices significantly influences the growth in the ulti-mate fertiliser price.
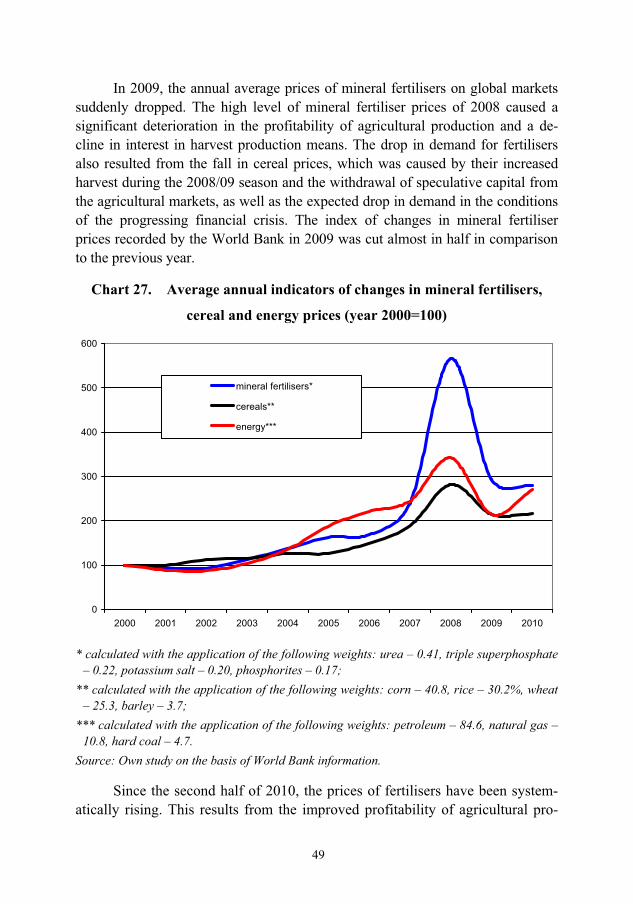
49
In 2009, the annual average prices of mineral fertilisers on global markets suddenly dropped. The high level of mineral fertiliser prices of 2008 caused a significant deterioration in the profitability of agricultural production and a de-cline in interest in harvest production means. The drop in demand for fertilisers also resulted from the fall in cereal prices, which was caused by their increased harvest during the 2008/09 season and the withdrawal of speculative capital from the agricultural markets, as well as the expected drop in demand in the conditions of the progressing financial crisis. The index of changes in mineral fertiliser prices recorded by the World Bank in 2009 was cut almost in half in comparison to the previous year.
Chart 27. Average annual indicators of changes in mineral fertilisers,
cereal and energy prices (year 2000=100)
0
100
200
300
400
500
600
2000 2001 2002 2003 2004 2005 2006 2007 2008 2009 2010
mineral fertilisers*
cereals**
energy***
* calculated with the application of the following weights: urea – 0.41, triple superphosphate – 0.22, potassium salt – 0.20, phosphorites – 0.17;
** calculated with the application of the following weights: corn – 40.8, rice – 30.2%, wheat – 25.3, barley – 3.7;
*** calculated with the application of the following weights: petroleum – 84.6, natural gas – 10.8, hard coal – 4.7.
Source: Own study on the basis of World Bank information.
Since the second half of 2010, the prices of fertilisers have been system-atically rising. This results from the improved profitability of agricultural pro-
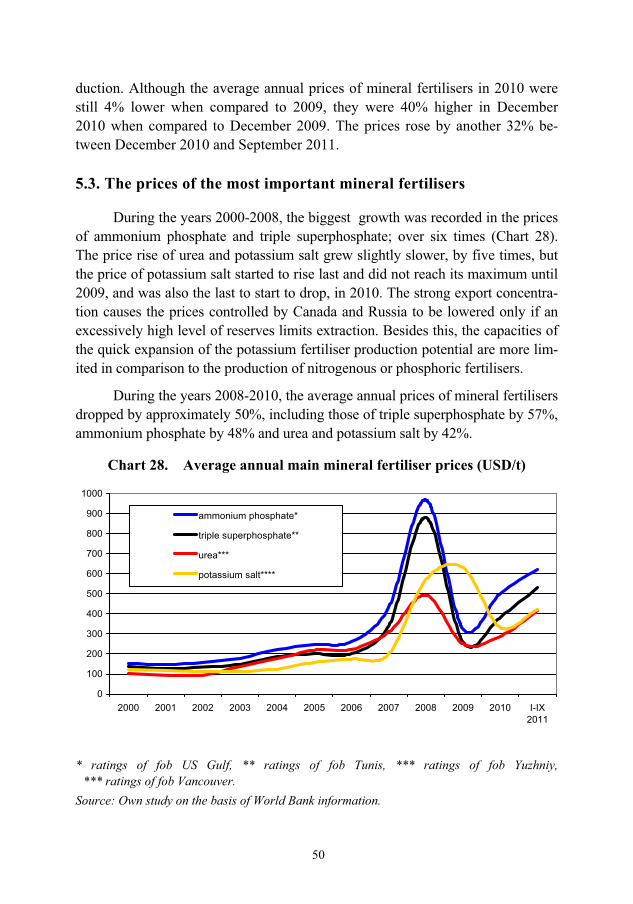
50
duction. Although the average annual prices of mineral fertilisers in 2010 were still 4% lower when compared to 2009, they were 40% higher in December 2010 when compared to December 2009. The prices rose by another 32% be-tween December 2010 and September 2011.
5.3. The prices of the most important mineral fertilisers
During the years 2000-2008, the biggest growth was recorded in the prices of ammonium phosphate and triple superphosphate; over six times (Chart 28). The price rise of urea and potassium salt grew slightly slower, by five times, but the price of potassium salt started to rise last and did not reach its maximum until 2009, and was also the last to start to drop, in 2010. The strong export concentra-tion causes the prices controlled by Canada and Russia to be lowered only if an excessively high level of reserves limits extraction. Besides this, the capacities of the quick expansion of the potassium fertiliser production potential are more lim-ited in comparison to the production of nitrogenous or phosphoric fertilisers.
During the years 2008-2010, the average annual prices of mineral fertilisers dropped by approximately 50%, including those of triple superphosphate by 57%, ammonium phosphate by 48% and urea and potassium salt by 42%.
Chart 28. Average annual main mineral fertiliser prices (USD/t)
0
100
200
300
400
500
600
700
800
900
1000
2000 2001 2002 2003 2004 2005 2006 2007 2008 2009 2010 I-IX2011
ammonium phosphate*
triple superphosphate**
urea***
potassium salt****
* ratings of fob US Gulf, ** ratings of fob Tunis, *** ratings of fob Yuzhniy, *** ratings of fob Vancouver.
Source: Own study on the basis of World Bank information.
51
From December 2009 to December 2010, the biggest growth was recorded in the prices of triple superphosphate, which doubled, while the prices of ammo-nium phosphate rose by 65%, urea by 44%, whereas the prices of potassium salt dropped by 11%. In September 2011, the biggest growth was recorded in urea prices, by 34%. During this time, the price of potassium salt rose by 33%, triple superphosphate by 20%, and ammonium phosphate by 8%.
5.4. The prices of mineral fertilisers in selected countries17
The prices of mineral fertilisers in individual countries are derived from the prices recorded on global markets, mainly in the ports of the USA, Canada, Rus-sia, Ukraine and the Near East. Global prices transfer to the local markets with some delay. Fertiliser prices in the countries possessing their own reserves of raw materials for the production of mineral fertilisers are usually lower when com-pared to the countries forced to import raw materials. Additionally, the costs of fertiliser production increase the costs of raw material transport. The most expen-sive mineral fertilisers are in the countries which are forced to import ready min-eral fertilisers because they lack a domestic fertiliser industry or specialise only in the production of specific-assortment groups of fertilisers.
Among the selected countries, the years 2000-2008 saw the biggest price rises of fertilisers purchased by farmers in Great Britain and the USA. The retail price growth in these countries was respectively 290% and 255%. During this time, fertiliser prices in Germany rose by 174%, while prices in France and Spain more than doubled (Chart 29).
During the discussed period, the growth rate of mineral fertiliser prices was the slowest in China, by 77%. Countering the rapidly-growing inflation at the end of 2007, the Chinese government took action to lower, among other things, the prices of food, fuel and gas. The biggest enterprises were obliged to seek consent to raise prices. Additionally, high export duty tax was introduced in the export of cer-tain fertilisers . These actions were aimed not only to preserve the supply of the internal market at a safe level, but mainly to prevent further price rises. In conse-quence, mineral fertiliser prices in China rose by 32% in 2008, while those in Great Britain more than doubled, and rose by 87% in Germany and by 82% in the USA. 17 Elaborated on the basis of United States Department of Agriculture (USDA), the National Bureau of Statistics of China, the National Institute for Statistics and Economic Studies (IN-SEE), the Department for Environment, Food and Rural Affairs (DEFRA), and Statistisches Bundesamt Deutschland (the Federal Statistical Office of Germany) information.

52
In 2009, the average annual mineral fertiliser prices in the discussed coun-tries dropped, due to the reduction in agricultural production profitability and de-creased demand for fertilisers . They dropped by 30% in Great Britain and the USA, by 17% in Spain, by 14% in France and by 6% in China. The German mar-ket was an exception, as it saw a growth in fertiliser prices by 8%.
Chart 29. The dynamics of mineral fertiliser prices in selected countries
(year 2000=100)
50
100
150
200
250
300
350
400
2000 2001 2002 2003 2004 2005 2006 2007 2008 2009 2010
USA Germany
France G. Britain
China
Source: Own study on the basis of USDA, National Bureau of Statistics of China, INSEE, DEFRA, and Statistisches Bundesamt Deutschland (the Federal Statistical Office of Germany) information.
The year 2010 saw more reductions in mineral fertiliser prices in the exam-ined countries, but their dynamics were lower when compared to 2009. The prices dropped by 15% in Germany, by 14% in France, by 11% in the USA, and by 4% in Great Britain. Since the second half of 2010, the mineral fertiliser prices in the discussed countries have displayed a slow growing trend.

53
Foreign trade prices of potassium salt in selected countries18
The strong concentration of potassium salt production and exports causes its international trade turnover prices to be highly influenced by the two biggest exporters, which are Canada and Russia.
In 2010, the average export price of potassium salt in Canada was 326 USD/t. During this time, the export prices of potassium salt in Russia were lower by 13%, in Belarus by 2%, and by 13% higher in Germany. This regularity was also present in previous years, which saw the highest level of export prices in Germany, which was followed by Canada and Belarus, while the lowest prices were recorded in Russia. However, the differences among potassium salt export prices in the examined countries were previously larger. In 2001, the potassium salt export price in Canada was 106 USD/t. During this time, potassium salt ex-port prices in Germany were higher by 17%, and respectively 27% and 20% lower in Russia and Belarus. The reduction in the differences in export prices among the listed countries mainly result from the progressing trade liberalisation and globalisation.
The import prices of potassium salt depend on its location of origin and supply volume. Due to this, China and India, which import the biggest quantities of potassium salt and additionally purchase it from the least expensive exporter, Russia, and obtain the lowest import prices, which are the reference point of the global market. The USA achieves low import prices for potassium salt, as it re-ceives 2/3 of Canada’s exported supply volume. In 2010, the lowest import prices of potassium salt were recorded in India, where a tonne cost an average of 331 USD. During this time, the prices in the USA were higher by 2%, in China by 6%, in Brazil by 10%, in Indonesia by 23%, in Belgium by 44%, in Japan by 44%, in Italy by 44%, and in France by 100%.
5.5. The prices of direct energy carriers and sea freight
The level of energy raw material prices is important to global economic and civic development. The sudden rise in energy carrier prices (particularly petroleum-based fuels) forced the implementation of rational energy consump-tion programmes and the limitation of economic energy consumption. These events also showed that these prices depend on many unpredictable and non-economic factors, such as the political situation in the regions supplying fuels
18 Elaborated on the basis of International Trade Centre information.

54
(military conflicts, strikes), or weather anomalies. The extremely-significant factors in the future development of the fuel and energy raw material market also result from ecological conditions, particularly from the accepted interna-tional agreements on environmental protection. The most important energy raw materials are petroleum, natural gas and coal, possessing 85%19 of total energy consumption [Grudzi�ski 2009].
Chart 30. The dynamics of direct energy carrier prices (year 2000=100)
0
100
200
300
400
500
2000 2001 2002 2003 2004 2005 2006 2007 2008 2009 2010
energy carrier index of changes
petroleum
hard coal
natural gas
Source: Own study on the basis of World Bank information.
19 The total global electrical energy consumption breakdown is as follows: petroleum 34.6%, coal 28.4%, natural gas 22.1%, nuclear energy 2%, renewable energy 12.9%. (including bio-mass energy 10.2%, water energy 2.3%, wind energy 0.2%, solar energy 0.1%, geothermal energy 0.1%) [IPCC 2011].
55
The index of changes in direct energy carriers20 recorded by the World Bank systematically grew during the years 2003-2008. In 2008, it was higher by almost 3.5 times when compared to the year 2000. The global economic crisis caused the index of price changes to drop by almost 40% in 2009 in comparison to the previous year. The year 2010 brought a revival in the global economy, which caused the index to rise by 27%.
Petroleum prices
Petroleum is one of the most important sources of energy used in the global economy. Furthermore, the prices of other energy sources, including natural gas and coal, are determined by the price of petroleum. Global petro-leum prices depend on the supply and demand situation in the energy market. Demand is mainly influenced by the dynamics of global economic deve-lopment, while supply is often artificially limited by the decisions of the Orga-nisation of Petroleum Exporting Countries21 (OPEC), which is an oligopoly attempting to maintain high prices. In addition, the political instability of the regions where the petroleum is extracted, mainly the Near East, is a factor, which strongly affects the situation on the petroleum market. With any con-
20 The index of changes in direct energy carriers is calculated on the basis of representative energy carrier prices with the application of the following weights: petroleum 84.6, natural gas 10.8, hard coal 4.7. The petroleum price is the average of the prices of the following three types of petroleum: WTI (West Texas Intermediate), Brent, and Dubai, while the natural gas price is the average of the prices of the following three types of gas: gas in the USA, gas im-ported to Europe from Russia and liquefied gas imported to Japan from Indonesia. 21 The Organisation of Petroleum Exporting Countries (OPEC) was founded in 1960 in Bagh-dad in response to the establishment of import limits by the biggest global importer, the United States. The Near East countries such as Saudi Arabia, Iraq, Iran and Kuwait, as well as Venezuela, founded OPEC to achieve a higher price for petroleum through the limitation of supplies. Besides the aforementioned countries, the current members of OPEC are also Alge-ria, Angola, Ecuador, Qatar, Libya, Nigeria and the United Arab Emirates. The objective of the organisation is the control of the global petroleum extraction, price level and exploitation fees. The proportion of OPEC countries in the production of petroleum is currently approxi-mately 40%, while the share of global reserves reaches 75%. In recent times, OPEC has been having many problems, including the reduction of proportion of petroleum reserves of OPEC countries in global reserves, dropping proportion of supply, exceeding production limits by certain OPEC countries and increasing internal conflicts, raising the significance of terminal markets, dropping the reserves of spare production capacity. The discussed problems cur-rently faced by OPEC cartel are causing the weakening of its market influence [Kryzia 2010].

56
cerns about the limitation of the regional supply due to disturbances, the price of petroleum will immediately rise.
The mode of trade exchange is a very important factor in the determination of petroleum prices, and it is not influenced by OPEC. There are two different petroleum markets. The first is the physical market, where the transactions are concluded according to the current price of reference with immediate supply, while the second is the deadline market, where the contracts are concluded for a specific period with a predefined price and supply quantity. These contracts can be freely traded, making them products. The progressive development of the pe-troleum-based debt securities market have made it a separate segment of the fi-nancial market. It is estimated that as much as 70% of deadline transactions are not associated strictly with the supply of the raw material or the preservation of reserves [Bednarski 2001, www.szczesniak.pl, Kryzia 2010].
The petroleum price at less than 20 USD/barrel for most of the 20th century influenced the acceleration of agricultural progress, production mechanisation and growth in the application of artificial fertilisers. However, the side effect of this process is the high dependency of the current food production market on the prices of energy. The rise in energy prices which has been observed during the past several years naturally affects the growth in food prices.
Petroleum affects food prices in three aspects. The growing price of petro-leum increases food transport costs and food production costs by raising the price of fuel for mechanised agriculture. The growing price of petroleum is correlated with the growing prices of mineral fertilisers, particularly nitrogenous, due to the strong correlation between petroleum prices and the prices of the basic raw mate-rial for the production of nitrogenous fertilisers, which is natural gas. The growing price of petroleum increases the economic motivation for the production of biofu-els. The latter process affects the price of food twice, as some of the nutritive plants are intended for biofuel production (the so-called first-generation biofuels, e.g. corn, sugarcane, rape, soybean), while other crops are exchanged for energy crops (the so-called second-generation biofuels, produced from products which are not in direct competition with food, e.g. energy willow, miscanthus, Virginia mallow, Jerusalem artichoke). It is activated after the petroleum price exceeds a determined limit, which falls somewhere between 80 and 100 USD/barrel.
During the years 2000-2003, the average annual petroleum price did not exceed 30 USD/barrel. During the years 2003-2008, global petroleum prices rose in an exponential manner. It is believed that global economic growth was the main reason of the rise in petroleum prices during this period. During this

57
time, average annual prices rose from the level of 29 USD/barrel to 97 USD/barrel, and the highest value – almost 133 USD – was reached in July 2008. In that month most analysts projected further index growth. This situa-tion was to be caused by the influence of political factors. These analyses were caused by the constant partisan attacks on the installations in Nigeria, the con-tinuation of the nuclear programme in Iran and the reactions of Israel. Several months later, it turned out that this information had minimal impact on petro-leum prices. The deciding impact on the petroleum market was made by the financial crisis and recessions in the most important global economies. The lower demand for petroleum caused prices to drop by as much as 70% within five months, reaching the value of 41 USD in December 2008. It is obvious that the prices of both petroleum and other energy raw materials cannot rise forever, and are defined by periodic rises and falls. Since the beginning of 2009, petroleum prices have been systematically growing, reaching the value of approximately 100 USD/barrel in September 2011 [Grudzi�ski 2009, www.worldbank.org].
Chart 31. The monthly rating of petroleum prices (USD/barrel)
10
30
50
70
90
110
130
2000 2001 2002 2003 2004 2005 2006 2007 2008 2009 2010 2011
BrentDubaiWest Texas
Source: Own study on the basis of World Bank information.
The above petroleum prices are the average of three types of petroleum on the spot market: WTI (West Texas Intermediate), Brent and Dubai. WTI petro-leum is the indicative petroleum for the American market, Brent for the European market, and Dubai for the Asian market. The price trends of the discussed types of petroleum are fully cohesive, and their prices are very similar (Chart 31). In

58
2010, Brent petroleum was the most expensive, the price of WTI petroleum was lower by 0.3%, and the price of Dubai petroleum was lower by 2%.
Natural gas
The global market prices of natural gas are strongly associated with the prices of petroleum, but are more stable, since they are less receptive to the influ-ence of speculative capital than the prices of petroleum. Furthermore, the prices of natural gas depend on the energy politics of individual countries, as well as ex-ploitation and trading conditions. The reasons for this include the issue of natural gas transport, or rather its limitations. Despite the progressing liberalisation of the natural gas trade, there are still regional markets with significant differences in price levels and modes of their determination. In Europe, the gas trade with Rus-sia is usually bound by the system of deadline contracts, based on the periodic freezing of transaction rates, which bind the parties during a defined period. Gas prices are derived from the petroleum prices of approximately six months back. The contracts for gas supplies from Russia are concluded with each country indi-vidually, which often makes them an element of political pressure [www.efixpolska.com].
The situation in the USA is completely different, as the gas trade is domi-nated by spot contracts. The current prices on the petroleum market are immedi-ately discounted on the gas market. Therefore, these prices almost immediately follow the prices of petroleum, but they are less dependent on them than the gas prices in Europe, and are in large part determined by the market. This allows for competition between these energy carriers, and a replacement of the carrier from gas to petroleum-based fuels, since prosperity brings profit to users, many of whom are prepared for such changes.
The prices of natural gas imported from Russia in Europe are significantly different from the gas prices in the USA. In 2010, the average gas prices in Eu-rope were higher than those in the USA by 90%, and several times higher than those of the internal markets of Russia or China. For example, one of the leading Russian natural gas exporters makes 3/4 of its profit from the distribution of gas on all markets from 1/4 of the gas sold in the west. In 2010, the price of the gas in Japan imported from Indonesia was higher by approximately 30%. The re-asons for the higher price of this gas include the fact that it is liquefied, i.e. LNG (Liquefied Natural Gas), which is transported by sea in tankers, unlike the gas distributed in Europe and the USA. This system of natural gas transport is popu-lar in Asia. It is estimated that the proportion of natural gas sold on global mar-kets in liquefied form reaches 30% [Paprocki 2009].

59
During the years 2000-2010, the indicator of changes in natural gas prices recorded by the World Bank grew by 56%, while the natural gas prices in the USA recorded in the Henry Hub terminal rose by only 2%, the prices of imported gas in Europe rose by 115%, and imported LNG in Japan by 130%.
The highest average annual natural gas prices were recorded in 2008, when the index of changes in natural gas prices was higher by 168% in comparison to 2000. During this time, the price of gas in the USA went up by 105%, in Europe by 247%, and in Japan by 166%. The reasons for this drastic growth in natural gas prices during this period, intensified in 2008, included the rise in petroleum prices. The growth in the prices of strategic energy carriers resulted from the rap-idly-growing demand for these products, particularly in developing countries, worries concerning stability of supplies from areas threatened with terrorism and military conflicts, shrinking reserves in the United States, the weakening USD, and the speculative factor driven by hedging funds.
Chart 32. The average annual prices of natural gas (USD/million Btu –
left axis) and petroleum (USD/barrel – right axis)
2
4
6
8
10
12
14
2000 2001 2002 2003 2004 2005 2006 2007 2008 2009 2010 I-VI2011
20
30
40
50
60
70
80
90
100
110
USA gas* Europe gas**
Japan gas*** petroleum****
* the gas prices of Henry Hub in the USA, ** the average price of Russian gas for European clients, *** the price of liquefied natural gas (LNG) imported from Indonesia to Japan, **** the average price of three types of petroleum: WTI, Brent, Dubai. Source: Own study on the basis of World Bank information.
The years 2008-2010 saw a significant drop in natural gas prices. During this period, the index of price changes dropped by 42%, the price of gas dropped in the

60
USA by 50%, in Europe by 38%, and by 14% in Japan. The main reason for the drop in natural gas prices was the drop in petroleum prices, resulting from the withdrawal of the speculative capital (the bursting of the speculative bubble), reduction of the demand due to the economic crisis and enforcement of the USD rate.
The gas prices for the industry, including the fertiliser sector, in individual countries, are very diverse and result mainly from enforced energy politics and the level of dependency on imports. The 2010 average natural gas price for the industry in the USA was 5.23 USD/million Btu. During this time, the price of gas was lower in Russia – 2.74 USD/million Btu, Kazakhstan – 1.87 USD and Can-ada – 4.03 USD. Higher prices were recorded in Great Britain – 7.64 USD/million Btu, Poland – 11.46 USD, France – 12.21 USD, Portugal – 14 USD, and Sweden – 16.7 USD [www.iea.org].
Table 6. Gas prices for industry in selected countries
(USD/millions BTU)
Country 2001 2003 2005 2007 2008 2009 2010
Switzerland 7.5 8.1 10.1 14.5 18.8 17.7 16.7 Portugal 6.1 7.2 8.6 10.8 13.8 12.2 14.0 Czech Republic 3.9 5.1 7.4 9.9 15.5 13.3 13.4 Croatia 5.9 8.3 9.9 11.0 9.8 10.6 13.1 Greece 4.6 5.6 7.9 11.1 16.2 11.1 13.0 France 5.0 6.1 8.3 10.4 15.3 11.1 12.2 Poland 4.4 4.4 5.7 9.5 13.4 10.9 11.5 Ireland 3.6 5.9 9.4 12.4 15.5 12.2 10.9 Turkey 5.1 5.8 7.7 11.1 14.4 11.8 10.3 Spain 4.4 5.1 6.4 9.6 12.3 10.9 9.8 Great Britain 3.5 4.1 7.5 8.4 11.2 8.2 7.6 Thailand 3.0 3.4 4.3 5.8 7.7 7.3 7.2 New Zealand 2.1 3.6 5.6 7.0 6.0 5.8 5.9 USA 5.0 5.6 8.2 7.4 9.4 5.1 5.2 Canada 2.7 5.3 7.3 5.4 8.9 4.3 4.0 Russia 0.5 0.9 1.3 1.9 2.5 2.1 2.7 Kazakhstan 0.9 0.9 1.2 1.7 1.9 1.9 1.9
Source: Own study on the basis of International Energy Agency (IEA) information.
The differences in natural gas prices for the industry in selected countries reach as much as 800%. This effects the production costs of ammonia, which is based on natural gas. At the gas price of 2.5 USD/million Btu, the cost of gas nec-

61
essary to produce 1 tonne of ammonia is 84 USD, while at a price of 7 USD/million BTU, these costs rise to 235 USD.
Hard coal prices
Coal is one of the basic raw materials used in the production of nitrogenous fertilisers in China. The changes in global hard coal prices mainly result from the market situation: the relation of supply and demand, the competitiveness of other energy carriers (primarily natural gas) and the development of new technologies. International trade contracts are concluded on the basis of deadline contracts, spot transactions, tenders, and transactions concluded on the electronic market. Indi-vidual exporters from different regions of the world compete with each other by defining the supply price of their product to the client; this competition is also strongly conditioned by freight prices. The physical transport distances prefer suppliers from the Republic of South Africa, the USA and South America on the European markets, and respectively exporters from Australia, Indonesia and China on the Asian markets [Lorenz, Grudzi�ski 2003].
During the years 2000-2003, coal prices22 were maintained at the level of 25-30 USD/t. Starting in 2004, due to rapidly-growing demand, coal prices began to rise, following the prices of alternative energy carriers (mainly natural gas). In 2008, the average annual price of hard coal reached a value of over 127 USD/t. In 2010, its prices were at the approximate level of 100 USD/t.
Transport costs23
Transport costs are an important element in the shaping of mineral fertiliser prices. They mainly involve fertilisers based on mined raw materials, which are present only in certain regions of the globe, primarily potassium salt.
The indicator defining the level of the transport costs of the international shipping markets is the so-called Baltic Dry Index (BDI). It is recorded on the London International Financial Futures and Options Exchange, and its value is calculated on the basis of several representative shipping routes vital to interna-tional sea transport.
Furthermore, the Baltic Dry Index is often perceived as one of the most trustworthy and direct indicators of global economic prosperity. At a relatively
22 Based on fob coal prices from Australia recorded by the World Bank. 23 Prepared on the basis of Reuters information.

62
stable merchant fleet size, the rising prices of sea freight entail greater demand for transport services, which indicates increased demand for merchandise and raw materials, i.e. prosperity and economic growth.
During the years 2000-2002, the BDI value oscillated within 1 and 1.5 thousand points. From the beginning of 2003 until the end of 2006, the discussed indicator presented cyclical changes within 2 and 6 thousand points, and began to grow dynamically from the beginning of 2007, reaching a record value of over 11 thousand points in May 2008. The economic crisis caused the value of the dis-cussed indicator to drop by over 90% within six months. Starting from the begin-ning of 2009, the BDI indicator began to systematically rise, but it failed to ex-ceed 4 thousand points.
The reason for the rapidly-growing freight prices during 2007 and the first half of 2008 was the rapidly-rising demand for transport services in the conditions of the economic boom peak, and the lack of the ability to quickly expand trans-port capacities (the construction of a ship takes 2-3 years). From the second half of 2008, the demand for transport services suffered a drastic collapse, which en-tailed a dynamic drop in freight prices. Additionally, from the beginning of 2009, the tonnage of the transport fleet began to rise faster, since the market received the units commissioned in 2007. As a result, the level of utilising the transport potential of carriers began to drop, significantly slowing down the growth in freight prices.
Chart 33. Baltic Dry Index ratings
0
2000
4000
6000
8000
10000
12000
I 200
1
VII 2
001
I 200
2
VII 2
002
I 200
3
VII 2
003
I 200
4
VII 2
004
I 200
5
VII 2
005
I 200
6
VII 2
006
I 200
7
VII 2
007
I 200
8
VII 2
008
I 200
9
VII 2
009
I 201
0
VII 2
010
I 201
1
VII 2
011
Source: Own study on the basis of Reuters information.

63
Summary
The years 2000-2010 saw significant market changes within the mineral ferti-liser market, which were mainly conditioned by the influence of the agricultural raw material market and the energy market. During the discussed period, the agricultural market saw a significant rise in demand for agricultural raw materials, which on the one hand resulted from the growing demand for food by developing countries, and on the other from the increased use of plants cultivated for alternative purposes. The energy market recorded significant rises in prices of basic energy raw materials, which influenced the rise in mineral fertiliser production costs. The result of the rapi-dly-growing demand for mineral fertilisers under the conditions of slowly rising sup-ply and growing costs of producing fertilisers was a drastic increase in fertiliser pri-ces in 2008. The slowdown in demand for agricultural raw materials in the condi-tions of the economic crisis, with simultaneous reductions in energy raw material prices, influenced the significant drop in fertiliser prices during the years 2009-2010.
The most important supply and demand changes within the mineral fertiliser market during the discussed period should primarily include the growth in produc-tion and consumption of mineral fertilisers in developing countries, and the drop in the economically-developed countries.
A particularly significant growth in mineral fertiliser consumption was re-corded in China and India. In reply to the growing consumption, China increased its production, which caused significant limitations on imports, while the imports into India significantly rose without any changes in production.
In the near future, the shaping of the global mineral fertiliser market will be influenced by the economic situation on the agricultural raw material market, as well as the condition of the energy market. However, a supply and demand situa-tion on the mineral fertiliser market as tense as during the year 2007 and the first half of 2008 is not expected, since the multiyear investments aimed at increasing the mineral fertiliser production potential and increases in the extraction of phos-phorites and potassium salt are currently being completed. Furthermore, the pro-gressing reallocation of nitrogenous fertiliser production to more competitive re-gions will have an impact on the gradual growth in their supply on the global mar-ket and a slower increase in prices.
The global situation of the mineral fertiliser market will undoubtedly be im-pacted by the related politics of China and India, which are difficult to project. However, they will have to adapt to the changing conditions of foreign trade.

64
Bibliography
1. Bednarski R.: Instrumenty pochodne w bran�y paliwowej (Derivatives in the fuel
industry), Rynek Terminowy, No. 2/2001.
2. Grabi�ski J.: Znaczenie czynników ograniczajcych plonowanie ro�lin uprawnych
przy ró�nym poziomie nawo�enia mineralnego (The significance of factors limiting
arable plant yields at various levels of mineral fertilisation), Wie� Jutra 11, Warsaw
2001.
3. Grudzi�ski Z.: Relacje cen surowców energetycznych na rynkach �wiatowych (The
relationships between energy raw material prices on global markets), Przegl�d
Górniczy 11-12/2009.
4. Grzebisz W.: Potas w produkcji ro�linnej (Potassium in agricultural production),
Agricultural University, Pozna� 2004.
5. Huang W.: Impact of rising natural gas prices on U.S. ammonia supply, USDA 2007.
6. Igras J: Potencja� polskiego przemys�u nawozowego na tle Unii Europejskiej [w:]
Zasady wprowadzania nawozów do obrotu (The potential of the Polish fertiliser
industry in light of the European Union [in:] Regulations of including fertilisers in
turnover), IUNG, Pu�awy 2006.
7. IPCC: Intergovernmental Panel on Climate Change (IPCC) Special Report on Re-
newable Energy Sources and Climate Change Mitigation, Abu Dhabi 2011.
8. Korzeniowska J., Robaczyk Z.: Czy �wiatu grozi brak fosforu do produkcji nawo-
zów? (Is the world threatened by a shortage of phosphorus for fertiliser produc-
tion?) Nasza Rola No. 2, Gda�sk 2011.
9. Kryzia D.: Rola kartelu OPEC na wspó�czesnym rynku ropy naftowej (The role of
the OPEC cartel on the current petroleum market), Scientific Journals of the Min-
eral Raw Material and Energy Management Institute of the Polish Science Acad-
emy No. 77, Kraków 2010.
10. Lorenz U., Grudzi�ski Z.: Ceny w�gla kamiennego energetycznego w kraju i na
rynkach mi�dzynarodowych (The prices of energy hard coal, domestically and on
international markets) Polityka Energetyczna, Volume 6, Kraków 2003.
11. Paprocki J.: Gaz ziemny, wa�ny surowiec przemys�u chemicznego (Natural gas, a
significant component in the chemical industry), Chemik Monthly 5/2009.

12. Industry: Przemys� wielkotona�owych chemikaliów nieorganicznych, amoniaku,
kwasów i nawozów sztucznych. Najlepsze dost�pne techniki. Wytyczne dla bran�y
chemicznej w Polsce (The industry of high-tonnage inorganic chemicals, ammonia,
acids and artificial fertilisers. Best available techniques. Guidelines for the chemi-
cal industry in Poland), Warsaw 2005.
13. Wilk W.: Globalne ocieplenie i kryzys �ywno�ciowy (Global warming and the food
crises), Warsaw 2008.
14. Zalewski A.: Sytuacja na rynku nawozów mineralnych w 2008 r. (The situation on
the mineral fertiliser market in 2008), Journal of Agribusiness and Rural Develop-
ment 2/2009, Pozna� 2009.
15. [www.icis.com]
16. [www.fertilizer.org]
17. [www.minerals.usgs.gov]
18. [www.intracen.org]
19. [www.yara.dk]
20. [www.bp.com/statisticalreview]
21. [www.efixpolska.com]
22. [www.worldbank.org]
23. [www.efma.org]
24. [www.faostat.fao.org]
25. [www.iea.org]
26. [www.szczesniak.pl]
27. [www.sovlink.ru]
