the global solar power market shines again
TRANSCRIPT

Global Solar Power Market Solar PV is Becoming a High-growth Mainstream Energy Source in
Emerging Markets
MA28-14
June 2014

2 MA28-14
Contents
Section Slide Number
Executive Summary 4
Market Overview 11
Solar Power Market -
• Drivers and Restraints 20
• Forecasts and Trends 29
• Market Share and Competitive Analysis 58
CEO’s 360 Degree Perspective 67
North America Analysis 69
Europe Analysis 91
Asia-Pacific Analysis 113
Latin America Analysis 135
Middle East and Africa Analysis 157
The Last Word 178
Appendix 181

3 MA28-14
CEO’s Perspective
2 The Asia-Pacific market is the fastest and
largest market for industrial, commercial, and
residential solar PV systems.
3 FiT incentives, subsidies, and supportive
government legislation have increased solar
power market attractiveness.
4
Demand is fast emerging in the Latin
America region and the Middle East and
Africa (MEA) region due to rapid growth and
unreliable electric grid networks.
5 Aggressive expansion by Chinese PV
module manufacturers has led to global
overcapacity and market consolidation.
1
Prices of solar PV modules are expected to
decline further or, at best, stabilise because
most companies still have high inventory
levels.
Source: Frost & Sullivan

4 MA28-14
Key Findings
• Frost & Sullivan estimates that the global solar market revenue decreased by 12.9% in 2013 compared to the previous year. Market revenue is estimated to reach $137.02 billion in 2020 growing at a compound annual growth rate (CAGR) of 12.6%. The market is expected to follow a positive growth pattern throughout the forecast period despite economic uncertainty in the global market.
• As a result of significant overcapacity and price decline of photovoltaic (PV) modules, the market registered negative growth in 2013 and larger global suppliers of PV panels struggled to make a profit, with some of them filing for bankruptcy.
• In 2013, the industrial and public projects segment accounted for the majority of the annual installed capacity at 50% and will be the fastest-growing segment for annual capacity installed at a CAGR of 10.2%.
• One of the key drivers for this market has been defining the structure of feed-in tariffs (FiTs) for solar PV-generated power. Favourable legislation should continue to propel the growth of the industry as a whole.
• A number of government-sponsored initiatives are expected to boost the proportion of energy coming from green sources, and political willingness will also be a key driver of this market throughout the forecast period. With climate change high on the agenda for most governments, renewable energy has come to the forefront as one of the solutions proposed to combat global warming.
Source: Frost & Sullivan

5 MA28-14
• Growth in the solar power market is impacted by the level of insolation that a region receives. Insolation is defined as the amount of solar energy reaching the earth, which is usually strongest on and around the equator and is measured in kWh/m2/day.
• Higher latitudes have lower insolation levels, therefore, some regions are unattractive markets for solar PV.
Key Findings (continued)
• According to the European Photovoltaic Industry Association (EPIA), ‘‘China and India will lead the way as PV prices fall and economies rapidly develop in countries located ±35° around the equator.’’ China and India have become the most attractive markets over the last 5 years. Most large PV module manufacturers are building up their capabilities with tie-ups and alliances in these countries. Increased investment into this market is a result of the likely introduction of FiT systems, adequate solar radiation, and increasing awareness of renewable technologies.
• With increased technological efficiency, the cost of generating solar energy has decreased significantly, though the installation and maintenance costs still remain relatively high. Therefore, incentive mechanisms are an important factor encouraging investments for growth of the solar power market.
Key: kWh/m2/day = kilowatt hour/square metres/day Source: Frost & Sullivan
Solar Power Market: Solar Radiation Map, Global, 2013
Image Source: http://meteonorm.com

6 MA28-14
Key Findings (continued)
• The reduction of emissions from greenhouse gases (GHGs) and other pollutants is a priority for many countries, while energy efficiency is one of the most cost-effective ways to enhance security of energy supply. In many ways, energy sufficiency is one of the drivers impacting growth of the solar power market.
• The competitive landscape of the solar power market has been extremely dynamic with companies registering high growth at one point and declaring bankruptcy a few years later.
• Low manufacturing costs in Asia, particularly China, have resulted in the liquidation of some industry pioneers such as BP Solar, Photowatt (one of the first PV companies to become profitable), and Evergreen Solar (which closed its solar division, as was the case for BP). Q-Cells also closed down (although it was later rescued by BMW heir, Quandt). Suntech declared bankruptcy in March 2013.
• However, the market currently looks quite buoyant and Frost & Sullivan expects the market revenue to reach $74.79 billion in 2014, an increase of 25% over 2013.
Source: Frost & Sullivan

7 MA28-14
Drivers and Restraints
Solar Power Market: Key Market Drivers and Restraints, Global, 2014–2020
Dri
ve
rs
Re
str
ain
ts
Dri
ve
rs
Re
str
ain
ts
Greater demand for
energy sustainability
drives opportunities
for solar PV.
Recession-triggered
price declines will
accelerate
installations. Government
incentives promote
the solar power
market.
High reliance on
government support
impedes development.
Lower energy return on
invested (EROI) compared
to conventional energy
systems reduces growth
potential.
Economic downturn and
global instability still
discourage significant
capital investments in the
market.
The wider market for other
renewable energy
technologies restrains
uptake of solar PV systems.
Denotes long-term impact
Denotes current impact Source: Frost & Sullivan
Increasing environmental
awareness and
decreasing dependency
on fossil fuels will drive
the market.
Technological
improvements and
advances in
efficiency create
new opportunities.
Key Takeaway: Energy sustainability, price declines, and environmental awareness drive the market.

8 MA28-14
Revenue Forecast Discussion
0
20
40
60
80
100
120
140
160
2013 2020
Revenue 59.84 137.02
Reve
nu
e (
$ B
illi
on
)
Solar Power Market: Revenue Forecast, Global, 2013 and 2020
• The global solar power market revenues are expected
to increase from $59.84 billion in 2013 to $137.02 billion
by 2020.
• The market is driven by increasing the focus to curb
emissions, drafting strict clean energy regulations, and
offering adequate subsidies to the renewable energy
sector. Solar power finds applications across
residential, commercial, industrial, and public projects.
• As a result of significant overcapacity in the solar power
market, larger global suppliers of PV panels in the
emerging markets were struggling to make profits. The
market witnessed drastic changes in the supply-
demand pattern, regional policies, and tariff cuts.
• The market is largely influenced by pricing patterns of
PV modules and the ability of the global suppliers to
exploit short-term revenue opportunities.
• Because the market is likely to be driven by the
emerging markets, it is important that the solar PV
value chain is adequately integrated such that suppliers
and project developers can adjust project deployment
between different countries and regions on short notice.
Note: All figures are rounded. The base year is 2013. Source: Frost & Sullivan
Year

9 MA28-14
Annual Installed Capacity Forecast Discussion
0
10,000
20,000
30,000
40,000
50,000
60,000
2013 2020
Annual Installed Capacity
28,528 54,190
An
nu
al
Ins
tall
ed
Cap
ac
ity (
MW
)
Solar Power Market: Annual Installed Capacity Forecast, Global, 2013 and
2020
• Frost & Sullivan estimates that the global solar
market annual installed capacity decreased by 9.1%
in 2013, compared to 2012. The annual installed
capacity is estimated to reach 54.2 GW in 2020,
growing at a CAGR of 9.6%.
• A total of almost 45 GW of solar PV capacity is
expected to be added every year until 2020. The
price decline of PV modules will be a key market
driver supporting the penetration of solar power,
especially in emerging markets.
• The solar market is sure to benefit from various
incentive schemes in the forms of tradable green
energy certificates, FiTs, and tax rebates for the use
of renewable energy for power generation. However,
it continues to remain very heterogeneous and solar
PV penetration varies widely and is dependent on
local and regional policies.
• Policy decisions will drive the market during the
forecast period. Environmental policies, along with
upgrades and modifications of the electricity grid, will
continue to have a heavy influence on the electricity
prices for final consumers.
Note: All figures are rounded. The base year is 2013. Source: Frost & Sullivan
Year
10 MA28-14
Market Structure
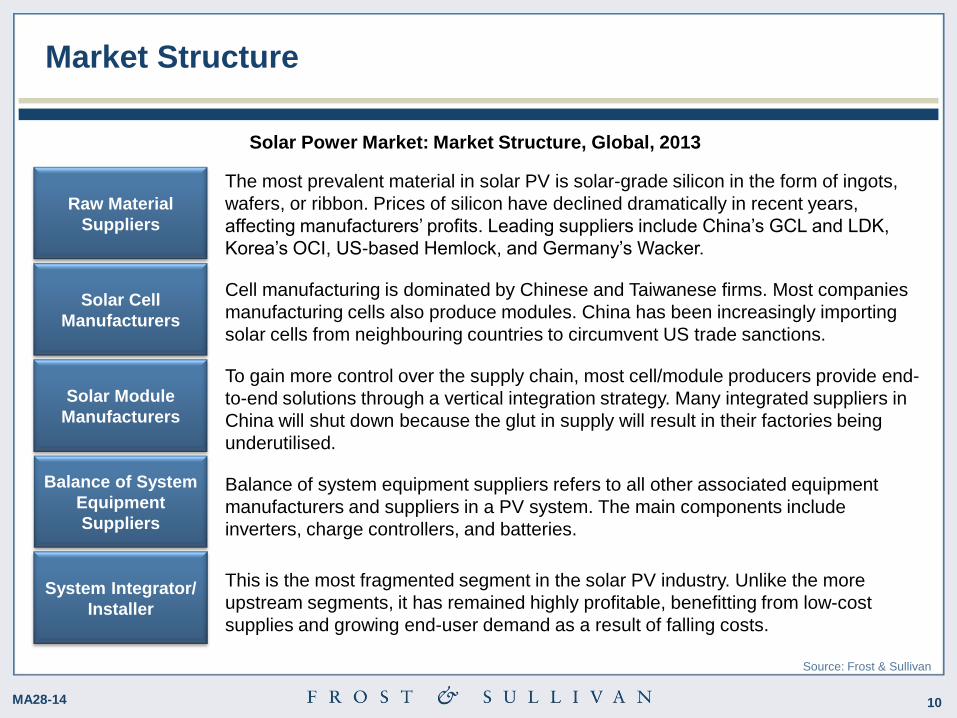
The most prevalent material in solar PV is solar-grade silicon in the form of ingots,
wafers, or ribbon. Prices of silicon have declined dramatically in recent years,
affecting manufacturers’ profits. Leading suppliers include China’s GCL and LDK,
Korea’s OCI, US-based Hemlock, and Germany’s Wacker.
Cell manufacturing is dominated by Chinese and Taiwanese firms. Most companies
manufacturing cells also produce modules. China has been increasingly importing
solar cells from neighbouring countries to circumvent US trade sanctions.
To gain more control over the supply chain, most cell/module producers provide end-
to-end solutions through a vertical integration strategy. Many integrated suppliers in
China will shut down because the glut in supply will result in their factories being
underutilised.
Balance of system equipment suppliers refers to all other associated equipment
manufacturers and suppliers in a PV system. The main components include
inverters, charge controllers, and batteries.
This is the most fragmented segment in the solar PV industry. Unlike the more
upstream segments, it has remained highly profitable, benefitting from low-cost
supplies and growing end-user demand as a result of falling costs.
Solar Power Market: Market Structure, Global, 2013
Raw Material
Suppliers
Solar Cell
Manufacturers
Solar Module
Manufacturers
Balance of System
Equipment
Suppliers
System Integrator/
Installer
Source: Frost & Sullivan

11 MA28-14
Distribution Channels
Solar PV Cell/Module
Manufacturers
End User
Company-owned
Dealers/Distributors
Independent Accredited
Installers
Agents
Partners
Direct Sales
Superstores
EPC Sales
Solar Power Market: Distribution Channel Analysis, Global, 2013
Key: EPC = engineering, procurement, and construction
Source: Frost & Sullivan
30%
Key Takeaway: Independent accredited installers are dominant in the distribution system.
10%
25%
15%
5%
5%
10%

12 MA28-14
Pricing Analysis
Solar Power Market: Price Component
Structure, Global, 2013
Component
Per cent of
Overall
Capital Costs
Trend
PV module/panels 40–55%
Inverters 20–35%
Mounting Frame 8–12%
Balance of Systems 6–8%
Planning and
Installation 10–20%
• The PV module is a critical component of the solar
PV system. Modules are clusters of PV cells
incorporated into a unit usually under a sheet of
glass.
• The inverter is used to convert direct current (DC)
electricity produced by the PV module into alternating
current (AC) electricity.
• A mounting frame’s purpose is to hold the modules
together. Frames can vary in design and materials,
depending on the type of installation: roof-mounted,
pole-mounted, or ground-based. Also, tracking
systems can be used to optimise the angle of the PV
module relative to the sun, increasing the yields by
25% to 40%
• Batteries can be used mainly for off-grid systems.
Deep-cycle batteries in solar power systems are
designed to be discharged constantly, over longer
time periods.
• The balance of system components includes meters,
switches, and the cables.
Note: All figures are rounded. The base year is 2013. Source: Frost & Sullivan
Trend Decreasing Stable Increasing

13 MA28-14
Pricing Trends
Solar Power Market: Price Trends, Global,
2001–2020
• The continued panel price reduction and
the volatility of legislative policies make
it difficult to predict the future of solar
PV price movements. Frost & Sullivan
forecasts that the price of PV modules
is, at best, likely to stabilise, if not
reduce further.
• Although the price of solar systems has
decreased in the last few years, the
costs are still high for an investor with
no incentives.
• High costs lead to lengthy payback
periods that may deter investments in
solar power.
• Moreover, several original equipment
manufacturers (OEMs) from the United
States and Europe are likely to
penetrate the untapped Southeast Asia
market to survive competition.
• FiTs are the most popular form of
government support.
Source: www.statista.com; Frost & Sullivan
0.0
0.5
1.0
1.5
2.0
2.5
3.0
3.5
4.0
20
01
20
02
20
03
20
04
20
05
20
06
20
07
20
08
20
09
20
10
20
11
20
12
20
13
20
14
20
15
20
16
20
17
20
18
20
19
20
20
Pri
ce
Pe
r P
ea
k W
att
($)
PV Cells PV Modules
Year

14 MA28-14
LCOE Analysis
LCOE, $/MWh Green energy
Total Lifetime Expenses
Energy Output, MWh
Resource Availability
Rated Power of Equipment
Equipment Lifetime
Equipment Availability
Capital Costs
O&M Costs
Discount Factor
Equipment Lifetime
Discount Factor
Comparison with
‘grid’ electricity
Solar Power Market: LCOE, Global, 2013
• The LCOE is defined as the total life cycle cost of a PV system / total lifetime energy production. Massive
regional variations and assumptions exist on every element of the LCOE equation. Capital costs and
resource availability are the main factors affecting LCOE for solar energy.
• The LCOE for PV solar electricity ranges between $0.10 and $0.20 per kilowatt hour (kWh). A few
renewable energy sources are already competitive with conventional generation. However, solar is still
above grid parity at present.
• The price reduction of PV modules, FiT incentive schemes, and net metering policies that are adopted
globally are likely to reduce LCOE and make it comparable with other conventional/renewable energy
sources. Source: Frost & Sullivan Note: operations and maintenance (O&M)

15 MA28-14
Solar Power Market: Solar PV Technology Curve, Global, 2013
Technology Analysis
Maturity Development Growth Decline
Time
Source: Frost & Sullivan
Dye-sensitised solar
cell (DSSC)
Ma
rke
t P
en
etr
ati
on
an
d C
om
me
rcia
lis
ati
on
Organic Cell
Hybrid HIT Cell
2nd Generation PV (thin-film based)
1st Generation PV
(crystalline based)
Third-generation solar cells aim to achieve high
efficiency but still use thin film and second-
generation deposition methods. This should be
done with only a small increase in area costs and;
thus, reduced cost per watt peak.
Thin-film solar technologies primarily use non-
semiconductor materials including copper, cadmium,
and tellurium to create PV cells. Second-generation
solar cells are cheaper than first-generation solar
cells but have lower efficiency. They have lower cost
per watt and are effective under low light conditions.
First-generation solar cells dominate
the commercial market because they
have higher efficiencies. There is likely
to be a sustained demand for this solar
PV technology because it is cheaper,
reliable, tested, and proven over the
years.
3rd Generation PV

16 MA28-14
Technology Trends
• Polysilicon-based technologies are the most widespread, but thin-film technologies have been gaining
market share. However, the on-going price falls of polysilicon have eroded some of the cost advantages
of thin film as its market share has remained at about 14% of the annual installed capacity in 2013.
• The maximum recorded lab cell efficiency is about 20% for polysilicon-based technologies and 15% for
thin-film solar cells. However, scientists at Empa, the Swiss Federal Laboratories for Materials Science
and Technology, announced in early 2013 that they had developed thin-film solar cells with a new
efficiency record of 20.4%.
• According to the Fraunhofer Institute for Solar Energy Systems, material usage for silicon cells has
been reduced significantly during the past 5 years from about 16 grams per Watt-Peak (g/Wp) to 6 g/Wp
due to increased efficiencies and thinner wafers.
Source: Frost & Sullivan
• Until now, adoption of the first-generation technology (i.e.,
polycrystalline cells and modules) has dominated the solar power
market. This includes both the on-grid and off-grid markets.
• There is a slow and steady demand for thin-film solar cells,
especially amorphous silicon cells and modules.
• Extensive research and development (R&D) spending in recent
years, combined with mass market development leading to scale
economies, has led to dramatic declines in the cost of solar PV
modules, estimated at up to 75% from pre-recession levels.

17 MA28-14
Solar Power Market: Life Cycle Assessment, Global, 2013
Regional Life Cycle Assessment
Maturity Development Growth Decline
Time
Source: Frost & Sullivan
North
America
Ma
rke
t V
alu
e
Latin America
MEA
APAC
Europe
Middle East: Power demand and supply gaps and demand from
infrastructure projects have created a market for solar PV.
Africa: The African market is in a growth stage. The oil and gas
and construction sectors are driving demand for solar PV. Major
power outages in these regions will lead to increased demand for
energy security.
APAC: The power supply gap and demand for
adequate electricity have created a need for
solar PV in APAC. India, China, and South
Asia have become attractive destinations for
market expansion.
Europe: The European market
is in the late growth stage.
European participants are
considering geographical
expansion and improving
technological efficiency.
North America: The expiration of the 1603
program in the United States will affect new
system installations. Industry participants are
convinced that the market in the Americas will
grow, albeit at a slower rate.
Latin America: Latin American
countries are highly reliant on
hydroelectric power. During
droughts, the demand for solar
power increases.

18 MA28-14
Strategic Analysis—Five Forces Model
Source: Frost & Sullivan
Intensity of Rivalry: High
Opportunities are well known; therefore,
many suppliers compete to enter bids in
a good position.
Bargaining Power of
Customers: Medium-
High
In the current environment,
the bargaining power of end
users is high due to a large
number of suppliers in the
market.
Bargaining Power
of Suppliers: Low
The market is end-user
oriented for solar PV,
and competition is fierce
among suppliers to win
projects.
Threat of New Entrants: High The increasing activities by regional manufacturers, chiefly in the
APAC market, have resulted in price competition and increased
threats to large global participants of solar modules.
Threat of Substitutes: Medium-High Most substitutes come in the form of other renewable and distributed
generation technologies, such as gensets. The flexibility of the
technology and support incentives are key decision drivers for solar.
Solar Power Market: Five Forces Model, Global, 2013

19 MA28-14
The Last Word—3 Big Predictions
2 APAC will continue to be the largest region for solar power. Most manufacturers are
likely to build up manufacturing capabilities either organically or through partnerships
and alliances in the region.
3 The solar PV supply chain participants are likely to develop new technologies that will
integrate PVs with flexible infrastructure grids. Solar PV power will mature into a
mainstream technology with the help of efficient grid integration and management.
1 Effective policies and regulatory frameworks, the low cost of solar modules, and
active participation and high awareness among customers will drive the growth of the
global solar power market.
Source: Frost & Sullivan

20 MA28-14
Research Team
Lead Analyst Research Director
John Raspin Partner
Energy and Environment
(+44) 20 7915 7814
Pritil Gunjan Industry Analyst
Energy and Environment
(+44) 20 7915 7832
Contributing Research Manager
Alina Bakhareva Research Manager
Energy and Environment
(+44) 20 7915 7829