the global stratification of unemployment and - amazon s3
TRANSCRIPT

Centro Argentino de Estudios Internacionales www.caei.com.ar Programa Teoría de las Relaciones Internacionales / IR Theory Program
The Global Stratification of Unemployment and Underemployment
By Gernot Köhler1
[email protected] Abstract The article presents statistical estimates concerning the global stratification of unemployment and underemployment. Regional breakdowns of unemployment are available in the literature, but regionally aggregated information does not fully reveal the global centre-periphery stratification that exists with respect to labour markets. In this article, countries are organized in terms of quintiles of GDP per capita. For each quintile of countries, averages of unemployment, underemployment, women’s economic activity, and child employment are estimated. The available source data are not nearly as complete as would be desirable. Nevertheless, some plausible estimates are possible, which show the extent of global stratification with respect to unemployment and underemployment. Introduction The World Commission on the Social Dimensions of Globalisation, which was sponsored by the International Labour Office, observed critically that the main global economic organizations – namely, World Trade Organization, International Monetary Fund, and World Bank, are not committed to the creation of decent employment (World Commission 2004, p. 113, #506). The World Commission demanded that “decent work” must be made a “key goal of economic policy” at the national level (p. 142, #5) and, furthermore, that “global macroeconomic management” must “aim to achieve full employment” in the long run (p. 145, #8). How much change in that direction will come about, depends on the successes of pro-labour political parties, movements, and organizations throughout the global political economy. This article presents statistical estimates of the global stratification of unemployment and underemployment. Regional breakdowns of unemployment are available in the literature (see, for example, Appendix 1), but regionally aggregated information does not fully reveal the global centre-periphery stratification that exists with respect to labour markets. In this article, I have organized countries in terms of quintiles of GDP per capita. For each quintile of countries, averages of unemployment, underemployment, women’s economic activity, and child employment are estimated. The available data are not nearly as complete as would be desirable. Nevertheless, some plausible estimates are possible, which show a pattern of global stratification with respect to unemployment and underemployment. 1 Gernot Köhler, Ph.D., writes on issues of global economics. Book publications: Global Wage System: A Study of International Wage Differences (2004), Globalization: Critical Perspectives (with Chaves, 2003), Global Keynesianism (with Tausch, 2002), monograph on Global Apartheid (1978). Numerous journal articles. Formerly professor at Sheridan College, Oakville, Canada

Centro Argentino de Estudios Internacionales www.caei.com.ar Programa Teoría de las Relaciones Internacionales / IR Theory Program
1. The Quintiles The quintiles of countries and their GDP per capita ranges are listed in Table 1. The quintiles are based on a list of 178 countries, namely, all those countries that have data on GDP per capita at purchasing power parity for the year 2005 in the “World Economic Outlook” database maintained by the International Monetary Fund. Table 1 Quintiles
Gross domestic product per capita, 2005 Examples of countries within the quintile
US dollars, at purchasing power (PPP) rates
Quintile N= Lowest Highest Lowest Highest
Q1 35 18,435 64,889 Bahamas Luxembourg
Q2 35 7,858 17,667 Kazakhstan Bahrain
Q3 36 4,321 7,851 Azerbaijan Thailand
Q4 36 1,889 4,223 Cameroon Paraguay
Q5 36 628 1,848 Sierra Leone Chad
Total 178
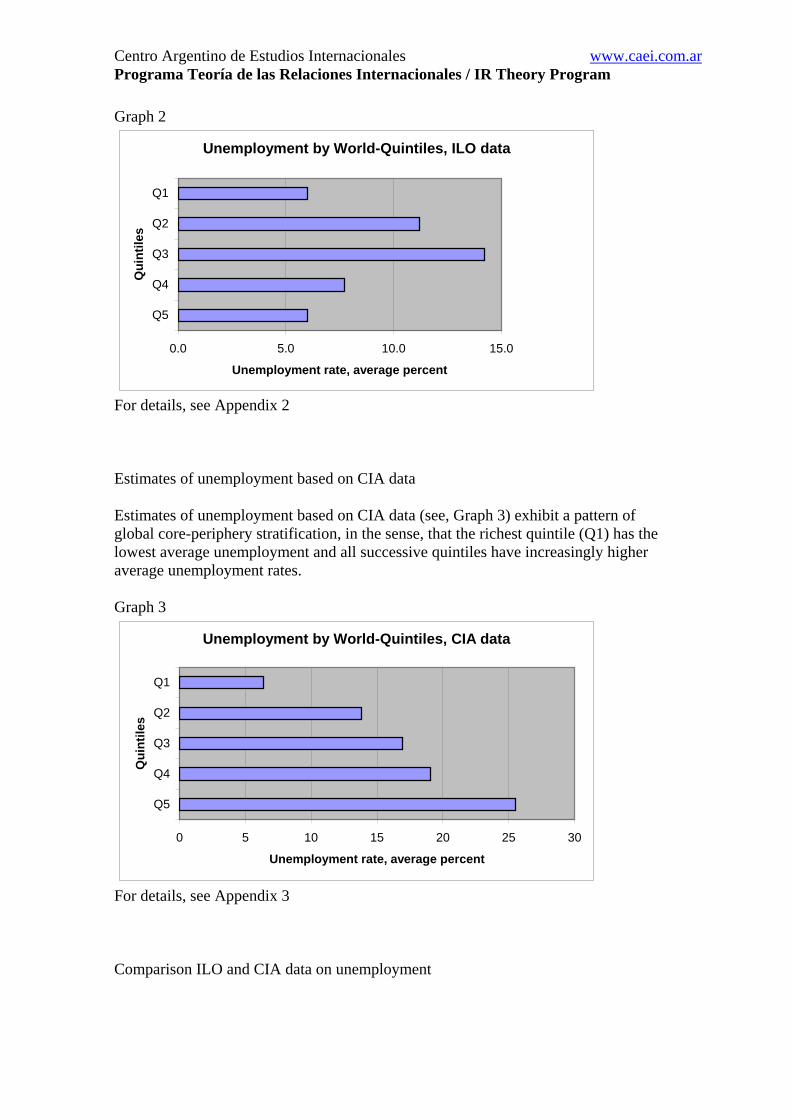
Source: International Monetary Fund (2005), “World Economic Outlook” online database. For a listing of individual countries, see Appendix 7. Quintile 1 includes the countries that are usually considered as the developed “centre” of the world system and some other rich countries. Quintiles 2 to 5 include all other countries. 2. Unemployment The distribution of global unemployment looks very different, depending on which data source is consulted. Two of the major sources for worldwide data on unemployment are the International Labour Office (ILO) and the U.S. Central Intelligence Agency (CIA). The unemployment data obtainable from the two sources differ in a significant way. I will show two separate estimates of unemployment based on the two different sources. The major difference between the two sources appears to result from a different treatment of underemployment. Estimates of unemployment based on ILO data ILO data on unemployment are shown in Graph 2 and exhibit a curvilinear pattern. That is to say that average unemployment rates are highest (near 15 percent) in the middle quintile (Quintile 3) and are lowest (about six percent) both in the richest and the poorest quintiles (Quintiles 1 and 5).
Centro Argentino de Estudios Internacionales www.caei.com.ar Programa Teoría de las Relaciones Internacionales / IR Theory Program
Graph 2
Unemployment by World-Quintiles, ILO data
0.0 5.0 10.0 15.0
Q5
Q4
Q3
Q2
Q1
Qui
ntile
s
Unemployment rate, average percent
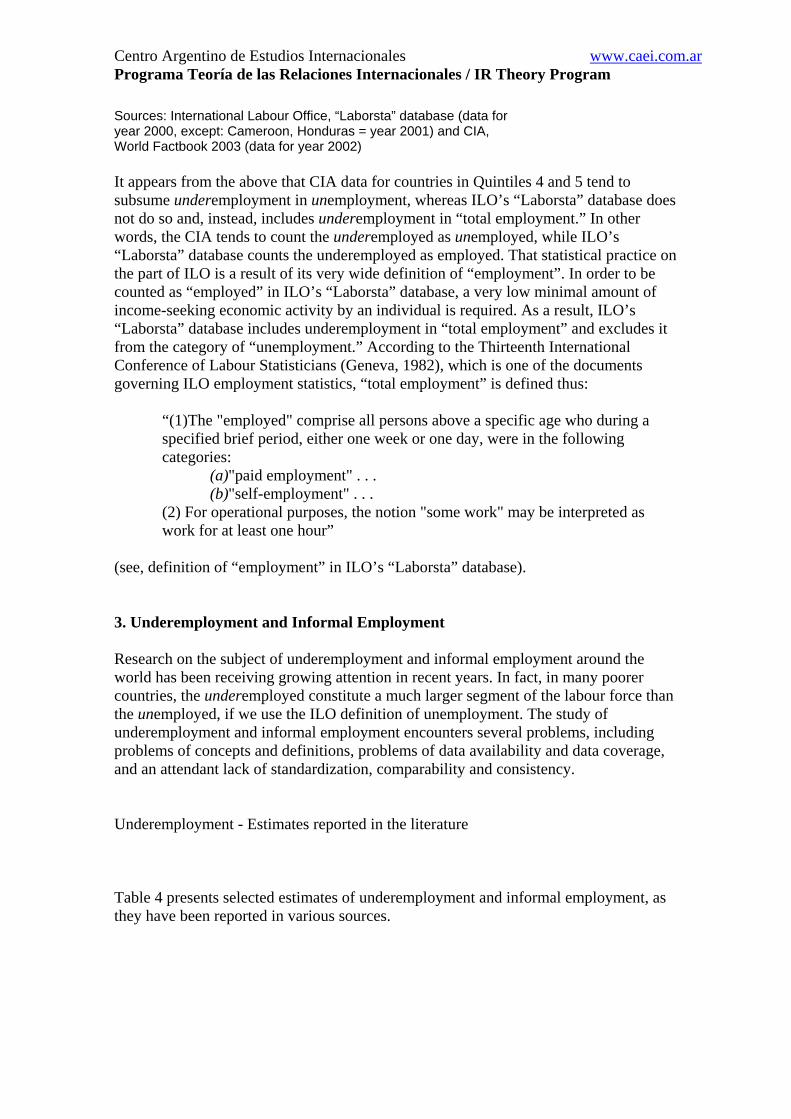
For details, see Appendix 2 Estimates of unemployment based on CIA data Estimates of unemployment based on CIA data (see, Graph 3) exhibit a pattern of global core-periphery stratification, in the sense, that the richest quintile (Q1) has the lowest average unemployment and all successive quintiles have increasingly higher average unemployment rates. Graph 3
Unemployment by World-Quintiles, CIA data
0 5 10 15 20 25 30
Q5
Q4
Q3
Q2
Q1
Qui
ntile
s
Unemployment rate, average percent
For details, see Appendix 3 Comparison ILO and CIA data on unemployment

Centro Argentino de Estudios Internacionales www.caei.com.ar Programa Teoría de las Relaciones Internacionales / IR Theory Program
A comparison of ILO and CIA data on unemployment is shown in Graph 4. A closer examination of the discrepancies suggests that the two sources treat underemployment differently. ILO includes underemployment in “total employment”, whereas CIA tends to include underemployment in “unemployment” (without being completely consistent in doing so). Graph 4
Comparison of ILO and CIA data on unemployment
0.0 5.0 10.0 15.0 20.0 25.0 30.0
Q5
Q4
Q3
Q2
Q1
Qui
ntile
s
Unemployment rate, average percent
Laborsta CIA
Comments on Graph 4: Quintiles 1, 2 and 3 -- The discrepancies between the two sources for Quintiles 1, 2 and 3 are relatively small and can, probably, be explained by differences between the two data sets with respect to the years for which the data are given. Quintiles 4 and 5 -- The discrepancies between the two sources for Quintiles 4 and 5 are substantial and require further comment. Discrepancies in Quintile 4 and 5 result, firstly, from the fact that there are many countries in these quintiles for which the CIA has estimates, while ILO’s “Laborsta” database has no estimates for the same countries. Those cases include many African countries, and the estimates of unemployment given by CIA for those countries tend to be very high. Here is the list of those cases (see, Table 2): Table 2 Quintiles 4 and 5 cases with CIA data but no ILO data Country Unemployment % Region For Quintile 4 Equatorial Guinea 30.0 Africa Ghana 20.0 Africa Kiribati 2.0 Oceania

Centro Argentino de Estudios Internacionales www.caei.com.ar Programa Teoría de las Relaciones Internacionales / IR Theory Program
Laos 5.7 Asia, South-EastLesotho 45.0 Africa Mauritania 21.0 Africa Sudan 18.7 Africa Zimbabwe 70.0 Africa For Quintile 5 Central African Republic 8.0 Africa Comoros 20.0 Africa Cote d'Ivoire 13.0 Africa Djibouti 50.0 Africa Kenya 40.0 Africa Mali 14.6 Africa Mozambique 21.0 Africa Myanmar 5.1 Asia, South-EastNepal 47.0 Asia, South Nigeria 28.0 Africa Senegal 48.0 Africa Tajikistan 40.0 Asia, Central Uzbekistan 10.0 Asia, Central Yemen 30.0 Middle East Zambia 50.0 Africa Average 27.7 Source: CIA World Factbook 2003 A second reason for discrepancies between the two sources is that, for numerous countries that are covered in both sources, the CIA gives significantly higher estimates of unemployment than does ILO’s “Laborsta” database. The greatest differences (difference greater than 10%) are shown in Table 3: Table 3 Cases in Quintile 4 for which CIA estimates are significantly higher than ILO estimates ILO CIA Discrepancy (a)Region
Bangladesh 3.3 40.0 36.7 Asia
Cameroon 7.5 30.0 22.5 Africa
Honduras 4.2 28.0 23.8 Latin America
Mongolia 4.6 20.0 15.4 Asia
Nicaragua 9.8 24.0 14.2 Latin America
Paraguay 7.6 18.2 10.6 Latin America
Vietnam 2.3 25.0 22.7 Asia
Average 5.6 26.5 20.8 Note (a) only discrepancies >10% are shown here
Centro Argentino de Estudios Internacionales www.caei.com.ar Programa Teoría de las Relaciones Internacionales / IR Theory Program
Sources: International Labour Office, “Laborsta” database (data for year 2000, except: Cameroon, Honduras = year 2001) and CIA, World Factbook 2003 (data for year 2002) It appears from the above that CIA data for countries in Quintiles 4 and 5 tend to subsume underemployment in unemployment, whereas ILO’s “Laborsta” database does not do so and, instead, includes underemployment in “total employment.” In other words, the CIA tends to count the underemployed as unemployed, while ILO’s “Laborsta” database counts the underemployed as employed. That statistical practice on the part of ILO is a result of its very wide definition of “employment”. In order to be counted as “employed” in ILO’s “Laborsta” database, a very low minimal amount of income-seeking economic activity by an individual is required. As a result, ILO’s “Laborsta” database includes underemployment in “total employment” and excludes it from the category of “unemployment.” According to the Thirteenth International Conference of Labour Statisticians (Geneva, 1982), which is one of the documents governing ILO employment statistics, “total employment” is defined thus:
“(1)The "employed" comprise all persons above a specific age who during a specified brief period, either one week or one day, were in the following categories:
(a)"paid employment" . . . (b)"self-employment" . . .
(2) For operational purposes, the notion "some work" may be interpreted as work for at least one hour”
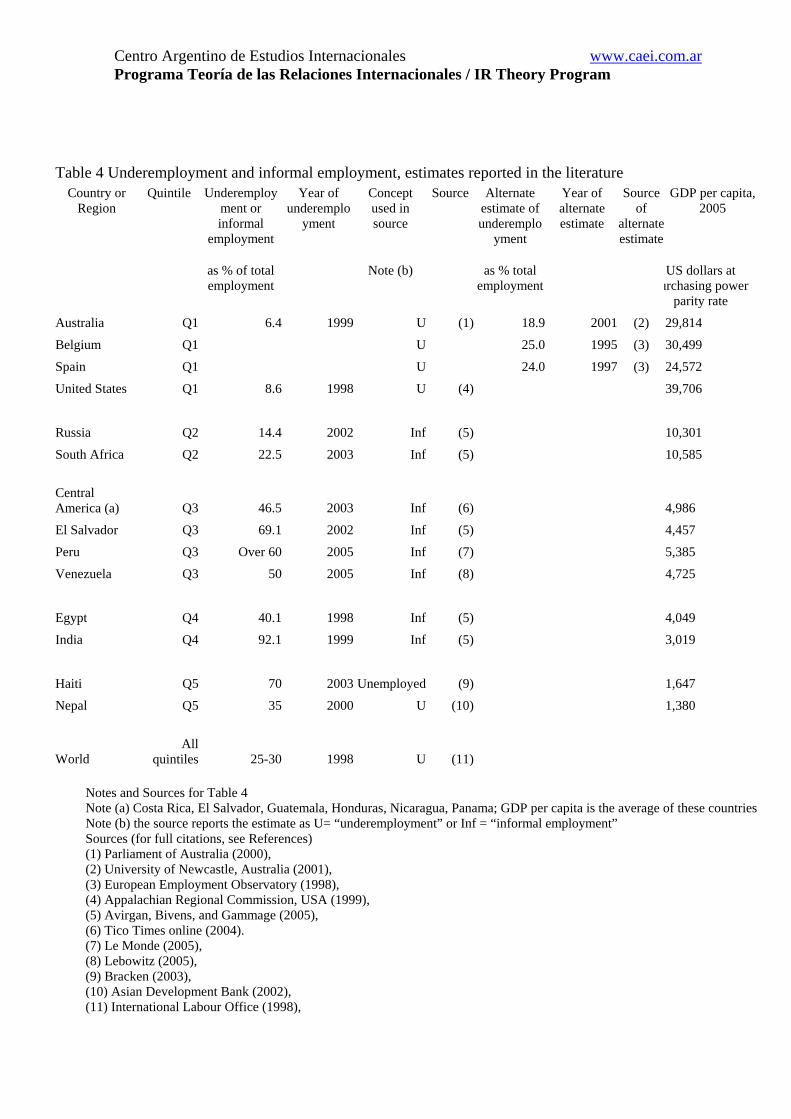
(see, definition of “employment” in ILO’s “Laborsta” database). 3. Underemployment and Informal Employment Research on the subject of underemployment and informal employment around the world has been receiving growing attention in recent years. In fact, in many poorer countries, the underemployed constitute a much larger segment of the labour force than the unemployed, if we use the ILO definition of unemployment. The study of underemployment and informal employment encounters several problems, including problems of concepts and definitions, problems of data availability and data coverage, and an attendant lack of standardization, comparability and consistency. Underemployment - Estimates reported in the literature Table 4 presents selected estimates of underemployment and informal employment, as they have been reported in various sources.
Centro Argentino de Estudios Internacionales www.caei.com.ar Programa Teoría de las Relaciones Internacionales / IR Theory Program
Table 4 Underemployment and informal employment, estimates reported in the literature Country or
Region Quintile Underemploy
ment or informal
employment
Year of underemplo
yment
Concept used in source
Source Alternate estimate of underemplo
yment
Year of alternate estimate
Source of
alternate estimate
GDP per capita,2005
as % of total employment
Note (b) as % total employment
US dollars at urchasing power
parity rate
Australia Q1 6.4 1999 U (1) 18.9 2001 (2) 29,814
Belgium Q1 U 25.0 1995 (3) 30,499
Spain Q1 U 24.0 1997 (3) 24,572
United States Q1 8.6 1998 U (4) 39,706
Russia Q2 14.4 2002 Inf (5) 10,301
South Africa Q2 22.5 2003 Inf (5) 10,585
Central America (a) Q3 46.5 2003 Inf (6)
4,986
El Salvador Q3 69.1 2002 Inf (5) 4,457
Peru Q3 Over 60 2005 Inf (7) 5,385
Venezuela Q3 50 2005 Inf (8) 4,725
Egypt Q4 40.1 1998 Inf (5) 4,049
India Q4 92.1 1999 Inf (5) 3,019
Haiti Q5 70 2003 Unemployed (9) 1,647
Nepal Q5 35 2000 U (10) 1,380
World All
quintiles 25-30 1998 U (11)
Notes and Sources for Table 4 Note (a) Costa Rica, El Salvador, Guatemala, Honduras, Nicaragua, Panama; GDP per capita is the average of these countries Note (b) the source reports the estimate as U= “underemployment” or Inf = “informal employment” Sources (for full citations, see References) (1) Parliament of Australia (2000), (2) University of Newcastle, Australia (2001), (3) European Employment Observatory (1998), (4) Appalachian Regional Commission, USA (1999), (5) Avirgan, Bivens, and Gammage (2005), (6) Tico Times online (2004). (7) Le Monde (2005), (8) Lebowitz (2005), (9) Bracken (2003), (10) Asian Development Bank (2002), (11) International Labour Office (1998),

Centro Argentino de Estudios Internacionales www.caei.com.ar Programa Teoría de las Relaciones Internacionales / IR Theory Program
Discussion of Table 4 National rates of underemployment and informal employment vary widely and have been reported as ranging from 6% to 92% of the labour force (see, Table 4). For example, “underemployment” in Australia has been reported as 6% in 1999, according to one source, and “informal employment” in India has been reported as 92% in 1999. The national rates of underemployment and informal employment tend to be significantly higher in the poorer Quintiles 3, 4 and 5 than in the richer Quintiles 1 and 2. Definitions. – The literature uses two broad concepts that are not necessarily identical, namely, (a) “underemployment” (variously defined), and (b) “informal employment” (variously defined). In Table 4, the column named “Concept used” indicates which of those two major concepts was used in the source. The ILO, which gives 25-30% as an estimate of world underemployment (see Table 4), describes “underemployment” as “either working substantially less than full-time but wanting to work longer, or earning less than a living wage.” As can be seen in Table 4, the literature tends to prefer the concept of “underemployment” when dealing with the developed economies of Quintile 1, while preferring the concept of “informal employment” when dealing with countries of Quintiles 2 to 5. Moreover, alternative definitions of “underemployment” can be found for the same countries of Quintile 1. For example, underemployment in Australia has been reported as either 6% or 18.9% for approximately the same years, based on alternative, narrow and wide, definitions of underemployment respectively. A wide definition of underemployment, similar to the wider Australian definition used in the alternate estimate in Table 4, can also be found in studies on some European Union countries. While the concepts of underemployment and informal employment and their various operational definitions differ, their implied intent is the same, namely, to describe that segment of the labour force that is neither fully unemployed nor fully and decently employed. Underemployment Estimates by Quintiles based on ILO data In Graph 5 I used an approximation method for estimating underemployment and informal employment by quintiles. I developed these estimates from ILO data. The estimates are not precise, are merely approximations, and ignore definitional differences between “underemployment” and “informal employment,” but they do exhibit a global pattern that is somewhat consistent with the findings from other sources that I summarized above in Table 4. Graph 5

Centro Argentino de Estudios Internacionales www.caei.com.ar Programa Teoría de las Relaciones Internacionales / IR Theory Program
Underemployment or informal employment, based on LABORSTA "employee" or "paid employment"
0.0 20.0 40.0 60.0 80.0 100.0
Q5
Q4
Q3
Q2
Q1
Qui
ntile
s
Average underemployment as percent of total employment
For details, see Appendix 4 Graph 5 shows average rates of underemployment or informal employment increasing from about 17% in Quintile 1 to about 81% in Quintile 5. (For limitations and known biases of Graph 5 estimates, see Appendix 4.) The degree of informal employment in a country tends to be correlated with the agricultural nature of the country. Graph 6 shows that the countries with the highest rate of regular employment tend to have the lowest proportion of agricultural employment and, vice versa, the countries with the lowest regular paid employment tend to be the ones with the highest rate of agricultural employment. (The correlation is r = 0.85.)
Graph 6 Relationship between regular employment and agricultural employment
0
20
40
60
80
100
120
0.0 20.0 40.0 60.0 80.0 100.0
agricultural employment as % of total employment
cate
gory
"em
ploy
ee"
as %
of
tota
l em
ploy
men
t
Source for Graph 6: International Labour Office, “Laborsta” database Notes for Graph 6: data are for 2003 or most recent year. N=95. Correlation r = -0.85
Centro Argentino de Estudios Internacionales www.caei.com.ar Programa Teoría de las Relaciones Internacionales / IR Theory Program
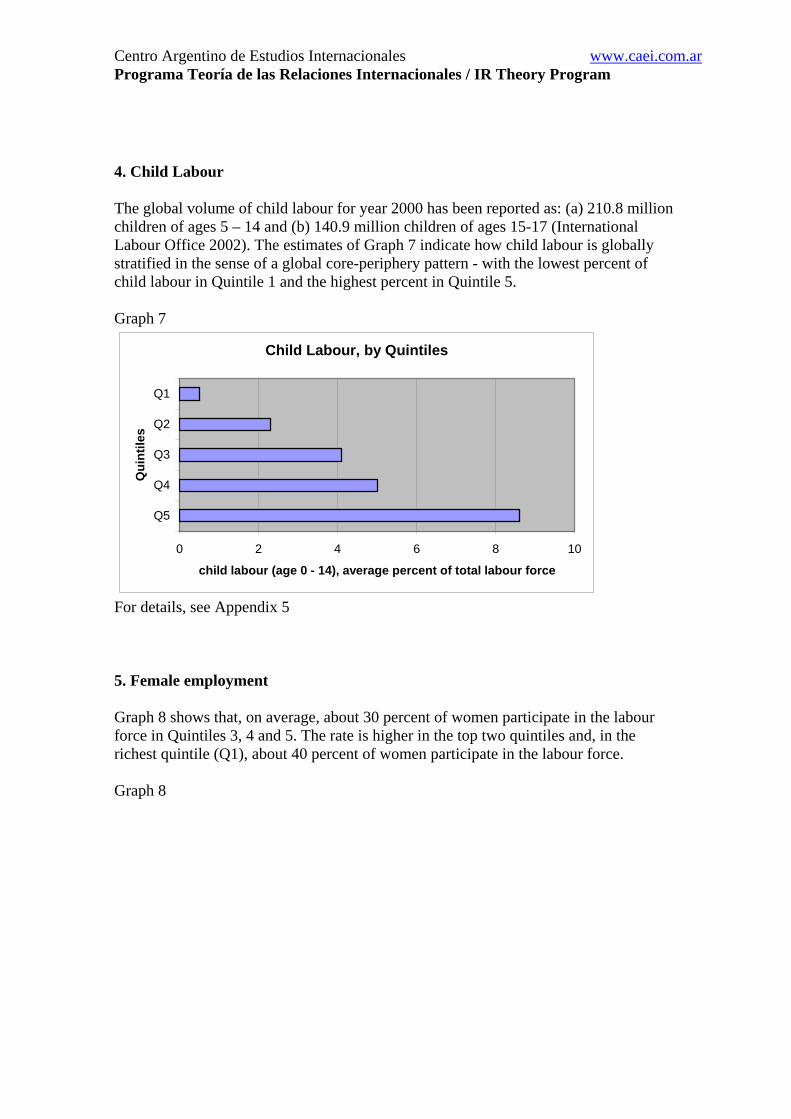
4. Child Labour The global volume of child labour for year 2000 has been reported as: (a) 210.8 million children of ages 5 – 14 and (b) 140.9 million children of ages 15-17 (International Labour Office 2002). The estimates of Graph 7 indicate how child labour is globally stratified in the sense of a global core-periphery pattern - with the lowest percent of child labour in Quintile 1 and the highest percent in Quintile 5. Graph 7
Child Labour, by Quintiles
0 2 4 6 8
Q5
Q4
Q3
Q2
Q1
Qui
ntile
s
child labour (age 0 - 14), average percent of total labour force
10
For details, see Appendix 5 5. Female employment Graph 8 shows that, on average, about 30 percent of women participate in the labour force in Quintiles 3, 4 and 5. The rate is higher in the top two quintiles and, in the richest quintile (Q1), about 40 percent of women participate in the labour force. Graph 8

Centro Argentino de Estudios Internacionales www.caei.com.ar Programa Teoría de las Relaciones Internacionales / IR Theory Program
Women's activity rate
0 10 20 30 40 5
Q5
Q4
Q3
Q2
Q1
Qui
ntile
s
Women's activity rate, average percent
0
For details, see Appendix 6 In Conclusion Statistical information does not tell us the personal stories of all the individuals that it refers to - in this case, underemployed or unemployed workers or academics, child workers, soldiers or prostitutes, and so on. The structural violence that exists in the world system is the result of various social structures, including the highly unequal global income distribution (e.g., Chaves 2003, 2004), the highly stratified global wage system (e.g., Köhler 2004a,b), the global stratification of employment opportunities (as documented in this article), and others. References Appalachian Regional Commission. USA (1999), Online Resource Center, “An Assessment of Labor Force Participation Rates and Underemployment in Appalachia - Executive Summary” Asian Development Bank (2002), Poverty Reduction in Nepal: Issues, Findings and Approaches. Online. ISBN: 971-561-443-4. Chapter 3 Avirgan, Tony, L. J. Bivens, and S. Gammage, eds (2005), Good Jobs, Bad Jobs, No Jobs: Labor Markets and Informal Work in Egypt, El Salvador, India, Russia, and South Africa. Global Policy Network/Economic Policy Institute, USA. Bracken, Amy (2003), “Government fails to improve low wages”. Report by Haitian Times staff, October 2003. Online at:http://www.haitisupport.gn.apc.org/Bracken.htm Chaves, Emilio J. (2003) “Toward a Center-Periphery Model of Global Accounting,” in: Köhler, Gernot, and E. J. Chaves (2003) (eds.), Globalization: Critical Perspectives.

Centro Argentino de Estudios Internacionales www.caei.com.ar Programa Teoría de las Relaciones Internacionales / IR Theory Program
New York: Nova Science. Chapter 13 Chaves, Emilio J. (2004) “Desigualdad, ingreso per capita y pobreza: de lo especifico multiple al sentido general de la cuestion.” TENDENCIAS. Revista de la Facultad de Ciencias Económicas y Administrativas U. de Nariño. ISSN 0124-8693. Vol. V, No.1-2. 2004. Pasto, Colombia. (pages 7-37) CIA (2003) (Central Intelligence Agency, USA), World Factbook 2003. Online European Employment Observatory (1998), “National Labour Market Policies – Belgium” (by Peter Simoens & Jan Denys) and “National Labour Market Policies – Spain” (by Luis Toharia). Online International Labour Office (1998), “World Employment Report 1998-99: Global financial crisis to hike world unemployment,” World of Work, No. 27, December 1998 International Labour Office (2002), "A Future Without Child Labour," May 2002. Online . International Labour Office (2005), LABORSTA (online database) International Monetary Fund (2005), “World Economic Outlook” database. Online Köhler, Gernot (2002), “European Unemployment as a World-System Problem”, in: Ryszard Stemplowski (ed.), The European Union in the World System Perspective. Warsaw: The Polish Institute of International Affairs, 2002, pp 121-132. Köhler, Gernot (2004a), The Global Wage System: A Study of International Wage Differences. New York: Nova Science. Köhler, Gernot. (2004b), "Una Crítica al Sistema Mundial de Salarios" TENDENCIAS. Revista de la Facultad de Ciencias Económicas y Administrativas U. de Nariño. ISSN 0124-8693. Vol. V, No.1-2. 2004. Pasto, Colombia. (pages 39-60) Köhler, Gernot (2005), “Arab Unemployment as a World-System Problem,” in: Peter Herrmann and A. Tausch (eds.), Dar Al Islam: the Mediterranean, the World System and the Wider Europe. New York: Nova Science, 2005. ISBN 1-59454-287-2. Ch. 8, pp. 179-190 Le Monde (2005), “Au Pérou, la majorité de la population survit aux marges de l'économie légale”, by Chrystelle Barbier, Le Monde 16.01.05 Lebowitz, Michael A. (2005), “Re: Venezuela,“ communication to internet forum pen-l, 27 Feb 2005 Parliament of Australia (2000), Department of the Parliamentary Library. “Underemployment and Overwork,” Research Note 27 1999-2000 (by Tony Kryger), 14 March 2000

Centro Argentino de Estudios Internacionales www.caei.com.ar Programa Teoría de las Relaciones Internacionales / IR Theory Program
Schaible, Wesley, and Ramya Mahadevan-Vijaya (2002), “World and regional estimates for selected key indicators of the labour market.” International Labour Office, Employment Paper 2002/36. Online Tico Times online (2004). “Region's Underemployment Deemed Problematic,” Daily News Brief . San José, Costa Rica, January 8, 2004 University of Newcastle, Australia (2001), Centre of Full Employment and Equity (CofFEE), “Underemployment at 18.9 per cent,” Media release, 8 June 2001 World Commission on the Social Dimension of Globalisation (2004), A Fair Globalization: Creating Opportunities for All. International Labour Office, Geneva, 2004. ISBN 92-2-115426-2 xxxxxxxxxxxxx APPENDIX xxxxxxxxxxxxx Appendix 1 Graph A-1 Unemployment by World Regions Appendix 2 Table A-2 Unemployment by quintiles, ILO data Appendix 3 Table A-3 Unemployment by quintiles, CIA data Appendix 4 Table A-4 Underemployment, approximation method Appendix 5 Table A-5 Child labour Appendix 6 Table A-6 Women’s total activity rate Appendix 7 Table A-7 List of countries xxxxxxxxxxxxxxx Appendix 1 Graph A-1
Unemployment by World Regions, 1997, ILO data
0.02.04.06.08.0
10.012.014.0
Asia andPacific
DevelopedEconomies
LatinAmerica
andCaribbean
TransitionEconomies
Middle Eastand North
Africa
Sub-Saharan
Africa
World
perc
ent
Source: Schaible and Mahadevan-Vijaya (2002), p. 20, Table 3

Centro Argentino de Estudios Internacionales www.caei.com.ar Programa Teoría de las Relaciones Internacionales / IR Theory Program
Data Notes for Graph A-1: (a) The source does not give an estimate for Sub-Saharan Africa due to data availability problems. (b) These are regionally aggregated estimates, rather than averages of country data. (c) The definition of unemployment is that used by ILO, i.e., it does not include underemployment xxxxxxxxxxxxxxx Appendix 2 Table A-2 Unemployment by Quintiles, based on ILO data, year 2000 (a) Quintiles Average
unemployment rate (%)
% available cases
Q1 6.0 100Q2 11.2 77Q3 14.2 57Q4 7.7 66Q5 6.0 11 Average 9.2 available N= 109 61Source: International Labour Office, “Laborsta” database, Table 3A Note (a) year is 2000, except: 9 cases = year 2001, 2 cases = year 2002, 1 case = year 2003 xxxxxxxxxxxxxxx Appendix 3 Table A-3 Unemployment by Quintiles, based on CIA data Quintiles Average
unemployment rate (%), year 2002
% available cases
Q1 6.4 97Q2 13.8 94Q3 16.9 97Q4 19.1 86Q5 25.5 49 Average 15.2Available N= 146 83Source: CIA World Factbook 2003 xxxxxxxxxxxxxxx

Centro Argentino de Estudios Internacionales www.caei.com.ar Programa Teoría de las Relaciones Internacionales / IR Theory Program
Appendix 4 Table A-4 Underemployment by quintiles, approximation method (note a) Quintiles Average
underemploymentrate (%) (note a),
% available cases
Years 2003 and earlier
Q1 16.5 89Q2 24.0 63Q3 45.6 44Q4 60.0 53Q5 81.4 14 Average 45.5 Available N= 93 52 Note (a): Method of estimation is: Underemployment = total employment less status category “employee” (for 83 cases) and, underemployment = total employment less “paid employment” (for 10 cases) Source: International Labour Office, “Laborsta” database Data notes The estimates of this table are based on data from the ILO’s LABORSTA online database. The database distinguishes between (a) any employment (or “total employment”), on the one hand, and (b) “paid employment” and (c) the status of “employee”, on the other hand. “Paid employment” is only a subset of total employment. And persons having the status of “employee” are also only a subset of all persons counted as “employed.” In the table, I estimated “underemployment or informal employment” as (a) 100% less the percent of “employees” or (b) 100% less the percent of “paid employment”. Two known problems of this method of estimating underemployment are: (1) persons counted as “employees” or as “paid employed” may only be partially employed, i.e., may actually be underemployed; (2) persons who are not counted as “employees” may be “employers”, i.e., may actually not be underemployed. However crude the estimation results of this method may be, they receive some validation by virtue of the fact that there is some consistency between these estimates and the estimates found in the literature, as summarized in Table 4 of the main text. A comparison of the average given in this table (namely, 45.5%, which is an average of quintiles) with the estimate of world underemployment given by ILO (namely, 25-30%, which is a global aggregate figure, see Table 4 in the text) suggests that my estimates by quintiles given in this Table A-4 may be too high by about 10 percent.
Centro Argentino de Estudios Internacionales www.caei.com.ar Programa Teoría de las Relaciones Internacionales / IR Theory Program
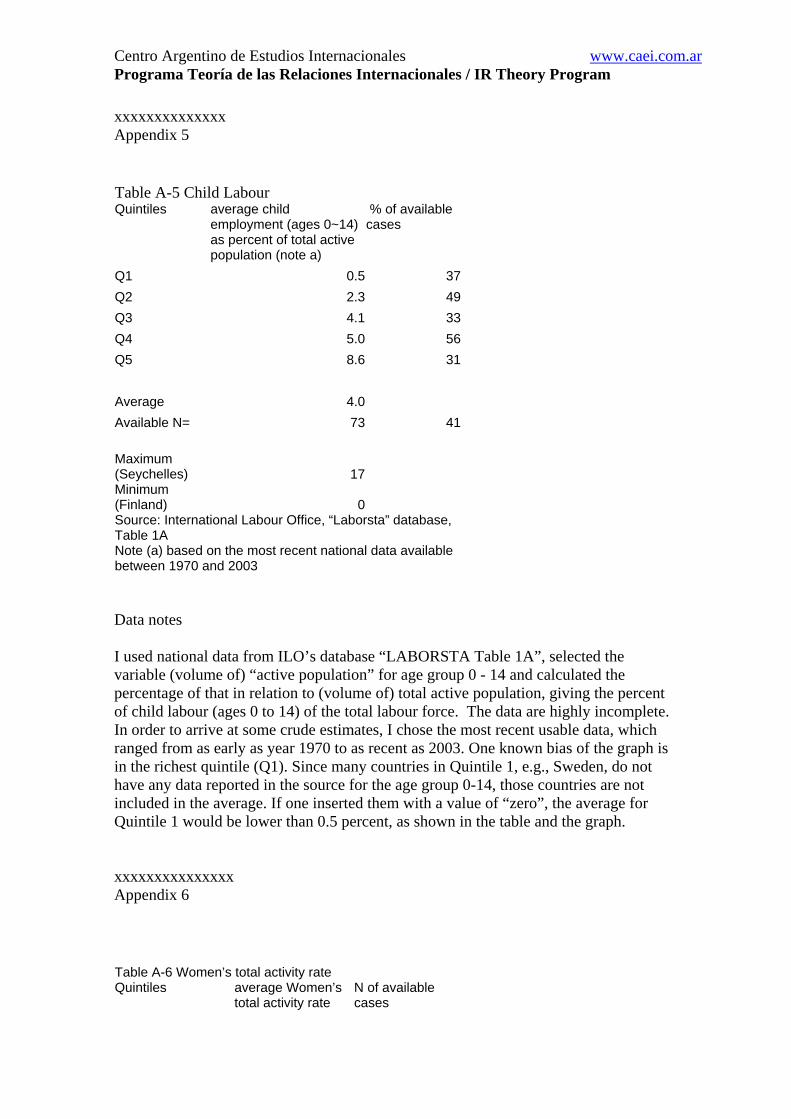
xxxxxxxxxxxxxx Appendix 5 Table A-5 Child Labour Quintiles average child
employment (ages 0~14) as percent of total active population (note a)
% of available cases
Q1 0.5 37Q2 2.3 49Q3 4.1 33Q4 5.0 56Q5 8.6 31 Average 4.0Available N= 73 41 Maximum (Seychelles) 17 Minimum (Finland) 0 Source: International Labour Office, “Laborsta” database, Table 1A Note (a) based on the most recent national data available between 1970 and 2003 Data notes I used national data from ILO’s database “LABORSTA Table 1A”, selected the variable (volume of) “active population” for age group 0 - 14 and calculated the percentage of that in relation to (volume of) total active population, giving the percent of child labour (ages 0 to 14) of the total labour force. The data are highly incomplete. In order to arrive at some crude estimates, I chose the most recent usable data, which ranged from as early as year 1970 to as recent as 2003. One known bias of the graph is in the richest quintile (Q1). Since many countries in Quintile 1, e.g., Sweden, do not have any data reported in the source for the age group 0-14, those countries are not included in the average. If one inserted them with a value of “zero”, the average for Quintile 1 would be lower than 0.5 percent, as shown in the table and the graph. xxxxxxxxxxxxxxx Appendix 6 Table A-6 Women’s total activity rate Quintiles average Women’s
total activity rate N of available cases

Centro Argentino de Estudios Internacionales www.caei.com.ar Programa Teoría de las Relaciones Internacionales / IR Theory Program
(%) (note a)
Q1 40.6 27Q2 34.6 25Q3 30.2 20Q4 30.1 22Q5 30.2 28Available N= 122Note (a) data are from the years 1993-2003 in quintiles 1,2,3,and 4. Quintile 5 includes also data preceding 1993 Source: International Labour Office, “Laborsta” database Data notes The data used in Table A-6 are from ILO, Laborsta. I selected the most recent figures available from the period 1993 to 2003. However, in the poorest quintile (Q5) the number of usable cases was so low for the period 1993-2003 that I added older data (the earliest from 1974). xxxxxxxxxxxxxx Appendix 7 Table A-7 List of countries used for determining the quintiles Source: International Monetary Fund, “World Economic Outlook” database, 2005 Country Gross domestic
product per capita, 2005
US dollars at purchasing power parity (PPP) rates
Quintiles (a)
Luxembourg 64,889 Q1
Norway 40,784 Q1
United States 39,706 Q1
Ireland 38,232 Q1
Qatar 33,842 Q1
Denmark 33,252 Q1
Canada 33,022 Q1
Iceland 32,837 Q1
Austria 32,060 Q1
Belgium 30,499 Q1
Switzerland 30,366 Q1
Australia 29,814 Q1
Netherlands 29,663 Q1
Sweden 29,544 Q1

Centro Argentino de Estudios Internacionales www.caei.com.ar Programa Teoría de las Relaciones Internacionales / IR Theory Program
Hong Kong SAR 29,239 Q1
Germany 29,204 Q1
Japan 29,168 Q1
Finland 29,095 Q1
United Kingdom 28,877 Q1
Italy 28,666 Q1
France 28,175 Q1
Taiwan Province of China 25,982
Q1
Singapore 25,384 Q1
Spain 24,572 Q1
Netherlands Antilles 22,837 Q1
New Zealand 22,488 Q1
United Arab Emirates 22,466 Q1
Slovenia 21,587 Q1
Israel 21,575 Q1
Malta 21,203 Q1
Cyprus 20,707 Q1
Greece 20,518 Q1
Portugal 19,340 Q1
Korea 19,324 Q1
Bahamas, The 18,435 Q1
Bahrain 17,668 Q2Czech Republic 17,148 Q2Oman 16,754 Q2Barbados 16,632 Q2Hungary 16,338 Q2Brunei Darussalam 15,171 Q2Slovak Republic 14,877 Q2Kuwait 14,552 Q2Estonia 14,284 Q2Lithuania 12,837 Q2Uruguay 12,733 Q2Mauritius 12,583 Q2Trinidad and Tobago 12,297 Q2Poland 12,264 Q2Antigua and Barbuda 12,116 Q2Argentina 11,982 Q2St. Kitts and Nevis 11,941 Q2Saudi Arabia 11,888 Q2Croatia 11,792 Q2Seychelles 11,784 Q2

Centro Argentino de Estudios Internacionales www.caei.com.ar Programa Teoría de las Relaciones Internacionales / IR Theory Program
Latvia 11,197 Q2Chile 11,017 Q2South Africa 10,585 Q2Malaysia 10,449 Q2Botswana 10,399 Q2Russia 10,301 Q2Mexico 9,726 Q2Libya 9,624 Q2Costa Rica 9,427 Q2Brazil 8,594 Q2Bulgaria 8,494 Q2Grenada 8,293 Q2Tunisia 7,963 Q2Romania 7,957 Q2Kazakhstan 7,859 Q2Thailand 7,851 Q3Iran, Islamic Republic of 7,631
Q3
Turkey 7,561 Q3Macedonia, Former Yugoslav Republic of 7,438
Q3
Colombia 7,242 Q3Belarus 7,202 Q3Bosnia and Herzegovina 7,019
Q3
Maldives 7,008 Q3Tonga 6,892 Q3Panama 6,763 Q3Algeria 6,721 Q3Belize 6,665 Q3Namibia 6,625 Q3St. Vincent and the Grenadines 6,585
Q3
Dominican Republic 6,503 Q3Gabon 6,402 Q3Turkmenistan 6,149 Q3Samoa 6,119 Q3Ukraine 6,045 Q3Dominica 5,931 Q3Fiji 5,927 Q3Suriname 5,871 Q3China 5,791 Q3
Centro Argentino de Estudios Internacionales www.caei.com.ar Programa Teoría de las Relaciones Internacionales / IR Theory Program
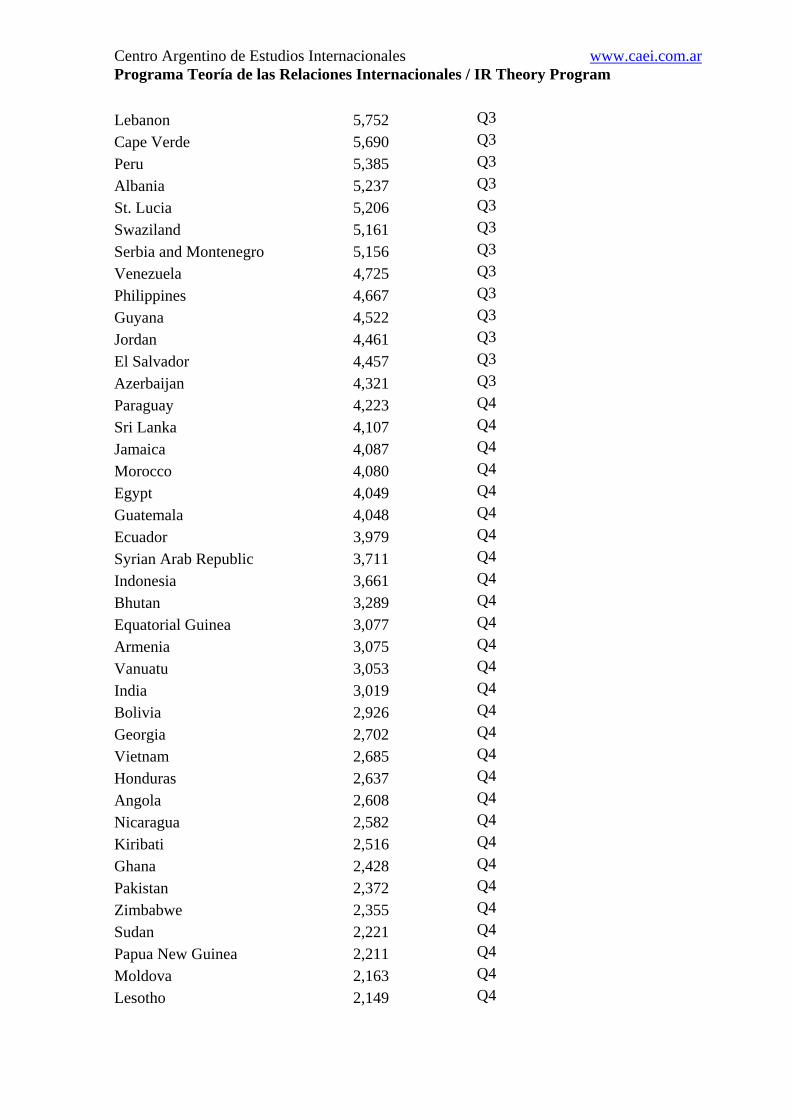
Lebanon 5,752 Q3Cape Verde 5,690 Q3Peru 5,385 Q3Albania 5,237 Q3St. Lucia 5,206 Q3Swaziland 5,161 Q3Serbia and Montenegro 5,156 Q3Venezuela 4,725 Q3Philippines 4,667 Q3Guyana 4,522 Q3Jordan 4,461 Q3El Salvador 4,457 Q3Azerbaijan 4,321 Q3Paraguay 4,223 Q4Sri Lanka 4,107 Q4Jamaica 4,087 Q4Morocco 4,080 Q4Egypt 4,049 Q4Guatemala 4,048 Q4Ecuador 3,979 Q4Syrian Arab Republic 3,711 Q4Indonesia 3,661 Q4Bhutan 3,289 Q4Equatorial Guinea 3,077 Q4Armenia 3,075 Q4Vanuatu 3,053 Q4India 3,019 Q4Bolivia 2,926 Q4Georgia 2,702 Q4Vietnam 2,685 Q4Honduras 2,637 Q4Angola 2,608 Q4Nicaragua 2,582 Q4Kiribati 2,516 Q4Ghana 2,428 Q4Pakistan 2,372 Q4Zimbabwe 2,355 Q4Sudan 2,221 Q4Papua New Guinea 2,211 Q4Moldova 2,163 Q4Lesotho 2,149 Q4
Centro Argentino de Estudios Internacionales www.caei.com.ar Programa Teoría de las Relaciones Internacionales / IR Theory Program
Mauritania 2,042 Q4Guinea 2,024 Q4Lao People's Democratic Republic 1,972
Q4
Mongolia 1,948 Q4Bangladesh 1,943 Q4Gambia, The 1,919 Q4Kyrgyz Republic 1,905 Q4Cameroon 1,889 Q4Chad 1,849 Q5Djibouti 1,817 Q5Cambodia 1,775 Q5Senegal 1,761 Q5Uzbekistan 1,734 Q5Comoros 1,704 Q5Haiti 1,647 Q5Solomon Islands 1,574 Q5São Tomé and Príncipe 1,534 Q5Uganda 1,509 Q5Myanmar 1,466 Q5Côte d'Ivoire 1,459 Q5Togo 1,433 Q5Nepal 1,380 Q5Mozambique 1,365 Q5Rwanda 1,274 Q5Central African Republic 1,255
Q5
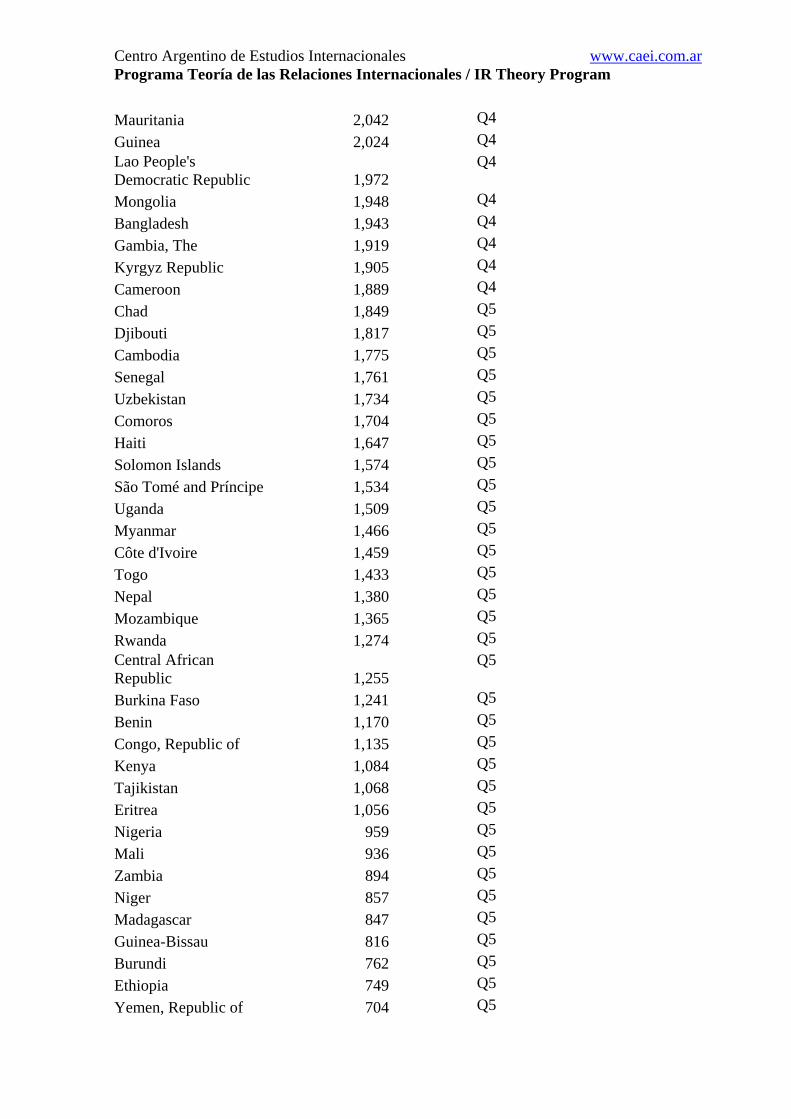
Burkina Faso 1,241 Q5Benin 1,170 Q5Congo, Republic of 1,135 Q5Kenya 1,084 Q5Tajikistan 1,068 Q5Eritrea 1,056 Q5Nigeria 959 Q5Mali 936 Q5Zambia 894 Q5Niger 857 Q5Madagascar 847 Q5Guinea-Bissau 816 Q5Burundi 762 Q5Ethiopia 749 Q5Yemen, Republic of 704 Q5

Centro Argentino de Estudios Internacionales www.caei.com.ar Programa Teoría de las Relaciones Internacionales / IR Theory Program
Malawi 676 Q5Tanzania 672 Q5Congo, Democratic Republic of 639
Q5
Sierra Leone 628 Q5 Average 10,060Median 5,988total N= 178 Note (a) There are two quintiles with 35 cases and 3 quintiles with 36 cases (total N=178) Note (b) source data for Equatorial Guinea contained an error, which I corrected End xxxxxxxxxxxxxxxxxx