the global urban competitiveness report 2017 … · (national academy of economic strategy) the...
TRANSCRIPT

House Prices, Changing the City World
Ni Pengfei, Marco Kamiya, Wang Haibo et al.
The Global Urban Competitiveness Report 2017-2018(Short version)
Chinese Academy of Social Sciences (National Academy of Economic Strategy)
The United Nations Human Settlements Programme

UN-HABITAT, CASS, Center for City and Competitiveness
1
Senior consultant
Wang Weiguang (President, CASS)
Joan Clos (Under Secretary-General of
the UN and Executive Director of UN-HABITAT)
Gao Peiyong (Director of Institute of Economic, CASS)
He Dexu (Director of National Academy of Economic Strategy,CASS)
Fan Gang (Vice President of China Society of Economic Reform)
Saskia Sassen (Professor of Columbia University, USA)
Peter Taylor (Academician of UK Royal Academy of Social Science, Director of
Globalization and World Cities Research Network)
The main authors and editor-in-chief
Ni Pengfei (Professor and director of the
Center for City and Competitiveness, CASS;
Chief Urban Economist of the CASS-UN-Habitat Joint Research Group)
Marco Kamiya (Coordinator of Urban Economy
and Finance Branch, UN-HABITAT;
Chief Urban Economist of the CASS-UN-Habitat Joint Research Group)
Wang Haibo (National Academy of Economic Strategy, CASS)
Members of the editorial board(not listed in order)
Ni Pengfei Marco Kamiya Peter Karl Kresl Han Sun Sheng
Dai Erbiao Lin Zujia Xiao Geng Douglas Zeng Zhihua Yang Rong Warren
Wenzhi LU Paloma Taltavull de La Paz Desen Lin Oswaldo Molina Cynthia
Goythia Kathy Pain Zhang Zhenshan Qin Jian Wang Haibo
Guo Hongyu Li Bo Wang Yufei Gong Weijin Wei Jie
Cao Qingfeng Zhou Xiaobo Shen Li Liu Xiaonan
Zhang Yangzi Xu Haidong
1

Global Urban Competitiveness Report 2017-2018
2
Prologue 1
Today’s world is undergoing fundamental changes. On one hand, globalization is
reaching a new level despite some ups and downs, emerging economies represented by
China are growing rapidly and the global landscape has experienced and will continue
to see more changes to come. On the other, technology innovation is striving to come
up with breakthroughs; it has changed and will continue to reshape the forms and
landscape of global economy. In the 21st century, cities have become the mainstream
carrier and platform for human activities. Globalization, technology innovation and
changes into the global economic landscape will determine the future of global
cities and urban system. Therefore, studying the development environment, living
environment, competitiveness and sustainable development of global cities and urban
system, and accordingly proposing innovative theories and countermeasures, will
mean a lot for improving the business environment and living environment in cities,
promoting urban prosperity, reducing urban poverty, and increasing the benefits of
urban residents on a global scale.
Residential property has multiple attributes. It is an indispensable condition for human
survival and development, immobile and valuable. It is also an important investment
and economic sector. Its influence is felt by households at the micro level and the
economy and society at the macro level at the same time. For this reason, the housing
issue is one of the most important and challenging issues in the universe of cities.
Worldwide, nearly one billion urban residents are crowded in slums, and billions
more are overwhelmed by the sky-high housing price. A great concern shared by
urban residents across the world, the housing price exerts impact on the global urban
landscape and its changes. Governments, international organizations and numerous
scholars and experts have long been dedicated to the studies of the housing issue.
Despite some progress, deeper theoretical research, comprehensive policy evaluation,
extensive experience summarization and constant innovation and exploration are still
needed to obtain a fundamental solution. International collaborative theoretical, policy
and experience research among scholars in related fields is a particularly important part
of the efforts.
Chinese Academy of Social Sciences (CASS) is China’s top research institute dedicated
to philosophy and social sciences and one of the world’s most influential think tanks.
Our mission is to promote the studies of philosophy and social sciences in China, offer
policy consultation on matters of national interests, and help advance international
academic development in philosophy and social sciences and address global issues. We
are proud to have a highly capable research team for urban and housing issues, who
have produced significant research findings through partnership with other prestigious
research teams and international organizations over the years.
The UN-Habitat is the world’s most important international organization in the field

UN-HABITAT, CASS, Center for City and Competitiveness
3
of human settlement and urban development. It has been long committed to academic
studies and the delivery of assistance in urban development and the improvement of the
living environment, and produced remarkable achievements.
For this research project, the CASS National Academy of Economic Strategy and the
UN-Habitat recruited noted scholars and experts in related fields from worldwide to
form the research team. After long-term research, they have come to many original
conclusions and findings regarding global urban competitiveness and cities’ business
environment, living environment, and sustainable development. These findings will
serve as valuable reference for us to develop a new understanding of the changing urban
world, formulating new policies in favor of urban development, and promoting global
urban prosperity. In particular, in the 2017-2018 project year, the research team focused
on the housing price, examined the pattern and causes of changes in global housing
prices and their influence on the urban world, drew many valuable conclusions,
summarized experience in how the urban housing price has reshaped the urban world.
Their efforts will be helpful for easing and solving the housing issue amid the process
of urban development.
We will continue to support this collaborative research project as always, and hope that
it will continue to build up its international influence and contribute to making cities
better.
Wang Weiguang
CASS President
October 24, 2017

Global Urban Competitiveness Report 2017-2018
4
Prologue 2
I am pleased to present to you this publication entitled Global Urban Competitiveness
Report 2017-2018 with Special Topic on Real Estate and Competitiveness. This is the
second publication jointly produced by the Chinese Academy of Social Sciences and UN-
Habitat on global urban competitiveness. In early 2017, these two institutions jointly
published the Global Urban Competitiveness Report 2016-2017.
In October 2016, world leaders adopted the New Urban Agenda, the outcome document
of Habitat III. This New Urban Agenda clearly recognizes that urbanization is a
strategic issue for both local and national governments and that it can be a source of
development and employment. The implementation of this Agenda will contribute to the
implementation and localization of the 2030 Agenda for Sustainable Development, and
to the achievement of the Sustainable Development Goals, including Goal 11: making
cities and human settlements inclusive, safe, resilient, and sustainable.
Urban competitiveness and economic and social development are closely related.
Cities with better infrastructure generate higher urban productivity. Higher urban
productivity in turn brings about higher incomes for all segments of society: individual
citizens, government and the private sector. More competitive cities also attract skills
and capital, thus creating a virtuous cycle of prosperity for all. In this regard, the real
estate and land markets have a strong influence on city competitiveness; they determine
residential and commercial prices, affect the mobility of people and goods, and draw in
high-level, skilled labourers.
In general, demographics, interest rates, government policies such as subsidies, and
the overall economy influence the real estate market. Overall economic health implies
urban economic competitiveness or lack of it. Highly competitive economies are
reflected in higher real estate prices, and vice versa.
This report examines the urban space and land situation in some selected cities
in the world. It also examines the relationship between real estate prices and the
transformational upgrading of selected world’s cities. More than 11 cities have been
covered and competitiveness indexes compiled for 1038 cities worldwide.
The Global Urban Competitiveness Report 2017-2018 captures these complex issues,
and it is an authoritative study that presents the main topics developed by senior
Chinese researchers with UN-Habitat experts. I welcome this joint effort, as the
world’s cities continue their work in implementing the New Urban Agenda.
Dr. Joan Clos,
Under-Secretary-General, United Nations
Executive Director, UN-Habitat
October 24, 2017

UN-HABITAT, CASS, Center for City and Competitiveness
5
Table of contents
Chapter1
Annual Ranking of General Global Urban Competitiveness in 2017
Chapter 2
General Report
Chapter 3
House Price and Competitiveness:
Questions and Literature Review(slightly)
Chapter 4
House Price and Competitiveness: Theoretical Model(slightly)
Chapter 5
Global Urban Real Estate Market Status 1
Chapter 6
Relationship between the Housing Price and Competitiveness:
Empirical analysis
Chapter 7
City story: House Prices and Competitiveness
Chapter 8
Economic Foundations for Sustainable Urbanization:
The link with Competitiveness 2
Chapter 9
Global Urban Economic Competitiveness 2017-2018
Chapter 10
Global urban Sustainable Competitiveness Report 2017-2018
Appendix 1
Appendix 2
Postscript
6
8
21
21
22
32
38
42
43
52
61
63
67

Global Urban Competitiveness Report 2017-2018
6
Chapter1 Annual ranking of
general global urban competitiveness in 2017

UN-HABITAT, CASS, Center for City and Competitiveness
7
Metropolitan areaMetropolitan
area evelCountry/Area
Economic Competitiveness
IndexRank
Sustainable Competitiveness
IndexRank
New York A+ United States 1.0000 1 1.0000 1
Los Angeles A United States 0.9992 2 0.6519 16
Singapore A Singapore 0.9708 3 0.7082 5
London A+ United Kingdom 0.9578 4 0.8756 2
San Francisco A United States 0.9408 5 0.6554 14
Shenzhen B China 0.9337 6 0.5761 35
Tokyo A- Japan 0.9205 7 0.7371 3
San Jose A United States 0.9158 8 0.6342 22
Munich B+ Germany 0.9053 9 0.6402 18
Dallas A- United States 0.9026 10 0.5805 32
Houston A- United States 0.9000 11 0.6792 8
Hong Kong A China 0.8873 12 0.6581 13
Seoul A- Korea, South 0.8478 13 0.7023 7
Shanghai A- China 0.8367 14 0.6110 27
Guangzhou B+ China 0.8346 15 0.5746 36
Miami B+ United States 0.8162 16 0.5305 53
Chicago A- United States 0.8151 17 0.6711 10
Boston A- United States 0.8121 18 0.7166 4
Dublin A- Ireland 0.8109 19 0.5796 33
Beijing A- China 0.8102 20 0.6708 11
Paris A- France 0.8060 21 0.6771 9
Frankfurt A- Germany 0.7993 22 0.6305 23
Tianjin B- China 0.7866 23 0.4735 93
Stockholm B+ Sweden 0.7862 24 0.6373 21
Philadelphia B+ United States 0.7837 25 0.6232 24
Seattle B+ United States 0.7808 26 0.6530 15
Kinki B- Japan 0.7699 27 0.5826 31
Suzhou C+ China 0.7648 28 0.4227 160
Stamford B United States 0.7644 29 0.4751 90
Tel Aviv-Yafo B- Israel 0.7642 30 0.4018 189
Table 1 Annual ranking of general global urban competitiveness in 2017

Global Urban Competitiveness Report 2017-2018
8
Chapter 2 General Report
UN-HABITAT, CASS, Center for City and Competitiveness
9
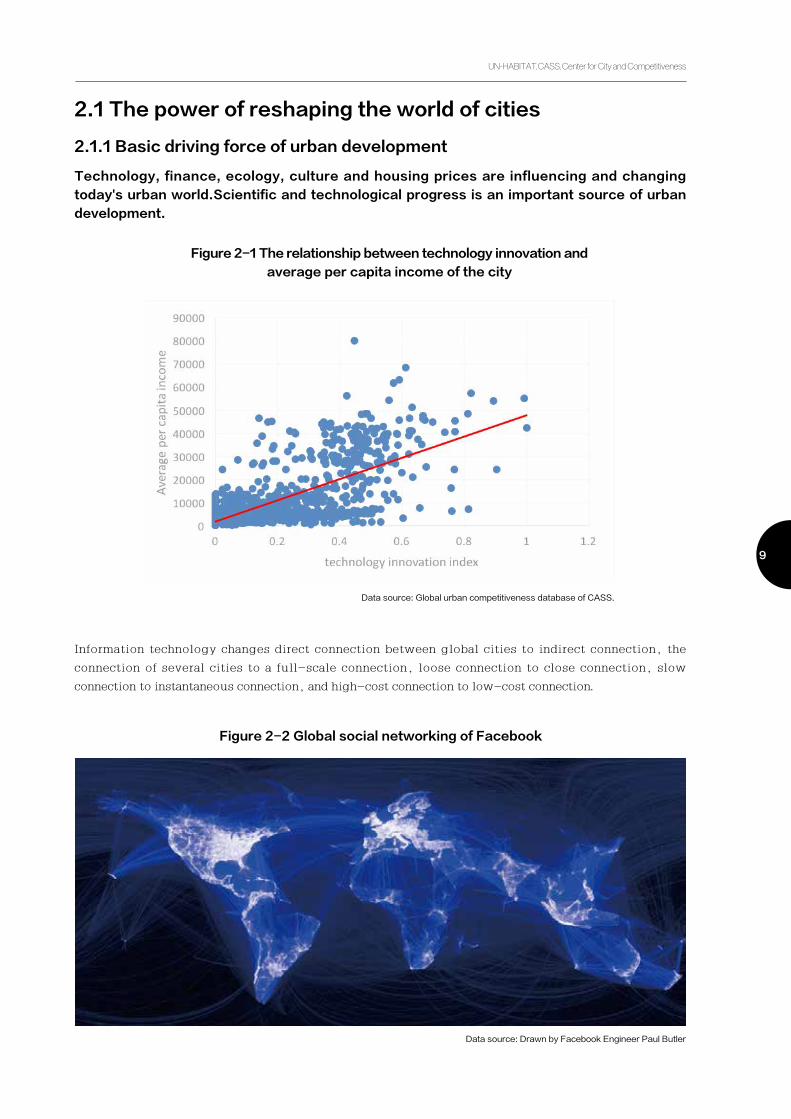
Technology, finance, ecology, culture and housing prices are influencing and changing
today's urban world.Scientific and technological progress is an important source of urban
development.
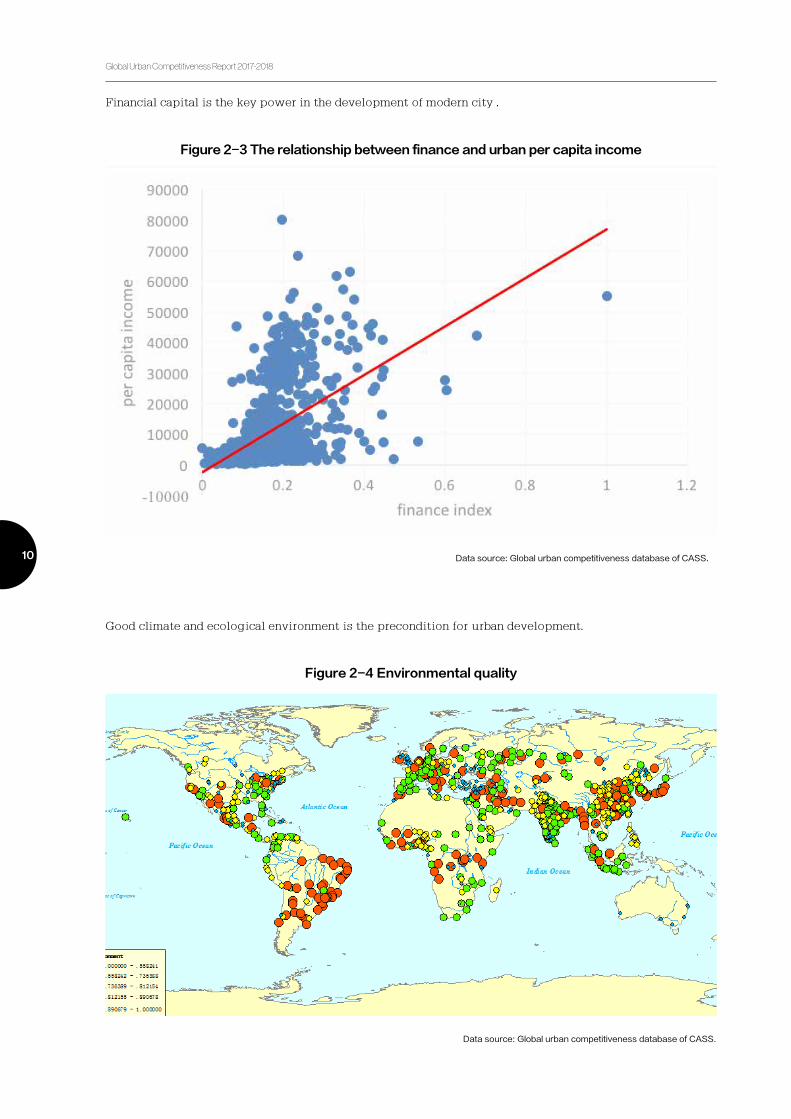
Information technology changes direct connection between global cities to indirect connection, the
connection of several cities to a full-scale connection, loose connection to close connection, slow
connection to instantaneous connection, and high-cost connection to low-cost connection.
2.1 The power of reshaping the world of cities
2.1.1 Basic driving force of urban development
Data source: Global urban competitiveness database of CASS.
Figure 2-1 The relationship between technology innovation and
average per capita income of the city
Figure 2-2 Global social networking of Facebook
Data source: Drawn by Facebook Engineer Paul Butler
Global Urban Competitiveness Report 2017-2018
10
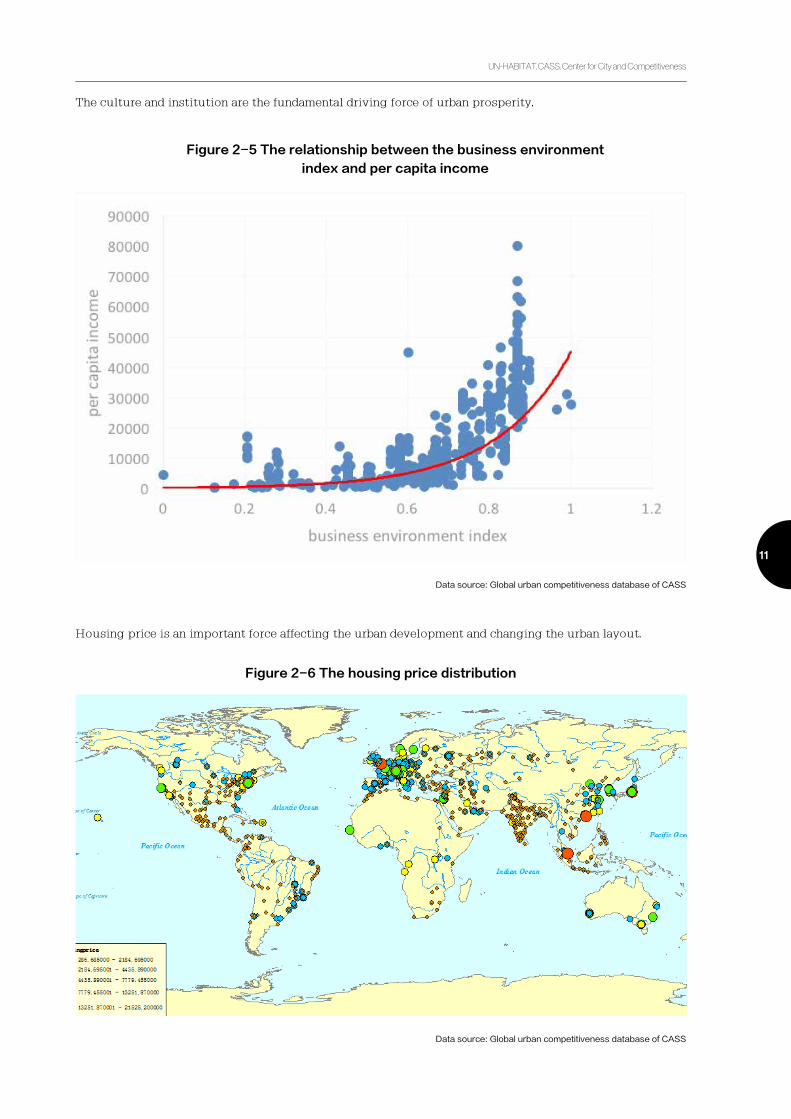
Financial capital is the key power in the development of modern city .
Good climate and ecological environment is the precondition for urban development.
Data source: Global urban competitiveness database of CASS.
Figure 2-3 The relationship between finance and urban per capita income
Data source: Global urban competitiveness database of CASS.
Figure 2-4 Environmental quality
UN-HABITAT, CASS, Center for City and Competitiveness
11
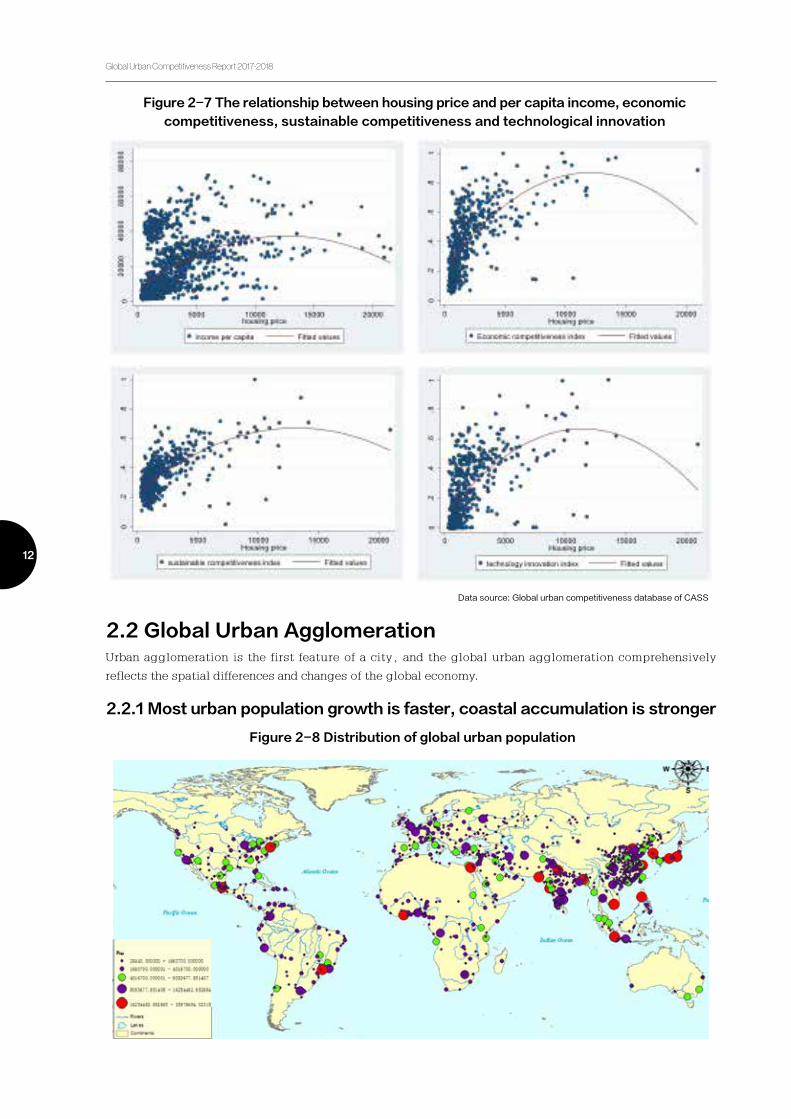
The culture and institution are the fundamental driving force of urban prosperity.
Housing price is an important force affecting the urban development and changing the urban layout.
Data source: Global urban competitiveness database of CASS
Figure 2-5 The relationship between the business environment
index and per capita income
Data source: Global urban competitiveness database of CASS
Figure 2-6 The housing price distribution
Global Urban Competitiveness Report 2017-2018
12
Data source: Global urban competitiveness database of CASS
Figure 2-7 The relationship between housing price and per capita income, economic
competitiveness, sustainable competitiveness and technological innovation
Figure 2-8 Distribution of global urban population
2.2 Global Urban Agglomeration
2.2.1 Most urban population growth is faster, coastal accumulation is stronger
Urban agglomeration is the first feature of a city, and the global urban agglomeration comprehensively
reflects the spatial differences and changes of the global economy.

UN-HABITAT, CASS, Center for City and Competitiveness
13
Figure 2-9 Scatter diagram for global urban tiers and population size and growth
Figure-2-10 City GDP density distribution across the world
2.2.2 Agglomeration of global economy: double-crescent distribution and three- longitude distribution
First, Population aggregation of global tiered cities: high-tier cities continue to grow, and low-tier cities
polarize.
Second, New urban population aggregation is Europe small, America slow, China big and India faster .
Third, sustained siphon effect of city clusters.

Global Urban Competitiveness Report 2017-2018
14
Figure-2-11 Distribution of Global urban GDP Growth
Figure2-12 Distribution of Three- longitude

UN-HABITAT, CASS, Center for City and Competitiveness
15
Figure2-13 Scatter diagram of economic density and growth of global cities
Figure2-14 The world urban agglomeration
2.2.3 economy of high and low-ranked cities growing in relay
2.2.4 City agglomeration in major countries globally
2.2.5 high in the west and low in the east in density, large in the west and small in the east in size, Growth of global urban agglomerations: diffusion and polarization co-existing
Western European cities advancing together to lead the entire Europe, America cities as technological and
financial centers showing high economic density and high growth, Chinese economic center expanding
from the east to the middle, Indian cities is economic growth expanding from western coastal area to the
inland and the east.

Global Urban Competitiveness Report 2017-2018
16
2.3 New connectivity of global cities :soft connectivity are gradually changing and dominating the global urban system
2.3.1 Hard connectivity:Distribution balance, with a small gap between cities
2.3.2 Soft connectivity of global cities :IT-driven cities,supercities dominate internal and external urban connectivity
Figure 2-15 kernel density distribution of Global hard connectivity
Figure 2-16 Global regional connectivity
Europe is the hub of soft connectivity,Africa is at the bottom and far below the global average level(see
Figure 2-11)
Source: collected, sorted and calculated by the author based on big data

UN-HABITAT, CASS, Center for City and Competitiveness
17
Figure2-17 Global inter-city connectivity
Figure 2-18 The connectivity network structure of the world’s top 30 primate
IT-driven cities and mega-cities (A + / A / A-) dominate global urban connectivity, with the same level
and the same function Cities are more closely and broadly linked (see Figure 2-17 - Figure2-18).
A multi-center landscape is taking shape(see Figure 2-18) .

Global Urban Competitiveness Report 2017-2018
18
2.3.3 Soft links relative to the hard link more extensive, more uneven, more obvious differentiation (see Figure 2-19)
2.4.1 The global city system is a function system
2.4.2 The global city function system is a chain-network system
2.4 New Global City
Figure 2-19 kernel density distribution of Global hard connectivity and soft connectivity
Due to the existence of national boundaries, labor forces are unable to move freely as industries and capital
do; therefore, the true sense of global city system is not the size system but the function system.
Due to the heterogeneity of global factors distribution, the vertical industrial specialization and horizontal
industrial specialization are interwoven within the global production network. Therefore, global city
function system is a chain-network system and a combination of hierarchical system and network system.

UN-HABITAT, CASS, Center for City and Competitiveness
19
2.4.3 New global cities are taking shape
Table 2-1 World's top 10 companies for market value in 2007 and 2017
Table 2-2 World's top 10 most valuable brands in 2007 and 2017
The new global cities are new mainly in the sense of organic superposition of the technological center
function and the financial center function. The combination of technology and finance will further improve
the global city function system, and enable it to play a better role in global economy.
Technology and finance are dominating global economy and occupying the main part of global value chain.
Information technology is showing more and more influence in the global economy.
Ranking Top 10 in 2007 Ranking Top 10 in 2017
1 ExxonMobil 1 Apple
2 General Electric 2 Alphaet
3 Microsoft 3 Microsoft
4 Citigroup 4 Amazon.com
5 Gazprom 5 Berkshire Hathaway
6 PetroChina 6 Facebook
7 ICBC 7 ExxonMobil
8 Bank of America 8 Johnson & Johnson
9 AT&T 9 JPMorgan Chase
10 BP 10 Tencent
Ranking Top 10 in 2007Brand value
($1M)Ranking Top 10 in 2017 Brand value ($1M)
1 Coca-Cola 43146 1 Google 109470
2 Microsoft 37074 2 Apple 107141
3 Citi 35148 3 Amazon.com 106396
4 Walmart 34898 4 AT&T 87016
5 IBM 34074 5 Microsoft 76265
6 HSBC 33495 6 Samsung Group 66219
7 GE 31850 7 Verizon 65875
8 Bank of America 31426 8 Walmart 62211
9 HP 29445 9 Facebook 61998
10 Marlboro 26990 10 ICBC 47832
Source: http://www.forbes.com
Source: Brand Finance
Global Urban Competitiveness Report 2017-2018
20
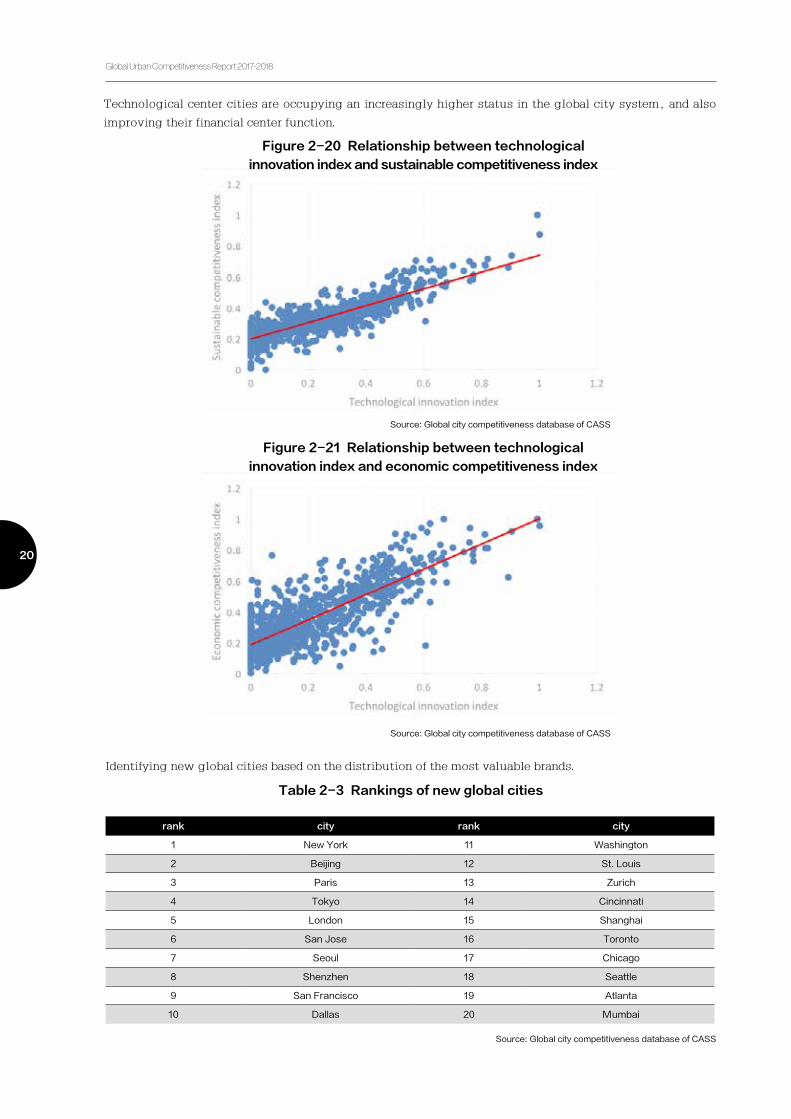
Technological center cities are occupying an increasingly higher status in the global city system, and also
improving their financial center function.
Identifying new global cities based on the distribution of the most valuable brands.
Source: Global city competitiveness database of CASS
Source: Global city competitiveness database of CASS
Source: Global city competitiveness database of CASS
Figure 2-20 Relationship between technological
innovation index and sustainable competitiveness index
Figure 2-21 Relationship between technological
innovation index and economic competitiveness index
Table 2-3 Rankings of new global cities
rank city rank city
1 New York 11 Washington
2 Beijing 12 St. Louis
3 Paris 13 Zurich
4 Tokyo 14 Cincinnati
5 London 15 Shanghai
6 San Jose 16 Toronto
7 Seoul 17 Chicago
8 Shenzhen 18 Seattle
9 San Francisco 19 Atlanta
10 Dallas 20 Mumbai

UN-HABITAT, CASS, Center for City and Competitiveness
21
Chapter 3 House Price and Competitiveness: Questions and
Literature Review(slightly)
Chapter 4 House Price and Competitiveness: Theoretical
Model(slightly)

Global Urban Competitiveness Report 2017-2018
22
G
uo
Ho
ng
yu
, P
h.
D.,
as
so
cia
te p
rofe
ss
or,
De
pu
ty D
ea
n o
f in
tern
ati
on
al
fin
an
ce
de
pa
rtm
en
t, S
ch
oo
l o
f in
tern
ati
on
al
ec
on
om
ics
, C
hin
a F
ore
ign
Aff
air
s U
niv
ers
ity,
E-
ma
il: g
uo
ho
ng
yu@
cfa
u.e
du
.cn
.
Chapter 5 Global Urban Real Estate
Market Status 1
UN-HABITAT, CASS, Center for City and Competitiveness
23
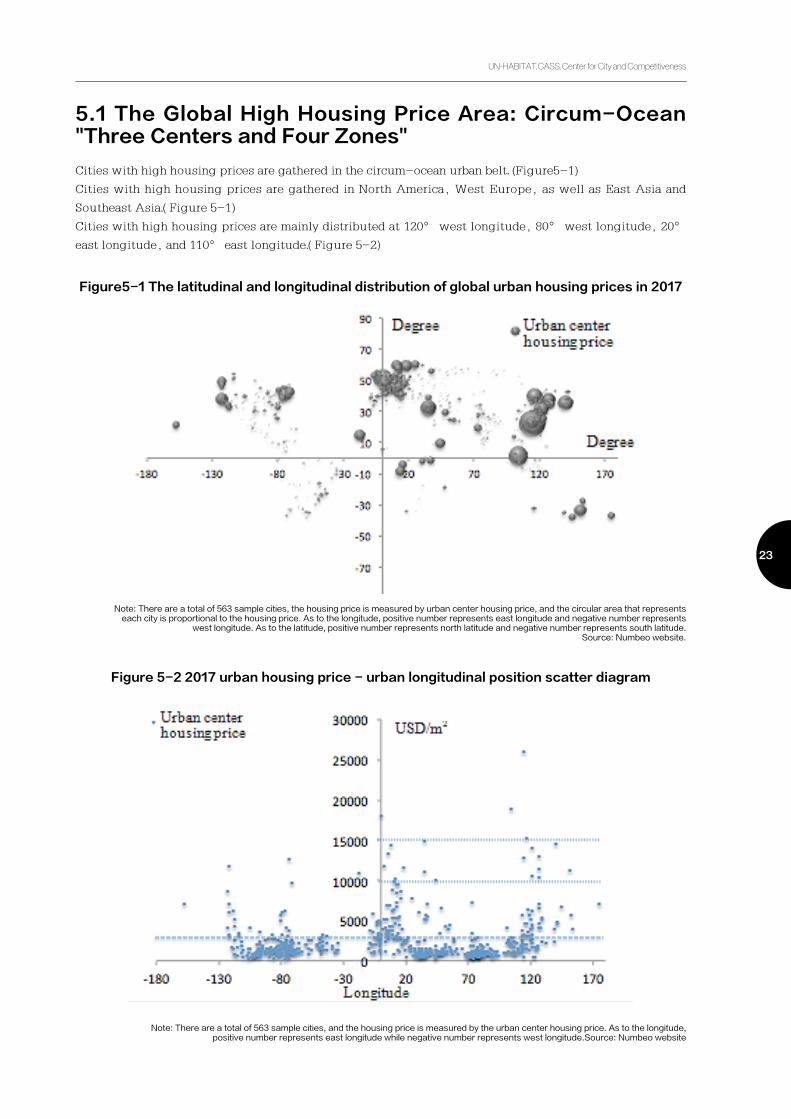
5.1 The Global High Housing Price Area: Circum-Ocean "Three Centers and Four Zones"
Cities with high housing prices are gathered in the circum-ocean urban belt. (Figure5-1)
Cities with high housing prices are gathered in North America, West Europe, as well as East Asia and
Southeast Asia.( Figure 5-1)
Cities with high housing prices are mainly distributed at 120° west longitude, 80° west longitude, 20°
east longitude, and 110° east longitude.( Figure 5-2)
Figure5-1 The latitudinal and longitudinal distribution of global urban housing prices in 2017
Figure 5-2 2017 urban housing price - urban longitudinal position scatter diagram
Note: There are a total of 563 sample cities, the housing price is measured by urban center housing price, and the circular area that represents each city is proportional to the housing price. As to the longitude, positive number represents east longitude and negative number represents
west longitude. As to the latitude, positive number represents north latitude and negative number represents south latitude.Source: Numbeo website.
Note: There are a total of 563 sample cities, and the housing price is measured by the urban center housing price. As to the longitude, positive number represents east longitude while negative number represents west longitude.Source: Numbeo website
Global Urban Competitiveness Report 2017-2018
24
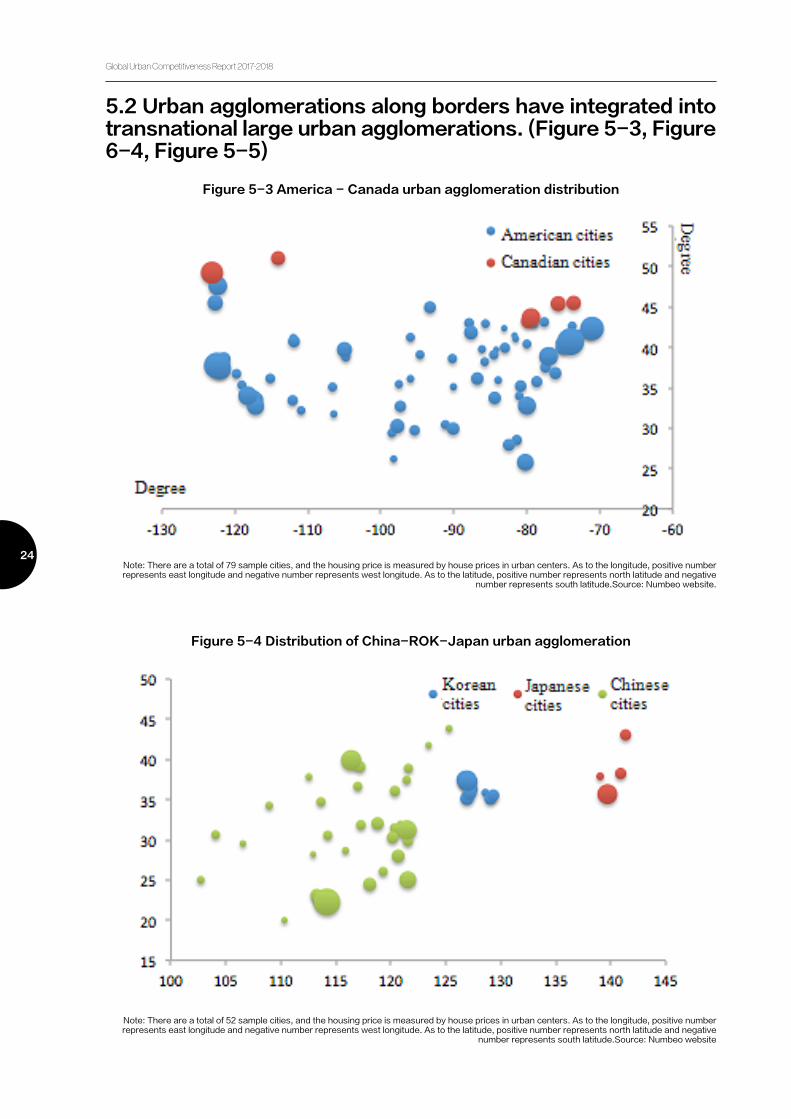
5.2 Urban agglomerations along borders have integrated into transnational large urban agglomerations. (Figure 5-3, Figure 6-4, Figure 5-5)
Figure 5-3 America - Canada urban agglomeration distribution
Figure 5-4 Distribution of China-ROK-Japan urban agglomeration
Note: There are a total of 79 sample cities, and the housing price is measured by house prices in urban centers. As to the longitude, positive number represents east longitude and negative number represents west longitude. As to the latitude, positive number represents north latitude and negative
number represents south latitude.Source: Numbeo website.
Note: There are a total of 52 sample cities, and the housing price is measured by house prices in urban centers. As to the longitude, positive number represents east longitude and negative number represents west longitude. As to the latitude, positive number represents north latitude and negative
number represents south latitude.Source: Numbeo website
UN-HABITAT, CASS, Center for City and Competitiveness
25
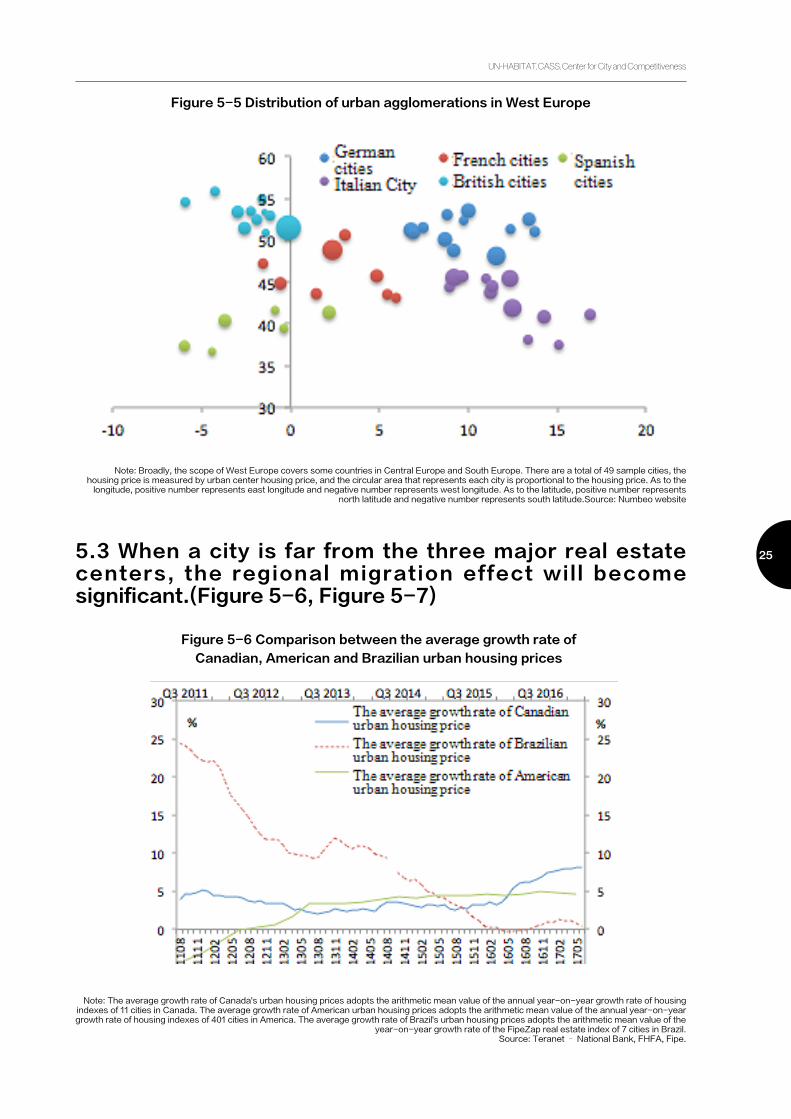
Figure 5-5 Distribution of urban agglomerations in West Europe
Note: Broadly, the scope of West Europe covers some countries in Central Europe and South Europe. There are a total of 49 sample cities, the housing price is measured by urban center housing price, and the circular area that represents each city is proportional to the housing price. As to the
longitude, positive number represents east longitude and negative number represents west longitude. As to the latitude, positive number represents north latitude and negative number represents south latitude.Source: Numbeo website
5.3 When a city is far from the three major real estate centers, the regional migration effect will become significant.(Figure 5-6, Figure 5-7)
Figure 5-6 Comparison between the average growth rate of
Canadian, American and Brazilian urban housing prices
Note: The average growth rate of Canada's urban housing prices adopts the arithmetic mean value of the annual year-on-year growth rate of housing indexes of 11 cities in Canada. The average growth rate of American urban housing prices adopts the arithmetic mean value of the annual year-on-year growth rate of housing indexes of 401 cities in America. The average growth rate of Brazil's urban housing prices adopts the arithmetic mean value of the
year-on-year growth rate of the FipeZap real estate index of 7 cities in Brazil.Source: Teranet – National Bank, FHFA, Fipe.

Global Urban Competitiveness Report 2017-2018
26 5.4 The higher the level of development, the greater the price differentiation. ( Table5-1, Figure 5-8)
Figure 5-7 Comparison between the average growth rate of
house prices in London, Paris, and India
Table 5-1: The 2017 statistical indicators of housing prices of cities at different tiers
Figure 5-8 Distribution of housing prices of cities at different tiers
Note 1: The urban housing price of London adopts the annual year-on-year growth rate of its housing indexes. The urban housing price of Paris adopts the annual year-on-year growth rate of its apartment price indexes. The average growth rate of Indian urban housing prices adopts the arithmetic mean
value of the annual year-on-year growth rate of housing indexes of 10 cities in India.Source: Nationwide of the UK, National Institute of Statistics and Economic Studies of France, and Reserve Bank of India (RBI).
Note: There are a total of 524 sample cities, including 17 tier-A cities, 51 tier-B cities, 303 tier-C cities, and 153 tier-D cities.Source: Numbeo website.
Source: Numbeo website.
Tier-A cities Tier-B cities Tier-C cities Tier-D cities
Average value of housing price(USD/ ㎡ )
12037 5126 2318 1286
Standard deviation of housing price(USD/ ㎡ )
5913 3252 1858 1458

UN-HABITAT, CASS, Center for City and Competitiveness
27
5.5 The urban agglomeration which is close to the national boundary and part of a large transnational urban agglomeration usually has higher housing price. (Table5-2)
Table 5-2: Housing prices of major urban agglomerations
in the United States, Canada and mainland China in 2017
资料来源:Numbeo 网站
Source: Numbeo websit
(USD/ ㎡ ) Urban AgglomerationMean Value of Urban Center House Price
USA
Arizona sunshine corridor urban agglomeration
1405
Urban agglomeration of Midwest U.S. 1480t constitutes the transnational urban agglomeration together with Toronto metropolitan area and Ottawa metropolitan area of Canada.
Piedmont urban agglomeration of Atlantic 2076
Texas Delta urban agglomeration 2077
Colorado metropolitan area 2802
Southern Florida urban agglomeration 3115
Southern California urban agglomeration 3832
Urban agglomeration of Northeast U.S. 4236It constitutes the transnational urban agglomeration together with Toronto metropolitan area and Ottawa metropolitan area of Canada.
Cascadia eco-city agglomeration 5097It constitutes the transnational urban agglomeration together with Calgary metropolitan area of Canada.
Northern California urban agglomeration 7266It faces the East Asian urban agglomeration across the ocean.
China Mainland
Beibu Gulf urban agglomeration 1502
Harbin-Changchun urban agglomeration 1877
Urban agglomeration in the middle reaches of the Yangtze River
2207
Chengdu-Chongqing urban agglomeration 2228
Xi'an urban agglomeration 2253
Liaodong Peninsula urban agglomeration 2428
It constitutes the transnational urban agglomeration together with Tokyo metropolitan area, Osaka metropolitan area, Nagoya metropolitan area of Japan, and Seoul metropolitan area of the Republic of Korea.
Central Plains urban agglomeration 3154
Shandong Peninsula urban agglomeration 3288
It constitutes the transnational urban agglomeration together with Tokyo metropolitan area, Osaka metropolitan area, Nagoya metropolitan area of Japan, and Seoul metropolitan area of the Republic of Korea.
Pearl River Delta urban agglomeration 4828It constitutes a large urban agglomeration with Hong Kong, Taiwan of China.
Yangtze River Delta urban agglomeration 5154It faces North American urban agglomeration across the sea.
Urban agglomeration on the west of the Taiwan Straits
5207It constitutes a large urban agglomeration with Hong Kong, Taiwan of China.
Beijing - Tianjin - Hebei urban agglomeration
9957It constitutes the transnational urban agglomeration together with Tokyo metropolitan area, Osaka metropolitan area, Nagoya metropolitan area of Japan, and Seoul

Global Urban Competitiveness Report 2017-2018
28
5.6 In general, most cities at the center of the urban agglomeration show siphon effect, which leads to a large house price gap between it and other cities in the urban agglomeration.(Figure 5-9)
Figure 5-9 Comparison of the housing price distribution interval
of urban agglomerations
Source: Numbeo websit
5.7 Transportation determines the upper and lower limits of urban real estate market. (Figure 5-10, Figure 5-11)
Figure 5-10 2007 scatter diagram of urban housing price -
the distance from major ports
Note: There are a total of 523 sample cities, and the housing price is measured by the urban center housing price.Source: Numbeo website. Global urban competitiveness database of Chinese Academy of Social Sciences.

UN-HABITAT, CASS, Center for City and Competitiveness
29
Figure 5-11 2017 urban housing price - number of
air routes scatter diagram
Note: There are a total of 523 sample cities, and the housing price is measured by the urban center housing price.Source: Numbeo website. Global urban competitiveness database of Chinese Academy of Social Sciences
Economic and social development causes differentiation of the real estate market. (Figure 5-12, Figure 5-13).
Figure5-12 2017 urban housing price - per capita GDP scatter diagram
Note: There are a total of 523 sample cities, and the housing price is measured by the urban center housing price.Source: Numbeo website. Global urban competitiveness database of Chinese Academy of Social Sciences
Global Urban Competitiveness Report 2017-2018
30
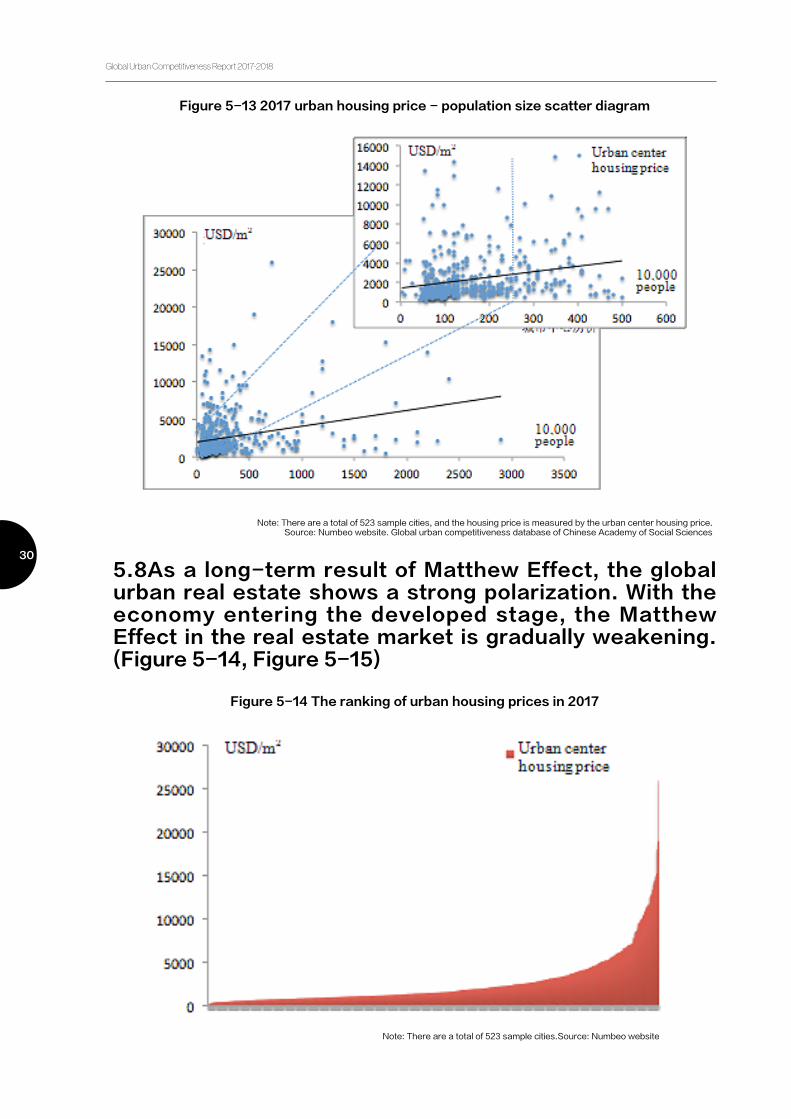
Figure 5-13 2017 urban housing price - population size scatter diagram
Note: There are a total of 523 sample cities, and the housing price is measured by the urban center housing price.Source: Numbeo website. Global urban competitiveness database of Chinese Academy of Social Sciences
Figure 5-14 The ranking of urban housing prices in 2017
5.8As a long-term result of Matthew Effect, the global urban real estate shows a strong polarization. With the economy entering the developed stage, the Matthew Effect in the real estate market is gradually weakening.(Figure 5-14, Figure 5-15)
Note: There are a total of 523 sample cities.Source: Numbeo website

UN-HABITAT, CASS, Center for City and Competitiveness
31
Figure 5-15 The 2017 ranking of urban housing prices
in developed and developing economies
Note: The division of developed economies and developing economies adopts that of IMF2016. The left side represents the developed economies and the right side represents the developing economies.
Source: Numbeo website
5.9 The effectiveness is based on the long-term expectation and decentralization degree
Long-term expectation originates from credible policy commitment.The monetary policy plays an important role in the correlation of real estate markets worldwide.Both the higher degree of decentralization and centralization in the fiscal system will promote the development of urban real estate market.Administrative intervention usually brings about short-term fluctuation in the urban real estate market, but if the administrative intervention is long-term and solidified into the institution of the real estate market, then the administrative intervention can have a long-term impact on the urban real estate market.

Global Urban Competitiveness Report 2017-2018
32
Chapter 6 Relationship between the Housing Price and
Competitiveness:Empirical analysis

UN-HABITAT, CASS, Center for City and Competitiveness
33
The global house price is unreasonable,only 16.7% of the sample cities had a house price to income ratio at a reasonable range, and the house price to income ratio is the highest in Asia and Africa, lower in inland areas and developed countries than in coastal areas and developing countries.
Figure 6-1 Global distribution of the price-to-income ratio
Table 6-1 The description of the housing price to
income ratio in different ranges of values
Source: City and Competitiveness Index Database, CASS
Range of values Variables Average value Standard error Minimum value Maximum value
全球 311 10.6245 7.491411 0.44 50.36
HPIR<3 41(13.18%) 2.163171 0.604332 0.44 2.97
3=<HPIR<=6 52(16.72%) 4.450192 0.894814 3.03 6.00
6<HPIR<=10 76(24.44%) 8.112500 1.182139 6.12 10.00
10=<HPIR<=15 74(23.79%) 12.08216 1.364829 10.01 14.95
15<HPIR<=20 38(12.22%) 17.00842 1.367765 15.06 19.93
20<HPIR<=25 13(4.18%) 22.55077 1.405901 20.06 24.55
25<HPIR<=30 8(2.57%) 26.48125 1.162748 25.42 28.80
30<HPIR<=35 5(1.61%) 31.55400 1.175322 30.50 33.06
HPIR>35 4(1.29%) 41.09750 6.456270 36.53 50.36

Global Urban Competitiveness Report 2017-2018
34
The house price is a stimulus for income growth in most of the world, but a restraint in Asia and Europe, in particular in Europe. (see Figure 6-2)
The house price is in an inverted U-shaped relationship with urban per capita income and competitiveness.
Figure 6-2 The price-income relationship
Table 6-2 The price-income relationship in different regions
Figure 6-3 Scatter diagram of global per capita disposable
income ,competitiveness and house prices
Source: City and Competitiveness Index Database, CASS
Source: City and Competitiveness Index Database, CASS
Region Sample sizeThe house price
stimulates income growth
The house price suppresses income
growth
The house price and income in an inverted U-shaped
relationship 最大值
North America 58 13 30 15 50.36
Oceania 7 1 4 2 2.97
Africa 13 8 3 2 6.00
South America 30 6 15 9 10.00
Europe 71 27 28 16 14.95
Asia 67 24 29 14 19.93
G7 81 21 37 23 24.55
BRICS 50 12 31 7 28.80
UN-HABITAT, CASS, Center for City and Competitiveness
35
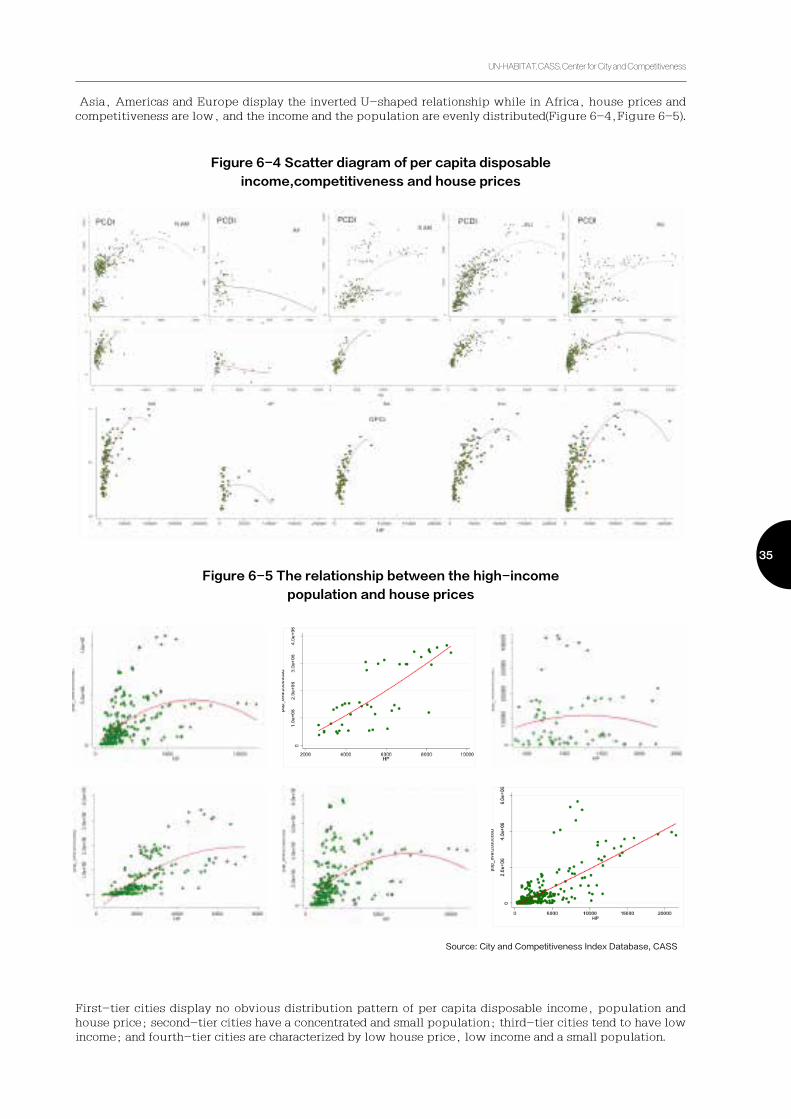
Asia, Americas and Europe display the inverted U-shaped relationship while in Africa, house prices and competitiveness are low, and the income and the population are evenly distributed(Figure 6-4,Figure 6-5).
First-tier cities display no obvious distribution pattern of per capita disposable income, population and house price; second-tier cities have a concentrated and small population; third-tier cities tend to have low income; and fourth-tier cities are characterized by low house price, low income and a small population.
Figure 6-4 Scatter diagram of per capita disposable
income,competitiveness and house prices
Figure 6-5 The relationship between the high-income
population and house prices
Source: City and Competitiveness Index Database, CASS

Global Urban Competitiveness Report 2017-2018
36
Source: City and Competitiveness Index Database, CASS
Major developed and developing countries generally have a clear income-price relationship; India suffers from an extremely uneven income-price relationship.
Figure 6-6 Scatter diagrams of per capita disposable income and house prices
Top cities have seen the inverted U-shaped relationship between income and house prices and major cities have seen this trend.

UN-HABITAT, CASS, Center for City and Competitiveness
37
The high-income population-price ,wage-price relationship is not clear for major cities.The major urban agglomerations around the world have already experienced inverted U-shaped relationship between the house price and income. (see Figure 6-7 to Figure 6-8)
Figure 6-7Relationship between income and house prices in Yangtze River Delta
Metropolitan Regions, Pearl River Delta Metropolitan Regions ,CHINA
Figure 6-8 Relationship between income and house prices in Boston-Washington
Metropolitan Regions, North Carolina Metropolitan Regions, USA
Figure6-9 Relationship between income and house prices in London - Liverpool
Metropolitan Regions, England ; northwestern European Metropolitan Regions
资料来源:中国社会科学院城市与竞争力指数数据库

Global Urban Competitiveness Report 2017-2018
38
Chapter 7 City story: House Prices and Competitiveness
7.1 Silicon Valley: Despite the rapid rise in house prices in Silicon Valley, residents bear the decline in
capacity, but this did not significantly weaken the competitiveness of the city, especially scientific and
technological innovation activities are still booming.The government should find a balance between high prices
and economic development.
7.2 Pittsburgh: Pittsburgh’s relatively low
housing prices is not enough to attract industry
and talent, is not conducive to the improvement of
urban competitiveness.The government should pay
attention to the improvement of the quality of life.
7.3 Singapore: A sound housing system is a
key guarantee for stabilizing the housing price
and enhancing urban competitiveness. Efficient
government control is vital for keeping the housing
price in a reasonable range.
Figure 7-1 Silicon Valley urban landscape map
Figure 7-2 Pittsburgh city landscape
Figure 7-3 Singapore city landscape

UN-HABITAT, CASS, Center for City and Competitiveness
39
7.4 Melbourne: Melbourne's current high house prices weaken the affordability of residential housing and the
cost of labor as a core of competitiveness. This has seriously damaged the competitiveness of the increase.
7.5 Tokyo: The rapid rise in housing prices in Tokyo poses a huge risk to the improvement of urban
competitiveness, the elaboration of the real estate tax system is the focus of the problem.
Figure 7-4 urban landscape map of Melbourne
Figure 7-5 urban landscape map of Tokyo

Global Urban Competitiveness Report 2017-2018
40
Figure 7-6 urban landscape map of Taipei
Figure 7-8 urban landscape map of Foshan
Figure7- 9 Madrid city landscape map
Figure 7-7 urban landscape map
of Guangzhou
7.8 Foshan: Foshan’s effective housing supply
system helps to maintain the stability of housing
prices, stable housing prices and flexible land
supply policy to promote the upgrading of urban
competitiveness.
7.6 Taipei: Although the price is relatively high,
but the rental price is still very reasonable. The
government needs to formulate a reasonable housing
policy to ensure the competitiveness of the upgrade.
7.9 Valencia, Bilbao and Madrid: Spain's urban
housing supply and price increases will eventually
result in housing market distortions, endangering
urban competitiveness.
7.7 Guangzhou: A relatively affordable price is
positive to attract global talent and enterprises,
to promote urban innovation, economic vitality
continue to improve, to achieve healthy and rapid
economic development.

UN-HABITAT, CASS, Center for City and Competitiveness
41
7.10 Lima: In recent years, house prices have risen, creating an explosive population growth, prompting the
Ima city center to expand, suburban economic vitality,but also caused the gap between rich and poor and so on.
The government should give a solution from the policy of supply and credit.
7.11 Buenos Aires: Real estate development is the main driver of Buenos Aires's urban growth. The need to
develop urban regulations, to encourage real estate development and to solve the negative impact of real estate
development.
Figure 7-11 urban landscape map of Buenos Aires
Figure 7-10 urban landscape map of Lima

Global Urban Competitiveness Report 2017-2018
42
C h a p t e r 8 E c o n o m i c F o u n d a t i o n s f o r Sustainable Urbanization: The link with Competitiveness 2
To support city leaders to achieve sustainable
urbanisation by providing urban planning methods and
systems to address current urbanization challenges
such as population growth, urban sprawl, poverty,
inequality, pollution, congestion, as well as urban
biodiversity, urban mobility, and energy. This work is
done with cities, as urban economies generate more
than 90% of global gross value added (Gutman 2007).
This chapter explains what are the fundamentals
needed to design urbanisation policies and what is the
link with competitiveness.
We sustain that competitiveness is an expression
of productivity, and from a city approach, both are
strongly linked to the spatial dimension and urban
layout.UN-Habitat promotes five key principles
for urban design UN-HABITAT “A New Strategy
of Sustainable Neighbourhood Planning: Five
principles” , as concepts for urban planning
rather than economics;The second essential pillar
for successful PCE is a sound financial plan,
meaning proper budgeting, revenue generation and
expenditure management;Rules and regulations have
the power to shape the form and character of the city
by playing an essential role in the implementation of
urban plans.
For policy, Rules and regulations have the power to
shape the form and character of the city by playing
an essential role in the implementation of urban
plans. cities need to build and strengthen the core
conditions for sustainable urbanization, and those
are the rules and regulations, municipal finance,
and urban planning and design. Planning, Finance,
and Regulations are the base for the Three-Pronged
Approach. 2M
arc
o K
am
iya
, L
oe
iz B
ou
rdic
UN-HABITAT, CASS, Center for City and Competitiveness
43
Chapter 9 Global Urban Economic
Competitiveness 2017-2018

Global Urban Competitiveness Report 2017-2018
44
9.1The imbalance of global urban economic competitiveness poses challenges to emerging market cities
9.2The overall lagging and imbalance of financial service has become a constraint to restrict the economic competitiveness of global cities
Among the top 10 cities, the United States has an obvious edge while China catches our
eyes with the rapid rise of its cities. Our findings show that New York, Los Angeles, Singapore,
London, and San Francisco rank top 5 in terms of the global urban economic competitiveness index. Of
the top 10 cities, five are from North America, accounting for 50%, three are from Asia, and two are from
Europe. No cities from the other three continents enter the top 10 list.
Global financial activities are concentrated in a small number of cities, and the overall level
is low. Among the top ten cities, New York ranks the first, and China's cities are upgrading
rapidly.China have three cities - Hong Kong of China., Shanghai, Beijing - on the list of top ten global
financial cities.
Table 9-1 Top 20 Cities in Global Urban Economic Competitiveness Ranking
Rank CityEconomic
CompetitivenessCountry Continent
1 New York 1.000 United States North America
2 Los Angeles 0.999 United States North America
3 Singapore 0.971 Singapore Asia
4 London 0.958 United Kingdom Europe
5 San Francisco 0.941 United States North America
6 Shenzhen 0.934 China Asia
7 Tokyo 0.920 Japan Asia
8 San Jose 0.916 United States North America
9 Munich 0.905 Germany Europe
10 Dallas 0.903 United States North America
11 Houston 0.900 United States North America
12 Hong Kong 0.887 China Asia
13 Seoul 0.848 Korea Asia
14 Shanghai 0.837 China Asia
15 Guangzhou 0.835 China Asia
16 Miami 0.816 United States North
17 Chicago 0.815 United States North
18 Boston 0.812 United States North
19 Dublin 0.811 Ireland Europe
20 Beijing 0.810 China Asia
Source: Urban and Competitiveness Index Database of Chinese Academy of Social Sciences

UN-HABITAT, CASS, Center for City and Competitiveness
45
9.3The global urban industrial system with tier-based jump jump calls for the development of Urban Agglomerations
The global urban industrial system shows the phenomenon of "tier-based jump", with
the industrial system concentrated in cities with stronger economic competitiveness.
Urban development calls for the reconstruction of value chain of global industrial system.
Urban development calls for the reconstruction of value chain of global industrial system.
The industrial system index has a significant positive decelerating effect on economic competitiveness.
The reconstruction of the global industrial system value chain will have greater effects on enhancing the
economic competitiveness, thus boosting global economic growth and balanced development.
Figure 9-1 The dispersion and fitting of global urban economic
competitiveness and industrial system index
Table 9-2 Top ten global cities in financial services index
No. City Financial services index Country Continent
1 New York 1.000 USA North America
2 London 0.679 UK Europe
3 Tokyo 0.603 Japan Asia
4 Hong Kong 0.600 China Asia
5 Shanghai 0.534 China Asia
6 Mumbai 0.474 India Asia
7 Beijing 0.449 China Asia
8 Singapore 0.447 Singapore Asia
9 Paris 0.445 France Europe
10 Seoul 0.444 ROK Asia
Source: City and Competitiveness Index Database, CASS.
Global Urban Competitiveness Report 2017-2018
46
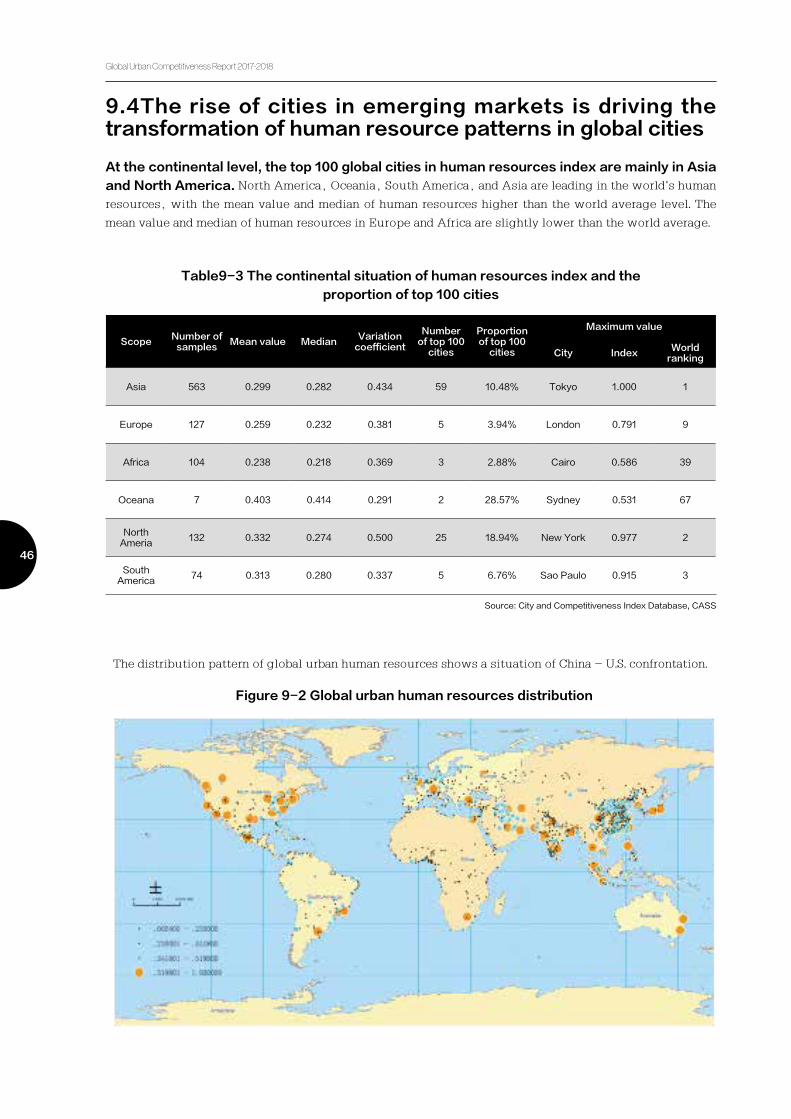
9.4The rise of cities in emerging markets is driving the transformation of human resource patterns in global cities
At the continental level, the top 100 global cities in human resources index are mainly in Asia
and North America. North America, Oceania, South America, and Asia are leading in the world's human
resources, with the mean value and median of human resources higher than the world average level. The
mean value and median of human resources in Europe and Africa are slightly lower than the world average.
Table9-3 The continental situation of human resources index and the
proportion of top 100 cities
Source: City and Competitiveness Index Database, CASS
ScopeNumber of
samplesMean value Median
Variation coefficient
Number of top 100
cities
Proportion of top 100
cities
Maximum value
City IndexWorld
ranking
Asia 563 0.299 0.282 0.434 59 10.48% Tokyo 1.000 1
Europe 127 0.259 0.232 0.381 5 3.94% London 0.791 9
Africa 104 0.238 0.218 0.369 3 2.88% Cairo 0.586 39
Oceana 7 0.403 0.414 0.291 2 28.57% Sydney 0.531 67
North Ameria
132 0.332 0.274 0.500 25 18.94% New York 0.977 2
South America
74 0.313 0.280 0.337 5 6.76% Sao Paulo 0.915 3
The distribution pattern of global urban human resources shows a situation of China - U.S. confrontation.
Figure 9-2 Global urban human resources distribution
UN-HABITAT, CASS, Center for City and Competitiveness
47
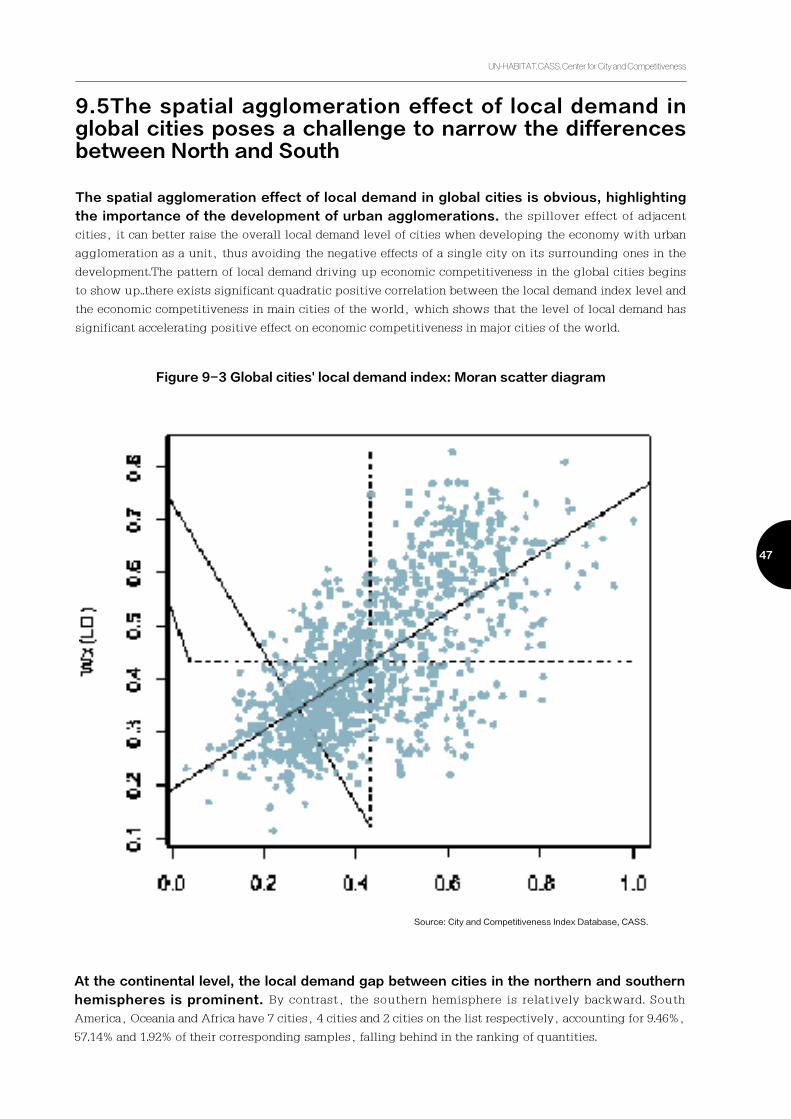
The spatial agglomeration effect of local demand in global cities is obvious, highlighting
the importance of the development of urban agglomerations. the spillover effect of adjacent
cities, it can better raise the overall local demand level of cities when developing the economy with urban
agglomeration as a unit, thus avoiding the negative effects of a single city on its surrounding ones in the
development.The pattern of local demand driving up economic competitiveness in the global cities begins
to show up..there exists significant quadratic positive correlation between the local demand index level and
the economic competitiveness in main cities of the world, which shows that the level of local demand has
significant accelerating positive effect on economic competitiveness in major cities of the world.
Figure 9-3 Global cities' local demand index: Moran scatter diagram
9.5The spatial agglomeration effect of local demand in global cities poses a challenge to narrow the differences between North and South
Source: City and Competitiveness Index Database, CASS.
At the continental level, the local demand gap between cities in the northern and southern
hemispheres is prominent. By contrast, the southern hemisphere is relatively backward. South
America, Oceania and Africa have 7 cities, 4 cities and 2 cities on the list respectively, accounting for 9.46%,
57.14% and 1.92% of their corresponding samples, falling behind in the ranking of quantities.

Global Urban Competitiveness Report 2017-2018
48
it is found that, the mean value of urban business environment index of BRICS and AIIB member countries
is obviously lower than the average level of G7 countries, and the gap between AIIB member countries
and G7 in the mean value of urban business environment index is even smaller. From the perspective of
differential indicators, the cities' business environment differences of both BRICS and AIIB are significantly
higher than those of G7. This indicates that cities of emerging economies represented by BRICS need to
improve the business environment and innovation environment through accelerating institutional and
legal guarantees, so as to effectively reduce the market operation cost and the burden of enterprises, and
improve operational efficiency and international competitiveness, which is an important way for cities of
emerging economies to attain their own development and catch up with and surpass developed countries.
Table 9-4 The continental situation of local demand index and the
proportion of top 100 cities
Table 9-5 The business cost index of the primate cities in global
representative countries: international organizations
9.6Reducing the business cost is the prerequisite for cities in emerging economies to catch up
Source: City and Competitiveness Index Database, CASS
ScopeNumber of
samplesMean value
MedianVariation
coefficient
Number of top 100
cities
Proportion of top 100
cities
Maximum value
City IndexWorld
ranking
Asia 563 0.372 0.338 0.375 20 3.55% Tokyo 0.958 2
Europe 127 0.530 0.537 0.260 23 18.11% London 0.918 4
Africa 104 0.325 0.312 0.430 2 1.92% Cairo 0.716 57
Oceania 7 0.669 0.682 0.130 4 57.14% Sydney 0.783 28
North America
132 0.603 0.608 0.246 43 32.58% New York 1.000 1
South America
74 0.478 0.463 0.247 7 9.46% Buenos Aires 0.805 19
Scope Sample size Mean value Median Standard
deviation
Variation
coefficient Gini coefficient Theil index
BRICS 7 0.487 0.553 0.218 0.447 0.228 0.094
G7 7 0.635 0.651 0.149 0.235 0.116 0.023
AIIB 35 0.499 0.461 0.171 0.342 0.188 0.056

UN-HABITAT, CASS, Center for City and Competitiveness
49
Figure9-4 The scatterplot and fitting of economic competitiveness and business
environment index of the primate cities of representative countries
9.8The spatial agglomeration of global urban infrastructure helps rapidly develop cities in emerging economies
9.9Advantages of urban living environment to create a foundation for emerging economies to enhance global economic competitiveness
Examining the correlation between the business environment index and economic competitiveness of the
primate cities of 138 representative countries, there exists significant linear positive correlation between
the two, showing that the business environment level of major cities in the world has linear positive
promotion effect on their economic competitiveness.
9.7The key for emerging economies to catch up and take the lead is to play the positive stimulating role of business environment in economic competitiveness.

Global Urban Competitiveness Report 2017-2018
50
9.10Analysis of the driving forces of the top 100 Cities in the global economic competitiveness
it can be found that the mean value of urban living environment index of BRICS and AIIB member countries
has no obvious disadvantage compared with that of G7. But from the differential indicators, we can see
that the urban living environment difference of BRICS is slightly greater than that of G7, and the living
environment index difference between AIIB member countries is relatively large.
Local demand, infrastructure, institutional environment, and human resources are driving forces that are
more closely related to the economic competitiveness of the top 100 cities
ScopeNumber of samples
Mean value MedianStandard deviation
Variation coefficient
Gini coefficient Theil index
BRICS 463 0.621 0.650 0.119 0.192 0.101 0.021
G7 141 0.695 0.690 0.108 0.156 0.087 0.012
AIIB 730 0.620 0.645 0.135 0.217 0.117 0.025
Table 9-5 The calculation of grey correlation degree
of top 100 global cities in economic competitiveness
Table 9-6 Global urban living environment index:
international organizations

UN-HABITAT, CASS, Center for City and Competitiveness
51
9.11Cities of China and U.S.: Situation Analysis of Chaser and Front-runner
While the United States is the largest developed country, China is the largest emerging market economy.
Cities of the two countries are at different development stages and gap is inevitable. Generally, American
cities are more advanced than Chinese cities. Except for the living environment index, American cities
surpass Chinese cities in all the individual indexes.
Figure 9-6 Radar Map of Individual Indexes of Top 20 Chinese and U.S. Cities
Figure 9-7 Histogram of Individual Indexes of Top 5 Chinese and U.S. Cities

Global Urban Competitiveness Report 2017-2018
52
Chapter 10 Global urban Sustainable Competitiveness Report
2017-2018

UN-HABITAT, CASS, Center for City and Competitiveness
53
The rapid rise of advanced cities in Asia which are at the same sustainable competitive level as European
and North American cities. The sustainable competitiveness gap between African cities is the largest. The
sustainable competitiveness difference of German cities is the smallest, while the difference of Brazilian
cities is the biggest. The urban agglomerations of European and American countries have high proportion
of top 100 cities, while in developing countries top cities are mainly economic centers. The increase of
high-income population has greater influence on the sustainable competitiveness of cities with a low
proportion of high-income population.
10.1Global Urban Sustainable Competitiveness Pattern
Figure 10-1 Distribution of sustainable competitiveness of global cities
Figure 10-2 Correlation between the revealed competitiveness
index and the sustainable competitiveness index

Global Urban Competitiveness Report 2017-2018
54
Figure 10.3 Distribution of global urban economic vitality
U.S. urban economy vitality remains tremendous and China's urban economy vitality is growing rapidly. The
economic vitality of African cities is the worst, and the economic vitality difference of Asian cities is the
largest. The United States and China have the largest number of cities entering the list of top 100 cities in
economic vitality. The economic vitality of urban agglomerations in the United States outshines the rest and
the differences within the urban agglomerations of developing countries are huge. The increase of high-
income population has greater influence on the economic vitality of cities with a low proportion of high-
income population.
10.2The Economic Vitality Pattern of Global Cities
Figure10-4 Correlation between the revealed competitiveness
index and the sustainable competitiveness index

UN-HABITAT, CASS, Center for City and Competitiveness
55
In addition, it is found that technological innovation and economic vitality are positively correlated.
Figure10-5 Correlation between technological innovation and economic vitality
Figure10-6 The mean value and variation coefficient of human capital at different city grades
The human capital of U.S. cities outshines that of other top cities in the world. Asia has the largest number
of cities entering the list of top 100 human capital cities, and the human capital difference of cities in North
America is the biggest. The United States and China have the largest number of cities entering the list of top
100 cities in human capital. The human capital of American and Chinese urban agglomeration is stronger,
while the human capital of German and Korean urban agglomerations is weaker. The higher the level of
urban human capital, the greater the internal city differences.
Cities are concentrated in low-value regions of technology innovation, while the long tail of distribution
extends to the right. It again verifies the conclusion that the gap between indexes of different cities is large.
10.3Global Urban Human Capital Potential Pattern
10.4Technology Innovation Index: The global focus is in North America, and the development of global cities is extremely unbalanced
Mean value Coefficient of variation
Global Urban Competitiveness Report 2017-2018
56
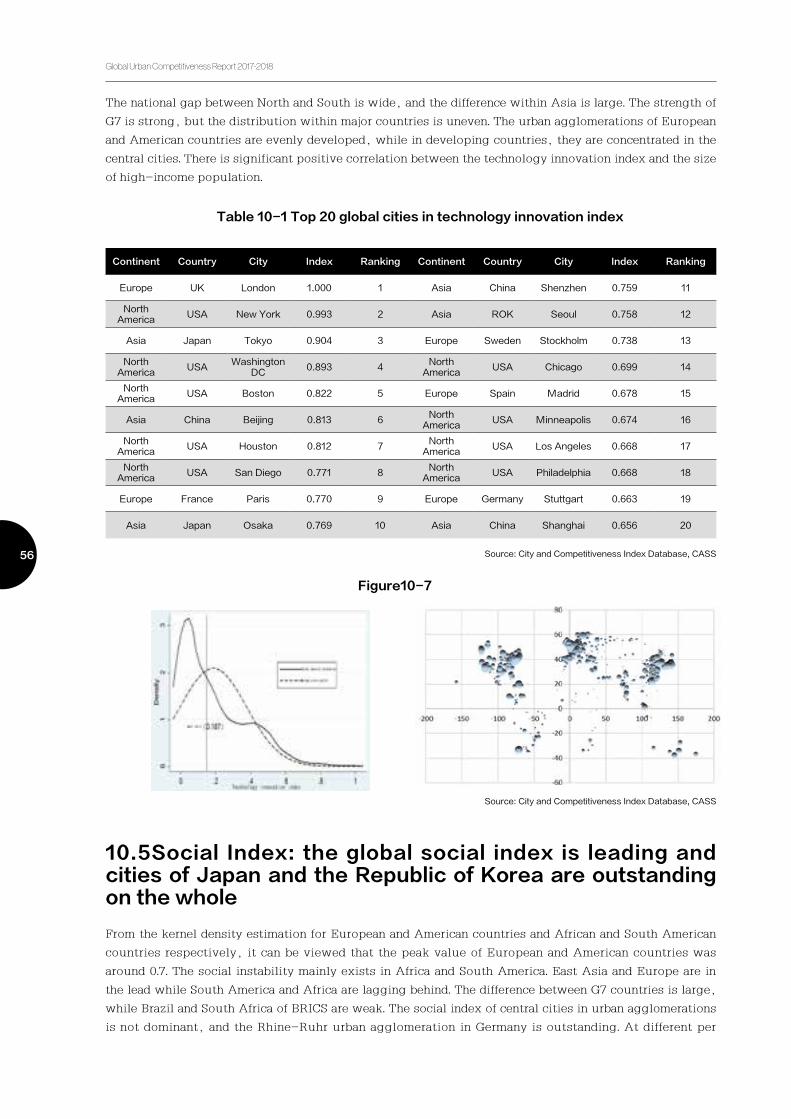
Table 10-1 Top 20 global cities in technology innovation index
Figure10-7
From the kernel density estimation for European and American countries and African and South American
countries respectively, it can be viewed that the peak value of European and American countries was
around 0.7. The social instability mainly exists in Africa and South America. East Asia and Europe are in
the lead while South America and Africa are lagging behind. The difference between G7 countries is large,
while Brazil and South Africa of BRICS are weak. The social index of central cities in urban agglomerations
is not dominant, and the Rhine-Ruhr urban agglomeration in Germany is outstanding. At different per
10.5Social Index: the global social index is leading and cities of Japan and the Republic of Korea are outstanding on the whole
Continent Country City Index Ranking Continent Country City Index Ranking
Europe UK London 1.000 1 Asia China Shenzhen 0.759 11
North America
USA New York 0.993 2 Asia ROK Seoul 0.758 12
Asia Japan Tokyo 0.904 3 Europe Sweden Stockholm 0.738 13
North America
USAWashington
DC0.893 4
North America
USA Chicago 0.699 14
North America
USA Boston 0.822 5 Europe Spain Madrid 0.678 15
Asia China Beijing 0.813 6North
AmericaUSA Minneapolis 0.674 16
North America
USA Houston 0.812 7North
AmericaUSA Los Angeles 0.668 17
North America
USA San Diego 0.771 8North
AmericaUSA Philadelphia 0.668 18
Europe France Paris 0.770 9 Europe Germany Stuttgart 0.663 19
Asia Japan Osaka 0.769 10 Asia China Shanghai 0.656 20
Source: City and Competitiveness Index Database, CASS
Source: City and Competitiveness Index Database, CASS
The national gap between North and South is wide, and the difference within Asia is large. The strength of
G7 is strong, but the distribution within major countries is uneven. The urban agglomerations of European
and American countries are evenly developed, while in developing countries, they are concentrated in the
central cities. There is significant positive correlation between the technology innovation index and the size
of high-income population.

UN-HABITAT, CASS, Center for City and Competitiveness
57
Source: City and Competitiveness Index Database, CASS
Table 10-3 The continental situation of social index
and the proportion of top 100 cities
Figure 10-8 The social index distribution of global cities
Table10-2 The system management indexes of primate cities
among the top ten global countries
City Jeonju Zurich Sapporo Nagoya Munich Kwangju Daejeon Daegu Cheongju Osaka
Country ROK Switzerland Japan Japan Germany ROK ROK ROK ROK Japan
Continent Asia Europe Asia Asia Europe Asia Asia Asia Asia Asia
Index 1 0.976 0.971 0.962 0.962 0.937 0.935 0.935 0.934 0.933
Ranking 1 2 3 4 5 6 7 8 9 10
capita income levels, the correlation between the social index and the city is different.
Region Sample
Number of top 100
cities and the proportion
Mean valueVariation
coefficient
Maximum value
City Index World ranking
Asia 585 58 (9.91%) 0.671 0.137 Jeonju 1 1
Europe 132 33 (25%) 0.681 0.184 Zurich 0.976 2
North America
131 7 (5.34%) 0.546 0.311 Quebec 0.861 43
South America
77 0 (0%) 0.321 0.308 Managua 0.543 816
Oceania 7 0 (0%) 0.698 0.066 Sydney 0.765 115
Africa 103 2 (1.94%) 0.480 0.397 Tanzania 0.784 87
World average
1035 100 (100%) 0.187 1.02 Jeonju 1 1
Global Urban Competitiveness Report 2017-2018
58
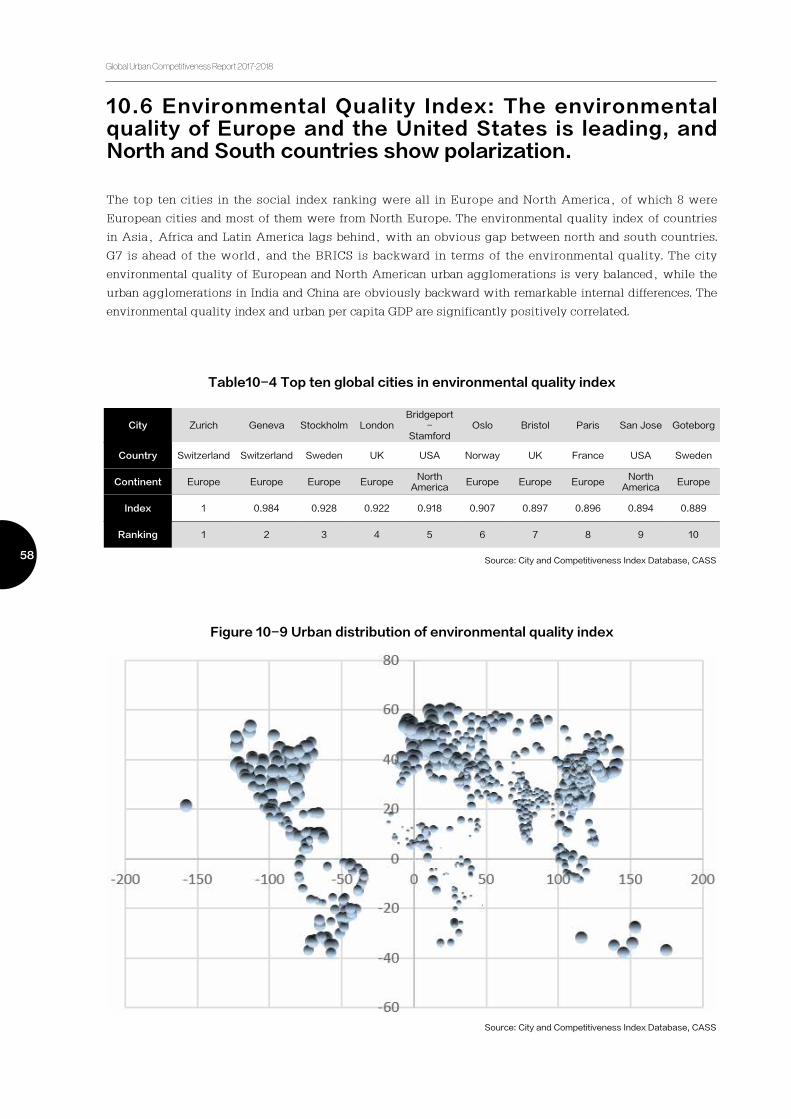
The top ten cities in the social index ranking were all in Europe and North America, of which 8 were
European cities and most of them were from North Europe. The environmental quality index of countries
in Asia, Africa and Latin America lags behind, with an obvious gap between north and south countries.
G7 is ahead of the world, and the BRICS is backward in terms of the environmental quality. The city
environmental quality of European and North American urban agglomerations is very balanced, while the
urban agglomerations in India and China are obviously backward with remarkable internal differences. The
environmental quality index and urban per capita GDP are significantly positively correlated.
10.6 Environmental Quality Index: The environmental quality of Europe and the United States is leading, and North and South countries show polarization.
Table10-4 Top ten global cities in environmental quality index
City Zurich Geneva Stockholm LondonBridgeport
- Stamford
Oslo Bristol Paris San Jose Goteborg
Country Switzerland Switzerland Sweden UK USA Norway UK France USA Sweden
Continent Europe Europe Europe EuropeNorth
AmericaEurope Europe Europe
North America
Europe
Index 1 0.984 0.928 0.922 0.918 0.907 0.897 0.896 0.894 0.889
Ranking 1 2 3 4 5 6 7 8 9 10
Figure 10-9 Urban distribution of environmental quality index
Source: City and Competitiveness Index Database, CASS
Source: City and Competitiveness Index Database, CASS

UN-HABITAT, CASS, Center for City and Competitiveness
59
Table 10-5 The system management indexes of
primate cities among the top ten global countries
Source: City and Competitiveness Index Database, CASS
The institutional indexes of European and North American countries show an overall advantage, while the
system management indexes of Asian, African and South American countries are relatively backward. The
index gap between northern and southern countries is obvious. The system management of European and
American countries is advanced, while that of Asian, African and Latin American countries lags behind.
European and American urban agglomerations are way ahead, while those in India and China lag far behind.
The higher the city tier is, the stronger the positive correlation between the system management index and
the urban high-income population is.
10.7 System Management Index: The system management of Oceania and Europe is in the lead, and the system management of developed countries is relatively perfect
CityHong Kong
Singapore Auckland Sydney London Copenhagen Zurich New York Helsinki Oslo
Country China SingaporeNew
ZealandAustralia UK Denmark Switzerland USA Finland Norway
Continent Asia Asia Oceania Oceania Europe Europe EuropeNorth
AmericaEurope Europe
Index 1 0.991 0.966 0.899 0.880 0.878 0.870 0.870 0.863 0.858
Ranking 1 2 3 4 5 6 7 8 9 10
The top ten cities in terms of global connectivity are: New York, London, Hong Kong, Beijing, Singapore,
Shanghai, Paris, Tokyo, Sydney, and Dubai.
10.8 Global connection Index:high-income developed countries still dominate global connectivity and exchanges, but the emerging-market countries as represented by China are experiencing rapid urban growth
Figure 10-10 Mean global connectivity index of different income levels

Global Urban Competitiveness Report 2017-2018
60
Technological innovation and strong global connectivity are the basic characteristics of the top 100 cities
for sustainable competitiveness. The cities from emerging-market countries as represented by China, the
Republic of Korea and Singapore are performing increasingly well. In addition, North American cities are
the best in technological innovation but have poor environmental quality; whereas European cities are
doing well in both innovation drive and environment.
And the BRICS cities have great development potential. The cities of mature developed countries as
represented by the US are the most vigorous but have outstanding environmental quality and social
problems. The cities of emerging-market countries as represented by the BRICS are generally better than
those of the mature developed countries. In addition, none of the cities from the G7 countries are ranked
among the top 100 for environmental quality. The BRICS countries are becoming an important part of global
connectivity, but their innovation capacity and government management capacity still needs improvement.
The cities of emerging-market countries as represented by the BRICS are developing fast in infrastructure.
In particular, the infrastructure of Chinese cities has generally caught up with that of developed countries.
10.9 The top 100 cities for sustainable competitiveness represent the blueprint of the topmost urban development in the world
10.10 The cities of the G7 generally have top-ranking sustainable competitiveness
Figure10-11 World rankings of the top 10 cities for sustainable
competitiveness in terms of
environmental quality and social condition

UN-HABITAT, CASS, Center for City and Competitiveness
61
Appendix 1
A.1 Theoretical FrameworkUrban competitiveness is the city's ability of creating value currently and in the future. the sustainable competitiveness determines the urban economic competitiveness via the explanatory variable of economic competitiveness; in turn, the urban economic competitiveness affects the sustainable competitiveness via the explanatory variable of economic competitiveness.
Economic competitiveness is essentially the city's ability to create value and obtain economic rent. The capacity level is reflected by the city's competitive results in the current period, which is the output, current and short-term reflection of urban competitiveness. Economic competitiveness is mainly manifested as the comprehensive long-term growth of urban economy and the economic density, which are measured by the average increment of GDP for 5 consecutive years and the GDP per square kilometer of land.
Urban value: economic competitiveness
Urban industrial quality: economic competitiveness explainable variables
Urban elements and environment: sustainable competitiveness
urban value:economic competitiveness
explanatory variables of ecnomic competitiveness
comprehensive increment comprehensive efficiency
GC
LE IN SE
CC
LD
HR IS TI
FE

Global Urban Competitiveness Report 2017-2018
62
Urban sustainable competitiveness is essentially the conditions of a city's elements and environment. As the decisive factors in the process of urban development, the situation of a city's elements and environment has a decisive impact on the current and future development of the city.
A.2 Sample Selection and Calculation MethodA city is usually a residential area with a high degree of urbanization, this report uses metropolitan caliber, according to the World Urbanization Prospects released by Department of Economic and Social Affairs of the United Nations in 2015, selects global cities with the population above 500,000 as samples, a total of 1,035 sample cities around the world have been selected. From the view of spatial distribution, The 1,035 cities basically represent the status of cities in different regions and at different levels. For the specific 1,035 sample cities, see Chapter One. It is noteworthy that, GDP per square kilometer is adopted in measuring economic competitiveness, the selection criteria of which are more stringent, and due to its availability and accuracy, only 1,007 cities are selected for the economic competitiveness model and ranking.The index system of urban competitiveness index includes the first-level index, the second-level index and the third-level index. When the third-level indicator is used to synthesize the second-level indicator and the second-level indicator is used to synthesize the first-level indicator, the method of standardization followed by equal weight addition is adopted. The standardization methods are indexation, thresholding, and percentage ranking and so on. In the sum of the process using a non-linear weighted synthesis method and equal weight method.
Urban input: sustainable competitiveness
explanatory variables of sustain able competitiveness
human capital increment human capital efficiency
GC
IN
SM
EQ SI
TI
EV
HR
P

UN-HABITAT, CASS, Center for City and Competitiveness
63
Appendix 2
About the Authors
Ni Pengfei Director of Center for City and Competitiveness, CASS; Assistant to the Director of National Academy of Economic Strategy , CASS; PhD in economics, research fellow and doctoral supervisor. Leader and Chief Urban Economist of the CASS-UN-Habitat joint research group.Specialized in theoretical and applied studies in urban economics, urban competitiveness and real estate economics.
Marco Kamiya Coordinator of Urban Economy and Finance Branch, UN-HABITAT,Chief Urban Economist of the CASS-UN-Habitat Joint Research Group,research interests: Development Economics, Public Economics. Kamiya leads global operational work on urban economy and finance and conducts research on municipal finance, the economics of urban expansion and local infrastructure-investment policy.
Peter Karl Kresl Professor of Economics in Bucknell University. Fields of research and teaching interests: economics of integration, The European Union, U.S./Canada relations, urban economies and globalization, and culture policy and trade conflict.
Han Sun Sheng Professor of Urban Planning in the Faculty of Architecture, Building and Planning at the University of Melbourne. He researches into the urban economic and spatial changes in the Asia-Pacific region and has published widely in the area of urban and regional studies.
Dai Erbiao Asian Economic Growth Research Institute, Japan. His main research fields include Urban and Regional Development, Asian Economy and Chinese Economy, and International Migration.
Lin Zujia Ph.D. in economics of the University of California, Los Angeles and professor of economics at National Chengchi University.Research interests: urban competitiveness and real estate economy.

Global Urban Competitiveness Report 2017-2018
64
Paloma Taltavull de La Paz Professor on Applied Economics Department at the University of Alicante, Spain and she has been visiting scholar at University of California at Berkeley and Georgia State University. Her research focus is in Housing Markets, Real Estate Markets and Macroeconomics.
Warren Wenzhi LU Research assistant in Division of Social Science, The Hong Kong University of Science and Technology. Warren obtained his master degree in Social Science from HKUST in 2014. Prior to joining HKUST.
Desen Lin Doctoral candidate in department of Economics, University of Pennsylvania, research interests: Macroeconomics, financial intermediation, Chinese economy.
Oswaldo Molina Professor of the Postgraduate School of the University of the Pacific, Lima, Peru. He has participated in research projects for various organisations, such as the IDB, World Bank, ILO, Overseas Development Institute, among others.
Cynthia Goythia Head of the MSc. in Urban Economics and the Urban Policy and Housing Research Center, Torcuato Di Tella University, Argentina. Fortabat Visiting Scholar at David Rockefeller Center for Latin American Studies, Harvard University, USA.
Xiao Geng Professor at University of Hong Kong and President of Hong Kong Institution for International Finance. With B.S. in Management Sciences from USTC and MA and PhD in Economics from UCLA, Research interests: China 's economy, macroeconomics, institutional economics.
Zeng Zhihua Senior economist at the World Bank. Research areas: development strategy, economic policy, industrial clusters, value chains and the latest trends in international economic and financial markets.

UN-HABITAT, CASS, Center for City and Competitiveness
65
Qin Jian deputy researcher, Ph.D. in Economics, Guangzhou Academy of Social Sciences Guangzhou City Strategy Research Institute assistant, research direction for the city and regional development strategy.
Guo Hongyu Associate professor, School of International Economics, China Foreign Affairs University. The main research areas: international trade and finance.
Wang Yufei Ph.D. in management science, lecturer at the School of Economics and Management, Beijing University of Posts and Telecommunications.Research interests: theoretical and empirical studies of regional economy and urban competitiveness.
Li Bo Ph.D. in economics of Nankai University and postdoctoral fellow of Institute of Geographic Sciences and Natural Resources Research of the Chinese Academy of Sciences, long committed to theoretical and empirical studies of urban and regional economy, resources andenvironment economy, and regional innovation.
Wang Haibo Ph .D . in economics and postdoctoral fel low at CASS National Academy of Economic Strategy.Research interests:competitiveness and real estate economy.
Gong Weij in Ph .D . in economics and postdoctoral fel low at CASS National Academy of Economic Strategy.Research interests:competitiveness and real estate economy.
Wei Jie Associate professor and Ph.D. in economics of the School of Economics and Management, Northwestern University, and postdoctoral fellow of Nanjing University.Research interests: China’s economic transformation and development. Her doctoral dissertation won the 1st China Outstanding Doctoral Dissertation Award.

Global Urban Competitiveness Report 2017-2018
66
Shen Li Doctoral candidate in finance of the Graduate School of CASS.Research interests: urban and real estate finance.
Zhou Xiaobo Ph.D. in economics of Nankai University, and postdoctoral fellow of the Agricultural Bank of China and the University of International Business and Economics.Research interest: urban finance.
Liu Xiaonan Doctoral candidate of finance of the Graduate School of CASS, specialized in the study of urban and real estate finance.
Zhang Yangzi Doctoral candidate of finance, Graduate School of CASS, specialized in the study of urban and real estate finance.
Xu Haidong Doctoral candidate in finance of the Graduate School of CASS.Research interests: urban and real estate finance.
Cao Qingfeng Ph.D. in economics of Nankai University and lecturer at the Modern Economic Management Institute, Tianjin University of Finance and Economics.Research interests: urban and regional economics and land and real estate economy.

UN-HABITAT, CASS, Center for City and Competitiveness
67
Postscript
"Global Urban Competitiveness Report 2017-2018" by the Chinese Academy of
Social Sciences Institute of Finance and Economics, Dr. Ni Pengfei and UN-HABITAT
Marco Kamiya, dozens of international and domestic well-known universities,
authoritative statistical departments, corporate R & D institutions of nearly 100 experts
to participate, After more than a year, the theory and investigation, measurement
and case studies and other empirical research results. The basic theory, index system,
research framework and important conclusions of the Global Urban Competitiveness
Report 2017-2018 are mainly made by Dr. Ni Pengfei and Marco Kamiya. Deputy editor
Wang Haibo (Institute of Finance and Economics, Chinese Academy of Social Sciences)
is responsible for reporting data collection, specific calculation, data collection,
coordination and scheduling work.
With regard to urban competitiveness, this report divides it into two parts:
economic competitiveness and sustainable competitiveness, and designs the index
system respectively. The economic competitiveness of 1007 cities in the world and the
sustainable competitiveness of 1035 cities are carried out and measured. This report,
based on the relationship between global urban competitiveness and house prices,
has written a thematic report named by "house prices, changing the city world".
The manuscript of the report is written by the author after the theory of tempering,
collecting the data, measuring and drawing the basic conclusion.
The contribution of each chapter is: Chapter 1: Annual ranking of general
global urban competitiveness in 2017-2018, The whole group; Chapter 2: Global
Urban Competitiveness of the overall report, Ni Pengfei, Marco Kamiya,Shen Li
(CASS), Gong Weiying (CASS); Chapter 3: City housing prices and competitiveness:
Research Background and Literature Review, Zhang Yangzi (CASS); Chapter 4: The
Relationship between Housing Prices and Urban Competitiveness: A Theoretical
Framework, Cao Qingfeng( Tianjin University of Finance and Economics ); Chapter
5: Global Urban Real Estate Market Status, Guo Hongyu (China Foreign Affairs
University); Chapter 6: Chapter 6 Relationship between the Housing Price and
Competitiveness :Empirical analysis, Xu Haidong, Wanghaibo; Chapter 7: City
story: House Prices and Competitiveness, Desen Lin (University of Pennsylvania),
Andrew Renninger(University of Pennsylvania),Aidan T. Thornton(Ernst & Young U.S.,
LLP),Susan M. Wachter(University of Pennsylvania),Zeng Zhihua(World Bank),Peter
Karl Kresl(Bucknell University),Zhanghao Yangzi (CASS),Han Sun Sheng (University
of Melbourne),Dai Erbiao(Asian Economic Growth Research Institute, Japan),Qin
Jian (Guangzhou Academy of Social Sciences),Lin Chu-Chia(National Chengchi
University),Xiao Geng ( University of Hongkong) ,LU Wenzhi ( Hong Kong University
of Science and Technology),Paloma Taltavull de La Paz (University of Alicante,
Spain),Marco Kamiya,Oswaldo Molina (Universidad del Pacífico, Lima),Cynthia

Global Urban Competitiveness Report 2017-2018
68
Goythia(Torcuato Di Tella University); Chapter 8 Economic Foundations for Sustainable
Urbanization: The link with Competitiveness, Marco Kamiya, Loeiz Bourdic; Chapter
9 Global urban comprehensive economic competitiveness report 2017-2018, Li Bo
(Tianjin University of Finance and Economics), Liu Xiaonan (CASS); Chapter 10 Global
urban Sustainable Competitiveness report 2017-2018, Wang Yufei(Beijing University
of Posts and Telecommunications), Zhou Xiaobo (the Agricultural Bank of China and
the University of International Business and Economics), Wei Jie (China Northwestern
University); Appendix: Ni Pengfei, Wang Haibo.
"Global Urban Competitiveness Report 2017-2018" and the study of global
urban competitiveness have been reported by consultants and many institutions and
individuals with sincere and unselfish support. We express our admiration, respect and
thanks for all the support and care of this research unit and person.
Ni Pengfei、Marco Kamiya
October 24, 2017

Annual ranking of general global urban competitiveness 2017-2018
(Top 200)
Metropolitan area
Metropo
litan
area evel
Country/Area
Economic
Competitivenes
s Index
Rank
Sustainable
Competitiveness
Index
Rank
New York A+ United States 1.0000 1 1.0000 1
Los Angeles A United States 0.9992 2 0.6519 16
Singapore A Singapore 0.9708 3 0.7082 5
London A+ United Kingdom 0.9578 4 0.8756 2
San Francisco A United States 0.9408 5 0.6554 14
Shenzhen B China 0.9337 6 0.5761 35
Tokyo A- Japan 0.9205 7 0.7371 3
San Jose A United States 0.9158 8 0.6342 22
Munich B+ Germany 0.9053 9 0.6402 18
Dallas A- United States 0.9026 10 0.5805 32
Houston A- United States 0.9000 11 0.6792 8
Hong Kong A Hong Kong,China 0.8873 12 0.6581 13
Seoul A- Korea, South 0.8478 13 0.7023 7
Shanghai A- China 0.8367 14 0.6110 27
Guangzhou B+ China 0.8346 15 0.5746 36
Miami B+ United States 0.8162 16 0.5305 53
Chicago A- United States 0.8151 17 0.6711 10
Boston A- United States 0.8121 18 0.7166 4
Dublin A- Ireland 0.8109 19 0.5796 33
Beijing A- China 0.8102 20 0.6708 11
Paris A- France 0.8060 21 0.6771 9
Frankfurt A- Germany 0.7993 22 0.6305 23
Tianjin B- China 0.7866 23 0.4735 93
Stockholm B+ Sweden 0.7862 24 0.6373 21
Philadelphia B+ United States 0.7837 25 0.6232 24
Seattle B+ United States 0.7808 26 0.6530 15
Kinki B- Japan 0.7699 27 0.5826 31
Suzhou C+ China 0.7648 28 0.4227 160
Stamford B United States 0.7644 29 0.4751 90
Tel Aviv-Yafo B- Israel 0.7642 30 0.4018 189
Baltimore B- United States 0.7602 31 0.5738 37

Metropolitan area
Metropo
litan
area evel
Country/Area
Economic
Competitivenes
s Index
Rank
Sustainable
Competitiveness
Index
Rank
Stuttgart B- Germany 0.7497 32 0.5482 48
Istanbul B Turkey 0.7480 33 0.5850 30
Geneva B Switzerland 0.7449 34 0.5496 47
Toronto B+ Canada 0.7414 35 0.6431 17
Cleveland B- United States 0.7366 36 0.4779 85
Atlanta B+ United States 0.7351 37 0.6397 19
Dusseldorf B- Germany 0.7333 38 0.5187 62
Perth B Australia 0.7326 39 0.4413 131
Wuhan C+ China 0.7310 40 0.4535 116
Vienna B- Austria 0.7300 41 0.5690 41
San Diego B United States 0.7291 42 0.6148 25
Denver B United States 0.7272 43 0.4879 76
Nanjing B- China 0.7261 44 0.4845 79
Doha B- Qatar 0.7261 45 0.4358 140
Detroit B- United States 0.7247 46 0.4652 102
Taipei B- Taiwan,China 0.7232 47 0.5255 57
Hamburg B- Germany 0.7175 48 0.5587 45
Cologne C+ Germany 0.7151 49 0.4867 77
Zurich A- Switzerland 0.7147 50 0.7063 6
Nashville B- United States 0.7132 51 0.4085 178
Minneapolis A- United States 0.7090 52 0.5346 51
Berlin C+ Germany 0.7055 53 0.5628 43
Charlotte B- United States 0.7048 54 0.5062 67
Moscow B Russia 0.7042 55 0.5231 59
Las Vegas C+ United States 0.6990 56 0.4154 168
Raleigh C+ United States 0.6973 57 0.5111 66
Abu Dhabi B+ United Arab Emirates 0.6959 58 0.5198 60
Milwaukee C+ United States 0.6908 59 0.4083 180
Austin B- United States 0.6835 60 0.5736 38
Salt Lake City C+ United States 0.6816 61 0.5263 56
Chengdu C+ China 0.6775 62 0.4315 148
Copenhagen B Denmark 0.6773 63 0.6016 29
Orlando C+ United States 0.6772 64 0.4815 82
Sydney A- Australia 0.6730 65 0.6071 28
Richmond C+ United States 0.6704 66 0.4558 112
Dubai B+ United Arab Emirates 0.6701 67 0.4982 71

Metropolitan area
Metropo
litan
area evel
Country/Area
Economic
Competitivenes
s Index
Rank
Sustainable
Competitiveness
Index
Rank
Wuxi C- China 0.6697 68 0.3553 268
Birmingham B- United Kingdom 0.6694 69 0.5170 63
Brussels B Belgium 0.6657 70 0.5311 52
Changsha C China 0.6657 71 0.4125 173
Hannover C Germany 0.6655 72 0.4668 100
Vancouver B- Canada 0.6616 73 0.5709 40
Hangzhou C+ China 0.6601 74 0.4655 101
Essen C Germany 0.6598 75 0.4688 98
Columbus B- United States 0.6597 76 0.4752 89
Riyadh B- Saudi Arabia 0.6589 77 0.3924 202
Baton Rouge C+ United States 0.6586 78 0.4083 179
Louisville C+ United States 0.6585 79 0.3804 224
Barcelona B- Spain 0.6580 80 0.5714 39
Calgary B- Canada 0.6557 81 0.5444 49
Ulsan C Korea, South 0.6527 82 0.4525 117
Oslo A- Norway 0.6513 83 0.6138 26
Manchester C+ United Kingdom 0.6471 84 0.5762 34
Qingdao C+ China 0.6462 85 0.4202 164
Chongqing C+ China 0.6461 86 0.4545 114
Dortmund C+ Germany 0.6454 87 0.4673 99
Chukyo C+ Japan 0.6451 88 0.5051 69
Kuala Lumpur B- Malaysia 0.6351 89 0.4773 86
Amsterdam B+ Netherlands 0.6346 90 0.6378 20
Foshan C China 0.6319 91 0.3805 221
Antwerp C+ Belgium 0.6285 92 0.4118 174
Washington A- United States 0.6257 93 0.6606 12
Oklahoma City C+ United States 0.6228 94 0.3890 209
Sendai C Japan 0.6186 95 0.4514 118
Melbourne B Australia 0.6182 96 0.5376 50
Virginia Beach C United States 0.6165 97 0.3850 214
Phoenix C+ United States 0.6160 98 0.4453 127
Zhengzhou C China 0.6151 99 0.3824 217
Tampa C+ United States 0.6149 100 0.4220 161
Ningbo C China 0.6144 101 0.3625 258
Changzhou C China 0.6125 102 0.3450 289
Jedda C Saudi Arabia 0.6075 103 0.3359 303
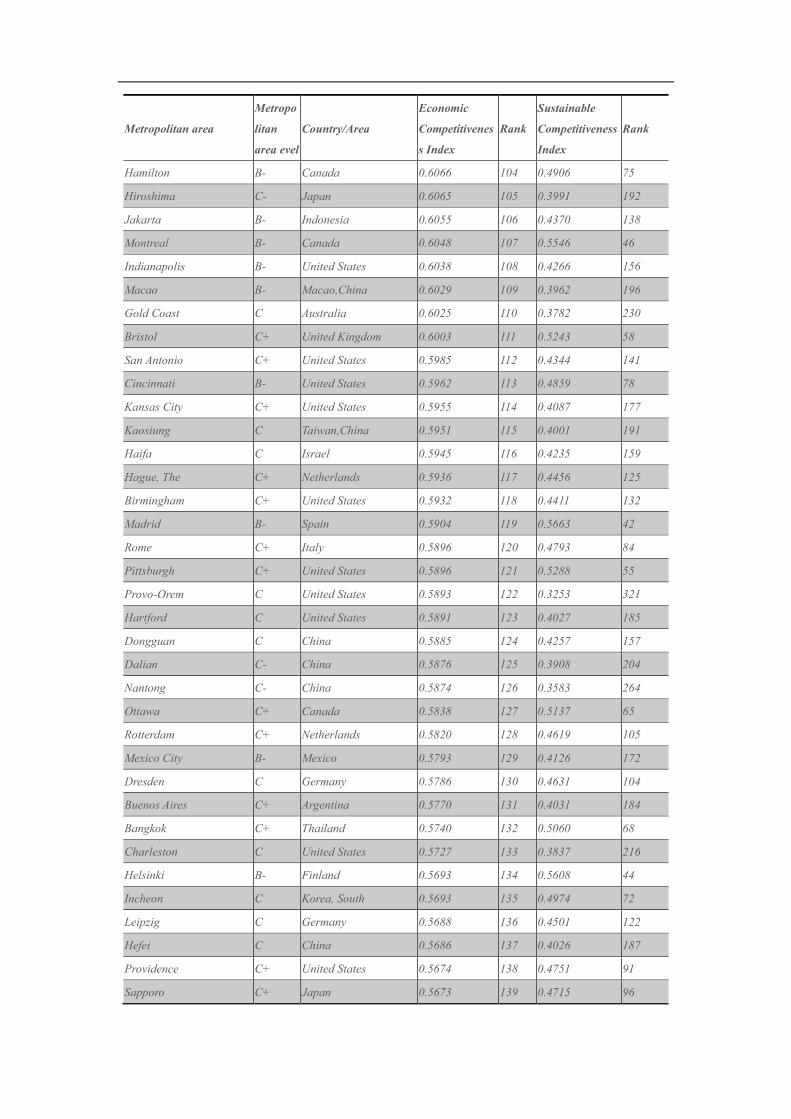
Metropolitan area
Metropo
litan
area evel
Country/Area
Economic
Competitivenes
s Index
Rank
Sustainable
Competitiveness
Index
Rank
Hamilton B- Canada 0.6066 104 0.4906 75
Hiroshima C- Japan 0.6065 105 0.3991 192
Jakarta B- Indonesia 0.6055 106 0.4370 138
Montreal B- Canada 0.6048 107 0.5546 46
Indianapolis B- United States 0.6038 108 0.4266 156
Macao B- Macao,China 0.6029 109 0.3962 196
Gold Coast C Australia 0.6025 110 0.3782 230
Bristol C+ United Kingdom 0.6003 111 0.5243 58
San Antonio C+ United States 0.5985 112 0.4344 141
Cincinnati B- United States 0.5962 113 0.4859 78
Kansas City C+ United States 0.5955 114 0.4087 177
Kaosiung C Taiwan,China 0.5951 115 0.4001 191
Haifa C Israel 0.5945 116 0.4235 159
Hague, The C+ Netherlands 0.5936 117 0.4456 125
Birmingham C+ United States 0.5932 118 0.4411 132
Madrid B- Spain 0.5904 119 0.5663 42
Rome C+ Italy 0.5896 120 0.4793 84
Pittsburgh C+ United States 0.5896 121 0.5288 55
Provo-Orem C United States 0.5893 122 0.3253 321
Hartford C United States 0.5891 123 0.4027 185
Dongguan C China 0.5885 124 0.4257 157
Dalian C- China 0.5876 125 0.3908 204
Nantong C- China 0.5874 126 0.3583 264
Ottawa C+ Canada 0.5838 127 0.5137 65
Rotterdam C+ Netherlands 0.5820 128 0.4619 105
Mexico City B- Mexico 0.5793 129 0.4126 172
Dresden C Germany 0.5786 130 0.4631 104
Buenos Aires C+ Argentina 0.5770 131 0.4031 184
Bangkok C+ Thailand 0.5740 132 0.5060 68
Charleston C United States 0.5727 133 0.3837 216
Helsinki B- Finland 0.5693 134 0.5608 44
Incheon C Korea, South 0.5693 135 0.4974 72
Leipzig C Germany 0.5688 136 0.4501 122
Hefei C China 0.5686 137 0.4026 187
Providence C+ United States 0.5674 138 0.4751 91
Sapporo C+ Japan 0.5673 139 0.4715 96

Metropolitan area
Metropo
litan
area evel
Country/Area
Economic
Competitivenes
s Index
Rank
Sustainable
Competitiveness
Index
Rank
Glasgow C+ United Kingdom 0.5665 140 0.4972 73
Xiamen C China 0.5660 141 0.4692 97
Brisbane C Australia 0.5660 142 0.5192 61
Milan B- Italy 0.5657 143 0.4970 74
Allentown C United States 0.5649 144 0.3526 273
Lille C- France 0.5626 145 0.3902 206
Worcester C+ United States 0.5623 146 0.4336 145
Colorado Springs C United States 0.5606 147 0.3458 286
West Yorkshire C United Kingdom 0.5590 148 0.4285 152
Riverside-San Bernardino C United States 0.5584 149 0.3707 240
Jinan C China 0.5570 150 0.3949 197
Grand Rapids C United States 0.5570 151 0.3768 232
Gothenburg C+ Sweden 0.5559 152 0.4750 92
San Jose C Costa Rica 0.5554 153 0.3093 347
Liverpool C+ United Kingdom 0.5538 154 0.4570 109
Zhenjiang C- China 0.5518 155 0.3234 323
Quanzhou C- China 0.5513 156 0.3383 298
New Haven C United States 0.5455 157 0.5018 70
Xi'an C China 0.5454 158 0.4043 182
Shenyang C China 0.5442 159 0.3876 211
Dayton C United States 0.5431 160 0.3891 208
Edmonton C Canada 0.5429 161 0.4808 83
Fuzhou(Fj) C- China 0.5420 162 0.3706 242
Changwon C- Korea, South 0.5415 163 0.4252 158
Lyon C+ France 0.5413 164 0.4838 80
Fort Myers C United States 0.5399 165 0.3261 319
Yantai C- China 0.5391 166 0.3628 257
Knoxville C United States 0.5388 167 0.4214 162
Samut Prakan C- Thailand 0.5386 168 0.3632 255
Fukuoka C Japan 0.5373 169 0.4368 139
Honolulu C+ United States 0.5371 170 0.3494 277
Columbia C United States 0.5371 171 0.4303 149
Zhongshan C- China 0.5371 172 0.3881 210
Santiago C+ Chile 0.5364 173 0.3665 245
Mecca C- Saudi Arabia 0.5363 174 0.2905 408
Medina C- Saudi Arabia 0.5352 175 0.3274 315
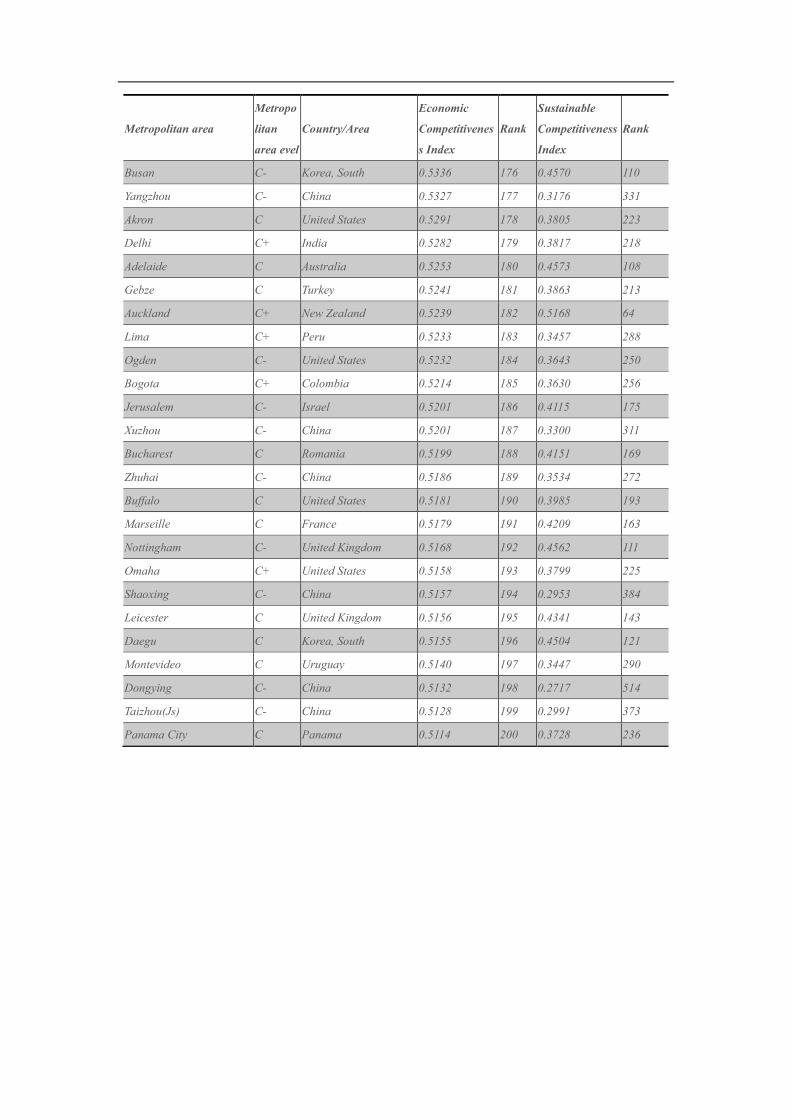
Metropolitan area
Metropo
litan
area evel
Country/Area
Economic
Competitivenes
s Index
Rank
Sustainable
Competitiveness
Index
Rank
Busan C- Korea, South 0.5336 176 0.4570 110
Yangzhou C- China 0.5327 177 0.3176 331
Akron C United States 0.5291 178 0.3805 223
Delhi C+ India 0.5282 179 0.3817 218
Adelaide C Australia 0.5253 180 0.4573 108
Gebze C Turkey 0.5241 181 0.3863 213
Auckland C+ New Zealand 0.5239 182 0.5168 64
Lima C+ Peru 0.5233 183 0.3457 288
Ogden C- United States 0.5232 184 0.3643 250
Bogota C+ Colombia 0.5214 185 0.3630 256
Jerusalem C- Israel 0.5201 186 0.4115 175
Xuzhou C- China 0.5201 187 0.3300 311
Bucharest C Romania 0.5199 188 0.4151 169
Zhuhai C- China 0.5186 189 0.3534 272
Buffalo C United States 0.5181 190 0.3985 193
Marseille C France 0.5179 191 0.4209 163
Nottingham C- United Kingdom 0.5168 192 0.4562 111
Omaha C+ United States 0.5158 193 0.3799 225
Shaoxing C- China 0.5157 194 0.2953 384
Leicester C United Kingdom 0.5156 195 0.4341 143
Daegu C Korea, South 0.5155 196 0.4504 121
Montevideo C Uruguay 0.5140 197 0.3447 290
Dongying C- China 0.5132 198 0.2717 514
Taizhou(Js) C- China 0.5128 199 0.2991 373
Panama City C Panama 0.5114 200 0.3728 236