the government of the republic of uganda - ministry of...
TRANSCRIPT

The Government of the Republic of
Uganda
National Biomass Energy Demand Strategy
2001 – 2010
Draft Document
Ministry of Energy and Mineral Development
P.O.Box 7270
Kampala
June 2001

2
Table of Contents
1. Introduction
2. Background
3. Review of Energy and Forestry Sector Policies and Plans
3.1 Review of the National Energy Policy
3.2 Review of the Forestry Policy and National Forest Plan
3.3 Review of the National Environment Action Plan (NEAP)
4. Biomass Energy Flows
4.1 Forestry
4.1.1 Land Cover Distribution and Biomass Production
4.1.2 Woody Biomass Availability
4.1.3 Mean Annual Increment and Sustainable Yields
4.2 Agriculture
4.2.1 Crops: Areas and Production
4.2.2 Agricultural Residues
4.3 Livestock
4.4 Total Biomass Production and Use
4.5 Conclusion
5. Current Biomass Initiatives and Barriers
5.1 Ministry of Energy and Mineral Development
5.2 Rwenzori Highlands Tea Company
5.3 British American Tobacco/Universal Leaf Tobacco
5.4 Joint Energy and Environment Project (JEEP)
5.5 Integrated Rural Development Initiatives (IRDI)
5.6 Renewable Energy Development Centre
5.7 Nyabyeya Forestry College
5.8 National Environment Management Authority
5.9 Others
3
5.10 Key Barriers
6. Framework for a Biomass Energy Strategy
6.1 Objectives of the Strategy
6.2 Institutional Aspects
6.3 Human Resource Development
6.4 Mobilizing Financial Resources
6.5 Dissemination and Awareness
6.6 Quality Control
6.7 Research
6.8 Key Actors and their Roles
7. Targets and Funding Requirements
8. Implementation Plan
9. Conclusion
Annex
A. Matrix of Technical Solutions
B. NBEDS - Stakeholders
C. List of Abbreviations
D. Biomass Production
E. Crop Areas and Production
F. Crop Residue Production
G. Cash Crop Production of Residues
H. Animal Numbers and Waste Production
4
1. Introduction
In 1999 the MEMD began a process of formulating a new policy for the energy sector. TheNational Energy Policy for Uganda – Uganda 21 has been completed and approved byCabinet in …2001. This energy policy is unique in that it includes a section on biomassenergy. Revision of the Forest Policy began in 1998. The draft Forest policy has beenapproved by cabinet and is yet to be passed by Parliament after careful scrutiny. Both thenew and old policies (1988) attempt to address biomass issues. Chapter 3 reviews the draftenergy and forest policies. The Forest sector has gone further to develop a National ForestPlan which is also reviewed in the same chapter. The National Environment Action Plan isalso reviewed in Chapter 3. The purpose of reviewing these documents was to identifystrategies that address biomass energy and use them to develop a concise National BiomassEnergy Demand Strategy (NBEDS).
The National Biomass Study (NBS) of the Forest Department has collected data on biomassdistribution throughout the country since 1989. This information is useful for planning forbiomass supply. In addition, information on crop distribution and acreage; and, livestockstocking rates can be used to establish how much agricultural residues are available forenergy production. It should be noted that use of agricultural residues for energy productionshould not in any way compromise its priority use as a natural fertiliser since the averagefarmer in Uganda cannot afford commercial fertilisers. Chapter 4 provides a detailed reviewof biomass energy flows in Uganda.
The MEMD has developed strategies for rural electrification, petroleum supply and energyefficiency. Despite the importance of biomass in the national energy balance accounting for93% of total energy consumption there is no comprehensive biomass energy demandstrategy. Wood is the predominant source of energy for cooking in both the residential andinstitutional sectors; and, process heat in the industrial sector consuming about 30% ofcommercial fuelwood. Charcoal production and consumption is an important part of theeconomy supplying most urban areas with cooking fuel and generating about 20,000 full timejobs. It is believed that biomass resources are being depleted at a higher rate than productionbut data are insufficient to prove this view. In addition, land under biomass production isregularly converted to farmland, which is sometimes devoid of trees. The MEMD and otheractors have implemented isolated biomass projects. Chapter 5 reviews some selected biomassinitiatives and discusses barriers to implementation.
This strategy attempts to synchronise the energy strategies in the energy policy, the nationalforest plan and the national environment plan. The proposed biomass energy strategy hasbeen formulated on 6 major principles namely:
• Institutional aspects;• Human resource development;• Mobilising financial resources;• Dissemination and awareness;• Quality control; and• Research.
5
It is envisaged that these principles will be developed further by stakeholders before MEMDdevelops the final strategy.
Chapter 7 looks at targets where by it is anticipated that in 10 years the impact ofimplementing this strategy will be realised. It gives a first estimation on the implementationcost of the strategy for the period 2001-2010. Chapter 8 provides an implementation Plan.
2. Background
Uganda’s economic performance in the past decade has been impressive at least on a macro-economic level. The average real rate of GDP growth has been 6.4% per annum since 1991,resulting in an annual 3.3% increase in real GDP per capita. Nevertheless progress in socialand human development has been relatively modest.
The Government of Uganda (GoU) has responded to the poverty challenges by preparing acomprehensive medium-term development strategy, the Poverty Eradication Action Plan(PEAP). Since 1997 the PEAP has guided government policies and expenditure allocation.Since 1997/98 GoU has used the Medium Term Expenditure Framework (MTEF) to align theallocation of public resources with spending priorities articulated in the PEAP.
GoU’s strategy for economic transformation and poverty reduction is based on four keypillars:• Creating an enabling environment for economic growth and structural transformation;• Ensuring good governance and security;• Directly increasing the ability of the poor to raise their incomes through rural
development and expansion of non-farm activities; and• Directly increasing the quality of life of the poor through the provision of primary
education, health care, and water and sanitation services.
There are still many issues making the country vulnerable: sustainability of economic growth;exports dependence on agriculture weakened by droughts; plant diseases and pricefluctuations (coffee); corruption; weak tax administration; decentralization not properlyoperational; and inadequate financial services. The high population growth rate is a mainobstacle to achieve the objectives of most of the development sectoral programmes.
Even if the living standards of Uganda’s poor substantially increased, 35% of the populationstill live below the poverty line, and significant regional disparities in poverty exist.Specifically, the poor in Uganda are concerned with the lack of access to basic services(health care, education, safe water, sanitation and energy), land, and production inputs.
The Constitution of Uganda, 1995 recognises the need for an energy policy oriented to thepoor when it states “The State shall promote and implement energy policies that will ensurethat people’s basic needs and those of environmental preservation are met”. The importanceof energy for the poor and the development of Uganda is recognised in the revised PEAP,2000. Energy has a direct impact on poverty alleviation. Improved electricity supply isexpected to further poverty alleviation goals through both the promotion of private sector

6
driven economic growth and via direct poverty impacts. The link between energy and theintroduction of new technologies for agro-processing in rural areas is especially relevant toGovernment’s Plan for Modernisation of Agriculture. The PEAP also highlights the linkbetween energy and basic needs and notes that the dependence on fuelwood increases theburden on women’s time and causes environmental degradation and that the first step inclimbing the energy ladder is the use of improved cooking technologies and the introductionof more efficient methods for charcoal and lime production.
93% of the energy consumption in Uganda is woodfuel (firewood and charcoal) andagricultural wastes. 95% of the wood supply in Uganda is for energy consumption. Wood asa source of energy has the following characteristics:• Wood is the energy in rural and urban areas and among the poor (only 1% of rural
population had access to electricity in year 2000);.• Scarcity of fuelwood is affecting the nutritional value of the population as people opt fot
quick cooking foods, like vegetables instead of beans, peas, etc.• Commercial woody biomass sector is very important for the national economy and the
industrial sector; it employs tens of thousands of people, adds hundreds of millions ofUSh to local economies (revenues, taxes, and incomes). Local revenue authority collectsabout USh 2 billion on charcoal movement alone. Forest Department collects betweenUSh 2.3 and 5.3 billion in terms of permits and licences. This importance is not reflectedin Uganda Revenue Authority policy documents, in Ministry of Finance, Planning andEconomic Development (MFPED) policies or in Forest Department plans.
• Wood is a renewable source of energy as far as its exploitation and use is done on asustainable manner; it is vital for food security (used in cooking).
• Wood is widely used in many industrial processes (brick and tile making, limeproduction, tea drying and tobacco curing, and food processing) and in the majority ofinstitutions (prisons, schools, health centers) and commerce (restaurants, hotels andbakeries).
• Wood saves the country tens of millions of US$ in foreign exchange yearly. If allUgandan industries now using wood converted to petroleum products, Uganda’s importbill would increase by over US$ 150 million per year. Wood supplies five times the valueof electricity and petroleum utilised by Uganda’s industrial sector; wood accounting forUSh 10 billion compared with USh 1 billion for electricity and USh 1 billion forpetroleum.
• Wood has a limited dependency on foreign currency.
Wood fuel will continue to be the dominant source of energy in Uganda for the foreseeablefuture. Even if the entire hydroelectric potential in Uganda was fully utilized (about 2000MW), wood would supply more than 75% of the total energy consumption in year 2015.
Charcoal production consumes 15-20% of the wood supply in Uganda and is mainlyconsumed in urban areas. Charcoal is also a by-product of land clearance for crop or livestockdevelopment. When the wood from agricultural expansion is not utilized for charcoal, it isoften burned on site. The production of charcoal in Uganda is based on simple methods witha very low efficiency (between 8 and 12% recovery).
Ugandan households generally utilize woody biomass inefficiently. The usage of improvedwood stoves and other energy sources (LPG, solar energy, biogas, kerosene, electricity) is

7
limited in most areas. A few institutions such as schools have converted from open fires toimproved cooking stoves. A few high income households and expatriates use LPG andelectricity for cooking.
Different studies show that the relative prices of wood and charcoal have dropped vis-à-visevery major important urban household commodity. Relative to the urban household“consumer basket” of goods and services, charcoal’s price has risen less than any other majorcommodity. In Kampala the market efficiently supplies the consumer with a steady,uninterrupted supplies of fuelwood and charcoal at relative low prices. However, these lowprices are below their economic cost, due to the fact that fuelwood taxes and fiscalcompliance rate are low and that so much charcoal is coming into urban areas as a result ofrapidly increasing land clearing for grazing and agriculture. This is also confirmed inMbarara where the price of the charcoal bag has reduced from USh 12,000 to 8,000,following an increase in the number of charcoal traders especially the wholesalers usinglorries. Thus, economic incentives to conserve wood and charcoal have diminished over thepast five years. The taxation of woodfuels serves no regulatory objective. That means thatprice or financial incentives to purchase more energy efficient stoves diminished.
8
3. Review of Energy and Forestry Sector Policies and Plans
3.1 Review of the National Energy Policy (2001)
The energy sector has historically placed emphasis on policies which address supply ofcommercial sources of energy, giving little attention to biomass which is the major source ofenergy in the country.
The main goal of the new National Energy Policy is to meet the energy needs of the Ugandanpopulation for social and economic development on an environmentally sustainable way andthe second objective is to increase access to modern affordable and reliable energy services asa contribution to poverty eradication. On the demand side the main objective for householdsand institutions is to provide of affordable energy services for households and communitybasic services including water supply and sanitation, health, education, public lighting andcommunication in order to improve the social welfare of the rural population.
The specific objectives for this sector are to:
• Achieve a sustainable level of energy security for low-income households so as to reducepoverty at household level;
• Improve the efficiency in the use of biomass resources, recognizing that biomass willremain a dominant source of energy, especially in the rural areas, for the foreseeablefuture;
• Specifically target provision of energy to productive activities such as home-basedindustries in order to directly raise household incomes; and
• Sensitise women on energy source and technology choices in order to reduce the laborand health burdens associated with biomass energy use.
The National Energy Policy recognizes the role energy supply improvement in rural areas islikely to play thus the need to include biomass in the realms of national energy planning.
It also recognizes that wood fuel harvesting contributes to degradation of forests as woodreserves are depleted at a rapid rate in many regions, the impact on the environment, health ofend-users and the burden of collecting firewood on women and children as a result ofincreased use of biomass energy. In some parts of the country wood fuels are now scarce.This could be addressed to some extent through demand side management, which includesthe use of energy efficient devices and alternative sources.
There is insufficient data on demand and supply of biomass fuels in the country and lack ofawareness about the potential for biomass energy technologies. The policy viewsreinforcement of database on biomass especially demand as a major thrust for planningpurposes.
The policy recognizes the inadequacies within government institutions to plan for andmonitor the sub-sector, and conduct R&D. The energy policy plans to increase private sectorparticipation through use of smart subsidies particularly for improvement in efficiency and

9
technology acquisition. Emphasis would be placed on improving efficiency of biomass usealong the production to end-use chain.
The energy policy proposes strategies to address demand side sectors namely household andinstitutions, industry and commerce, transport and agriculture. Energy efficiency is the majorthrust in demand side management. In addition the policy proposes strategies to addresssupply sub-sectors namely the power sub-sector, the petroleum sub-sector and the biomassand other renewable energy sub-sector. The major objective of the biomass and otherrenewable energy strategy is provision of focused support for the development, promotionand use of renewable energy resources for both small and large-scale applications.
The Energy Department has prepared strategies and plans for the other sub-sectors. This isthe first initiative in planning for the biomass demand sub-sector. However, the MEMDsupports already the implementation of biomass demand projects one of, which is describedin chapter 5.
3.2 Review of the Forestry Policy and National Forest Plan
Uganda’s forests and woodlands are viewed as the mainstay in the three pillars of sustainabledevelopment: economics, society and the environment. The forest policy recognizes thatUganda’s forest resources provide energy, supplying 93% of national energy demand.
Gazetted forest reserves, which cover about 40% of total forest area in the country are not themajor source of biomass energy for current and future demand. About 35 million m3 offirewood are consumed annually way above the total annual allowable cut of 350,000 m3 forall reserved forests. Since these forest still have growing stock it implies that bulk of biomassused for energy is mainly obtained from areas outside forest reserves. However, it is notdocumented as to how much of this quantity is supplied by gazetted forests.
The forest policy views farm forestry as major strategy in ensuring adequate supply ofbiomass energy. The forest sectors role would be provision of adequate, clean seed andadvisory services to extensionists based at sub-county level. The planned extension service(NAADS) is the major link to subsistence farmers thorough out the country. The policy alsoplans to take advantage of governments commitment to promote and develop farm forestrythrough the Plan for Modernization of Agriculture.
The use of forestry waste as a source of energy is not addressed. This may be implied sincethere are no planned energy plantations yet forest reserves are expected to supply somefuelwood as outlined in the National Forest Authority Business Plan. The tops and branchesfrom logging operations would be sold as wood fuel. This fuelwood would be obtained fromproduction working cycles as stipulated in the management plans for specific forest reserves.
The forest policy mentions collaboration with stakeholders but no clear strategy ishighlighted. These include the poor rural and urban population, those working in woodindustries, consumers of forest products, servants of the sector and the wider national andinternational public. The policy specifies collaboration with the agriculture, land use, water,wildlife, industry and energy sectors.

10
Energy issues are recognized as cutting across a number of sectors. Stakeholder participationhas been used in preparation of the National Forest Action Plan, spearheaded by the UgandaForest Sector Coordination Unit. For instance working group 3, which addresses woodprocessing, plantations and biomass energy issues includes stakeholders from other sectorsincluding the Energy Department. The biomass energy aspects of the National Forest Planconcentrate on strategies for improving energy efficiency in the household, charcoalproduction and industrial (where wood is source of energy) sectors. It stipulates the need todevelop a biomass energy demand strategy. If biomass energy supply is considered to be partand parcel of plantations, woodlots and farm forestry, this should be explicit in the plan.
3.3 Review of the National Environment Action Plan (NEAP)
11
4. Biomass Energy Flows
In order to conceptualise the issue of biomass energy flows, it is pertinent to get data on:• General land cover (use) and biomass density;• Forestry; and• Agricultural crops and animal wastes.
Data on the first two were provided by the National Biomass Study project, which has beenassessing Uganda's woody biomass resource since 1989. Data on crop and animal productionwas obtained from the Ministry of Agriculture, Animal Industry and Fisheries.
4.1 Forestry
Woodfuel (firewood and charcoal) on both non-commercial and commercial basis constitutes88% of energy consumed in the country. Basically any dry material can be used as a sourceof woodfuel. Sources of these dry materials are mainly trees and bushes, which occur in alltypes of land cover (use) e.g. forests, woodlands, bushlands, agricultural farms etc. Howeveruntil recently there has been no assessment of these land cover types and production ofbiomass for energy. It was until 1996 that the National Biomass Study project published thestatus of Uganda’s land cover and woody biomass status. The results of this study formed thebasis for calculating the supply side of the biomass energy flows for this policy.
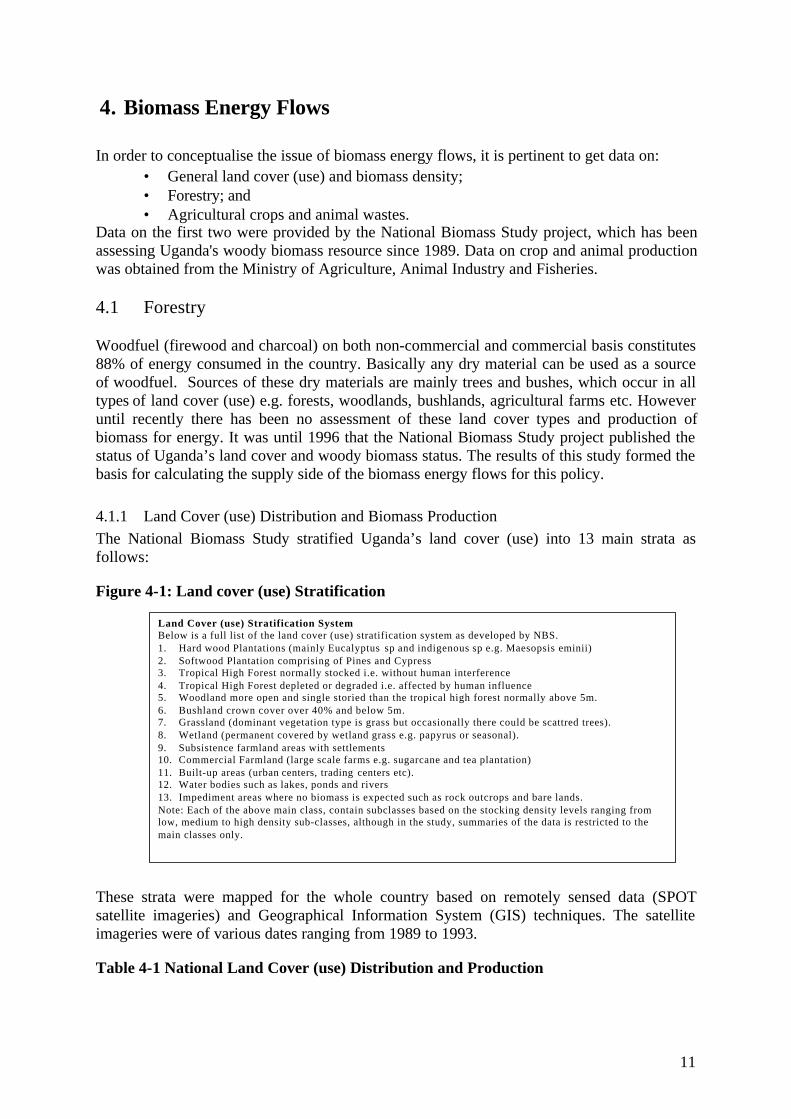
4.1.1 Land Cover (use) Distribution and Biomass ProductionThe National Biomass Study stratified Uganda’s land cover (use) into 13 main strata asfollows:
Figure 4-1: Land cover (use) Stratification
These strata were mapped for the whole country based on remotely sensed data (SPOTsatellite imageries) and Geographical Information System (GIS) techniques. The satelliteimageries were of various dates ranging from 1989 to 1993.
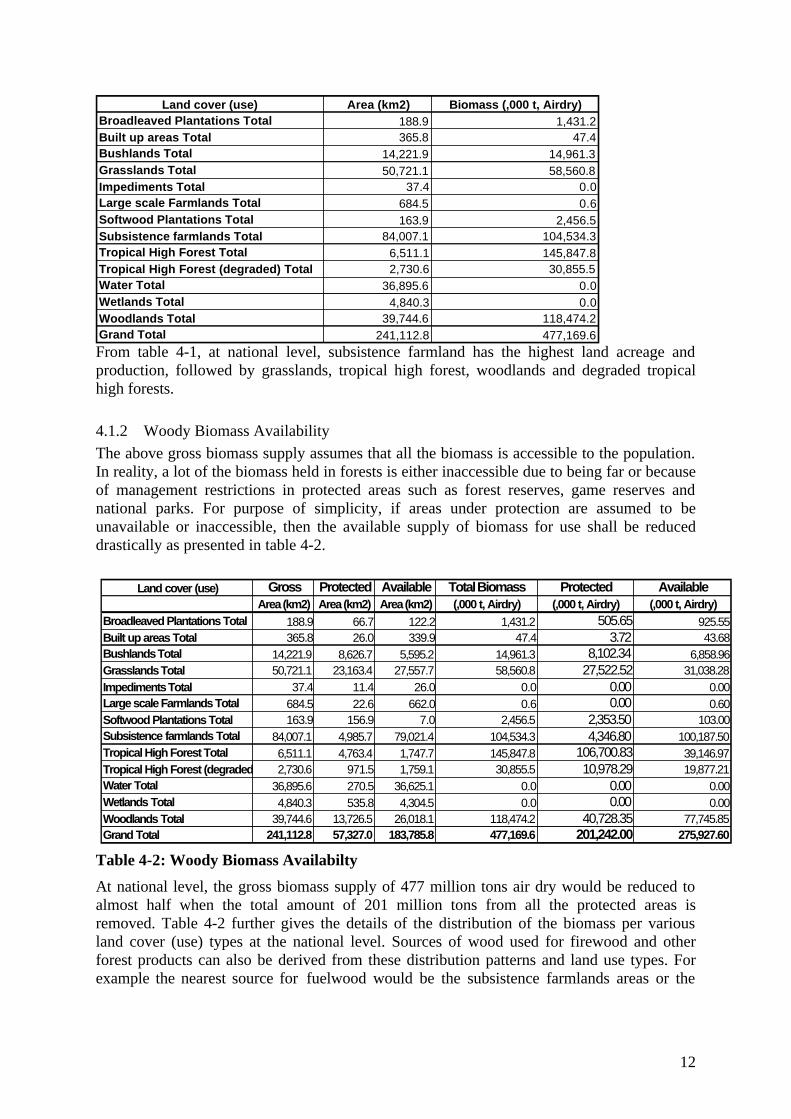
Table 4-1 National Land Cover (use) Distribution and Production
Land Cover (use) Stratification SystemBelow is a full list of the land cover (use) stratification system as developed by NBS.1. Hard wood Plantations (mainly Eucalyptus sp and indigenous sp e.g. Maesopsis eminii)2. Softwood Plantation comprising of Pines and Cypress3. Tropical High Forest normally stocked i.e. without human interference4. Tropical High Forest depleted or degraded i.e. affected by human influence5. Woodland more open and single storied than the tropical high forest normally above 5m.6. Bushland crown cover over 40% and below 5m.7. Grassland (dominant vegetation type is grass but occasionally there could be scattred trees).8. Wetland (permanent covered by wetland grass e.g. papyrus or seasonal).9. Subsistence farmland areas with settlements10. Commercial Farmland (large scale farms e.g. sugarcane and tea plantation)11. Built-up areas (urban centers, trading centers etc).12. Water bodies such as lakes, ponds and rivers13. Impediment areas where no biomass is expected such as rock outcrops and bare lands.Note: Each of the above main class, contain subclasses based on the stocking density levels ranging fromlow, medium to high density sub-classes, although in the study, summaries of the data is restricted to themain classes only.
12
From table 4-1, at national level, subsistence farmland has the highest land acreage andproduction, followed by grasslands, tropical high forest, woodlands and degraded tropicalhigh forests.
4.1.2 Woody Biomass AvailabilityThe above gross biomass supply assumes that all the biomass is accessible to the population.In reality, a lot of the biomass held in forests is either inaccessible due to being far or becauseof management restrictions in protected areas such as forest reserves, game reserves andnational parks. For purpose of simplicity, if areas under protection are assumed to beunavailable or inaccessible, then the available supply of biomass for use shall be reduceddrastically as presented in table 4-2.
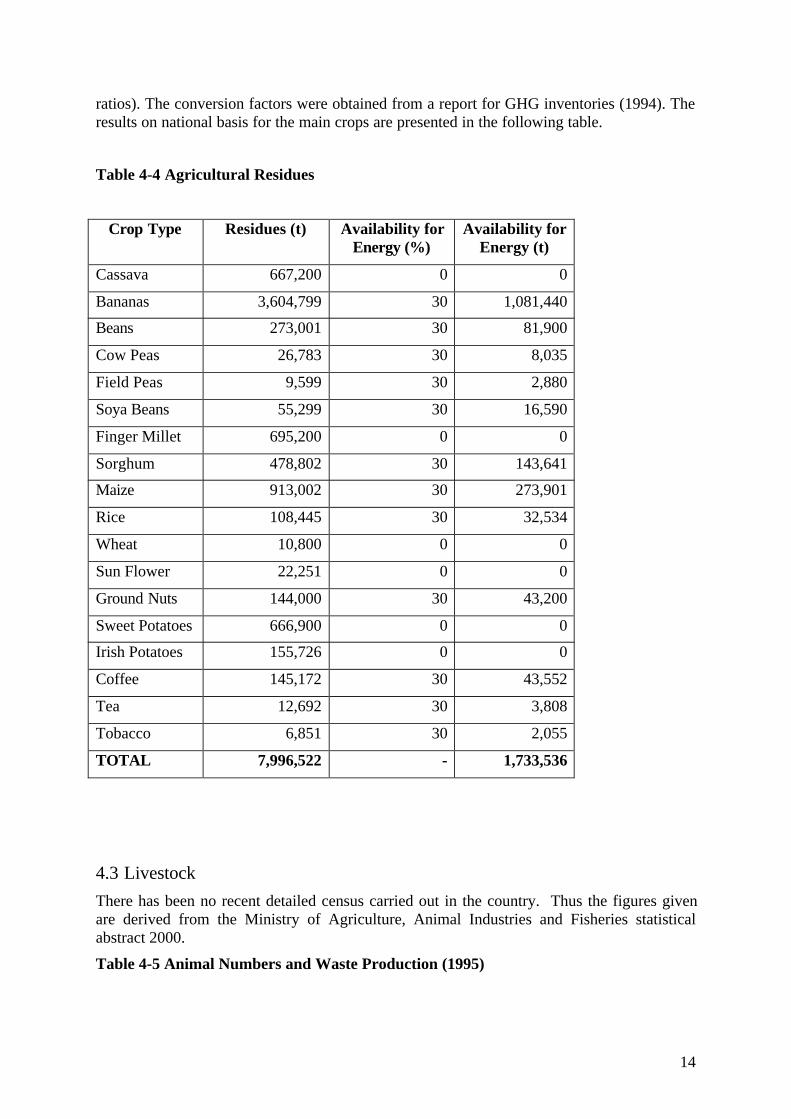
Table 4-2: Woody Biomass Availabilty
At national level, the gross biomass supply of 477 million tons air dry would be reduced toalmost half when the total amount of 201 million tons from all the protected areas isremoved. Table 4-2 further gives the details of the distribution of the biomass per variousland cover (use) types at the national level. Sources of wood used for firewood and otherforest products can also be derived from these distribution patterns and land use types. Forexample the nearest source for fuelwood would be the subsistence farmlands areas or the
Land cover (use) Area (km2) Biomass (,000 t, Airdry)Broadleaved Plantations Total 188.9 1,431.2Built up areas Total 365.8 47.4Bushlands Total 14,221.9 14,961.3Grasslands Total 50,721.1 58,560.8Impediments Total 37.4 0.0Large scale Farmlands Total 684.5 0.6Softwood Plantations Total 163.9 2,456.5Subsistence farmlands Total 84,007.1 104,534.3Tropical High Forest Total 6,511.1 145,847.8Tropical High Forest (degraded) Total 2,730.6 30,855.5Water Total 36,895.6 0.0Wetlands Total 4,840.3 0.0Woodlands Total 39,744.6 118,474.2Grand Total 241,112.8 477,169.6
Land cover (use) Gross Protected Available Total Biomass Protected AvailableArea (km2) Area (km2) Area (km2) (,000 t, Airdry) (,000 t, Airdry) (,000 t, Airdry)
Broadleaved Plantations Total 188.9 66.7 122.2 1,431.2 505.65 925.55Built up areas Total 365.8 26.0 339.9 47.4 3.72 43.68Bushlands Total 14,221.9 8,626.7 5,595.2 14,961.3 8,102.34 6,858.96Grasslands Total 50,721.1 23,163.4 27,557.7 58,560.8 27,522.52 31,038.28Impediments Total 37.4 11.4 26.0 0.0 0.00 0.00Large scale Farmlands Total 684.5 22.6 662.0 0.6 0.00 0.60Softwood Plantations Total 163.9 156.9 7.0 2,456.5 2,353.50 103.00Subsistence farmlands Total 84,007.1 4,985.7 79,021.4 104,534.3 4,346.80 100,187.50Tropical High Forest Total 6,511.1 4,763.4 1,747.7 145,847.8 106,700.83 39,146.97Tropical High Forest (degraded) Total2,730.6 971.5 1,759.1 30,855.5 10,978.29 19,877.21Water Total 36,895.6 270.5 36,625.1 0.0 0.00 0.00Wetlands Total 4,840.3 535.8 4,304.5 0.0 0.00 0.00Woodlands Total 39,744.6 13,726.5 26,018.1 118,474.2 40,728.35 77,745.85Grand Total 241,112.8 57,327.0 183,785.8 477,169.6 201,242.00 275,927.60

13
nearby bushland areas. Similarly for sawn wood purposes one can deduce that the suppliesshould ideally come from softwood plantations and the tropical high forests. The details byregion and district are given in annex D.
4.1.3 Mean Annual Increment and Sustainable YieldsUsing preliminary Mean Annual Increments estimates from the National Biomass Study forthe various land cover (use) classes, the annual yields on regional basis were calculated forboth the gross biomass supply and the net (i.e. after removing the protected areas) to producethe available sustainable biomass yields. The results are presented in table 4-3 below.
Table 4-3 : Sustainable Woody Biomass Supplies
(*) After removing the protected areas
The total sustainable yield after removing protected areas from the gross supply is about 14.4million tons at national level. The details per each land cover on regional basis is given inannex D. The implications of this sustainable supplies in relation to consumption shall befurther discussed in section below.
4.2 AgricultureBiomass energy from crops is derived from agricultural residues arising from the growingand harvesting of both food crops and cash crops. The commonest food crops grown inUganda are Plantains: both green and sweet bananas; Cereals: finger millet, maize, sorghum,rice and wheat; Root crops: sweet potatoes, Irish potatoes and cassava; Pulses: beans, fieldpeas, soya beans and pigeon peas; Others: groundnuts (sometimes called peanuts), and sim-sim. The cash crops grown are coffee, cotton, tea and sugar cane. The distributions of thesecrops in the country depend on specific crop requirements such as soils and climaticconditions (e.g. rainfall patterns and its distribution). The following section presents the areasand production of the major crops in Uganda based on data from the Ministry of Agriculture,(1995).
4.2.1 Crops: Areas and Production
For more details of crop areas and production at district, regional and national levels refer toannex E and F.
4.2.2 Agricultural Residues (Food and main cash crops)Agricultural residues are the material left after harvesting or processing of crops. Data onresidues are in most cases lacking. Therefore, the data for residues was derived by calculatingthe production figures of each crop with appropriate conversion factors (residue-production
Region Gross Biomass Gross Yield Available (*) Yield-Available (*)(,000 t, Airdry) (,000 t/year) (,000 t, Airdry) (,000 t/year)
Central Total 111,214.7 4,789.9 85,772.8 4,054.8Eastern Total 45,321.6 2,488.4 25,862.11 1,811.2Northern Total 118,347.3 6,033.8 70,833.72 4,259.4Western Total 202,286.0 7,129.7 93,458.96 4,334.7Grand Total 477,169.6 20,441.8 275,927.60 14,460.1
14
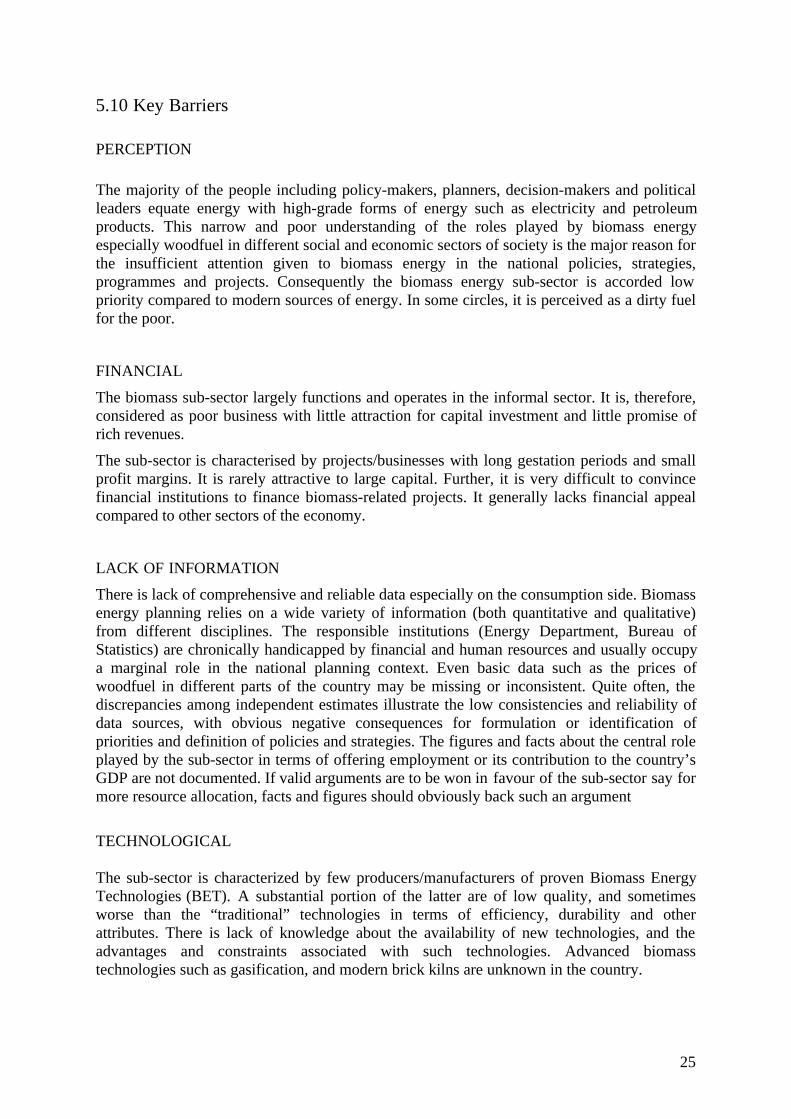
ratios). The conversion factors were obtained from a report for GHG inventories (1994). Theresults on national basis for the main crops are presented in the following table.
Table 4-4 Agricultural Residues
Crop Type Residues (t) Availability forEnergy (%)
Availability forEnergy (t)
Cassava 667,200 0 0
Bananas 3,604,799 30 1,081,440
Beans 273,001 30 81,900
Cow Peas 26,783 30 8,035
Field Peas 9,599 30 2,880
Soya Beans 55,299 30 16,590
Finger Millet 695,200 0 0
Sorghum 478,802 30 143,641
Maize 913,002 30 273,901
Rice 108,445 30 32,534
Wheat 10,800 0 0
Sun Flower 22,251 0 0
Ground Nuts 144,000 30 43,200
Sweet Potatoes 666,900 0 0
Irish Potatoes 155,726 0 0
Coffee 145,172 30 43,552
Tea 12,692 30 3,808
Tobacco 6,851 30 2,055
TOTAL 7,996,522 - 1,733,536
4.3 Livestock
There has been no recent detailed census carried out in the country. Thus the figures givenare derived from the Ministry of Agriculture, Animal Industries and Fisheries statisticalabstract 2000.
Table 4-5 Animal Numbers and Waste Production (1995)

15
The above production potential from animals for fuel use should be treated with cautionbecause, a number of issues which affect the potential supply have not been factored in theestimates. For instance it is only possible to collect a fraction (estimated here to 5%) of thedung produced for fuel use since nearly all the cattle in Uganda are grazing cattle i.e. roaminganywhere in the grasslands and range lands unlike those from organized ranches. It is notknown what proportion of the animals are raised under intensive management (zero grazing).Besides, burning of animal wastes for fuel is considered to be a bad practice in agriculturesince it denies the soils of valuable mineral nutrients. Furthermore, the use of dung for fuelsis not common in Uganda except in a few areas with fuelwood scarcity. Therefore the abovefigures should be taken as indicative potential availability of biomass from animal wastes.
4.4 Total Biomass Production and Use
The overall potential stock of woody biomass in Uganda in 1995 was about 477.2 milliontons air dry. However if the biomass from protected areas were removed from the grossnational stock, the net available stock would be reduced to 275.9 million tons air dry.
It should also be noted that in reality only small stems, twigs and branches are normallyutilized. If this is taken into account, the available stock would be further reduced to about30% (about 90 million tons of wood).
The total sustainable biomass production and consumption flows have been summarized atnational level and are presented in table 4-6 below. The concept of sustainability is that theannual outtake should not exceed the mean annual increment. The annual gross sustainableyield at national level is about 20.4 million t/year. However if the available supply from non-protected areas is considered alone, then the yield will be reduced to about 14.5 million tonsper year.
As expected from the above presentations, the highest biomass supply was from trees (14.4million tons/year, air-dry biomass above ground), followed by agricultural residues (1.7million tons/year) and the rest were from animal wastes.
On the consumption side, firewood consumed by households constitutes the greatest amountof biomass, followed by charcoal, firewood for commercial purposes and residues. Only 50%of crop residues available for energy purpose are consumed. An increased supply from thissource should be considered with care.
A n i m a l N u m b e r D V S To ta l D ry Ma t te r Ava i l ab le ( 5%),000 k g / H e a d / d a y ,000 t /year ,000 t /year
Graz ing Cat t le 5 2 3 3 1 .7 3 ,247 .1 162.4S h e e p 924 0 .37 124.8 6 .2G o a t s 5 5 4 5 0 .49 991.7 49 .6P igs 1 3 4 3 0 .41 201.0 10 .0Poul t ry 2 1 8 3 2 0 .02 159.4 8 .0Tota l 4 ,723 .9 236.2

16
Table 4-6 Biomass Energy Flows at National Level (1995)
4.5 ConclusionThe data on land cover (use) distribution, areas, standing stock (biomass density), agriculturalcrop areas and production and animal waste production were used to quantify the supply ofbiomass supply. While data on charcoal and firewood from available literature were used todetermine the quantity of biomass consumed in 1995.
On the supply side, Uganda had a total stock of 477.2 million tons of woody biomass in 1995.The total biomass yields were about 20.4 million t/year of wood (annual mean increment),8.0 million t/year of agricultural crop residues and 4.7 million tons/year of animal wastes.
The available (excluding protected areas) amounts for energy use were 275.9 million tons ofwood as stock, 14.46 million tons of wood/year, 1.73 million tons of residues/year and236,000 t of animal wastes as yields.
On the consumption side, the same year, a total of 20.2 million tons was consumed of whichnearly 80.5 % firewood for all purposes, 14.5 % charcoal and 4 % residue.
Biomass flows based on these sustainable yields gave a negative balance of 3.8 milliontons/year in 1995. The deficit for woody biomass is even higher: 4.9 million tons/year for thesame year.
Some gaps exist in the data and the estimates of the above biomass should be treated withcaution since many issues that affect the gross supply and the consumption were not factoredin. Nevertheless, the general conclusion is that with a negative balance of 3.8 million tons,there are serious challenges to the sustainable use of this resource. In certain region anddistricts the situation is even worse. The future biomass supply for Uganda is not sustainable.This is because, the demand for biomass resources would intensify as the populationincreases. Remedial actions have to be put in place before the situation worsens. Thefollowing table and graph provide an idea about the evolution of the wood standing stock forthe future. The map gives a first idea of the situation (deficit, balance or surplus) for thedistricts of Uganda.
Evolution of the Wood Available Stock
HypothesesAvailable Yield 0.052405
Wood Consumption + 2.6%/year
Category Flow (,000 t/year)Supply Trees (above ground) 14,460.10
Dung (Dry Volatile Solids) 236.20Crop residues 1,733.50Total Biomass Supply 16,429.80
Consumption Charcoal 3,118.00Fuelwood (Households) 13,447.00Fuelwood (Commercial) 1,907.00Fuelwood (Industrial) 913.00Total Fuelwood Consumption 19,385.00Residue Consumption 850.00Total Biomass Consumption 20,235.00
Balance Supply - Consumption -3,805.20

17
Year AvailableWood Stock
AvailableYearly Yield
WoodfuelConsumption
M t M t/y M t/y
1995 275.9 14.46 19.391996 271.0 14.20 19.891997 265.3 13.90 20.411998 258.8 13.56 20.941999 251.4 13.18 21.482000 243.1 12.74 22.042001 233.8 12.25 22.612002 223.5 11.71 23.202003 212.0 11.11 23.802004 199.3 10.44 24.422005 185.3 9.71 25.062006 170.0 8.91 25.712007 153.2 8.03 26.382008 134.8 7.07 27.062009 114.8 6.02 27.772010 93.1 4.88 28.492011 69.5 3.64 29.232012 43.9 2.30 29.992013 16.2 0.85 30.772014 -13.7 -0.72 31.572015 -46.0 -2.41 32.39
Evolu t ion o f the Wood Ava i lab le S tock
-100
-50
0
5 0
1 0 0
1 5 0
2 0 0
2 5 0
3 0 0
1 9 9 5 2 0 0 0 2 0 0 5 2 0 1 0 2 0 1 5
Y e a r
Woo
d A
vaila
ble
Sto
ck (
mill
ion
t)

18
Kisoro
Gulu
KitgumKotido
MorotoLira
Mukono
Arua
Apac
Mbarara
Masindi
Mpigi
Iganga
Kabarole
Kalangala
Bugiri
Hoima
Rakai
Soroti
LuweroMubende
Masaka
Katakwi
KamuliKiboga
Kibaale
Kumi
Kasese
Nebbi
Bushenyi
Mbale
Moyo
Adjumani
Pallisa
Rukungiri
Nakasongola
Tororo
Kabale
Bundibugyo
Sembabule
Ntungamo
Jinja
Kapchorwa
Busia
Kampala
6 100 0 100 200 Kilometers
N
Deficit
Balance
Surplus
Legend
DistrictPopulationDensity(Per sons per Sq Km)
> 250
200- <250
150 - <200
100 - < 150
50 - <100
<50
$$$ $$ $
$ $$$
$$$
$
$
$$$ $
$ $
$$
$ $
$$$ $
$$$
$
$
$ $$$
$$$ $$ $
<50
50- <100
100 - < 150
150 - <200
200 - <250
> 250
Source:National Biomass Study (NBS),preliminary results.
Wood Available Outside Forests
$$$$$$
$ $$$
$$$
$
$
$$$$
$$
$
$
$
$$$$
$$
$
$$$$
$
$
$
$
$ $$$
$ $$$
$$$
$$
$$$$$$
$$$
$
$
$$$$$$$$
$$
$$$$$$
$$$$$$
$$
$$
$$$$
$$$$
$$$$
$$$$
$$$$
$$$ $
$$$$$$
$$$$$$
$$$ $$ $
$$$$$$
$$$ $$ $
$$$$
$
$
$
$$
$$$ $$ $

19
5. Selected Biomass Energy Initiatives and Barriers
This chapter reviews some biomass energy initiatives in the country and examines some ofthe barriers to dissemination of biomass energy technologies (BET). The initiatives mainlycover creating awareness and dissemination of technologies for tree planting and energyefficiency, particularly improved stoves and improved charcoal production techniques. Thereare some activities addressing capacity building as well. Most NGO and public sectorinitiatives receive donor support while private sector activities are supported by the parentcompany.
5.1 Ministry of Energy and Mineral Development
The MEMD is implementing the Sustainable Energy Use in Households and Industry(SEUHI), a three year project supported by the Netherlands Government. The objective ofthis project was to improve efficiency in energy conversion and use in the households andsmall-scale industry. The project address rural and urban household stoves in Kampala,Soroti, Adjumani, Kabale and Tororo; charcoal production in Luwero, Nakasongola andMasindi; and lime production in Kasese, Kisoro and Tororo.
The MEMD has:♦ Disseminated improved cookstoves in 34 sub-counties in the districts of Kabale, Tororo,
Soroti and Adjumani. Over 400 people have been trained and about 7,000 householdsnow use improved stoves.
♦ About 70 artisans were trained in production and marketing of improved charcoal stovesin Kampala and Kabale.
♦ Over 130 charcoal producers in Nakasongola, Luwero and Masindi Districts were trainedin improved charcoal production methods.
♦ Three charcoal producers associations were formed.♦ Two charcoal producers associations benefited from a modest revolving fund through
which they acquired the MAB-CASA kiln. In addition the MEMD facilitated theassociations access to Kampala markets. The two associations have been operating stallsin Wandegeya and Namasuba Markets since August 2000.
♦ An improved lime kiln in Tororo was completed and launched and another lime kiln wasbuilt in Kisoro.
♦ Energy audits have been carried out in some biomass based industries.♦ Eight tree nurseries were established in sub-counties in Kabale District.♦ In collaboration with ACORD, MEMD planted over 500,000 seedlings in Adjumani
District.♦ Provided facilitators to Nyabyeya Forestry College on energy issues.♦ Established 20 biogas digesters and trained 20 artisans in biogas digester construction.
Under the Energy Advisory Project supported by the German Government, the MEMDprepared the national energy Policy, sub-sector-strategies and an energy Informtion System.Technical assistance was also provided to different NGO projects and the media. A BiomassEnergy Development Programme (BEDP) was prepared; the MEMD plans to remove barriersto increase biomass energy efficiency in households and small-scale industries in rural andperi-urban areas. This will be done by promotion of improved technologies, energy saving

20
methods and fuel substitution. High priority will be given to urban households, institutionsand small industries where management and motivation to cut fuel costs quickly exist.
5.2 Rwenzori Highlands Tea Company (RHTC)
Rwenzori Highlands Tea Company consists of 6 tea estates namely: Bugambe Tea Estate –Hoima District; Kisalu Tea Estate – Hoima District; Muzizi Tea Estate – Kibale District;Mwenge Tea Estate – Kabarole District; Kiko Tea Estate – Kabarole District and Ankole TeaEstate – Bushenyi District. The biomass initiative started in 1994 emphasises production andutilization of fuelwood. Three estates (Mwenge, Kiko and Ankole) have planted 465.6 ha ofEucalyptus (excludes area planting before 1994) managed at a rotation of 6 to 8 years. Overmature eucalyptus fuelwood produced 480 kg of made tea/m3 of fuelwood, as compared to320 kg of made tea/m3 of fuelwood from a 6 years old crop. The company sold some of itsfuelwood at USh 1,500/= per m3.
RHTC has introduced efficient wood fired steam boilers in two estates (Mwenge andAnkole). The new boilers improved fuelwood consumption from 220kg of made tea/m3 offuelwood to 320-480 kg of made tea/m3 of fuelwood, a 31% to 54% reduction in fuelwoodconsumption. The company also uses efficient wood burning cookstoves to prepare food forfactory workers.
RHTC plans to introduce tree planting and use of efficient boilers and stoves in all its teaestates.
5.3 British American Tobacco/Universal Leaf Tobacco
Substantial amount of energy is required to cure tobacco. The curing process is a crucial stepin the ultimate quality of tobacco. Subsistence farmers do 95% of the growing and curing oftobacco. BAT supplies growers with agro inputs which includes transportation of fuelwoodand distribution of tree seedlings. Over 15 million seedlings were distributed in 1999 and2000. However since there is limited monitoring of tree planting, the number of treessurviving on farm land may be far less. In addition BAT has decided not to buy tobacco fromfarmers who do not plant trees. The announcement made in June 2000 did not indicate howmany trees each farmer should have planted before he can sell. Furthermore, the supportprovided by BAT to farmers such as clearing land and provision of agro inputs on creditmakes this policy difficult to implement since the farmer owes BAT.
BAT has introduced an energy efficient tobacco curing barn which use 10 m3 of fuelwood per1,000 kg of cured tobacco as compared to the traditional method which uses 20 m3 offuelwood.
5.4 Joint Energy and Environment Project (JEEP)
Since 1983, JEEP has been involved in energy and environment issues. JEEP concentrateson training and creating awareness on energy, environment and sustainable agriculture. JEEPhas a membership of over 500 members and 30 groups of youth, women and farmers.

21
Currently JEEP’s thrust is in training of trainers in among other topics, energy conservationand alternative fuels, construction of fuel saving cookstoves, other energy saving householdtechnologies and tree planting. Under a programme supported by Plan International, over33,000 people have been sensitised and over 8,500 trainers trained in the districts of Mpigi,Kampala, Luwero and Tororo. Over 3,000 mud stoves were built in 2000. This implies thatonly one third of the trainers who attended the workshops have built a stove for themselves!During the same year, over 22,000 tree seedlings were planted. JEEP also constructs stovesfor schools, health units, restaurants and prisons. Over 20 stoves have been constructedalthough only 4 were built in 2000. JEEP sold 600 improved charcoal stoves in 2000.
JEEP plans to continue training of trainers and monitoring performance of trainers in theselected districts. In addition they plan lobby and advocacy work which aims at stimulatingpoliticians to consider energy and environment issues in their development plans. In order togenerate income to offset their overheads, JEEP plans to step up marketing of institutionalstoves and improved charcoal stoves. JEEP has also acquired land where it plans to establisha training and demonstration centre. Improved stoves, tree planting and biogas will be someof the key activities at the centre.
5.5 Integrated Rural Development Initiatives (IRDI)
Integrated Rural Development Initiatives was conceived in February 1994 by a group ofpeople with experience and interest in environment conservation; and, rural and peri-urbandevelopment. The majority of the population resides in the rural and peri-urban areas wherethey depend on agriculture for their survival. Coupled with this rural people depend onbiomass energy for their cooking and heating needs. IRDI therefore aims to reduceenvironmental degradation, promote sustainable utilization of natural resources and improvethe social economic status of the communities especially the marginalised groups. IRDIpromotes the use of renewable energy technologies with emphasis on training trainers in mudstove construction and use, use of a hay basket and construction of biogas plants. IRDIcurrently operates in Kampala, Mpigi, Mukono, Rakai, Mbale and Kamuli. The work inRakai is supported by Cross Border Biodiversity Project, Ministry of Water, Lands andEnvironment.
IRDI achievements include:♦ Over 30 training seminars and workshops which include wood energy conservation, tree
planting and biogas construction have been held with close to 700 farmers trained.♦ 90 school children were trained in environmental conservation (includes wood energy
conservation, tree planting).♦ Newsletters produced in English, Luganda and one in Lumasaba on sustainable
agriculture and energy conservation.♦ Over 100 radio programmes in English, Luganda and Lumasaba.♦ 6 households were provided with heifers as part of an initiative towards sustainable
agriculture and introduction of biogas technology.♦ Over 8,000 improved stoves were constructed.♦ Over 50 biogas digesters constructed by farmers.♦ 20 “backyard” tree nurseries were in operation.

22
♦ Over 300 farmers have planted trees.♦ Two rural demonstration kitchens with improved stoves were constructed.
IRDI plans to:♦ Continue with on-going programmes.♦ Conduct research on kitchens.♦ Train farmers in kitchen construction.♦ Promote the use of fuel efficient kilns (brick and charcoal).♦ Train target group in tree nursery establishment, agro-forestry and woodlot establishment
and management.♦ Establish a resource centre in Mukono district.
5.6 Renewable Energy Development Centre
The Renewable Energy Development Centre, in association with the UK based Energy forSustainable Development (ESD) has conducted a number of studies on Renewable Energy.These include:♦ IGAD Household Energy Project;♦ Improving Efficient Woody Biomass Energy Production and Utilization in Mukono and
Masindi, and;♦ Poverty Alleviation Effects of Improved Stoves.
REDC (and ESD) is implementing the IGAD household energy project, which aims atimproving the standards of living by ensuring environmentally and economically sustainablehousehold energy in the IGAD region. In Uganda, the IGAD project addressescommercialisation of improved charcoal stoves. Currently the project has conducted anumber of consultant missions which identified the main areas of concern namely businessmanagement and quality control. A selection of stoves on the Ugandan market has beentested for thermal efficiency and durability. The KCJ was selected based on thermalefficiency, durability and ease of production. It has been subject to field tests (kitchenperformance tests). The project will conduct training in business management and stoveproduction for selected entrepreneurs in Kampala. In addition, the project will train artisansin kiln construction and use.
The DFID/KAR funded project on improving efficient woody biomass energy productionand utilization in Mukono and Masindi has been completed. The main objective of theproject was to demonstrate the important contribution of commercial woody biomass towardspoverty alleviation and the national economy. The study established that there isconsiderable seasonal variation in forest gate prices for charcoal; and, wages and profits varyconsiderably. Charcoal producers earn very little (23,000/= to 50,000/= per month) andsometimes operate at a loss. In comparison the monthly income of a transporter ranges from600,000/= to 1,500,000/=. A charcoal retailer in Masindi earns 21,000/= per month whileone in Kampala earns about 158,000/= per month. The study also established that charcoalproduction and firewood harvesting are male dominated activities. Most producers do notown the resource. They either enter into contract with the owners or produce charcoalillegally.

23
Another DFID/KAR project - poverty reduction impacts of improved stoves is completed.The project aimed at mapping out the energy consumption behavioural patterns withindifferent classes of society in Kampala. The study established that in Kampala there is adirect relationship between use of electricity for cooking and household income while use ofkerosene was independent of income. Use of LPG was limited to 2% of the sample.Dependence on charcoal for cooking was high across all income groups. Use of charcoalinstead of firewood represented an improvement in quality of life. Use of firewood forcooking was prevalent in the lowest income group. Statistical analysis showed that 21% ofthe reasons given for choice of fuel were related to income. In over 80% of the households,the family head chose the type of stove purchased and this was influenced by income exceptfor the kerosene stoves. It was also noted that none of the households in the high-incomegroups had an improved stove. Most households with an improved stove had used it for about2 years. The longest time recorded was 7 years.
5.7 Makerere University
With support from NORAD, Nyabyeya Forestry College established a Biomass EnergyResource and Training Centre, for training forestry technicians and graduate foresters. Theyalso plan refresher courses for older technicians and short courses for extension workers. Thisaims at training target groups in production of different biomass technologies - particularlyimproved stoves. The college has established a training and demonstration unit with a widerange of technologies on display. Training of college staff and technicians in differentaspects of biomass energy and stove production has been conducted. The college plans tobegin training artisans and staff of CBO's and NGO's (short courses) and forestry technicians(module in forestry training).
The Faculty of Technology, Makerere University has established demonstration/training unitsfor different technologies including biogas, improved cook stoves and is planning to install agasifier.
5.8 National Environment Management Authority
The National Environment Management Authority supports CBO's and NGO's involved inenvironment related activities in Mbarara, Kabale, Kasese, Arua, Tororo, Busia and MbaleDistricts. Support is provided at sub-county level. In Mbarara, 6 sub-counties planted over126,000 seedlings (mainly Eucalyptus). Each sub-county had a nursery with seedlings fornext planting season. In Kabale, over 30,000 seedlings of Grevillea, Sesbania and Calliandrawere planted in agroforestry farming systems mainly for soil conservation. Trees planted inprevious years were well managed. NEMA supports activities in 7 sub-counties in KabaleDistrict. In Mbale, over 200,000 trees (Eucalyptus, Grevillea, Luceana, Maesopsis, Sesbania,other indigenous trees, fruit trees) were planted in 4 sub-counties. Nurseries were wellstocked in preparation for the next planting season. In Nakaloke sub-county 10 householdsbuilt and used improved stoves. Over 280,000 trees were planted in 6 sub-conties of Tororodistrict. All nurseries were well stocked in preparation for the next planting season. 73energy saving stoves were constructed in Rubongi, Mukuju and Kwapa sub-counties. About30,000 trees were planted in 5 sub-counties of Busia district. 62 improved stoves wereconstructed in Lunnyo sub-county. In Kasese, over 100,000 trees were planted in 3 sub-counties. Two sub-counties have well stocked nurseries. In Arua, 45 ha were planted in 6

24
sub-counties. A large number of seedlings were sold or distributed to the community. Allsub-counties have well stocked nurseries.
5.9 Others
25
5.10 Key Barriers
PERCEPTION
The majority of the people including policy-makers, planners, decision-makers and politicalleaders equate energy with high-grade forms of energy such as electricity and petroleumproducts. This narrow and poor understanding of the roles played by biomass energyespecially woodfuel in different social and economic sectors of society is the major reason forthe insufficient attention given to biomass energy in the national policies, strategies,programmes and projects. Consequently the biomass energy sub-sector is accorded lowpriority compared to modern sources of energy. In some circles, it is perceived as a dirty fuelfor the poor.
FINANCIAL
The biomass sub-sector largely functions and operates in the informal sector. It is, therefore,considered as poor business with little attraction for capital investment and little promise ofrich revenues.
The sub-sector is characterised by projects/businesses with long gestation periods and smallprofit margins. It is rarely attractive to large capital. Further, it is very difficult to convincefinancial institutions to finance biomass-related projects. It generally lacks financial appealcompared to other sectors of the economy.
LACK OF INFORMATION
There is lack of comprehensive and reliable data especially on the consumption side. Biomassenergy planning relies on a wide variety of information (both quantitative and qualitative)from different disciplines. The responsible institutions (Energy Department, Bureau ofStatistics) are chronically handicapped by financial and human resources and usually occupya marginal role in the national planning context. Even basic data such as the prices ofwoodfuel in different parts of the country may be missing or inconsistent. Quite often, thediscrepancies among independent estimates illustrate the low consistencies and reliability ofdata sources, with obvious negative consequences for formulation or identification ofpriorities and definition of policies and strategies. The figures and facts about the central roleplayed by the sub-sector in terms of offering employment or its contribution to the country’sGDP are not documented. If valid arguments are to be won in favour of the sub-sector say formore resource allocation, facts and figures should obviously back such an argument
TECHNOLOGICAL
The sub-sector is characterized by few producers/manufacturers of proven Biomass EnergyTechnologies (BET). A substantial portion of the latter are of low quality, and sometimesworse than the “traditional” technologies in terms of efficiency, durability and otherattributes. There is lack of knowledge about the availability of new technologies, and theadvantages and constraints associated with such technologies. Advanced biomasstechnologies such as gasification, and modern brick kilns are unknown in the country.
26
There is clear lack of quality control and regulation in the sub-sector.
INSTITUTIONAL
The key institutions in the biomass sub-sector MEMD, MUK, Nyabyeya, UREA, NGOs andprivate companies experience shortage of qualified personnel/experts in the area of biomass.These organisations do focus on many other issues and biomass is more often a smallcomponent of their activities/programmes. This situation is aggravated by the fact that theinstitutional linkages between the various actors are weak and in some cases non- existent.There is need to enhance collaboration and exchange of experience between all the actors.
Financing mechanisms are also not available for the BET. MFIs are not yet convinced of thepotentialities of these technologies for the development of the rural populations.
As mentioned before the relative low price of biomass reduces the interest of households andother consumers in buying and using BET.
27
6. Framework for a Biomass Energy Demand Strategy
6.1 Objectives of the Strategy
An ideal biomass energy strategy should ensure that resources are used without negativesocial, economic and environmental consequences. This requires balancing the supply anddemand of biomass energy. While the energy sector is responsible for energy supply anddemand, a number of other sectors have a niche in biomass energy issues. These includeforestry, agriculture, environment, industry, health, population, gender and education.Various other stakeholders are involved in supply and demand aspects of biomass.
The Energy Department has developed a National Energy Policy. The major strategy forimplementing the energy policy in end-use sectors is energy efficiency. The biomass (andother renewables) supply sub-sector's objective is for "Government to provide focusedsupport for development, promotion and use of renewable energy resource for both small andlarge scale applications". The policy provides a list of strategies, which need to be developedfurther in order to address the needs of the sector. The National Forest Plan emphasisesbiomass energy conservation through "Developing a biomass energy strategy, improvinguptake of energy efficient technologies and developing appropriate technologies forproduction, processing and energy consumption". The National Environment Action Planalso emphasises energy efficiency, increased production of trees and increased use ofalternative energy sources.
The major objective of this initiative is to synchronise and build on the strategies fromdifferent sectors that address biomass energy demand and ensure that stakeholders of the sub-sector play roles based on their comparative advantage in formulating and implementing thebiomass energy demand strategy.
The components of the strategy are:• Institutional Aspects;• Human Resource Development;• Mobilising Financial Resources;• Dissemination and Awareness;• Quality Control; and• Research .
6.2 Institutional Aspects
Biomass energy should not be viewed as an isolated sub-sector but as an integral part of thedevelopment process. Uganda’s economy is agro-based and biomass plays a key role in anumber of agro-processing industries; therefore developments in the biomass energy sub-sector will contribute towards the Plan for Modernisation of Agriculture (PMA). Biomassplays an important role in ensuring food security because it is and will continue to be themajor source of energy for cooking for the next decades. In some woodfuel deficit areas,households have shifted from more nutritious foods that take long to cook to less nutritiouseasy to cook foods.
28
Apart from existing potential, biomass can play a role in power generation for rural basedindustry (rural electrification) thus contributing towards industrial development.
A revision of the pricing and taxation policies for woodfuels is a condition for the attainmentof the policy targets. The level of taxation has to be raised stepwise to promote managementof the resource base. The primary objective of taxation policy for household energy should beto correct market imperfections that prevent prices on the market to reflect the correcteconomic cost of fuels. This would convey the correct price signals to the consumer of thecost of his fuel use to society and encourage a switch to the use of improved technologies andother energy sources.
Innovative institutional strategies are required in order to ensure that the energy needs of enduse sectors that rely on biomass energy are met. Important institutional options include andare not limited to:
♦ Careful review of the existing institutional framework to identify opportunities forrationalisation and improved efficiency. This would include a functional analysis ofagencies involved in the biomass energy sub-sector. In addition a SWOT analysis of theexisting institutional framework would help establish areas that need strengthening orimprovement.
♦ Giving preference to simple policy instruments that yield substantial results at low cost.♦ Formulating simple regulatory and fiscal measures that are commensurate with local
enforcement and monitoring capacity. These measures should be based on realistic andtechnically proven analysis with stakeholder participation. For example licensingcharcoal producers and fuelwood dealers at village, parish or sub-county level would bebest effected when local authorities have been involved in preparation of environmentaction plans (which incorporate energy) at local level.
♦ Using research results in decision making.♦ Incorporating energy planning at lower levels, mainly at district and sub-county levels.♦ Undertaking regular and periodic reviews of past biomass energy policies, projects and
initiatives to ensure that lessons learnt are incorporated in current and future activities.♦ Ensuring that government departments focus on their central functions of regulation,
evaluation and monitoring.♦ Establishing appropriate pricing schemes for wood fuels to allow for the full recovery of
cost for energy crops thus creating a favourable environment for investment incommercial energy plantations.
♦ Strengthening institutional memory, proactive advocacy and reinforcing effective nationalcoordination.
♦ Encouraging the establishment of energy service companies (ESCO) with special interestin promotion, testing, manufacture and marketing energy efficient technologies andpractices.
♦ Encouraging the development of professional associations. The Department of Energy’ssupport for Uganda Renewable Energy Association (UREA) is a case in site.
♦ Encourage inclusion of biomass issues in all rural development projects.

29
6.3 Human Resource Development
Successful energy programmes in Sub-Saharan Africa are those in which local initiativeplayed a dominant role in the project conceptualisation through to implementation.Meaningful development of the biomass energy sub-sector will require mobilisation,strengthening and effective organisation of human resources in the country. Limited localparticipation has retarded the growth of local skills making Uganda more dependent onexternal expertise. In the short term, optimum use of existing skills would yield the highestbenefits at the lowest cost. It is therefore necessary to establish the existing human resourcecapacity in the country. Over the years, there has been great dependence on externalexpertise in the energy sector. Appropriate long and short term training should be madeavailable to ensure that those employed in the biomass energy demand sub-sector caneffectively participate in various aspects of biomass energy production, distribution and use.Among end-users, there is limited knowledge of biomass energy efficiency opportunities andavailability of new technologies, no capacity to undertake energy efficiency analysis and thesimplicity with which energy savings can be used to increase production and profitability insmall and medium enterprises and institutions is not known.
Some tertiary institutions such as the Faculty of Forestry and Nature Conservation (MakerereUniversity) and Nyabyeya Forestry College have incorporated biomass energy in the forestrytraining curricula. This is the beginning of a process that will supply trained cadres for thesub-sector. In order to accelerate technology adoption rates, it is imperative to includebiomass energy conservation in other tertiary institutions and at lower education levels.Some aspects of forestry and environment conservation are now part of the syllabus inprimary and secondary schools in Uganda. It is envisaged that the younger generation willimplement what they learnt in school. This could also be done for biomass energyconservation.
A number of institutions (Nyabyeya Forestry College, Makerere Faculty of Technology) areplaning to establish “Biomass Energy Centres” in different parts of the country. In addition12 Agricultural Research and Development Centres (ARDC) (former District Farm Institutes)currently under National Agricultural Research Organisation management and AgriculturalDevelopment Centres (ADC) under Local Government management can be used astechnology uptake pathways for biomass energy technologies. These efforts need to becoordinated to avoid duplication.
A few formal and informal entrepreneurs have invested in production of biomass energytechnologies especially production of improved cookstoves. They often have limitedtechnical and business management skills. As a result, these businesses have not registeredthe success originally expected. Different small projects (IGAD, SEUHI) plan to providetraining in both technical and business management skills for improved charcoal stoveproducers. Other small and medium scale entrepreneurs in the sub-sector need training aswell.
In order to create a critical mass of personnel to implement the biomass energy strategy it isimperative to:
30
Ø Conduct a human resource survey among major actors and agencies to establish existinghuman resource capacity. This will help establish the gaps and thus plan for relevanttraining programmes. In addition a training needs assessment should be conductedamong stakeholders.
Ø Develop requisite human resource capacity to implement the National Biomass EnergyDemand Strategy by:• Providing formal and on-job training for all levels of personnel in biomass energy
projects. Training courses should be based on identified local needs of the targetgroups.
• Training extension workers in relevant biomass energy technologies. Under theNAADS system extension staff hired by the district authorities will be the major linkto farmers. Such training would be conducted if the farmers have identified biomassenergy conservation technologies as necessary input to their agricultural developmentactivities.
• Training staff and managers of small and medium enterprises in technical andbusiness management after training needs assessment.
Ø Establish a network of trained biomass energy auditors who will be skilled in identifyingand implementing profitable biomass energy efficiency initiative.
Ø Integrate biomass energy conservation in the school curricula at primary and secondarylevels.
Ø Co-ordinate biomass energy centre activities and establish demonstrations at ARDC andADC.
6.4 Mobilizing Financial Resources
The level of dependence on external sources to finance energy development in Uganda is soprevalent that little thought is given to mobilizing local financial resources. Uganda hasborrowed massively to finance the power sub-sector. On the other hand the biomass sub-sector, an important source of livelihood for Ugandans mainly benefits from small grants.Mobilizing local financial resources is a pre-requisite for sustainable energy development inthe country. A few private sector biomass energy initiatives have been implemented usinglocally generated resources however, experiences on the success of these initiatives is limited.Biomass energy supply is totally financed by local capital however it is characterized byunder-valuation of the resource. Some financial institutions administer a number of specialloan programmes, which are dedicated to the development of small and medium enterprises.Private sector agencies involved in biomass energy should take advantage of these loans.
Some biomass energy technologies such as biogas systems and institutional stoves; and,technologies for harnessing alternative fuels have high investment costs, which discourageend-users from acquiring these technologies. The first biogas digesters introduced in Ugandawere made of concrete and/or bricks, which most farmers could not afford. CurrentlyIntegrated Rural Development Initiatives is disseminating a tubular biogas digester, which ischeaper. However, farmers still need financial assistance in order to purchase the biogassystem. High investment cost may also affect the adoption of liquid petroleum gas despitethe fact that the industry has introduced cheap 5 kg cylinders with single burners.
Effective financial resource mobilization can be realized by:

31
Ø Developing mechanisms for mobilizing local capital to finance biomass energy projects.An Energy Development Fund (e.g. Ghana experience) could be established withcontribution from a given percentage of tax revenue from all energy suppliers.Percentages could depend on volume of business and levels of pollution from the fuel.
Ø Encouraging greater involvement of local banks in biomass energy investments like forsolar home systems (e.g. UPPPRE). Small and medium enterprises should take advantageof loans provided by banking institutions.
Ø Including smart subsidies for biomass energy initiatives as part of the RuralElectrification Fund recently adopted by Cabinet.
Ø Rationalizing the collection of revenues, fees and taxes related to wood production,transformation, transport and marketing at local levels. Those funds should be utilized toensure maximum benefits are realized at local government level while promoting thecommercial woody biomass sector to operate on a sustainable basis.
Ø Developing appropriate financing packages for small and medium enterprises in biomassenergy projects.
Ø Promoting technology acquisition especially for alternative fuels through hire purchasesystem. This would be applicable for charcoal production technologies, institutionalstoves, biogas and liquid petroleum gas. Total Kenya instituted a system whereconsumers bought stamps from the petrol station until they accumulate sufficient stampsto cover the cost of the cylinder and burner. Petroleum companies in Uganda couldconsider implementing this system. Similarly, IRDI has implemented a revolving fundsystem to enable farmers acquire tubular biogas digesters. Further assessment of thesetwo end-user financing systems is required before wider use.
6.5 Dissemination and Awareness
A number of agencies are actively involved in awareness and dissemination activitiesparticularly for improved cookstoves and tree planting. For most biomass energy consumers,reducing energy costs at end-use has not traditionally been a principal concern. There is needto make information more readily available to enable biomass energy users incorporateenergy efficiency in their daily practices. While biomass energy technology disseminationefforts have been going on by different actors over the years, some of these agencies arebound to have registered successful dissemination. It is imperative to learn from experiencesof different actors. It is also necessary to consolidate dissemination efforts and channelactivities to where there is greatest need. The different media (press, radio, and television)and the Association of Environmental Journalists will have a crucial role to play in preparingand disseminating the information.
Innovative dissemination and awareness approaches will include:Ø Designing a national awareness campaign to demystify BET and ensure actors are aware
of key components of the biomass energy demand strategy. The awareness campaignwould among other things provide information on biomass energy saving methodsincluding different technology options, major actors and sources of information. Thedifferent media and the journalists associations will be trained to disseminate the rightmessages.
Ø Creating a database with information on technologies available and their performanceparameter, institutions and their roles in the National Biomass Energy Demand Strategy,past, present and future projects and any other information considered necessary.
32
Ø Documenting and publishing reviews of technology dissemination activities so that otheractors may learn from success and failures of past projects.
Ø Instituting incentives to encourage adoption of BET.Ø Consolidating dissemination activities implemented by different actors to prevent
duplication of efforts and concentration of activities in a given region of the country.This will help identify gaps in current dissemination approaches. Combined with data onbiomass growth, demand and supply the dissemination approach would includeidentification of areas most suitable for implementation of biomass energy programmes.
6.6 Quality Control
Poor quality of some biomass energy technologies (BET) is a barrier to large scaledissemination. This is particularly prevalent in improved charcoal stoves. It may also affectthe other BET thus the need to nip the problem in the bud.
It is proposed that:♦ A National Energy Reference Center be developed at Makerere University. Some testing
facilities for improved stoves already exist with Makerere University (Faculty ofTechnology) but the facility needs to be equipped to handle other biomass technologies.
♦ A regular testing programme be instituted to ensure that acceptable quality is maintained.♦ Quality guidelines (or standards) for production of different BET should be developed
and technology producers provided with the guidelines.♦ The strategy encourages technology producers to use trademarks on all their products.
6.7 Research
There has been limited support to research in BET. Research activities have mainlyconcentrated on charcoal production and improved cookstoves. Uganda mainly depends onresearch conducted in other countries. Continued reliance on technology development doneby other countries is envisaged. However it is imperative that technologies are adapted tolocal needs. More effort should be placed in adaptive research. The use of energy demandand supply data for planning at district and lower levels is important.
♦ Collecting and processing relevant data for the implementation of the biomass energystrategy. Data on biomass availability is an important input to planning at lower levels.While data has been previously collect and processed it has not been incorporated atdistrict and national planning for the sub-sector.
♦ Incorporating environment costing in analysis of different energy options thus ensuringthat the full cost of biomass energy supply is transparent.
♦ Developing national energy efficiency performance data, management regimes andrelevant technical specifications for different biomass technologies. This would be aninput to the database described above and would help end-users and disseminationagencies select suitable technologies for promotion.
♦ Developing or adapting technologies for biomass uses where improved technologies arenot yet available in the country.
♦ Exploring the possibility of using biomass for power generation and as a source of fuelfor petrol-alcohol blends. Primary focus should be on those locations where agricultural

33
waste is produced centrally (coffee and rice industries). Potential agro wastes estimationand specific feasibility studies are necessary.
♦ Promoting energy policy analysis research to assess the impact of different energystrategies implemented.
6.8 Key Actors and their Roles
The Ministry of Energy and Mineral Development (Energy Department, New and RenewableEnergy Sources Division) is the lead agency in formulating and coordinating theimplementation of the National Biomass Energy Demand Strategy. The major function ofMEMD would be regulatory and would also encompass evaluation and monitoring.However, there is need for a Steering Committee with representation from the MEMD,MFPED, MAAIF, MTTI, MoLG, MUK, MoES, NEMA, MWLE and a representative of theprivate sector.
Within the Ministry of Water, Lands and Environment the National Biomass Study would bethe major actor providing requisite information on biomass distribution and balances indifferent parts of the country. The study has already provided some useful information forthis strategy and would continue to update the database. Other sources of data would includethe National Bureau of Statistics and the Ministry of Agriculture, Animal Industry andFisheries. These would provide information on energy demand and supply; and, productionand stocking rates in relation to use of agricultural waste for energy production respectively.The National Environment Management Authority would bring experience in supportingsmall-scale activities at sub-county level through district environment offices andincorporating energy issues in district environment plans.
Private firms, producers associations and NGOs acting as energy service companies will playa key role in the increased efficient use of biomass energy by households and small andmedium enterprises through technology dissemination and creating awareness amongbiomass energy end-users. The National Biomass Energy Demand Strategy will create aframework through which existing ESCOs will be strengthened and new ones can emerge.
The National Agricultural Research Organization (mainly Agricultural Engineering,Appropriate Technology Research Institute and Forestry Resources Research Institute) andMakerere University would play an important role in research addressing technologydevelopment and adaptation and any supply side research issues that may arise. In additionstrong linkages would be built with ARDC and ADC through the country as one of the majortechnology uptake pathways.
Makerere University Faculty of Technology has acquired some basic testing equipment.However there is need to equip the workshop further to address a wide range of technologies.The faculty would be involved in capacity building and technology assessment. The Facultyof Forestry and Nature Conservation and the Nyabyeya Forestry College would play a keyrole in capacity building.
A Biomass Energy Demand Programme should benefit rapidly from the support of bilateraland multilateral agencies. Close cooperation with neighboring countries is also veryimportant for the success of the present strategy.

34
National Biomass Energy Demand Strategy Framework
Ministry of Energy(Policy, Coordination, Regulation, Awareness, Data Bank, M&E)
Steering Committee(MEMD. MFPED, MAAIF, MTTI, MoLG, MUK, MoES, NEMA, MWLE, private sector, NGO)
MWLE/NBSData collection and
analysis
UBOSData (prices, population,
households)
MAAIFData (residues, dung)
Banks/MFIs(financing)
Private firms(production,marketing)
NGOs/Associations(awareness,
training)
ARDC/ADC(awareness,
training)
Makerere(Research, qualitycontrol, capacity
building)
NyabyeyaForestry College,
(Research,training)
NARO, FORRI(Research)
Donors(financing, TA)
Biomass EnergyDevelopment Fund
(financing)
Media, Ass.ofEnv.Journalists
(awareness)
NEMA(awareness
through districtenvironment
officers)
Monitoring& Evaluation
Financing Dissemination/Awareness
CapacityBuilding/Research
MoES(curricula)
Forestry Dpt.(awareness)
Private Sector(development of
newtechnologies)

35
7. Targets and Funding Requirements
The primary target of the Government’s Biomass Energy Demand Strategy is to provideaccess to improved wood technologies to 900,000 households by 2010. The details of thistarget are set out in the table below, which includes all improved and substitutiontechnologies for households, institutions, commerce and small industries. The column for theyear 2000 provides an estimate of the current situation.
2000 2005 2010
Rural areas
Rural population 18.6m 20.2m 22.0m
No. of rural households § 3.8m 4.1m 4.5m
No. of Households equipped with improvedwood stoves (IWS)
40,000 120,000 450,000
Rural IWS equipment rate 1.1% 3.0% 10.0%
Urban areas
Urban population 3.4m 4.8m 6.0m
No. of urban households § 0.8m 1.1m 1.3m
No. of urban households equipped with improvedcharcoal stoves (ICS)
80,000 150,000 400,000
No. of urban households equipped withgas/electric stoves (GES)
5,000 10,000 40,000
Urban ICS/GES equipment rate 10.6% 14.5% 33.8%
Total
Total population 22m 25m 28m
Total no. of households § 4.6m 5.2m 5.8m
Total no. of equipped (IWS/ICS) households 125,000 280,000 890,000
Total equipment (IWS/ICS/GES) rate 2.7% 5.4% 15.3%
Other Technologies
Number of improved charcoal kilns 5 30 200
Number of institutions/commercial agenciesusing improved stoves
200 500 2000
Number of improved biomass technologies
- improved backeries 50 200 500
- improved bricks and tiles kilns 5 20 50
- improved tea driers 3 20 50
- improved barns (tobacco) 50 200 1000

36
- improved lime kilns 7 20 50
- improved kilns for fish smoking 10 100 500
Number of solar water heaters 50 250 1000
Number of solar cookers 10 50 200
Number of solar driers 10 100 500
Number of gasifiers 1 10 50
Number of densification units (briquettes) 2 5 20
Number of biogas plants 50 100 500
Number of pyrolisis plants 0 5 20
§ Assumes 4.9 persons per rural household, 4.0 persons per urban household, and a national average of 4.8persons per household
An estimation of the funding requirements (US$) for the period 2001 – 2010 is tabled below:
Component DONOR GOU Total
1. Monitoring and Evaluation
PMU Staff training
Steering Committee
Monitoring and evaluation
500,000
500,000
1,000,000
50,000
50,000
100,000
550,000
550,000
1,100,000
2. Dissemination and Awareness
Awareness Campaigns
Implementation
• Charcoal stoves
• Charcoal kilns
• Institutional stoves
• Wood stoves
• Kilns and Barns
2,000,000
1,000,000
700,000
600,000
400,000
300,000
200,000
100,000
70,000
60,000
40,000
30,000
2,200,000
1,100,000
770,000
660,000
440,000
330,000

37
3. Capacity Building and Research
Regional training courses
Specific energy auditing workshops
Biomass Resource Centre
Methodology Definition
Establishment of testing Centre
Test and Quality Control
1,000,000
300,000
500,000
200,000
600,000
600,000
100,000
30,000
50,000
20,000
60,000
60,000
1,100,000
330,000
550,000
220,000
660,000
660,000
4. Programme Management and Support
Programme Management Unit
International Technical Assistance
Office Expenses
Vehicles/maintenance
800,000
1,200,000
1,200,000
600,000
200,000
0
200,000
60,000
1,000,000
1,200,000
1,400,000
660,000
TOTAL Costs (US$) 14,000,000 1,480,000 15,480,000

38
8. Implementation Plan
Component Y1 Y2 Y3 Y4 Y5 Y6 Y7 Y8 Y9 Y10
1. Monitoring and Evaluation
PMU Staff training
Steering Committee
Monitoring and Evaluation
XXXX
X X
X
X X
X
X X
X
X X
X
X X
X
X X
X
X X
X
X X
X
X X
X
X X
X
2. Dissemination and Awareness
Awareness Campaigns
Implementation
• Charcoal stoves
• Charcoal kilns
• Institutional stoves
• Wood stoves
• Kilns and Barns
XXXXXXXX
XXXX
XXXX
XXXX
XXXX
XXXX
XXXX
XXXX
X X
XXXX
XXXX
XXXX
XXXX
XXXX
X X
XXXX
XXXX
XXXX
XXXX
XXXX
X X
XXXX
XXXX
XXXX
XXXX
XXXX
X X
XXXX
XXXX
XXXX
XXXX
XXXX
X X
XXXX
XXXX
XXXX
XXXX
XXXX
X X
XXXX
XXXX
XXXX
XXXX
XXXX
X X
XXXX
XXXX
XXXX
XXXX
XXXX
3. Capacity Building and Research
Regional training courses
Specific energy auditing workshops
Biomass Resource Centre
Methodology Definition
Establishment of testing Centre
Test and Quality Control
XX
XXXX
XXXX
XXXX
X
X X
XXXX
XXXX
XXXX
X
X X
XX
XXXX
XXXX
X
X X
XXX
X
X
X
X X
X
X
X
X X
X
X
X
X X
X
X
X
X X
X
X
X
X X
X
X
X
X X
4. Programme Management & Support
Programme Management Unit
International Technical Assistance
XXXX
XXXX
XXXX
XXXX
XXXX
XXXX
XXXX
X X X
XXXX
X X X
XXXX
X X
XXXX
X X
XXXX
X X
XXXX
X X
XXXX
X X

39
9. Conclusion


41
Annex A. Matrix of Technical Solutions
Sub-Programme Present Actors Proposed Activity Actors1. Data Collection and Analysis: Supply,
Demand, pricesNBS, MEMD • Publication of available results
• Data integration• Specific studies
NBS, UBOSNBS, MEMDMEMD, MUK
2. Charcoal• Production SEUHI, Forestry Dept. • Awareness Campaigns
• Disseminate improved Technology• Train Entrepreneurs/Artisans• Promote Technology
Media, NGOPrivateNGOMAAIF, NGO
• Charcoal Stoves IGAD, NGO,Entrepreneurs
• Awareness Campaigns• Quality Control and standards• Promote Technology• Train Artisans/Entrepreneurs
Media, NGOMUKNGO, MAAIFNGO
3. Wood Stoves• Households
SEUHI, NGOLocal Authorities
• Awareness Campaigns• Training of Trainers• Promote Technology
Media, NGONgoNGO, MAAIF
• Institutions (schools, prisons…) NGO • Awareness Campaigns in institutions• Promote Technology• Quality Control/Standards
NGO, mediaMoES, NGOMUK
4. Kilns (lime, bricks, tobacco curing, fishsmoking, backeries,…)
SEUHI, Church, BAT • Dissemination of information• Development and adaptation of
technologies
MEMD, NGO, Forestry Dpt, MAAIFMUK, private
5. Substitution- LPG- Kerosene- Electricity- Biogas- Solar (SWH, cookers, SHS, driers)- Others (gasifiers, briquetting, pyrolisis)
Oil companiesOil companiesUEDCNGO, MEMDMEMD, private, UREAprivate
• Dissemination of information• Development and adaptation of
technologies• Promotion
Oil companies, UEDCMUK
Private, NGO
6. Co-ordination - • Monitoring and Evaluation MEMD (demand side)Forestry Dept. (supply side)

42
Annex B. NBEDS - Stakeholders
1. The Ministry of Energy and Mineral Development2. The Ministry of Water, Land and Environment3. Ministry of Agriculture, Animal Industries and Fisheries4. Ministry of Trade, Tourism and Industry5. Ministry of Local Government6. Ministry of Education and Sport7. Ministry of Finance, Planning and Economic Development8. The National Forestry Authority9. The National Biomass Study10. Forestry Resources Research Institute (FORRI)11. The Uganda Manufacturers Association12. The National Environment Management Authority13. The Association of Environmental Journalists14. The Private Enterprise Support Training and Organisational Development Project
(PRESTO)15. The Uganda Coffee Farmers Association16. The Uganda Traders Federation17. The Uganda National Bureau of Standards18. The Private Sector Foundation19. The Uganda National Farmers Association20. The Business Uganda Development Scheme21. The Federation of Uganda Consultants22. The Uganda Electricity Board23. NGOs that are involved in Energy matters e.g. ECA, JEEP, UREA, IRDI, etc.24. Makerere University25. Nyabyeya Forestry College26. Agricultural Research and Development Centres (ARDC)27. Agricultural Development Centres (ADC)28. Ministry of Education29. Youth Organisations30. The media (press, radio, TV)31. Sugar Industries32. Tea Industries33. Tobacco Industries34. Oil companies

43
Annex C: List of Abbreviations
ADC Agricultural Development CentresARDC Agricultural Research and Development CentresBAT British American TobaccoBET Biomass Energy TechnologiesDFID Department for International DevelopmentDVS Dry Volatile SolidsEA Exploration AreasEAC East African CommunityECA Biomass Conserve AssociationEE Energy EfficiencyERA Electricity Regulatory AuthorityERD Energy Resources DepartmentERT Energy for Rural TransformationESCO Energy Service CompanyESD Energy for Sustainable DevelopmentGDP Gross Development ProductGHG Greenhouse GasesGOU Government of UgandaGSMD Geological Survey and Mines DepartmentHV High VoltageIAEA International Atomic Energy AgencyIGAD Inter Governmental Agency for DevelopmentIPP Independent Power ProducerIRDI Integrated Rural Development InitiativesJEEP Joint Energy and Environment ProjectKAR Knowledge and ResearchKCJ Kenya Ceramic JikoLPG Liquefied Petroleum GasMEMD Ministry of Energy and Mineral DevelopmentMFPED Ministry of Finance, Planning and Economic DevelopmentMoES Ministry of Education and SportMoLG Ministry of Local GovernmentMTEF Medium Term Expenditure FrameworkMWLE Ministry of Water, Land and EnvironmentMio t Million of tonsNAADS National Agricultural Advisory ServicesNARO National Agricultural Research OrganisationNBEDS National Biomass Energy Demand StrategyNEAP National Environment Action PlanNEMA National Environment Management AuthorityNGO Non Governmental OrganisationNRSE New and Renewable Sources of EnergyOF Owen FallsOFE Owen Falls Extension

44
PEAP Poverty Eradication Action PlanPEPD Petroleum Exploration and Production DepartmentPMA Plan for Modernisation of AgriculturePPA Power Purchase AgreementPSA Production Sharing AgreementPV PhotovoltaicR&D Research and DevelopmentRE Renewable EnergyREDC Renewable Energy Development CentreRET Renewable Energy TechnologiesRHTC Rwenzori Highlands Tea Company (RHTC)SEUHI Sustainable Energy Use in Households and IndustrySHS Solar Home SystemsSWH Solar Water HeaterSWOT Strengths Weaknesses Opportunities ThreatsToe Ton of Oil EquivalentUEB Uganda Electricity BoardUMA Uganda Manufacturers AssociationUPE Uganda Primary EducationUREA Uganda Renewable Energy AssociationURU Utility Reform UnitUShs Uganda Shilling (1 US$ = 1,800 UShs in March 2001)