the human population 8. © 2012 john wiley & sons, inc. all rights reserved. overview of chapter...
TRANSCRIPT

The Human Population8

© 2012 John Wiley & Sons, Inc. All rights reserved.
Overview of Chapter 8
The Science of Demography Demographics of Countries
Demographic Stages Age Structure
Population and Quality of Life Reducing the Total Fertility Rate Government Policies and Fertility

© 2012 John Wiley & Sons, Inc. All rights reserved.
The Science of Demography
Demography Science of population structure and growth
Human Population since 1980 is J-shaped curve

© 2012 John Wiley & Sons, Inc. All rights reserved.
Human Population Growth
Human population reached: 1 billion around 1800 2 billion in 1930 3 billion in 1960 4 billion in 1975 5 billion in 1987 6 billion in 1999 7 billion in 2011

© 2012 John Wiley & Sons, Inc. All rights reserved.
Human Population Growth
Population is increasing due to decrease in death rate, not increase in birth rate Greater food production Better medical care Improvements in water quality and sanitation
Growth rate (r) has started to decline Will continue to decline until “zero population
growth” S-curve may replace J-curve

© 2012 John Wiley & Sons, Inc. All rights reserved.
Carrying Capacity
Carrying Capacity (K) The maximum number of individuals of a given
species that a particular environment can support for an indefinite period, assuming no changes in the environment (Ch 5)
Both environmental constraints and human values have an impact on K
Uncertain what the carrying capacity of the earth is for humans

© 2012 John Wiley & Sons, Inc. All rights reserved.
Current and Future Population Numbers
Projections for 2050 Low = 7.96 billion High = 10.46 billion Most likely = 9.15
billion

© 2012 John Wiley & Sons, Inc. All rights reserved.
Demographics of Countries

© 2012 John Wiley & Sons, Inc. All rights reserved.
Population Growth in Developing v Developed Nations
Population growth and population characteristics are not the same in all countries
© 2012 John Wiley & Sons, Inc. All rights reserved.
Replacement Level Fertility
Number of children a couple must have to “replace themselves” 2.1 children
Total fertility rate worldwide is 2.5 children More than
replacement level fertility

© 2012 John Wiley & Sons, Inc. All rights reserved.
Demographic Stages
Pre-industrial Stage Birth and death rates high, modest population
growth Transitional Stage
Lowered death rate, rapid population growth Industrial Stage
Birth rate decline, population growth slow Post Industrial Stage
Low birth and death rates, population growth very slow

© 2012 John Wiley & Sons, Inc. All rights reserved.
Demographic Stages

© 2012 John Wiley & Sons, Inc. All rights reserved.
Fertility Changes in Developing Countries
© 2012 John Wiley & Sons, Inc. All rights reserved.
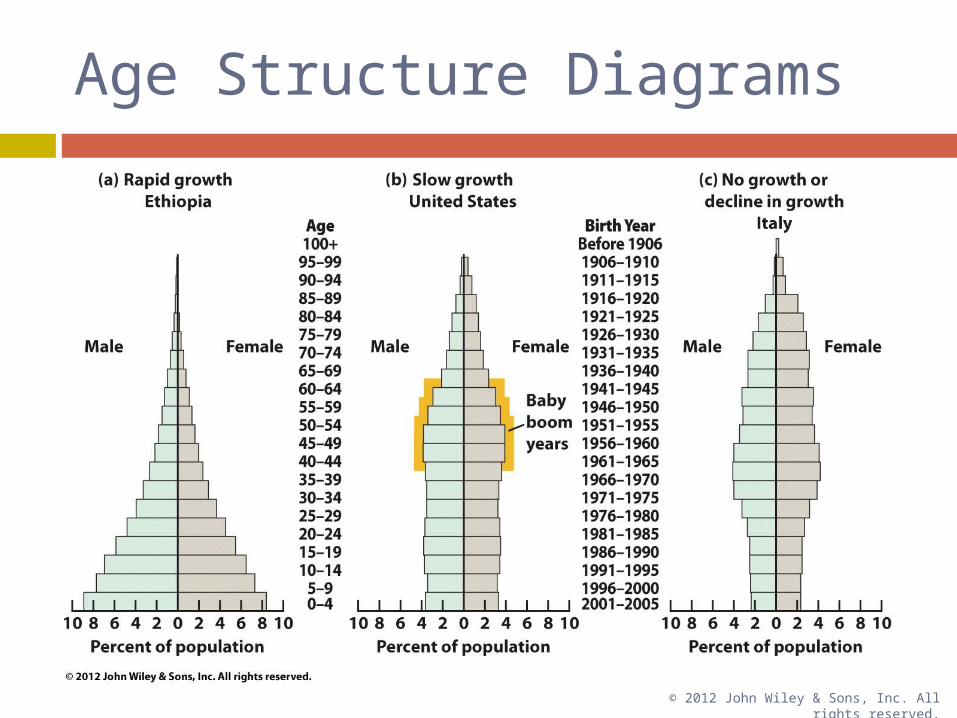
Age Structure Diagrams

© 2012 John Wiley & Sons, Inc. All rights reserved.
Age Structure
Population Growth Momentum Potential for future
increases or decreases in a population based on current age structure
Increase seen when largest population is in pre-reproductive age group (27% of world population)

© 2012 John Wiley & Sons, Inc. All rights reserved.
Age Structure
Low fertility rate usually leads to larger elderly population Most are retired - not a
part of workforce Increase on country’s
tax burden High percentage of
disabled or chronically ill

© 2012 John Wiley & Sons, Inc. All rights reserved.
Population and Quality of Life
Difficult to meet basic needs in developing countries
Problems associated with overpopulation: Environmental degradation Hunger Persistent poverty Economic stagnation Urban deterioration Health issues

© 2012 John Wiley & Sons, Inc. All rights reserved.
Population and Chronic Hunger
Food security Condition in which people do not live with chronic
hunger and malnutrition Effects of Chronic Hunger
Weakened immune system Illness and disease
Malaria Measles Diarrhea Acute respiratory illness

© 2012 John Wiley & Sons, Inc. All rights reserved.
Population and Chronic Hunger
Food insecurity Conditions under which people live with
continuous threat of starvation Solving the Food Problem
Control population growth Promote economic development of developing
countries without adequate food supplies Provide assess to food and land resources to
those who live in areas without them

© 2012 John Wiley & Sons, Inc. All rights reserved.
Economic Effects of Population Growth
Two viewpoints from economists: Population growth stimulates economic
development and technological innovation Rapid population expansion hampers
developmental efforts Most observations support the second
viewpoint In order for country to increase its standard of
living, its economic growth must exceed its population growth

© 2012 John Wiley & Sons, Inc. All rights reserved.
Reducing the Total Fertility Rate
Three major influences on total fertility rate
1. Cultural traditions
2. Social & economic status of women
3. Family planning

© 2012 John Wiley & Sons, Inc. All rights reserved.
Cultural and Fertility
Culture influences and controls individuals’ behaviors Marriage age Due to high infant and child
mortality rates, couple is expected to have large number of children
Children often work in family business (pictured left)
Religious values

© 2012 John Wiley & Sons, Inc. All rights reserved.
Social & Economic Status of Women
Gender inequality is common worldwide Disparities
Political participation Social status Economic status Health status Legal rights Education Employment and earnings
Single most important factor affecting high total fertility rates is low status of women
Illiteracy in 2002
© 2012 John Wiley & Sons, Inc. All rights reserved.
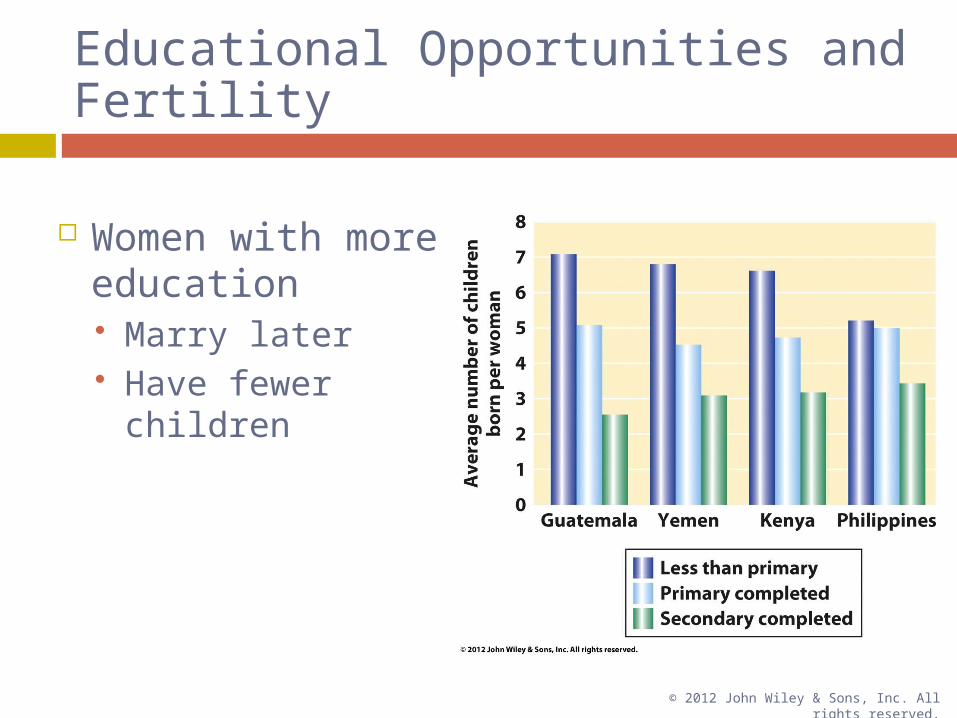
Educational Opportunities and Fertility
Women with more education Marry later Have fewer children

© 2012 John Wiley & Sons, Inc. All rights reserved.
Family Planning Services
Family planning services offer information to both men and women on sexuality, contraception, STDs, and parenting

© 2012 John Wiley & Sons, Inc. All rights reserved.
Largest population in the world Controversial Family Planning Policy
1971 - Chinese Government actively pursued birth control
1979 - Incentives to promote later marriages and one-child families Medical care, schooling for child, preferential housing,
retirement funds Brought about rapid and drastic decrease in
fertility
Government Policy and Fertility- China

© 2012 John Wiley & Sons, Inc. All rights reserved.
1979- plan put in place with incentives to promote later marriages and one-child families Incentives were medical care, schooling for child,
cash bonuses, preferential housing, retirement funds
If second child was born, all incentives must be revoked or returned
Decrease in fertility from 5.8 births per woman to 2.1 birth per woman in 1981
Government Policy and Fertility- China

© 2012 John Wiley & Sons, Inc. All rights reserved.
Government Policy and Fertility- China
Plan was controversial and unpopular Social pressure to abort a second child Pressure to abort/kill female first child
120 boys to 100 girls as of 2000 Plan much more
relaxed in rural China
2011 TFR = 1.5

© 2012 John Wiley & Sons, Inc. All rights reserved.
Government Policy and Fertility- Mexico
Young age structure Huge potential for population growth: 29% of
population is under age 15 High Population Growth Momentum
1974 - government imparted educational reform, family planning, health care Very successful TFR dropped from 6.7 (1970) to 2.3 (2011)

© 2012 John Wiley & Sons, Inc. All rights reserved.
Achieving Population Stabilization
How can developing country governments help? Increase $$ allotted to pubic health and family
planning services Education on methods of birth control Increase average level of education
How can developed country governments help? Provide financial support Supporting research and development of new
birth control methods